
  |
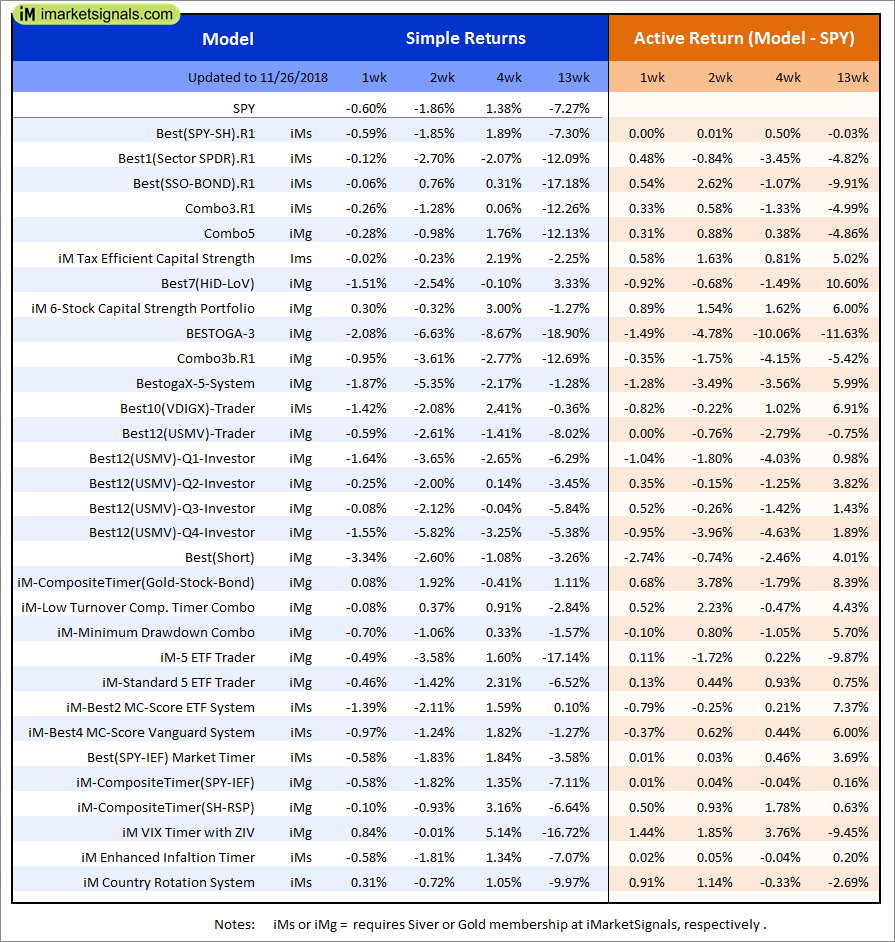
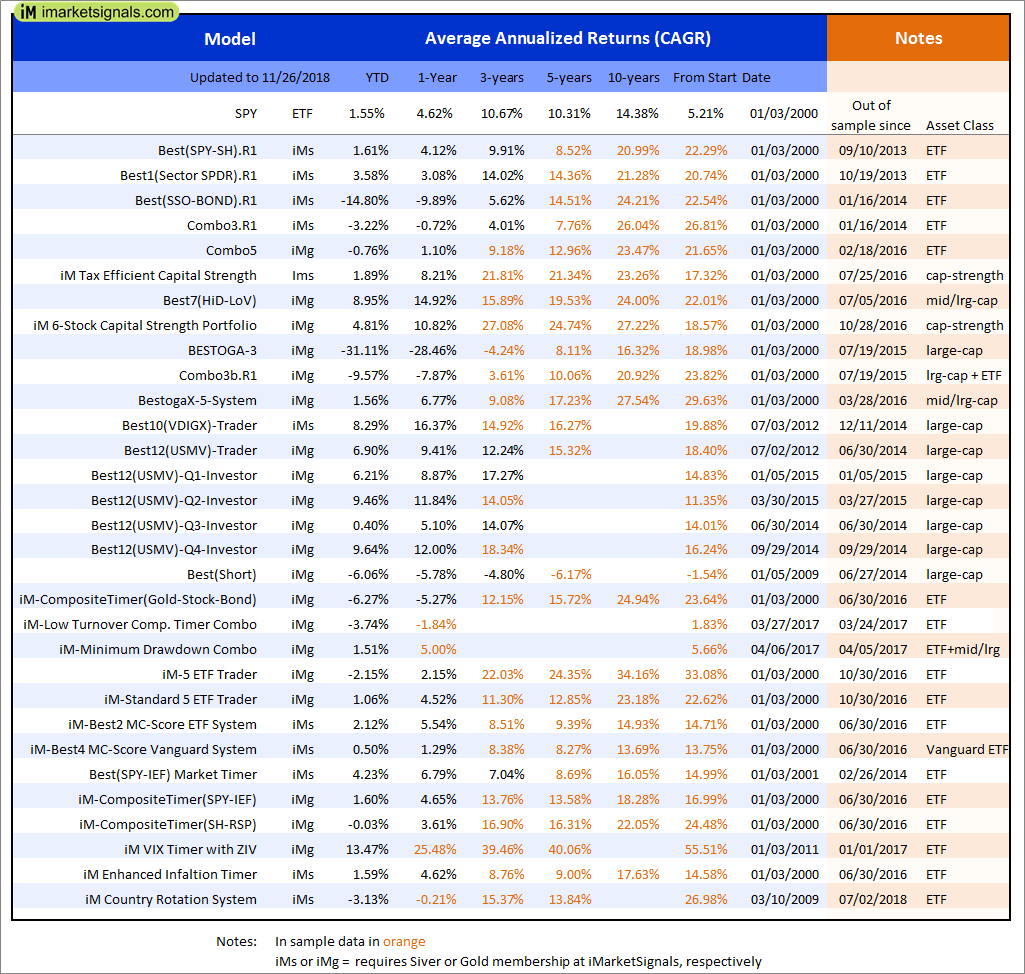
Out of sample performance summary of our models for the past 1, 2, 4 and 13 week periods. The active active return indicates how the models over- or underperformed the benchmark ETF SPY. Also the YTD, and the 1-, 3-, 5- and 10-year annualized returns are shown in the second table |
 |
iM-Best(SPY-SH).R1: The model’s out of sample performance YTD is 1.1%, and for the last 12 months is 4.1%. Over the same period the benchmark SPY performance was 1.5% and 4.6% respectively. Over the previous week the market value of Best(SPY-SH) gained -0.59% at a time when SPY gained -0.59%. A starting capital of $100,000 at inception on 1/2/2009 would have grown to $571,370 which includes -$10 cash and excludes $17,702 spent on fees and slippage. |
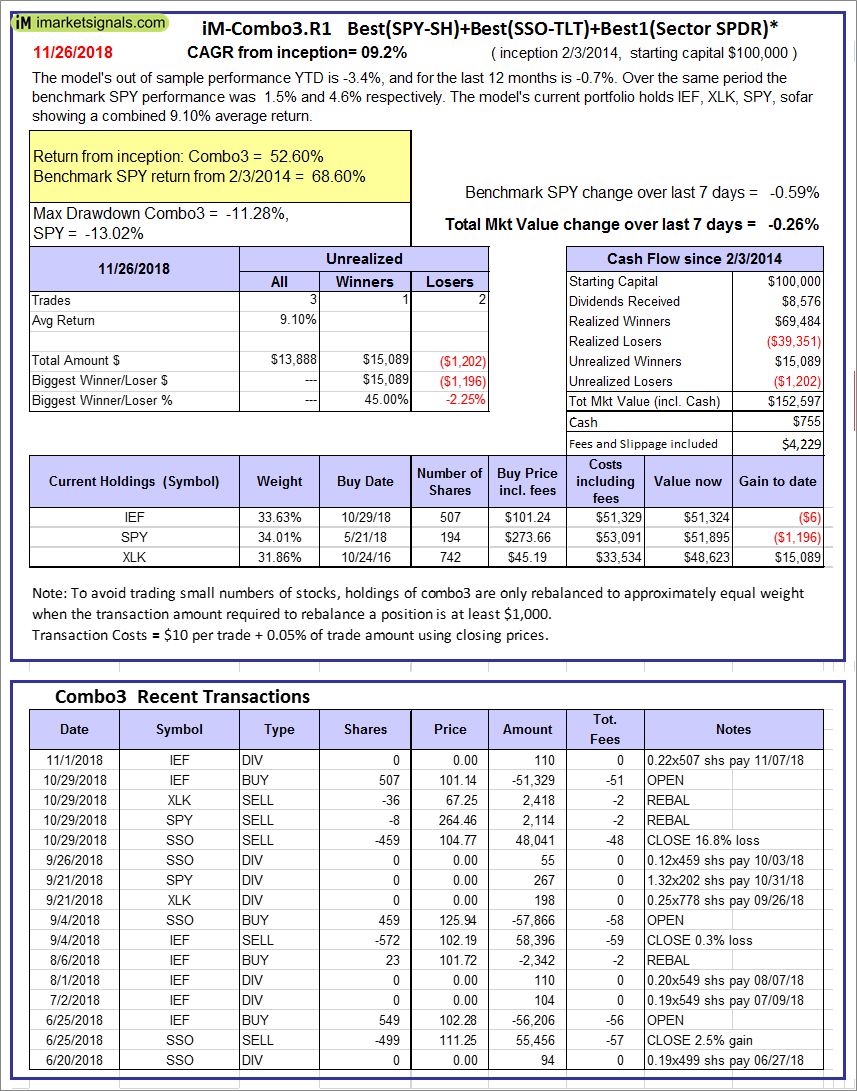 |
iM-Combo3.R1: The model’s out of sample performance YTD is -3.4%, and for the last 12 months is -0.7%. Over the same period the benchmark SPY performance was 1.5% and 4.6% respectively. Over the previous week the market value of iM-Combo3.R1 gained -0.26% at a time when SPY gained -0.59%. A starting capital of $100,000 at inception on 2/3/2014 would have grown to $152,597 which includes $755 cash and excludes $4,229 spent on fees and slippage. |
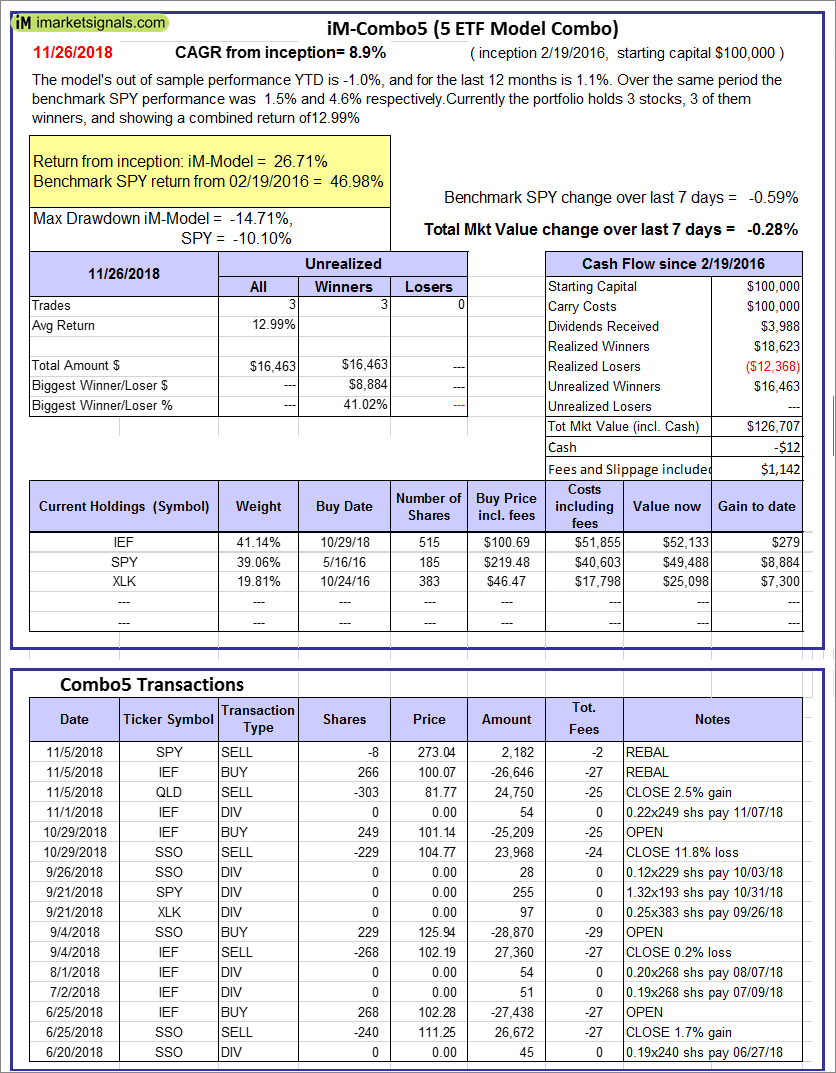 |
iM-Combo5: The model’s out of sample performance YTD is -1.0%, and for the last 12 months is 1.1%. Over the same period the benchmark SPY performance was 1.5% and 4.6% respectively. Over the previous week the market value of iM-Combo5 gained -0.28% at a time when SPY gained -0.59%. A starting capital of $100,000 at inception on 2/22/2016 would have grown to $126,707 which includes -$12 cash and excludes $1,142 spent on fees and slippage. |
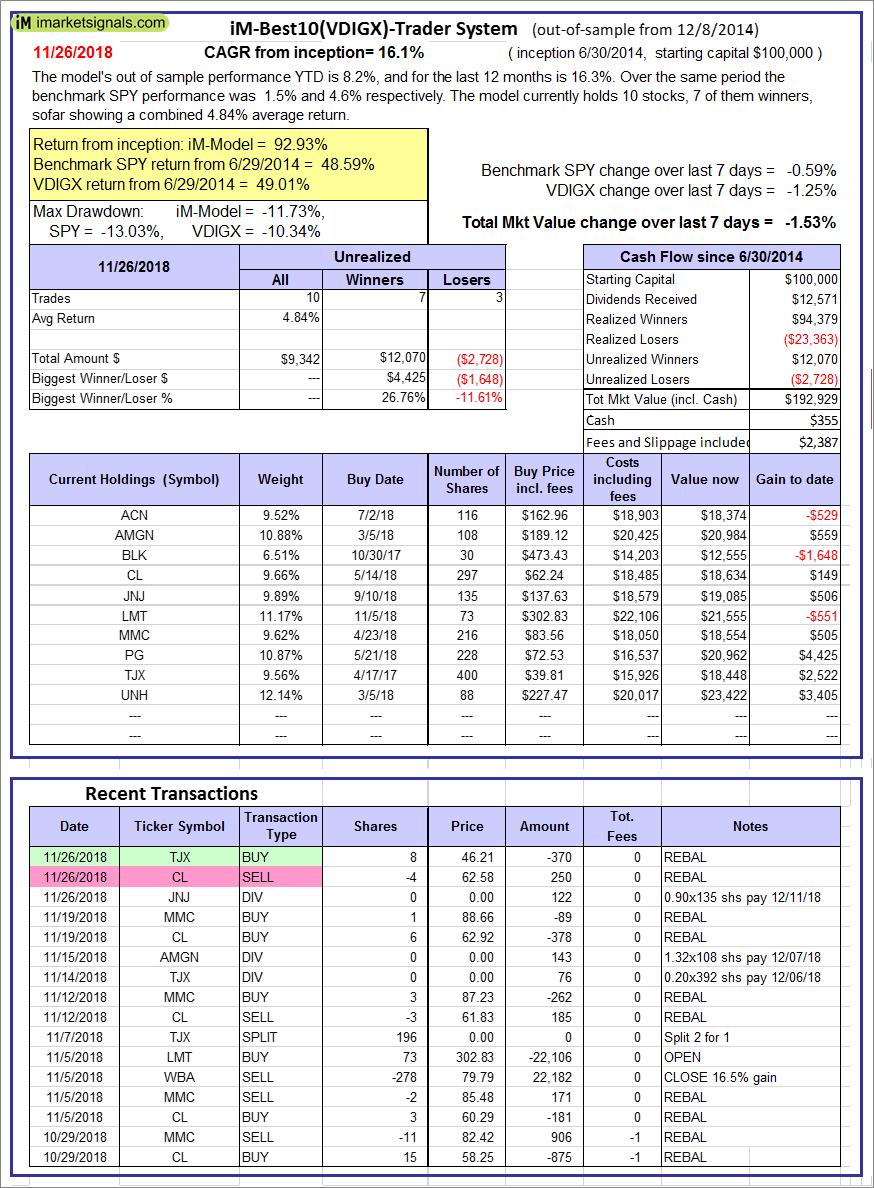  |
iM-Best10(VDIGX)-Trader: The model’s out of sample performance YTD is 8.2%, and for the last 12 months is 16.3%. Over the same period the benchmark SPY performance was 1.5% and 4.6% respectively. Since inception, on 7/1/2014, the model gained 92.93% while the benchmark SPY gained 48.59% and VDIGX gained 49.01% over the same period. Over the previous week the market value of iM-Best10(VDIGX) gained -1.53% at a time when SPY gained -0.59%. A starting capital of $100,000 at inception on 7/1/2014 would have grown to $192,929 which includes $355 cash and excludes $2,387 spent on fees and slippage. |
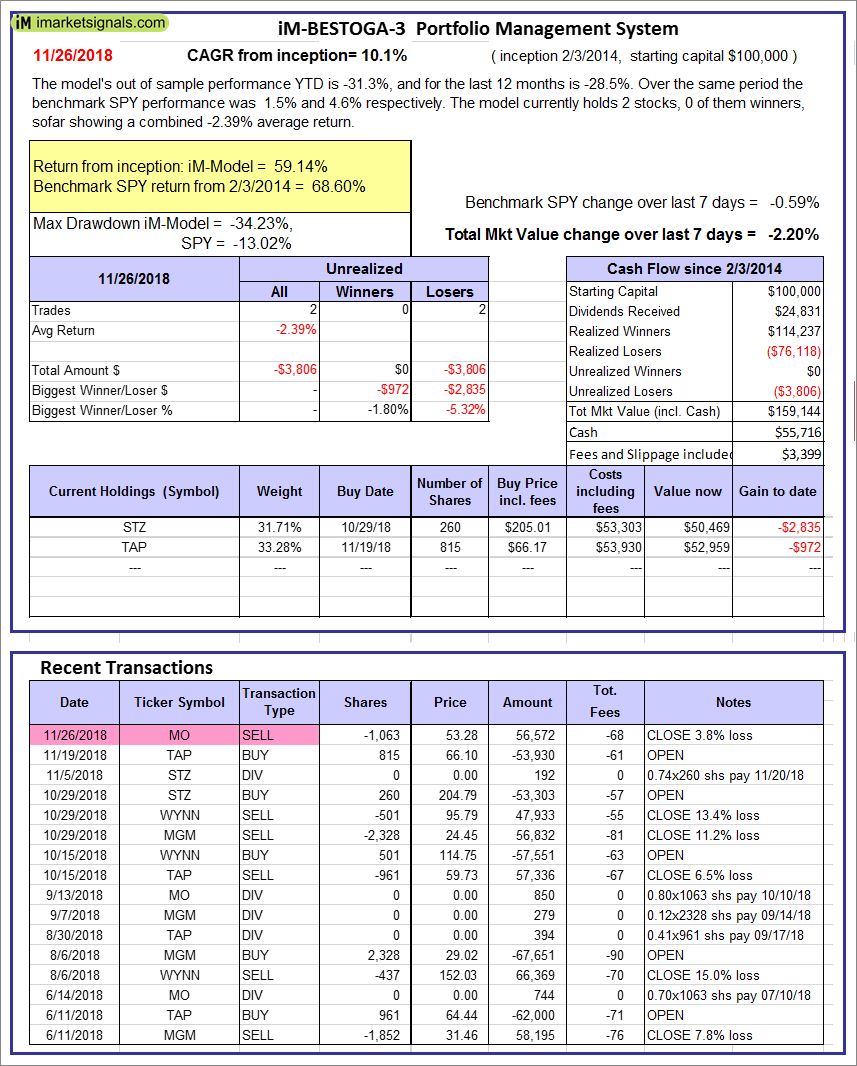 |
iM-BESTOGA-3: The model’s out of sample performance YTD is -31.3%, and for the last 12 months is -28.5%. Over the same period the benchmark SPY performance was 1.5% and 4.6% respectively. Over the previous week the market value of iM-BESTOGA-3 gained -2.20% at a time when SPY gained -0.59%. A starting capital of $100,000 at inception on 2/3/2014 would have grown to $159,144 which includes $55,716 cash and excludes $3,399 spent on fees and slippage. |
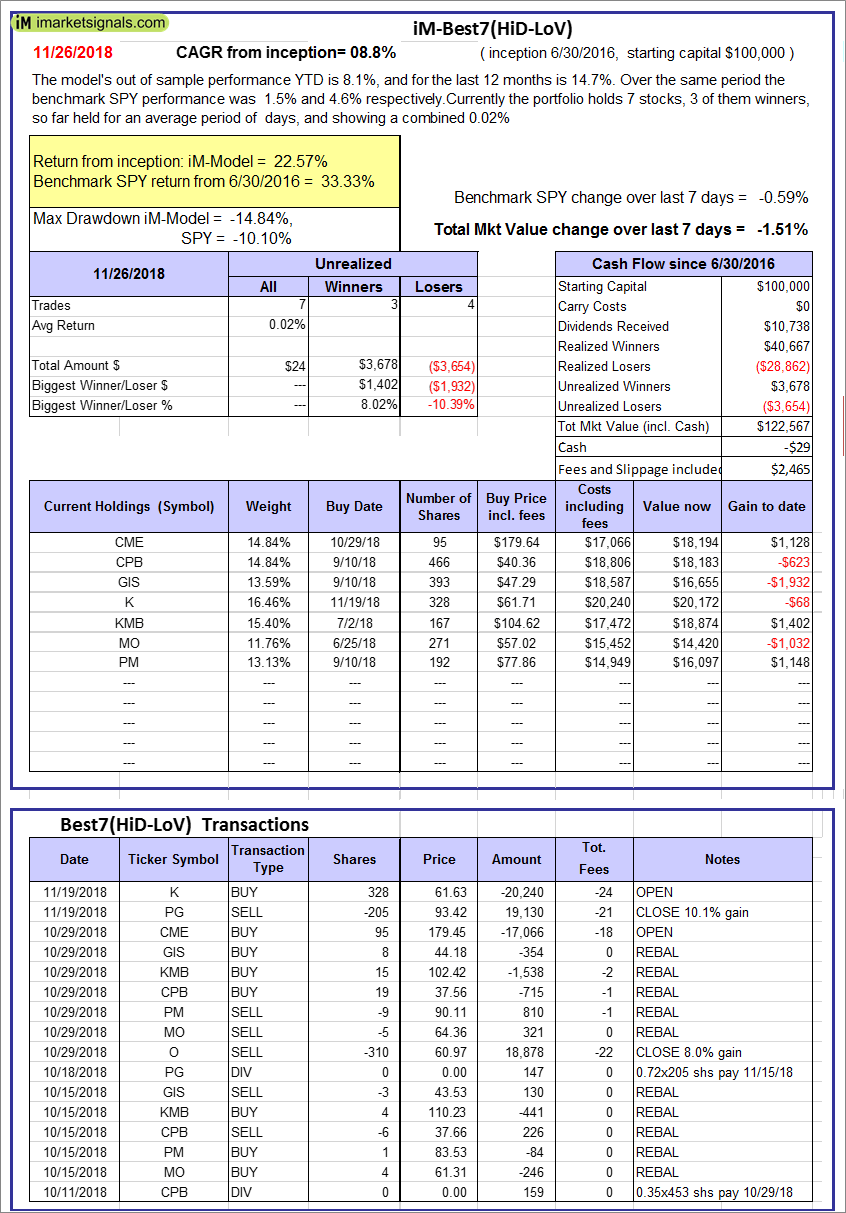 |
iM-Best7(HiD-LoV): The model’s out of sample performance YTD is 8.1%, and for the last 12 months is 14.7%. Over the same period the benchmark SPY performance was 1.5% and 4.6% respectively. Over the previous week the market value of iM-BESTOGA-3 gained -1.51% at a time when SPY gained -0.59%. A starting capital of $100,000 at inception on 6/30/2016 would have grown to $122,567 which includes -$29 cash and excludes $2,465 spent on fees and slippage. |
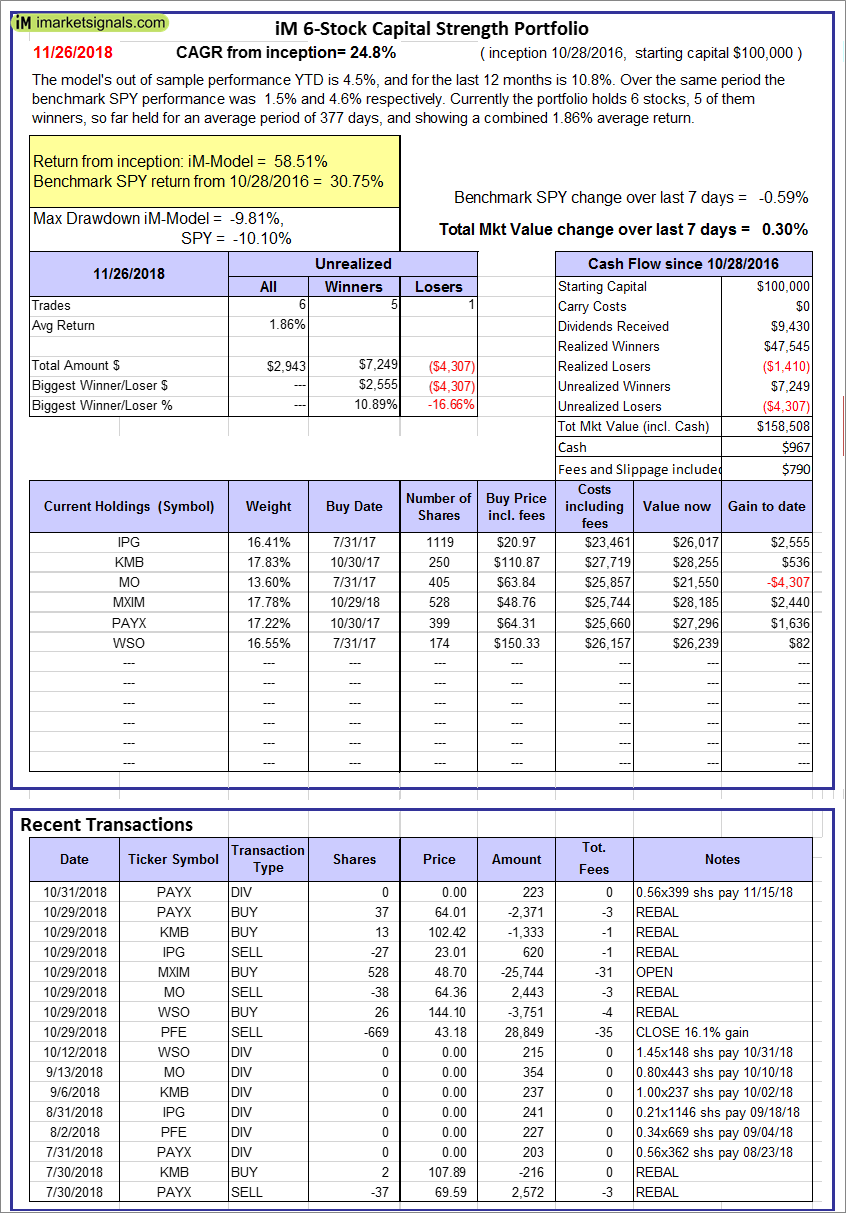 |
iM 6-Stock Capital Strength Portfolio: The model’s out of sample performance YTD is 4.5%, and for the last 12 months is 10.8%. Over the same period the benchmark SPY performance was 1.5% and 4.6% respectively. Over the previous week the market value of the iM 6-Stock Capital Strength Portfolio gained 0.30% at a time when SPY gained -0.59%. A starting capital of $100,000 at inception on 10/28/2016 would have grown to $158,508 which includes $967 cash and excludes $790 spent on fees and slippage. |
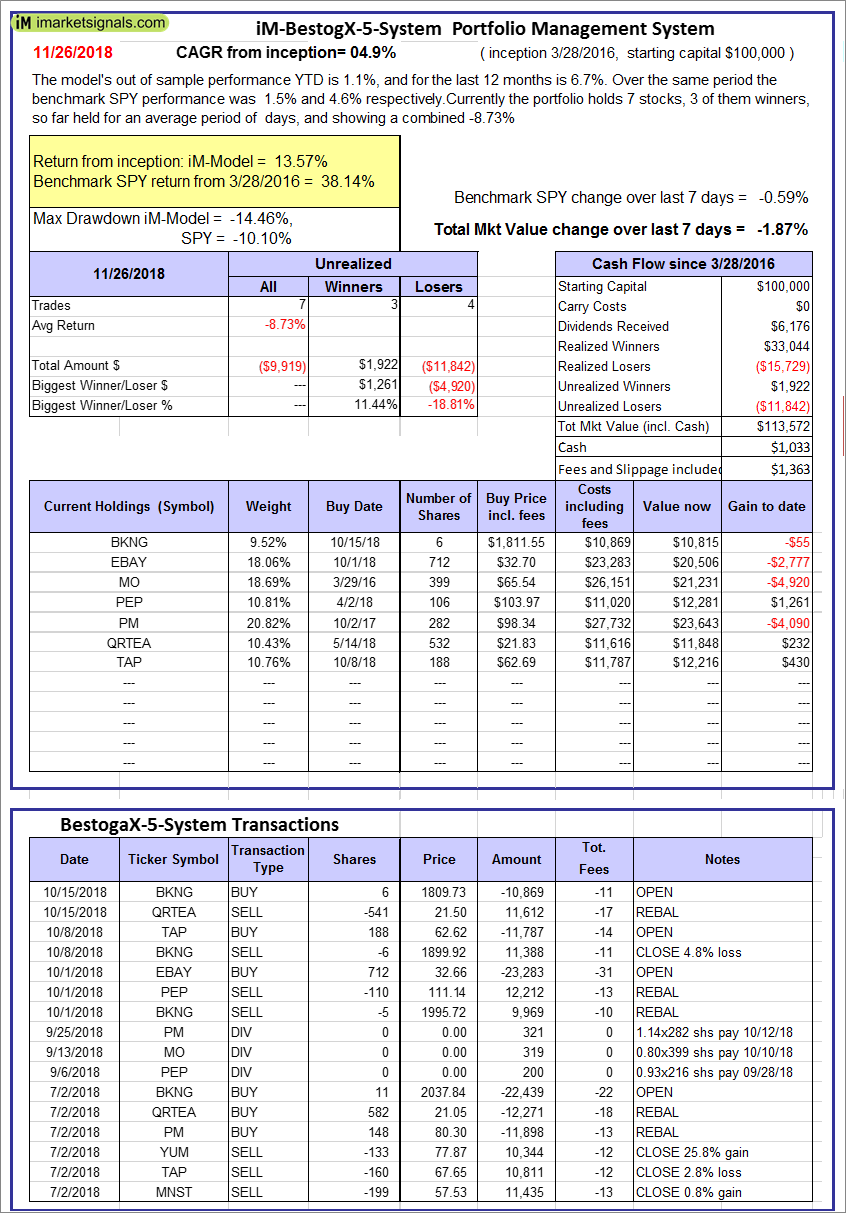 |
iM-BestogaX5-System: The model’s out of sample performance YTD is 1.1%, and for the last 12 months is 6.7%. Over the same period the benchmark SPY performance was 1.5% and 4.6% respectively. Over the previous week the market value of iM-BestogaX5-System gained -1.87% at a time when SPY gained -0.59%. A starting capital of $100,000 at inception on 3/28/2016 would have grown to $113,572 which includes $1,033 cash and excludes $1,363 spent on fees and slippage. |
 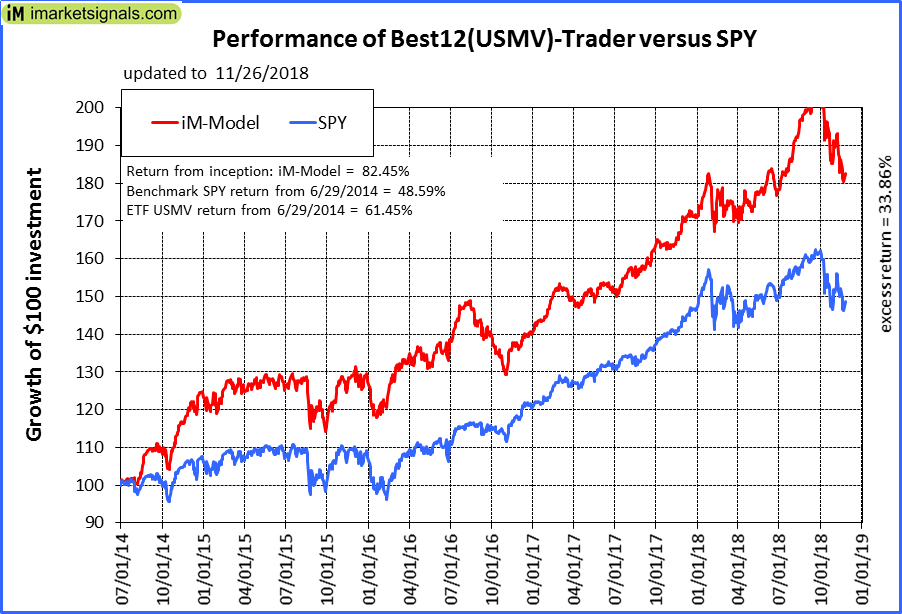 |
iM-Best12(USMV)-Trader: The model’s out of sample performance YTD is 6.7%, and for the last 12 months is 9.4%. Over the same period the benchmark SPY performance was 1.5% and 4.6% respectively. Since inception, on 6/30/2014, the model gained 82.45% while the benchmark SPY gained 48.59% and the ETF USMV gained 61.45% over the same period. Over the previous week the market value of iM-Best12(USMV)-Trader gained -0.62% at a time when SPY gained -0.59%. A starting capital of $100,000 at inception on 6/30/2014 would have grown to $182,453 which includes $405 cash and excludes $4,768 spent on fees and slippage. |
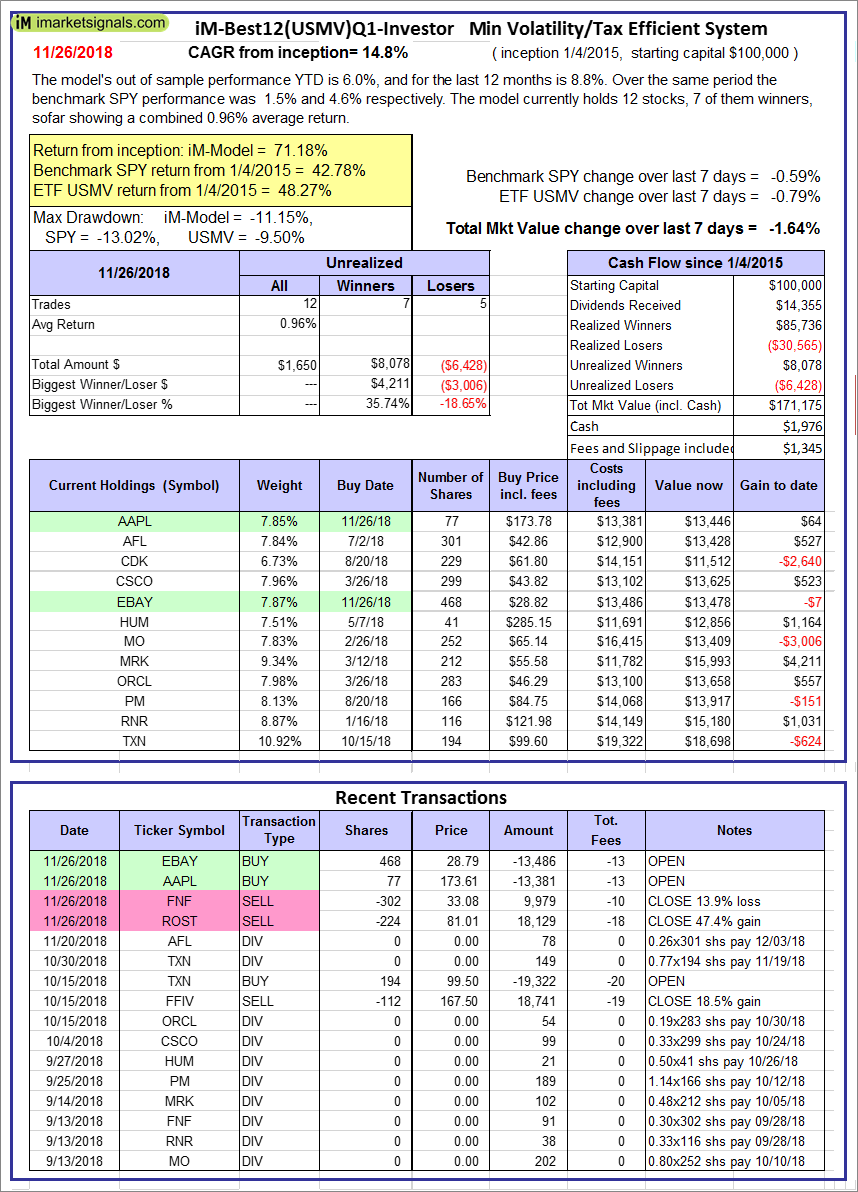  |
iM-Best12(USMV)Q1-Investor: The model’s out of sample performance YTD is 6.0%, and for the last 12 months is 8.8%. Over the same period the benchmark SPY performance was 1.5% and 4.6% respectively. Since inception, on 1/5/2015, the model gained 71.18% while the benchmark SPY gained 42.78% and the ETF USMV gained 48.27% over the same period. Over the previous week the market value of iM-Best12(USMV)Q1 gained -1.64% at a time when SPY gained -0.59%. A starting capital of $100,000 at inception on 1/5/2015 would have grown to $171,175 which includes $1,976 cash and excludes $1,345 spent on fees and slippage. |
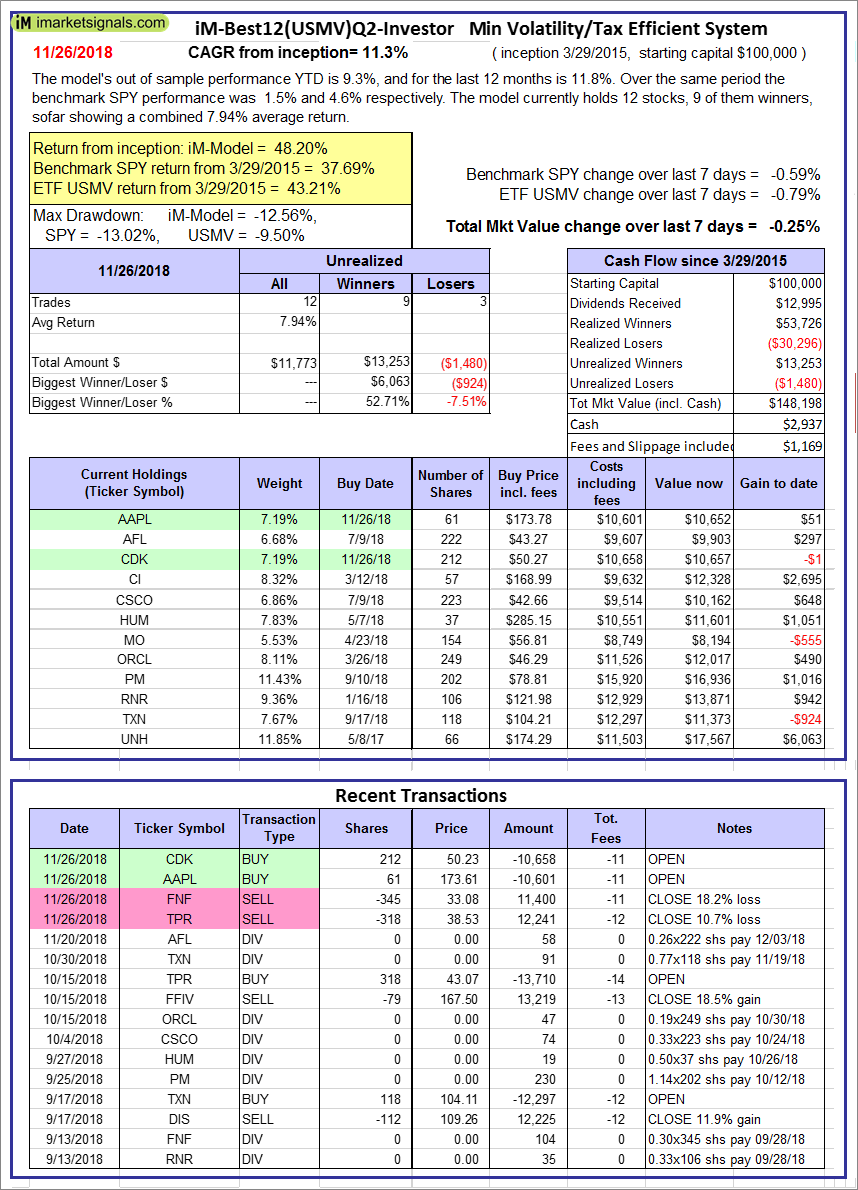 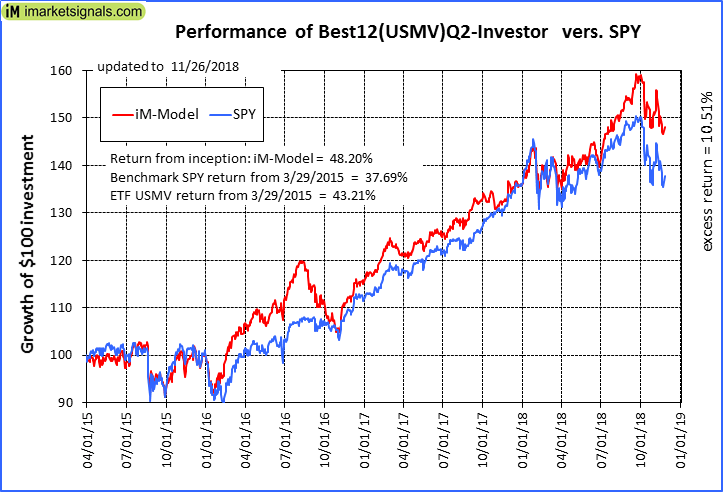 |
iM-Best12(USMV)Q2-Investor: The model’s out of sample performance YTD is 9.3%, and for the last 12 months is 11.8%. Over the same period the benchmark SPY performance was 1.5% and 4.6% respectively. Since inception, on 3/30/2015, the model gained 48.20% while the benchmark SPY gained 37.69% and the ETF USMV gained 43.21% over the same period. Over the previous week the market value of iM-Best12(USMV)Q2 gained -0.25% at a time when SPY gained -0.59%. A starting capital of $100,000 at inception on 3/30/2015 would have grown to $148,198 which includes $2,937 cash and excludes $1,169 spent on fees and slippage. |
 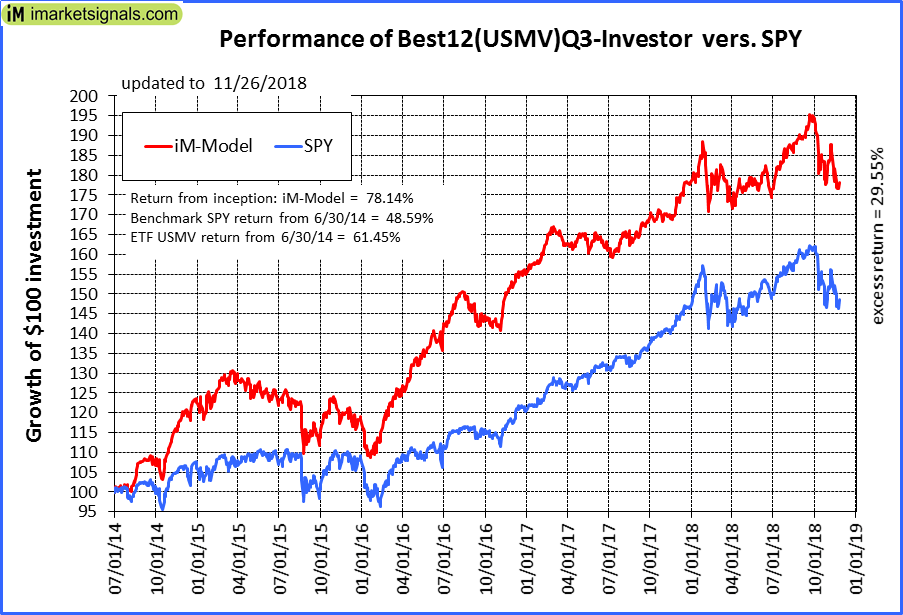 |
iM-Best12(USMV)Q3-Investor: The model’s out of sample performance YTD is 0.3%, and for the last 12 months is 4.9%. Over the same period the benchmark SPY performance was 1.5% and 4.6% respectively. Since inception, on 7/1/2014, the model gained 78.14% while the benchmark SPY gained 48.59% and the ETF USMV gained 61.45% over the same period. Over the previous week the market value of iM-Best12(USMV)Q3 gained -0.08% at a time when SPY gained -0.59%. A starting capital of $100,000 at inception on 7/1/2014 would have grown to $178,138 which includes $1,295 cash and excludes $1,707 spent on fees and slippage. |
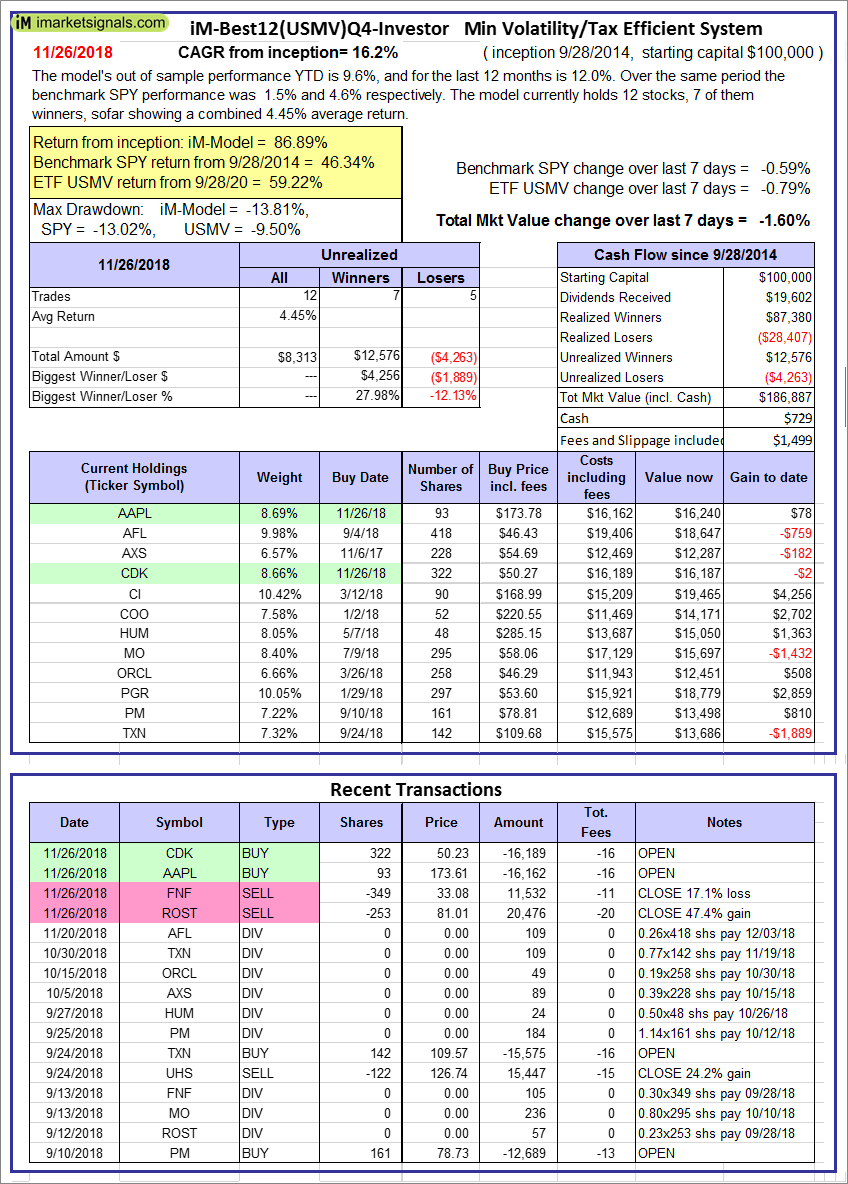 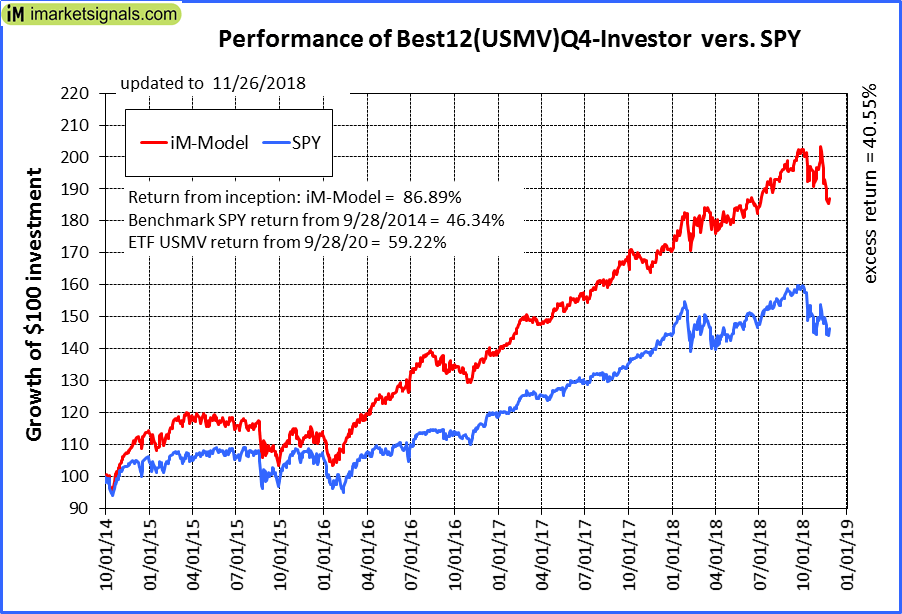 |
iM-Best12(USMV)Q4-Investor: Since inception, on 9/29/2014, the model gained 86.89% while the benchmark SPY gained 46.34% and the ETF USMV gained 59.22% over the same period. Over the previous week the market value of iM-Best12(USMV)Q4 gained -1.60% at a time when SPY gained -0.59%. A starting capital of $100,000 at inception on 9/29/2014 would have grown to $186,887 which includes $729 cash and excludes $1,499 spent on fees and slippage. |
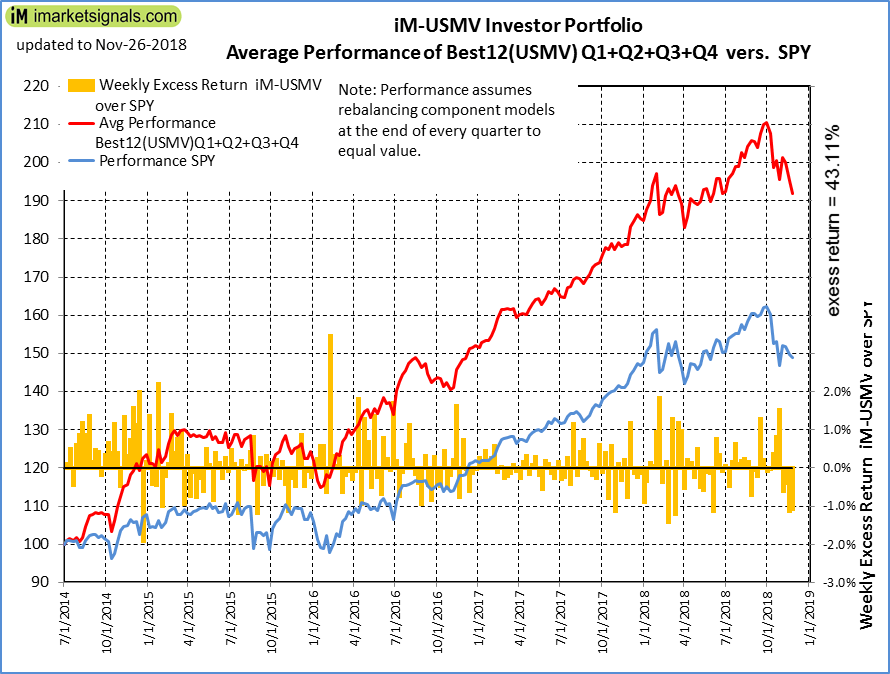 |
Average Performance of iM-Best12(USMV)Q1+Q2+Q3+Q4-Investor resulted in an excess return of 43.11% over SPY. (see iM-USMV Investor Portfolio) |
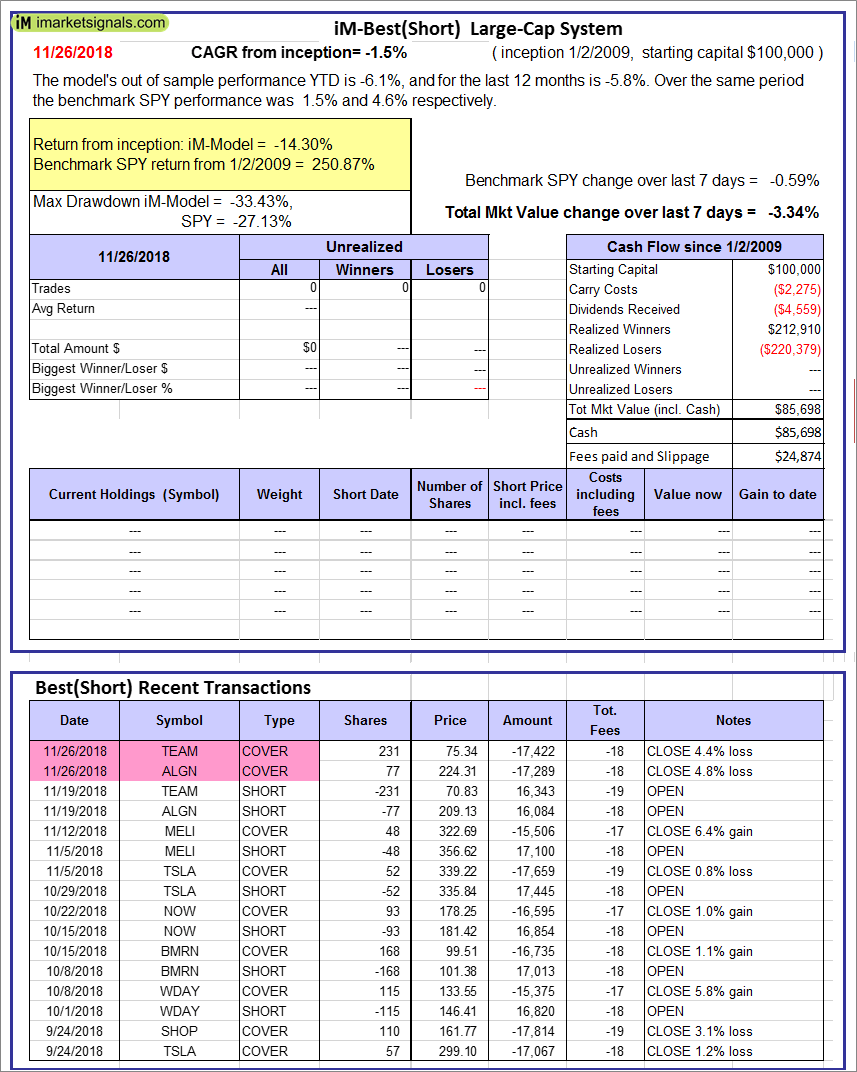 |
iM-Best(Short): The model’s out of sample performance YTD is -6.1%, and for the last 12 months is -5.8%. Over the same period the benchmark SPY performance was 1.5% and 4.6% respectively. Over the previous week the market value of iM-Best(Short) gained -3.34% at a time when SPY gained -0.59%. Over the period 1/2/2009 to 11/26/2018 the starting capital of $100,000 would have grown to $85,698 which includes $85,698 cash and excludes $24,874 spent on fees and slippage. |
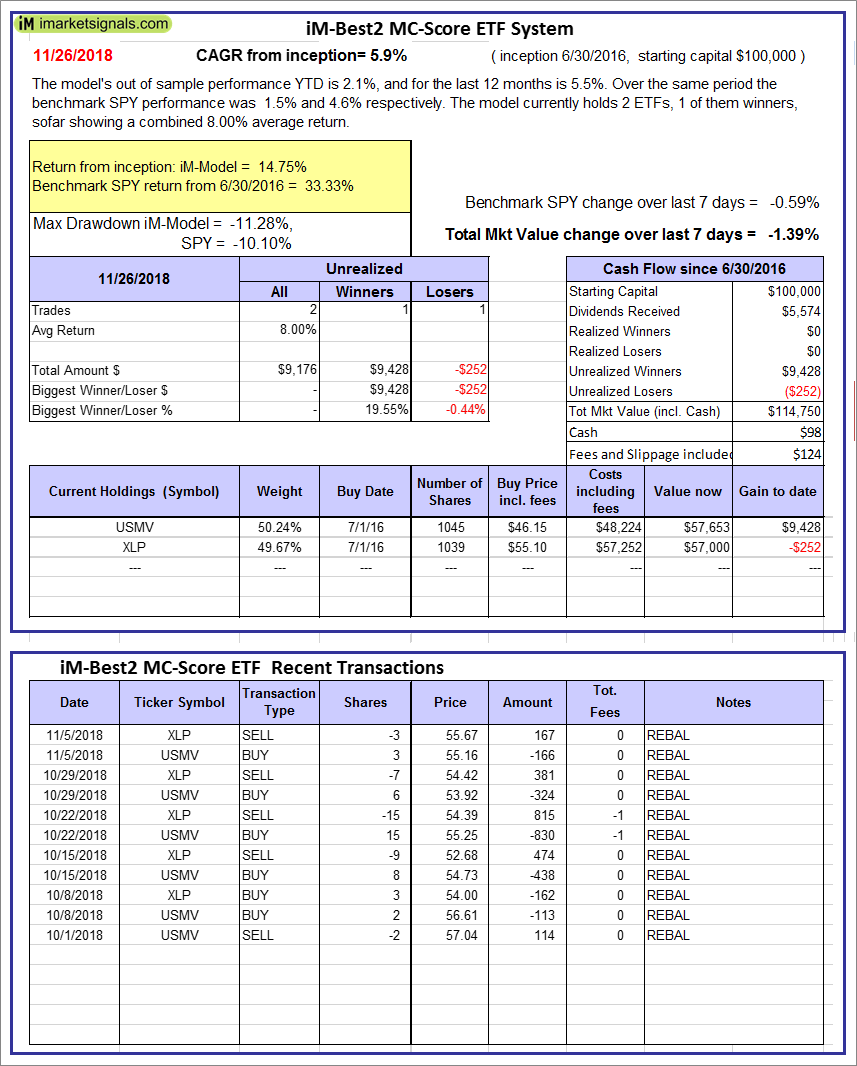 |
iM-Best2 MC-Score ETF System: The model’s out of sample performance YTD is 2.1%, and for the last 12 months is 5.5%. Over the same period the benchmark SPY performance was 1.5% and 4.6% respectively. Over the previous week the market value of the iM-Best2 MC-Score ETF System gained -1.39% at a time when SPY gained -0.59%. A starting capital of $100,000 at inception on 6/30/2016 would have grown to $114,750 which includes $98 cash and excludes $124 spent on fees and slippage. |
 |
iM-Best4 MC-Score Vanguard System: The model’s out of sample performance YTD is 0.5%, and for the last 12 months is 1.3%. Over the same period the benchmark SPY performance was 1.5% and 4.6% respectively. Over the previous week the market value of the iM-Best4 MC-Score Vanguard System gained -0.97% at a time when SPY gained -0.59%. A starting capital of $100,000 at inception on 6/30/2016 would have grown to $111,402 which includes $5,697 cash and excludes $00 spent on fees and slippage. |
 |
iM-Composite (SH-RSP) Timer: The model’s out of sample performance YTD is 0.0%, and for the last 12 months is 3.5%. Over the same period the benchmark SPY performance was 1.5% and 4.6% respectively. Over the previous week the market value of the iM-Composite (SH-RSP) Timer gained -0.10% at a time when SPY gained -0.59%. A starting capital of $100,000 at inception on 6/30/2016 would have grown to $129,933 which includes $3,838 cash and excludes $513 spent on fees and slippage. |
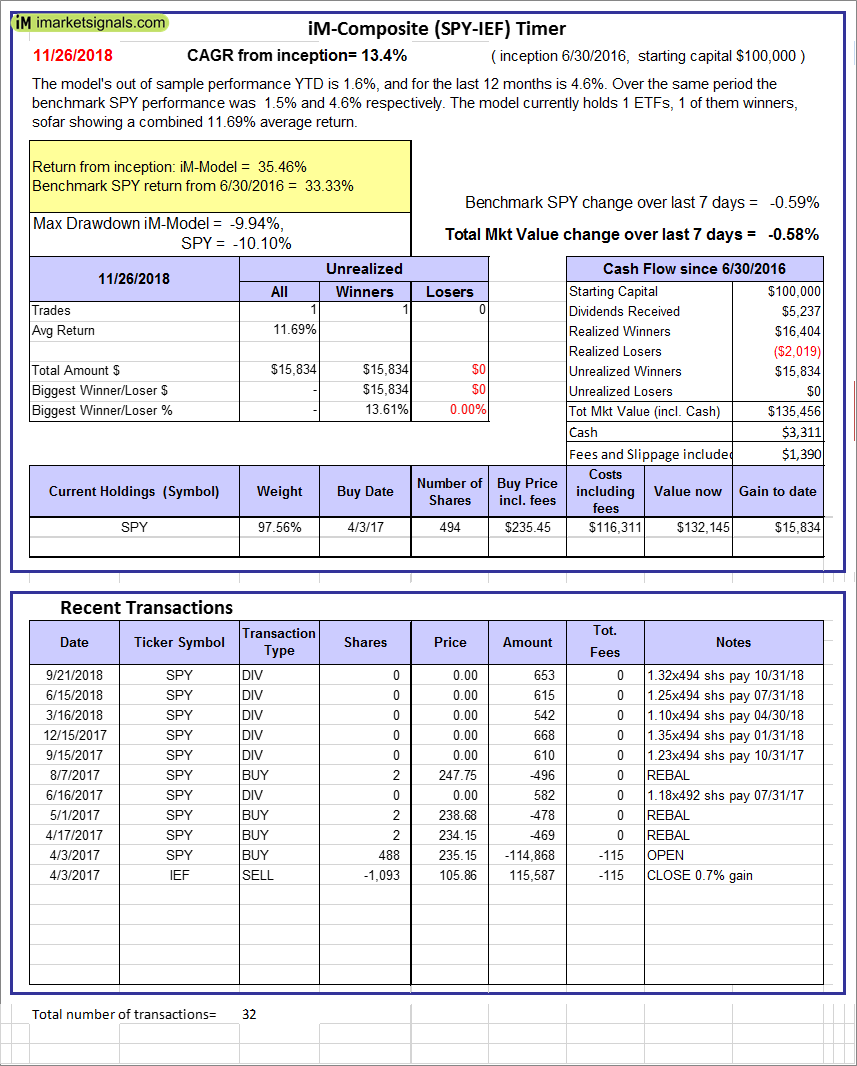 |
iM-Composite (SPY-IEF) Timer: The model’s out of sample performance YTD is 1.6%, and for the last 12 months is 4.6%. Over the same period the benchmark SPY performance was 1.5% and 4.6% respectively. Over the previous week the market value of the iM-Composite (SPY-IEF) Timer gained -0.58% at a time when SPY gained -0.59%. A starting capital of $100,000 at inception on 6/30/2016 would have grown to $135,456 which includes $3,311 cash and excludes $1,390 spent on fees and slippage. |
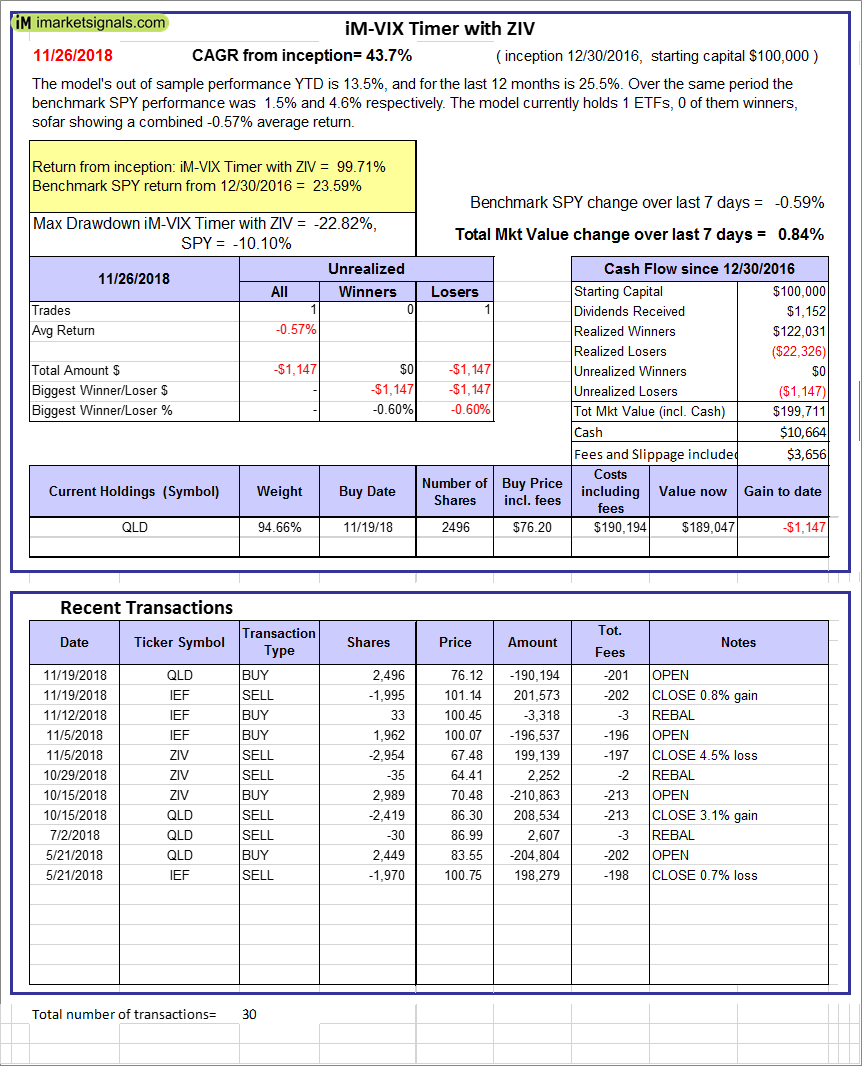 |
iM-VIX Timer with ZIV: The model’s out of sample performance YTD is 13.5%, and for the last 12 months is 25.5%. Over the same period the benchmark SPY performance was 1.5% and 4.6% respectively. Over the previous week the market value of the iM-VIX Timer with ZIV gained 0.84% at a time when SPY gained -0.59%. A starting capital of $100,000 at inception on 6/30/2016 would have grown to $199,711 which includes $10,664 cash and excludes $3,656 spent on fees and slippage. |
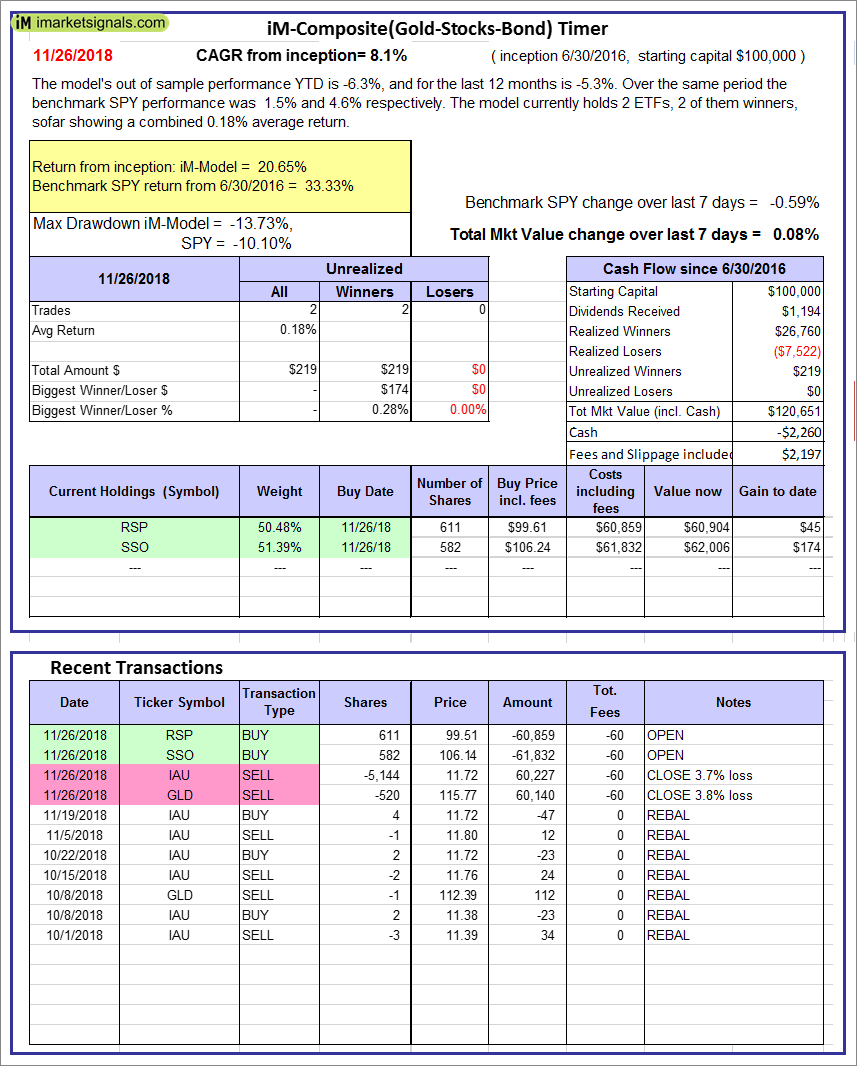 |
iM-Composite(Gold-Stocks-Bond) Timer: The model’s out of sample performance YTD is -6.3%, and for the last 12 months is -5.3%. Over the same period the benchmark SPY performance was 1.5% and 4.6% respectively. Over the previous week the market value of the iM-Composite(Gold-Stocks-Bond) Timer gained 0.08% at a time when SPY gained -0.59%. A starting capital of $100,000 at inception on 6/30/2016 would have grown to $120,651 which includes -$2,260 cash and excludes $2,197 spent on fees and slippage. |
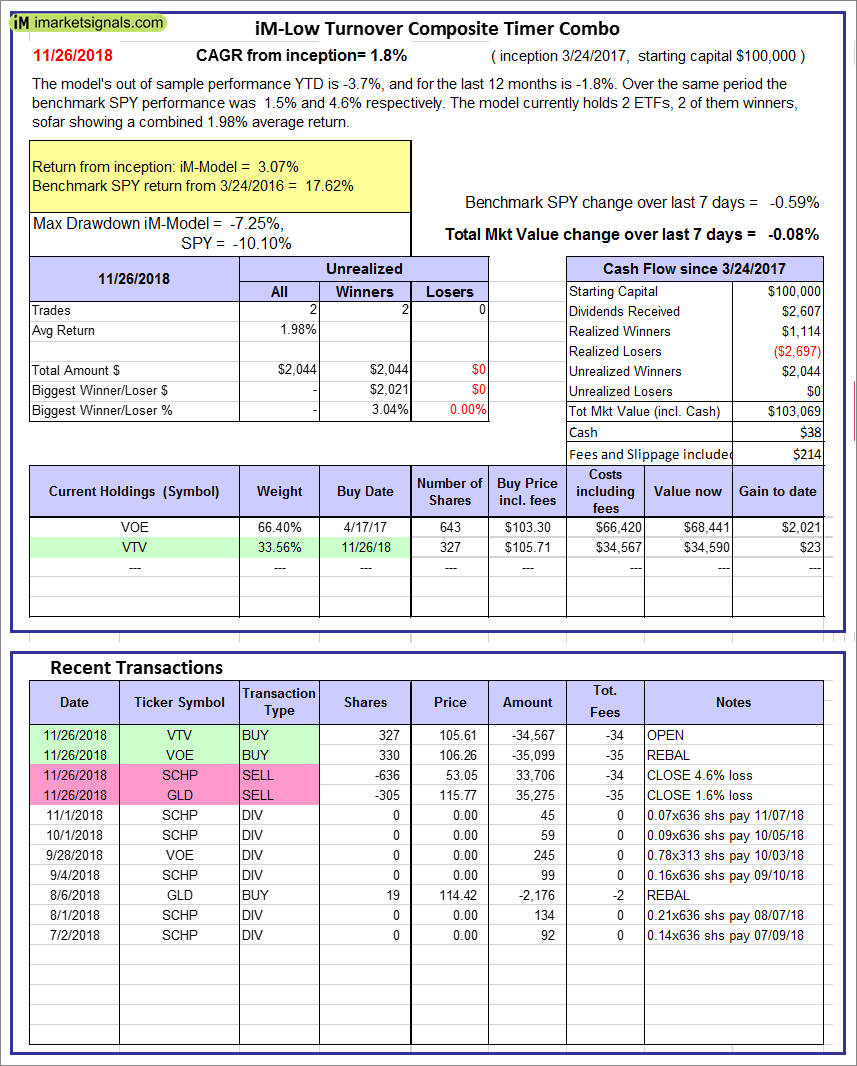 |
iM-Low Turnover Composite Timer Combo: The model’s out of sample performance YTD is -3.7%, and for the last 12 months is -1.8%. Over the same period the benchmark SPY performance was 1.5% and 4.6% respectively. Over the previous week the market value of the iM-Low Turnover Composite Timer Combo gained -0.08% at a time when SPY gained -0.59%. A starting capital of $100,000 at inception on 3/24/27 would have grown to $103,069 which includes $38 cash and excludes $214 spent on fees and slippage. |
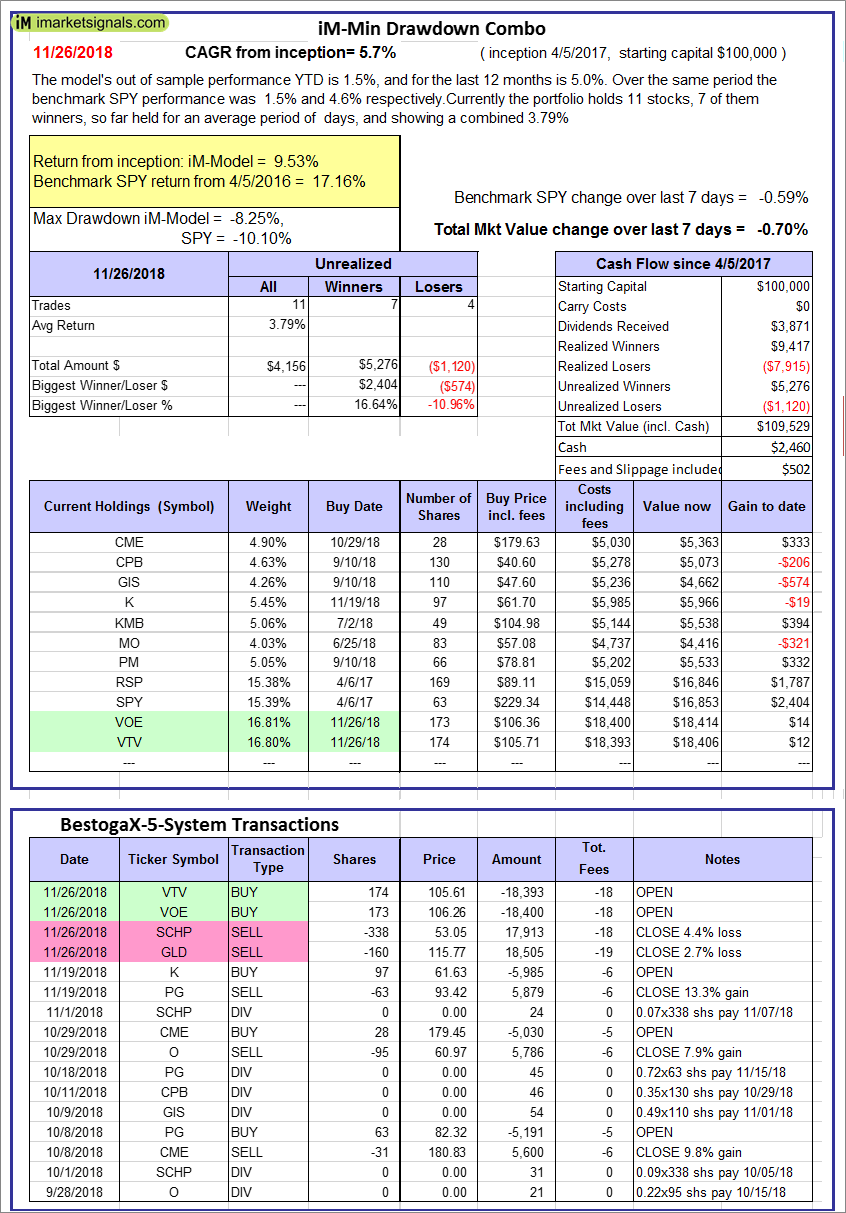 |
iM-Min Drawdown Combo: The model’s out of sample performance YTD is 1.5%, and for the last 12 months is 5.0%. Over the same period the benchmark SPY performance was 1.5% and 4.6% respectively. Over the previous week the market value of the iM-Min Drawdown Combo gained -0.70% at a time when SPY gained -0.59%. A starting capital of $100,000 at inception on 4/5/2017 would have grown to $109,529 which includes $2,460 cash and excludes $502 spent on fees and slippage. |
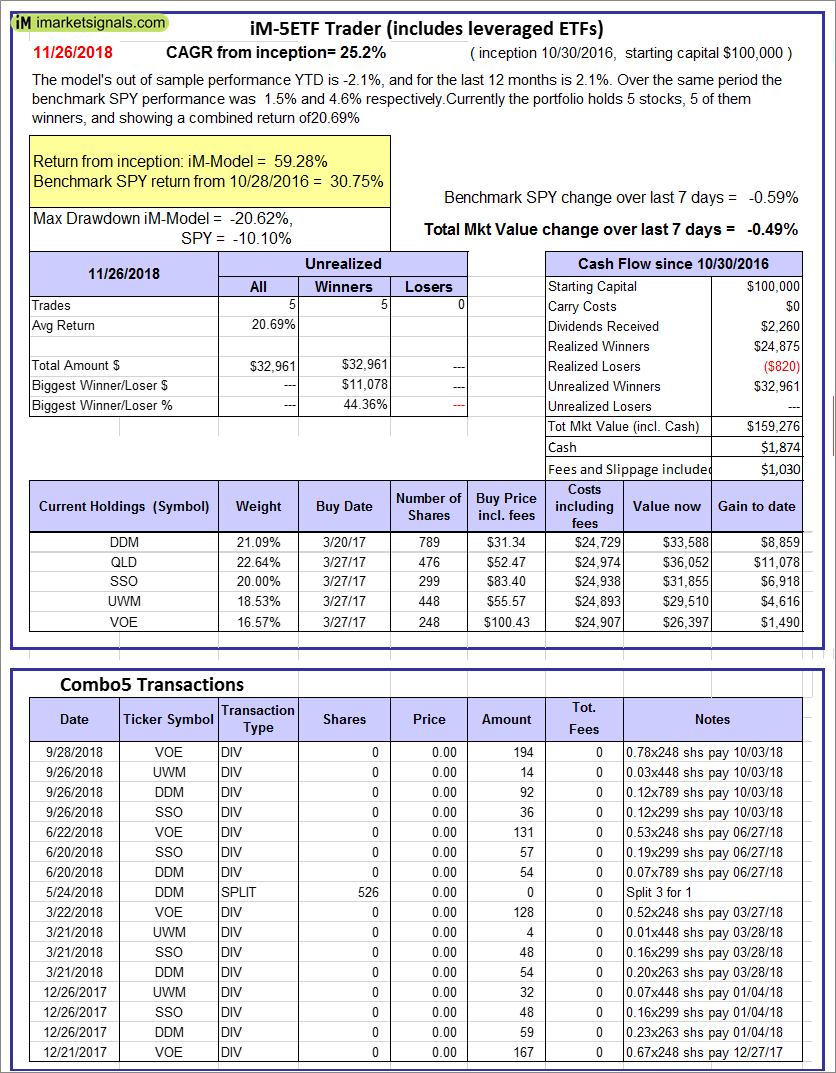 |
iM-5ETF Trader (includes leveraged ETFs): The model’s out of sample performance YTD is -2.1%, and for the last 12 months is 2.1%. Over the same period the benchmark SPY performance was 1.5% and 4.6% respectively. Over the previous week the market value of the iM-5ETF Trader (includes leveraged ETFs) gained -0.49% at a time when SPY gained -0.59%. A starting capital of $100,000 at inception on 10/30/2016 would have grown to $159,276 which includes $1,874 cash and excludes $1,030 spent on fees and slippage. |
 |
iM-Standard 5ETF Trader (excludes leveraged ETFs): The model’s out of sample performance YTD is 1.1%, and for the last 12 months is 4.5%. Over the same period the benchmark SPY performance was 1.5% and 4.6% respectively. Over the previous week the market value of the iM-Standard 5ETF Trader (excludes leveraged ETFs) gained -0.46% at a time when SPY gained -0.59%. A starting capital of $100,000 at inception on 10/30/2016 would have grown to $126,956 which includes $3,759 cash and excludes $880 spent on fees and slippage. |
iM-Best Reports – 11/26/2018
Posted in pmp SPY-SH
Leave a Reply
You must be logged in to post a comment.