
  |
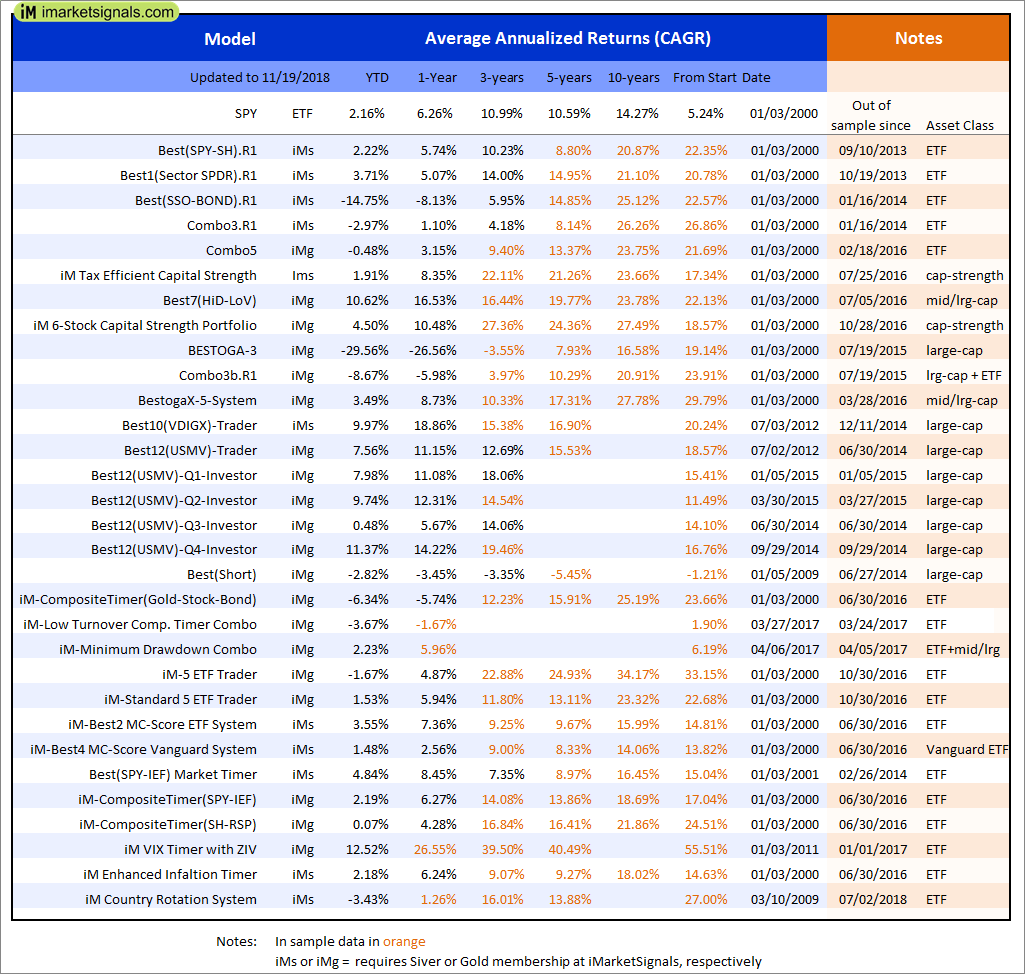
Out of sample performance summary of our models for the past 1, 2, 4 and 13 week periods. The active active return indicates how the models over- or underperformed the benchmark ETF SPY. Also the YTD, and the 1-, 3-, 5- and 10-year annualized returns are shown in the second table |
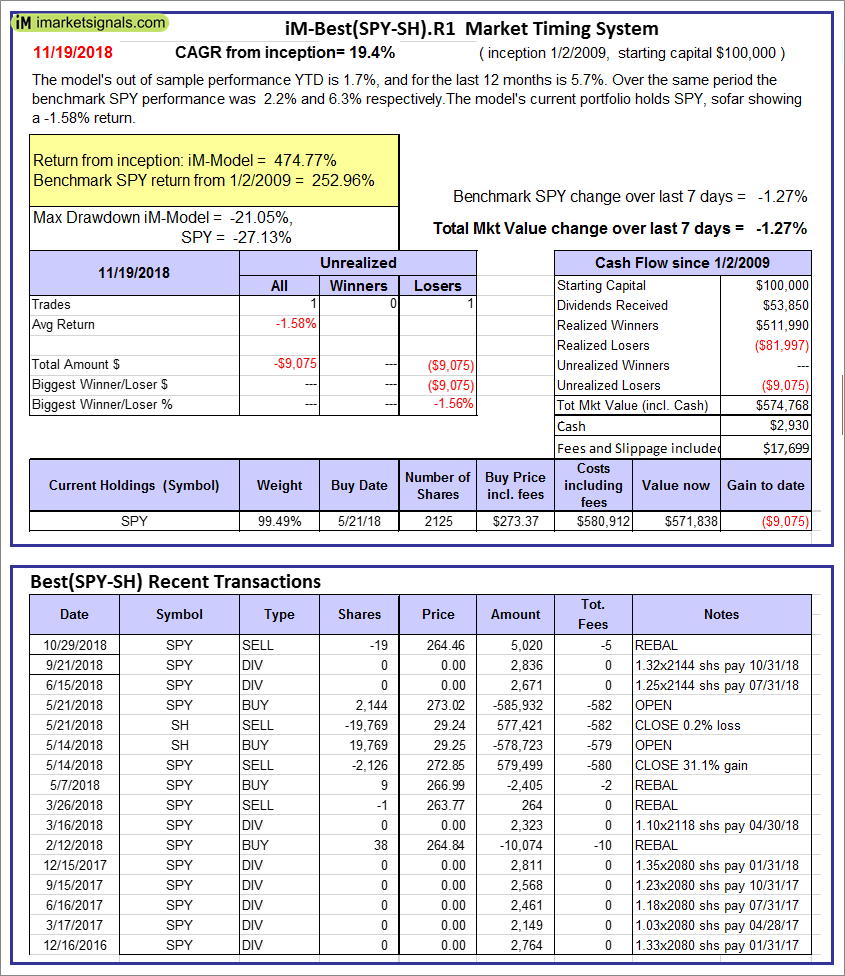 |
iM-Best(SPY-SH).R1: The model’s out of sample performance YTD is 1.7%, and for the last 12 months is 5.7%. Over the same period the benchmark SPY performance was 2.2% and 6.3% respectively. Over the previous week the market value of Best(SPY-SH) gained -1.27% at a time when SPY gained -1.27%. A starting capital of $100,000 at inception on 1/2/2009 would have grown to $574,768 which includes $2,930 cash and excludes $17,699 spent on fees and slippage. |
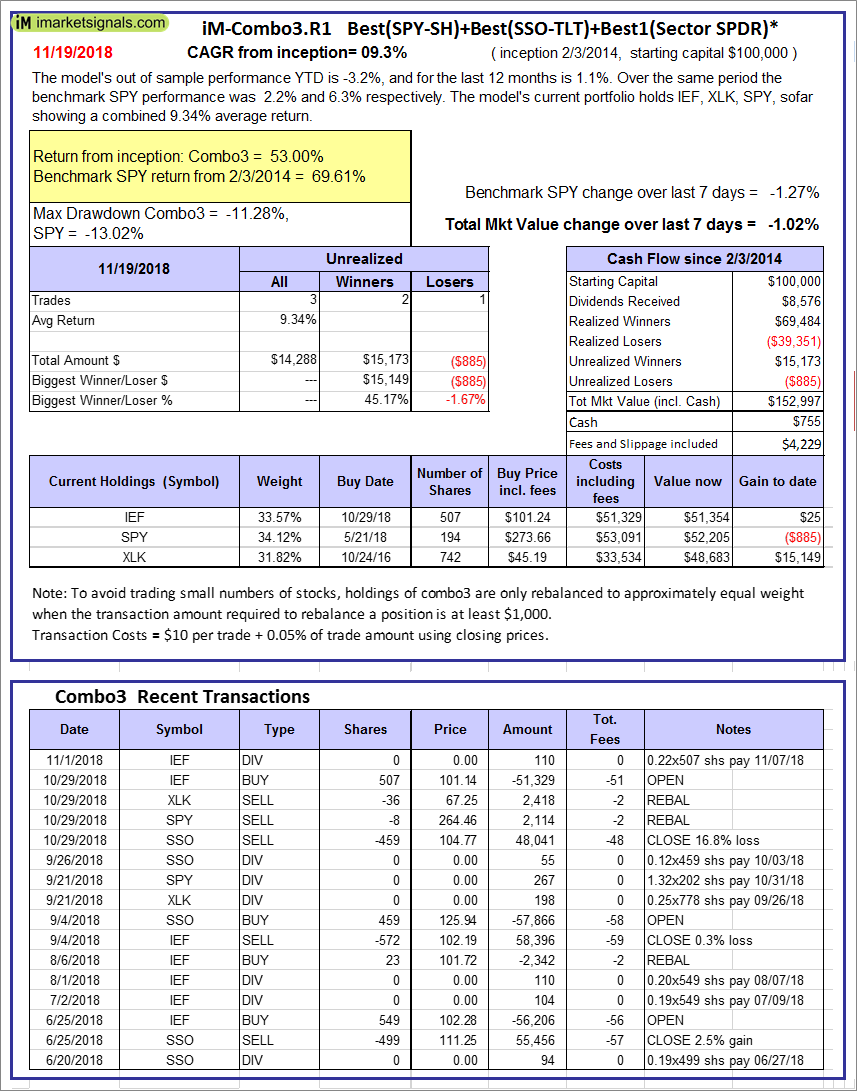 |
iM-Combo3.R1: The model’s out of sample performance YTD is -3.2%, and for the last 12 months is 1.1%. Over the same period the benchmark SPY performance was 2.2% and 6.3% respectively. Over the previous week the market value of iM-Combo3.R1 gained -1.02% at a time when SPY gained -1.27%. A starting capital of $100,000 at inception on 2/3/2014 would have grown to $152,997 which includes $755 cash and excludes $4,229 spent on fees and slippage. |
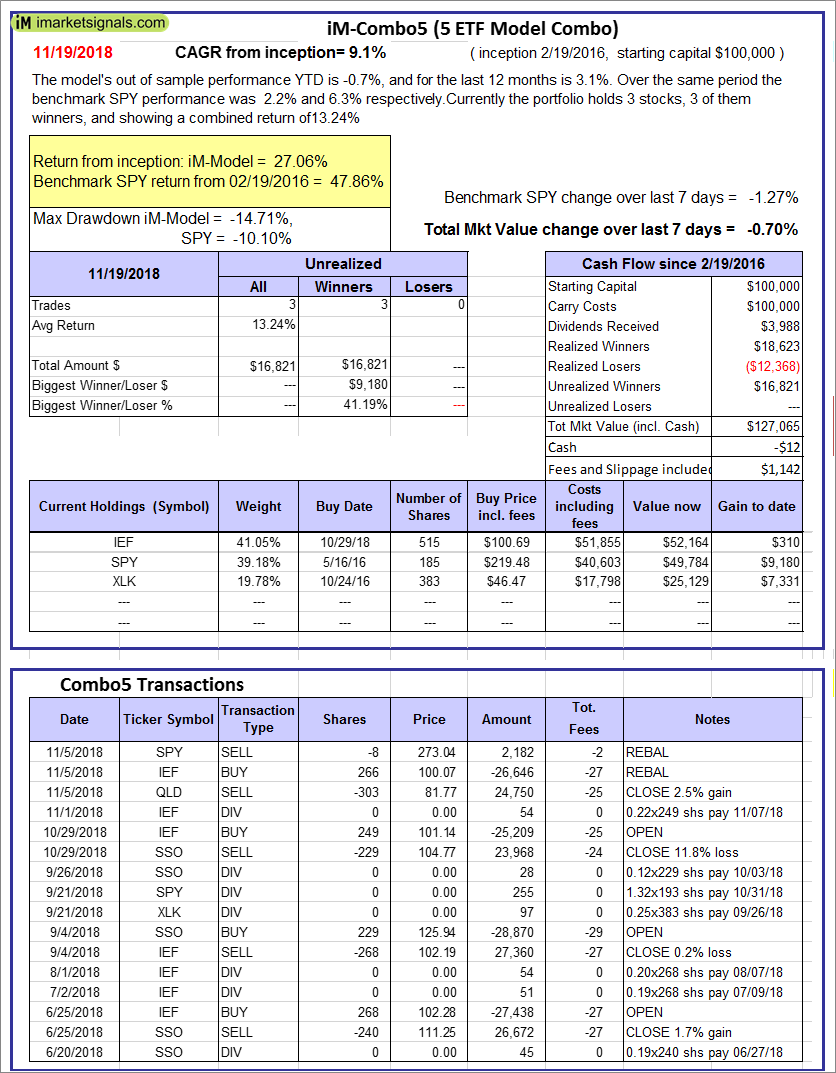 |
iM-Combo5: The model’s out of sample performance YTD is -0.7%, and for the last 12 months is 3.1%. Over the same period the benchmark SPY performance was 2.2% and 6.3% respectively. Over the previous week the market value of iM-Combo5 gained -0.70% at a time when SPY gained -1.27%. A starting capital of $100,000 at inception on 2/22/2016 would have grown to $127,065 which includes -$12 cash and excludes $1,142 spent on fees and slippage. |
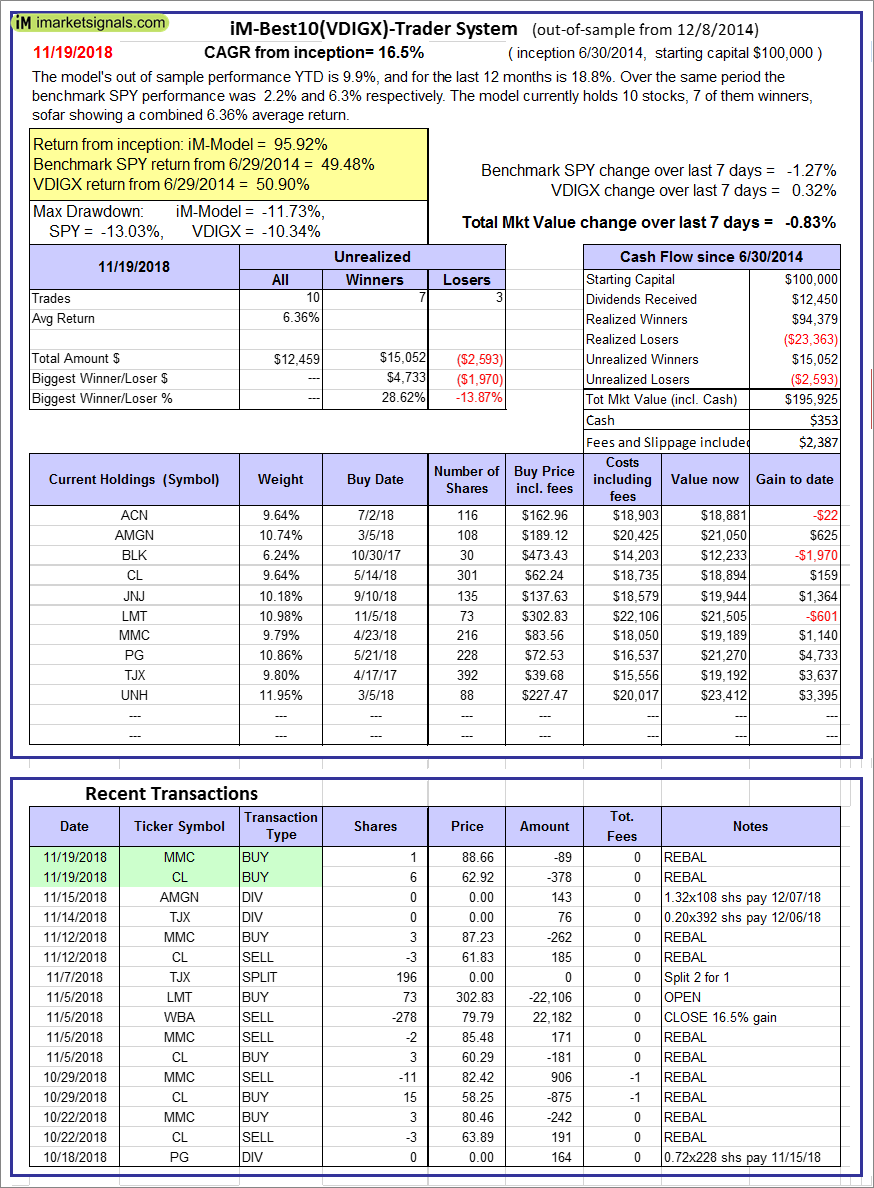 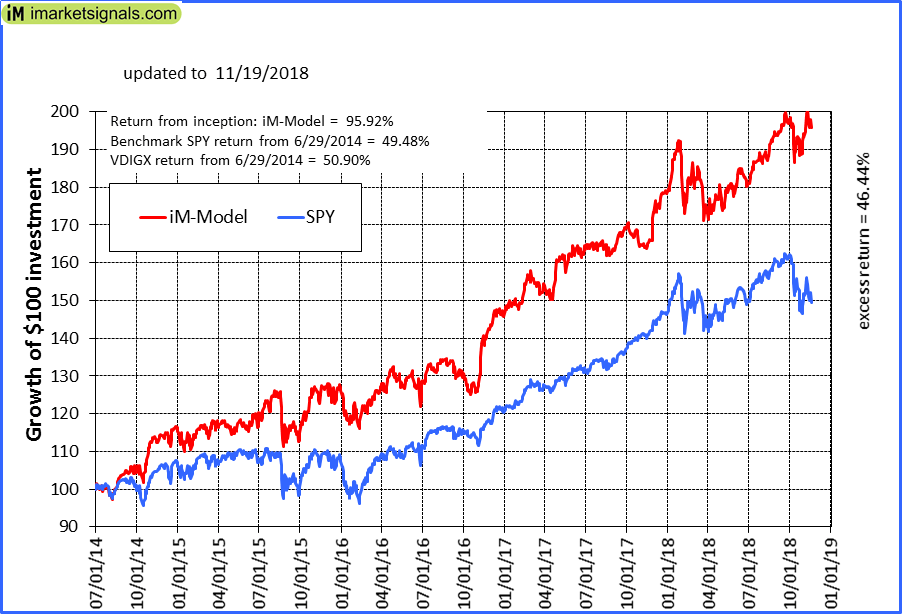 |
iM-Best10(VDIGX)-Trader: The model’s out of sample performance YTD is 9.9%, and for the last 12 months is 18.8%. Over the same period the benchmark SPY performance was 2.2% and 6.3% respectively. Since inception, on 7/1/2014, the model gained 95.92% while the benchmark SPY gained 49.48% and VDIGX gained 50.90% over the same period. Over the previous week the market value of iM-Best10(VDIGX) gained -0.83% at a time when SPY gained -1.27%. A starting capital of $100,000 at inception on 7/1/2014 would have grown to $195,925 which includes $353 cash and excludes $2,387 spent on fees and slippage. |
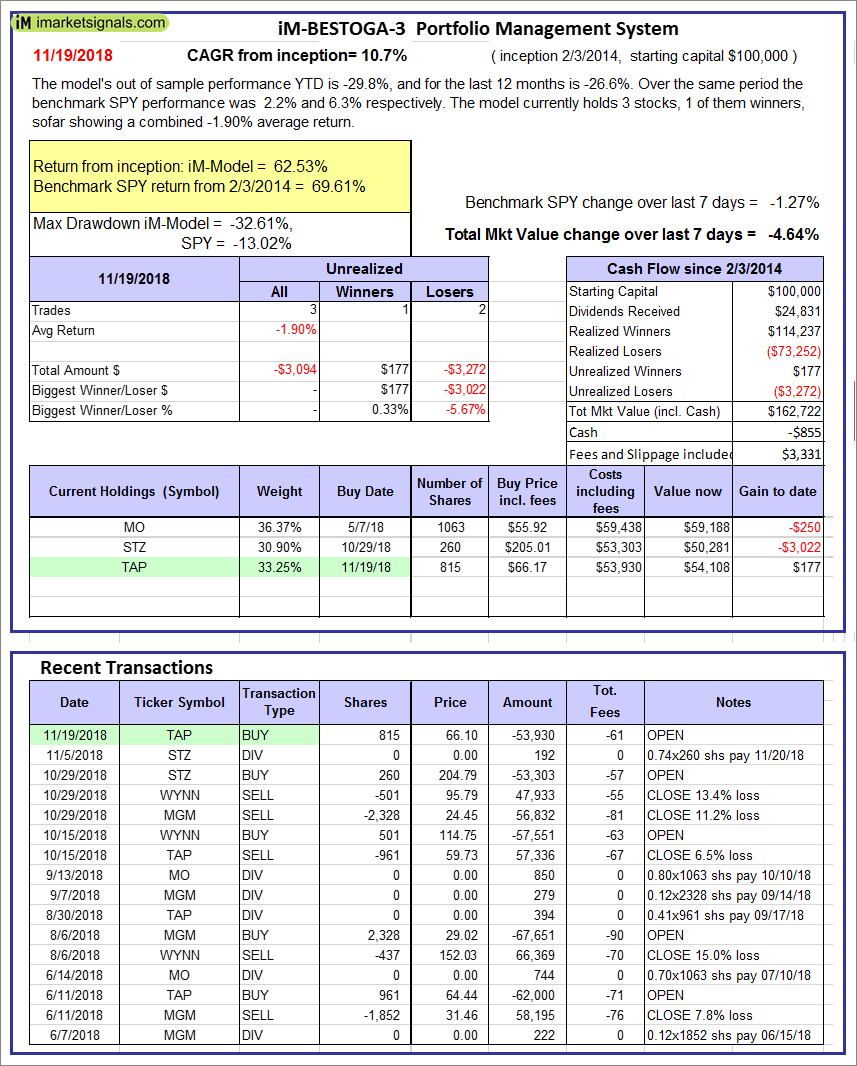 |
iM-BESTOGA-3: The model’s out of sample performance YTD is -29.8%, and for the last 12 months is -26.6%. Over the same period the benchmark SPY performance was 2.2% and 6.3% respectively. Over the previous week the market value of iM-BESTOGA-3 gained -4.64% at a time when SPY gained -1.27%. A starting capital of $100,000 at inception on 2/3/2014 would have grown to $162,722 which includes -$855 cash and excludes $3,331 spent on fees and slippage. |
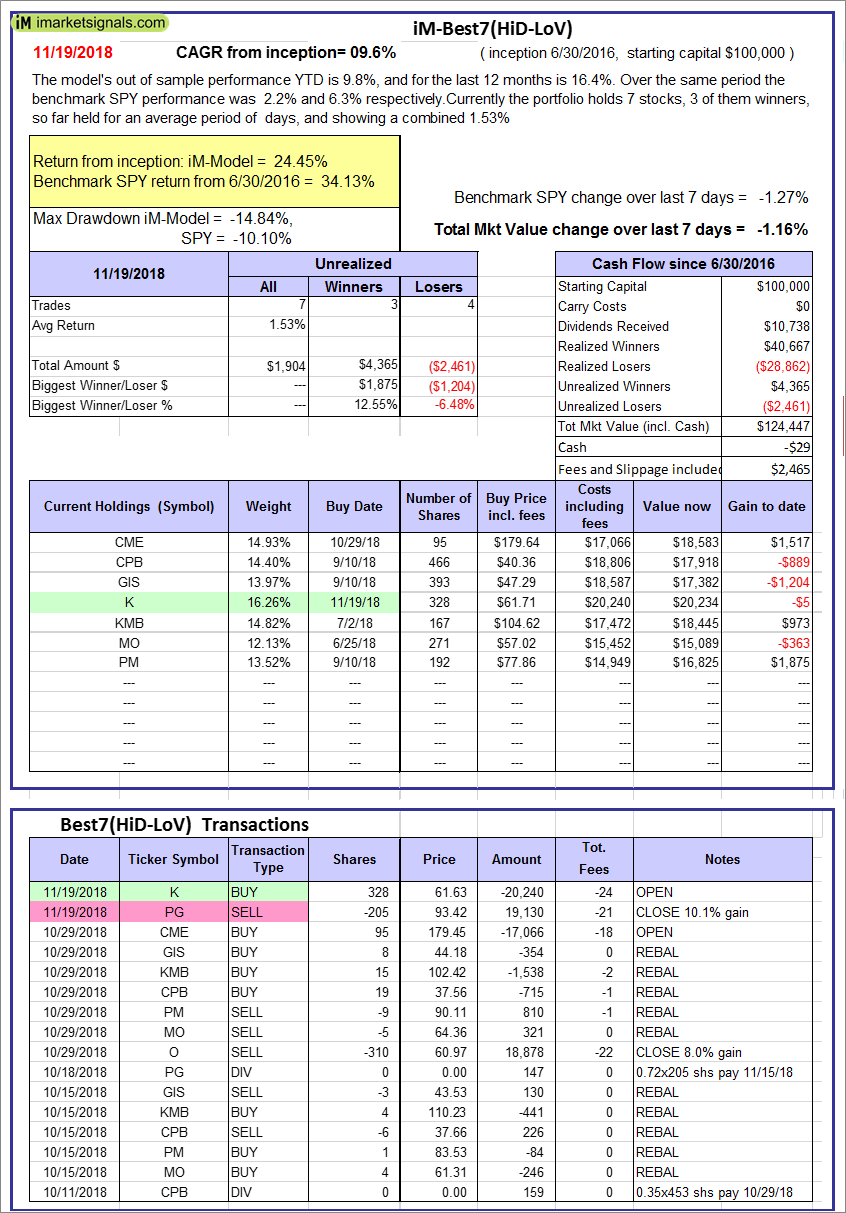 |
iM-Best7(HiD-LoV): The model’s out of sample performance YTD is 9.8%, and for the last 12 months is 16.4%. Over the same period the benchmark SPY performance was 2.2% and 6.3% respectively. Over the previous week the market value of iM-BESTOGA-3 gained -1.16% at a time when SPY gained -1.27%. A starting capital of $100,000 at inception on 6/30/2016 would have grown to $124,447 which includes -$29 cash and excludes $2,465 spent on fees and slippage. |
 |
iM 6-Stock Capital Strength Portfolio: The model’s out of sample performance YTD is 4.2%, and for the last 12 months is 10.5%. Over the same period the benchmark SPY performance was 2.2% and 6.3% respectively. Over the previous week the market value of the iM 6-Stock Capital Strength Portfolio gained -0.75% at a time when SPY gained -1.27%. A starting capital of $100,000 at inception on 10/28/2016 would have grown to $158,035 which includes $967 cash and excludes $790 spent on fees and slippage. |
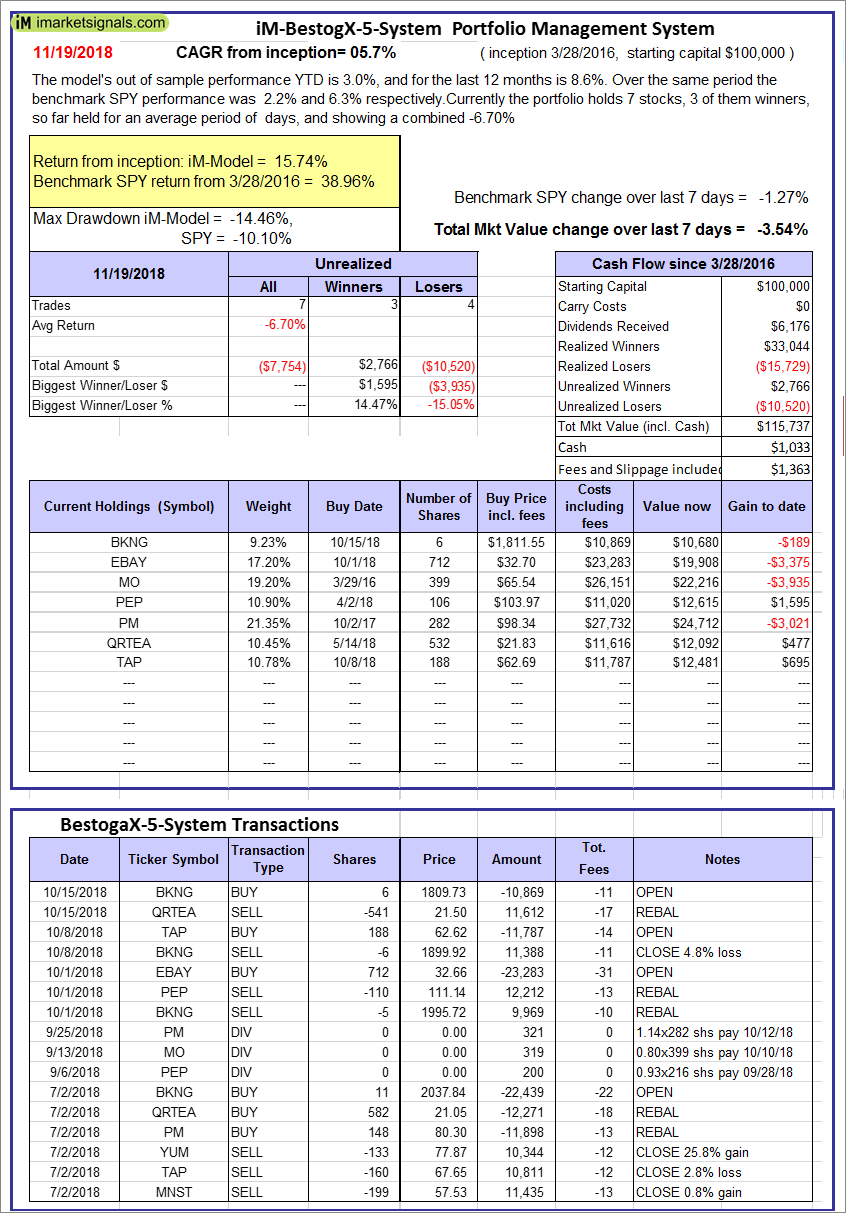 |
iM-BestogaX5-System: The model’s out of sample performance YTD is 3.0%, and for the last 12 months is 8.6%. Over the same period the benchmark SPY performance was 2.2% and 6.3% respectively. Over the previous week the market value of iM-BestogaX5-System gained -3.54% at a time when SPY gained -1.27%. A starting capital of $100,000 at inception on 3/28/2016 would have grown to $115,737 which includes $1,033 cash and excludes $1,363 spent on fees and slippage. |
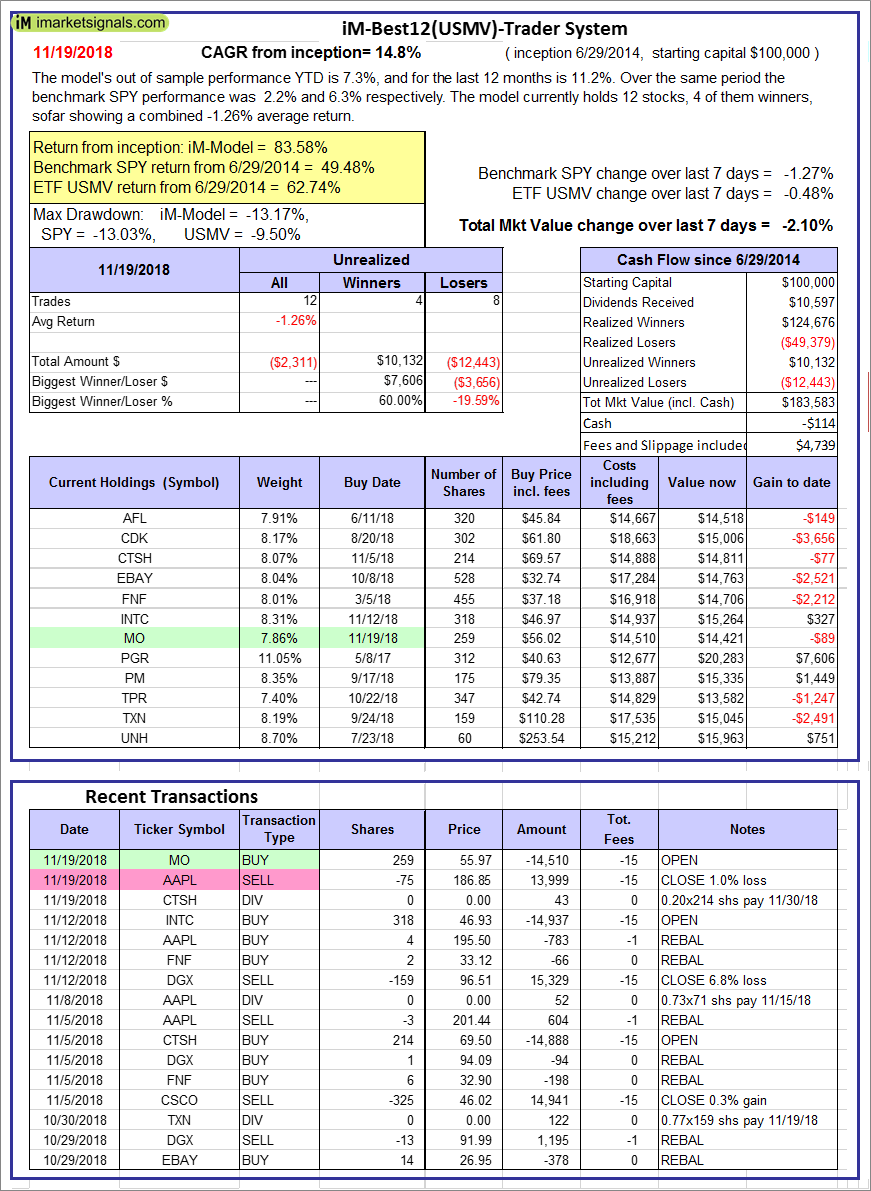 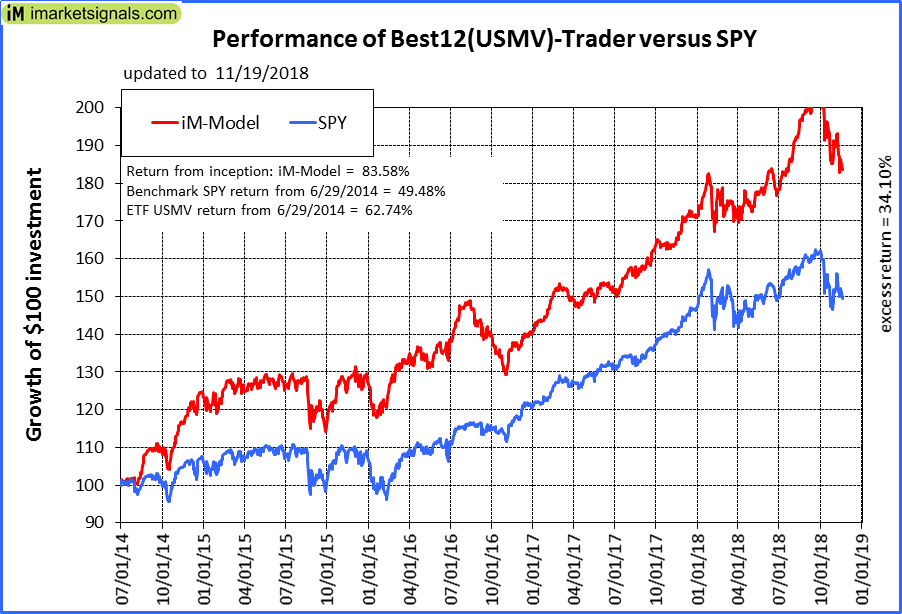 |
iM-Best12(USMV)-Trader: The model’s out of sample performance YTD is 7.3%, and for the last 12 months is 11.2%. Over the same period the benchmark SPY performance was 2.2% and 6.3% respectively. Since inception, on 6/30/2014, the model gained 83.58% while the benchmark SPY gained 49.48% and the ETF USMV gained 62.74% over the same period. Over the previous week the market value of iM-Best12(USMV)-Trader gained -2.10% at a time when SPY gained -1.27%. A starting capital of $100,000 at inception on 6/30/2014 would have grown to $183,583 which includes -$114 cash and excludes $4,739 spent on fees and slippage. |
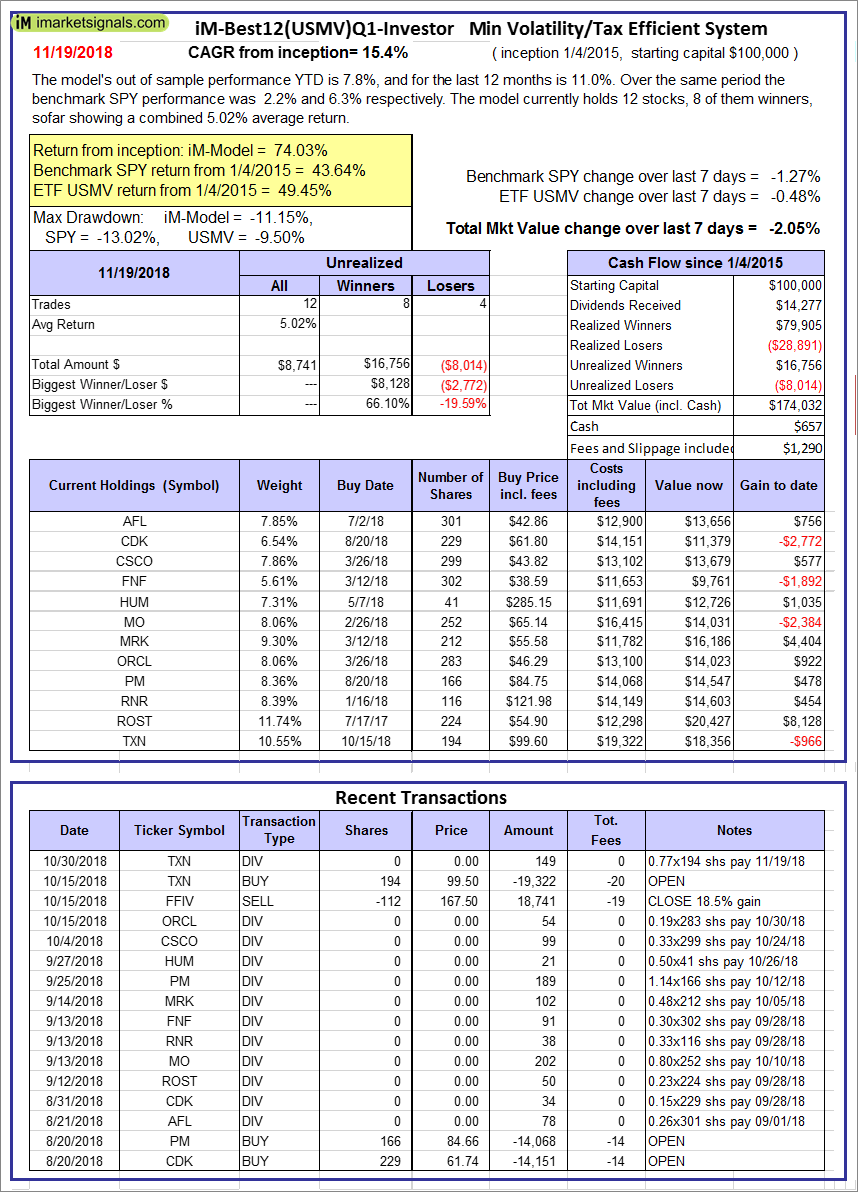 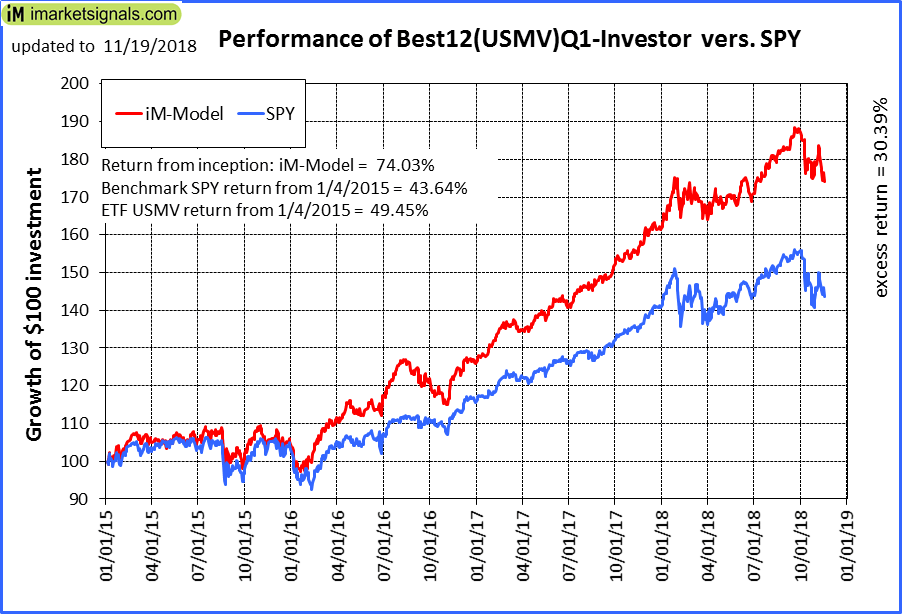 |
iM-Best12(USMV)Q1-Investor: The model’s out of sample performance YTD is 7.8%, and for the last 12 months is 11.0%. Over the same period the benchmark SPY performance was 2.2% and 6.3% respectively. Since inception, on 1/5/2015, the model gained 74.03% while the benchmark SPY gained 43.64% and the ETF USMV gained 49.45% over the same period. Over the previous week the market value of iM-Best12(USMV)Q1 gained -2.05% at a time when SPY gained -1.27%. A starting capital of $100,000 at inception on 1/5/2015 would have grown to $174,032 which includes $657 cash and excludes $1,290 spent on fees and slippage. |
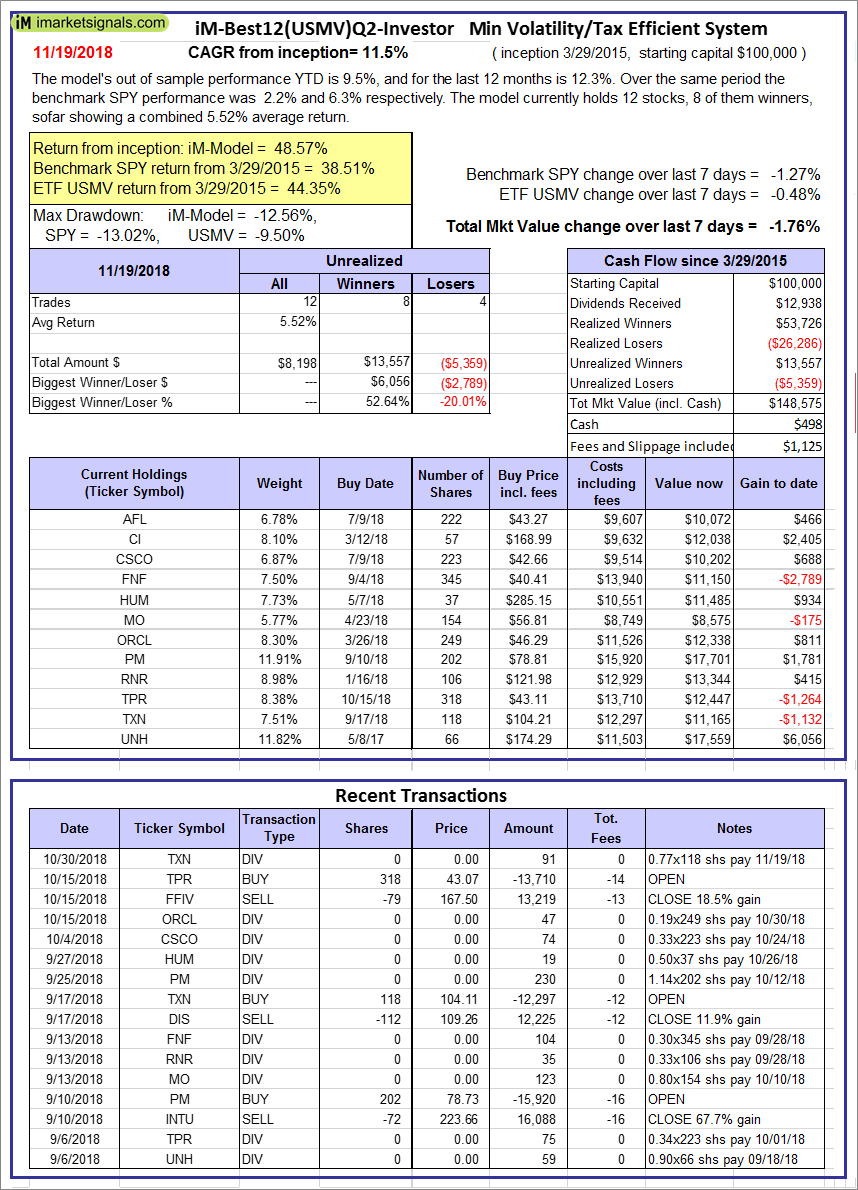 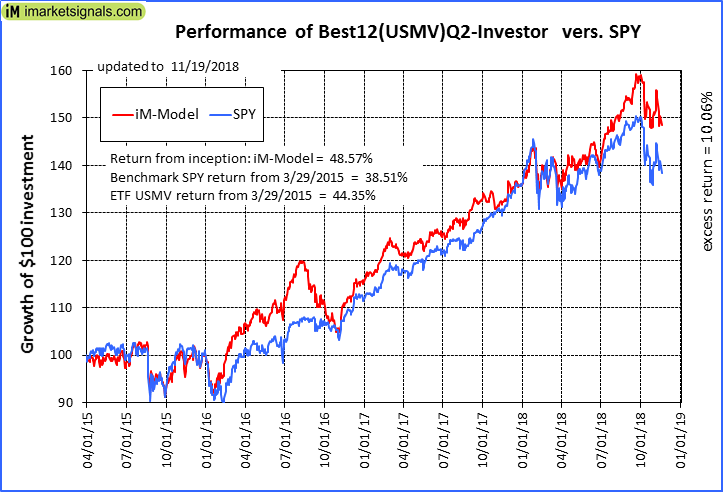 |
iM-Best12(USMV)Q2-Investor: The model’s out of sample performance YTD is 9.5%, and for the last 12 months is 12.3%. Over the same period the benchmark SPY performance was 2.2% and 6.3% respectively. Since inception, on 3/30/2015, the model gained 48.57% while the benchmark SPY gained 38.51% and the ETF USMV gained 44.35% over the same period. Over the previous week the market value of iM-Best12(USMV)Q2 gained -1.76% at a time when SPY gained -1.27%. A starting capital of $100,000 at inception on 3/30/2015 would have grown to $148,575 which includes $498 cash and excludes $1,125 spent on fees and slippage. |
  |
iM-Best12(USMV)Q3-Investor: The model’s out of sample performance YTD is 0.3%, and for the last 12 months is 5.5%. Over the same period the benchmark SPY performance was 2.2% and 6.3% respectively. Since inception, on 7/1/2014, the model gained 78.28% while the benchmark SPY gained 49.48% and the ETF USMV gained 62.74% over the same period. Over the previous week the market value of iM-Best12(USMV)Q3 gained -2.04% at a time when SPY gained -1.27%. A starting capital of $100,000 at inception on 7/1/2014 would have grown to $178,285 which includes $772 cash and excludes $1,653 spent on fees and slippage. |
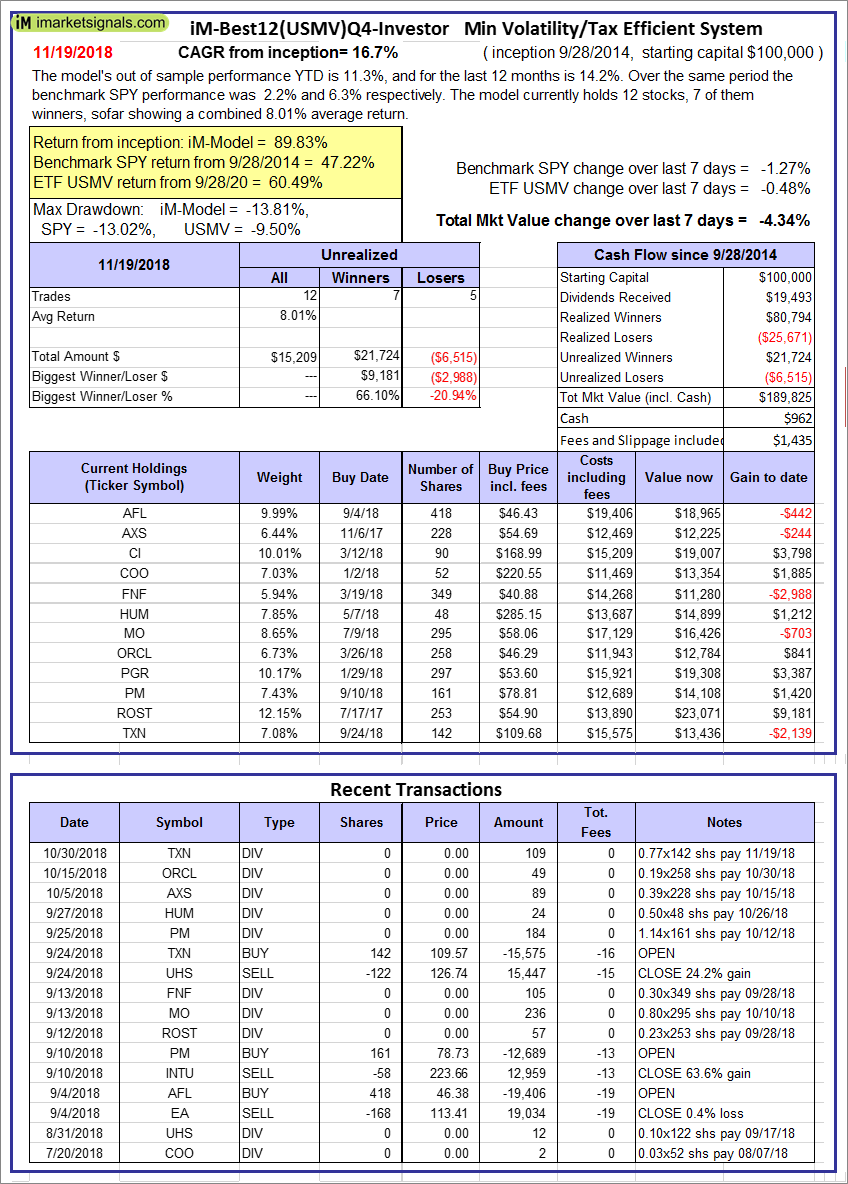 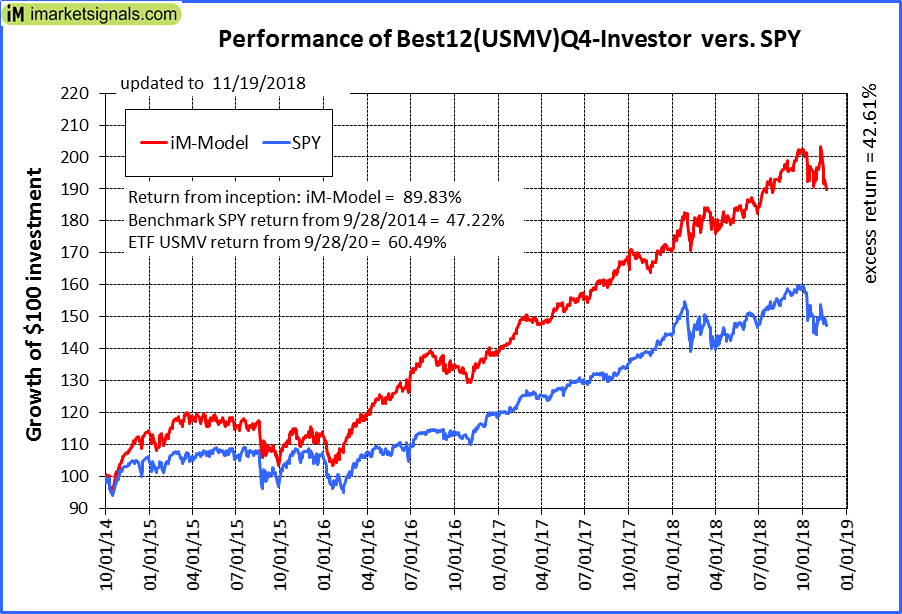 |
iM-Best12(USMV)Q4-Investor: Since inception, on 9/29/2014, the model gained 89.83% while the benchmark SPY gained 47.22% and the ETF USMV gained 60.49% over the same period. Over the previous week the market value of iM-Best12(USMV)Q4 gained -4.34% at a time when SPY gained -1.27%. A starting capital of $100,000 at inception on 9/29/2014 would have grown to $189,825 which includes $962 cash and excludes $1,435 spent on fees and slippage. |
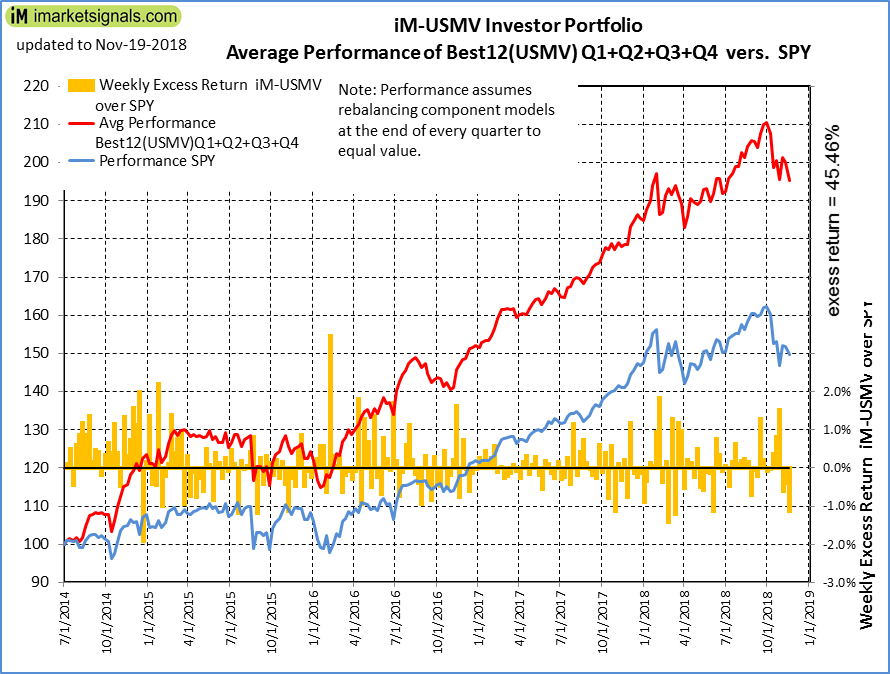 |
Average Performance of iM-Best12(USMV)Q1+Q2+Q3+Q4-Investor resulted in an excess return of 45.46% over SPY. (see iM-USMV Investor Portfolio) |
 |
iM-Best(Short): The model’s out of sample performance YTD is -2.8%, and for the last 12 months is -3.4%. Over the same period the benchmark SPY performance was 2.2% and 6.3% respectively. Over the previous week the market value of iM-Best(Short) gained 0.77% at a time when SPY gained -1.27%. Over the period 1/2/2009 to 11/19/2018 the starting capital of $100,000 would have grown to $88,658 which includes $120,409 cash and excludes $24,838 spent on fees and slippage. |
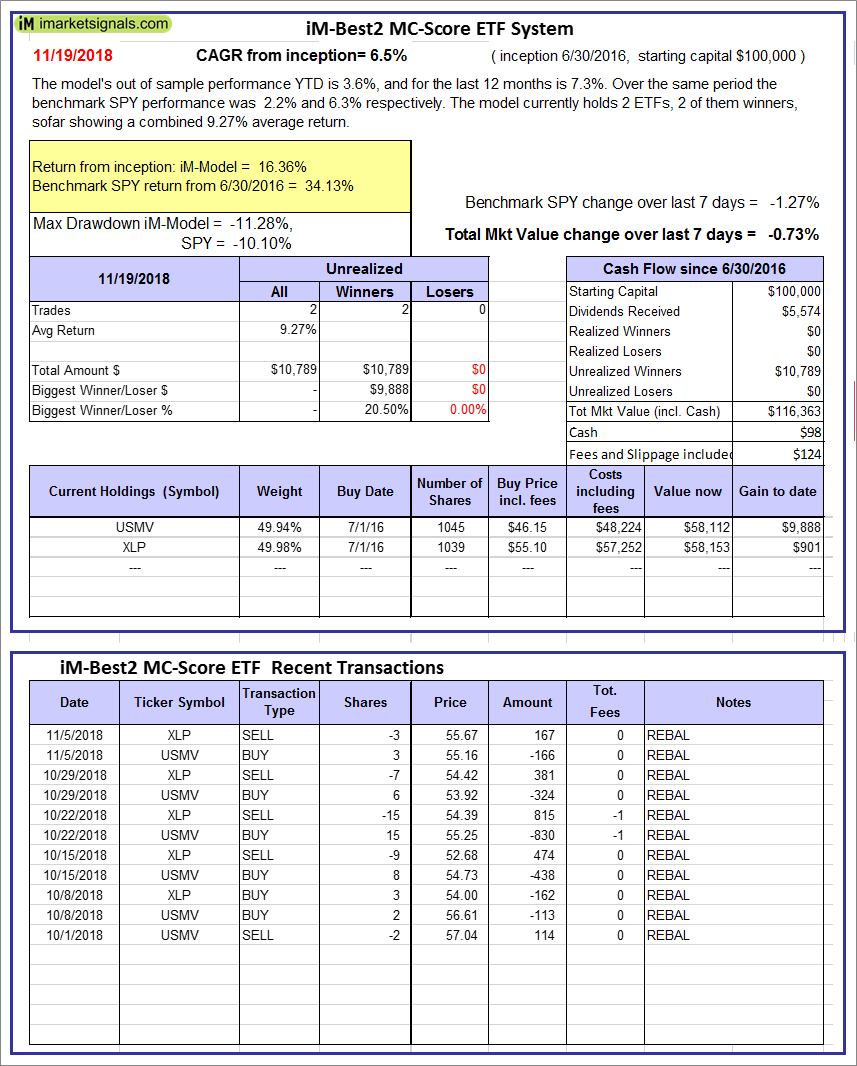 |
iM-Best2 MC-Score ETF System: The model’s out of sample performance YTD is 3.6%, and for the last 12 months is 7.3%. Over the same period the benchmark SPY performance was 2.2% and 6.3% respectively. Over the previous week the market value of the iM-Best2 MC-Score ETF System gained -0.73% at a time when SPY gained -1.27%. A starting capital of $100,000 at inception on 6/30/2016 would have grown to $116,363 which includes $98 cash and excludes $124 spent on fees and slippage. |
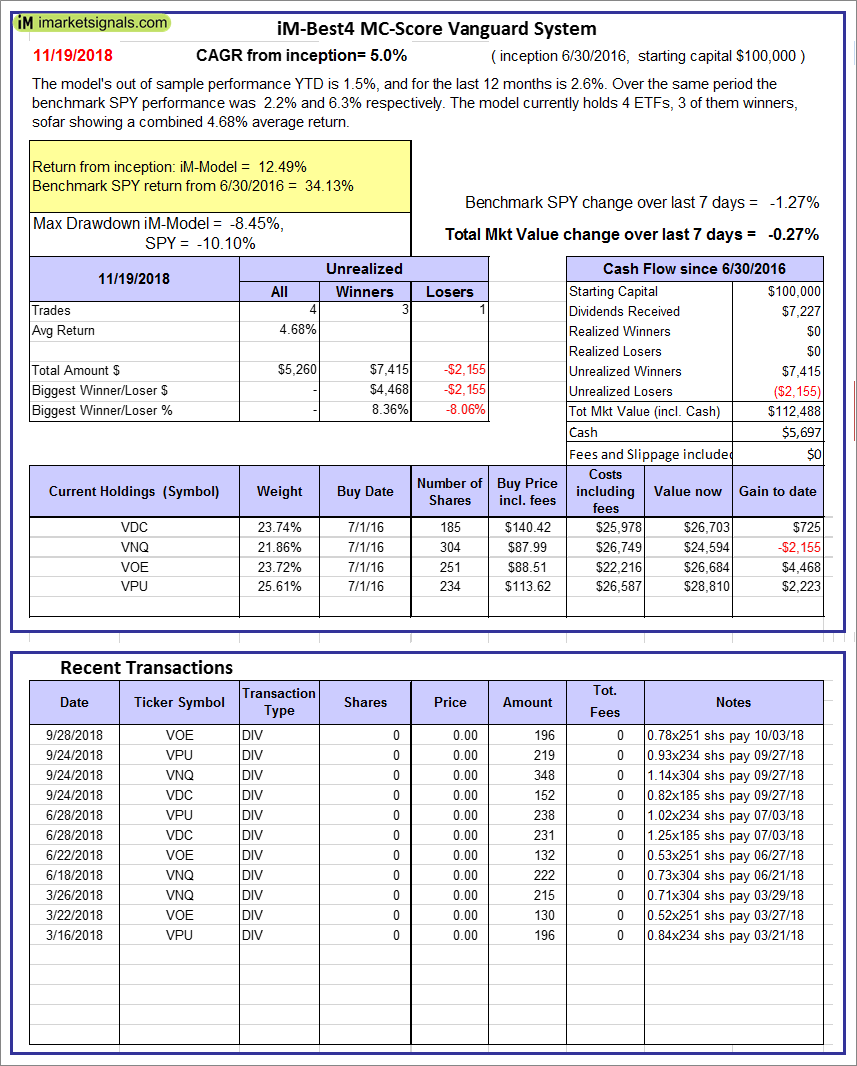 |
iM-Best4 MC-Score Vanguard System: The model’s out of sample performance YTD is 1.5%, and for the last 12 months is 2.6%. Over the same period the benchmark SPY performance was 2.2% and 6.3% respectively. Over the previous week the market value of the iM-Best4 MC-Score Vanguard System gained -0.27% at a time when SPY gained -1.27%. A starting capital of $100,000 at inception on 6/30/2016 would have grown to $112,488 which includes $5,697 cash and excludes $00 spent on fees and slippage. |
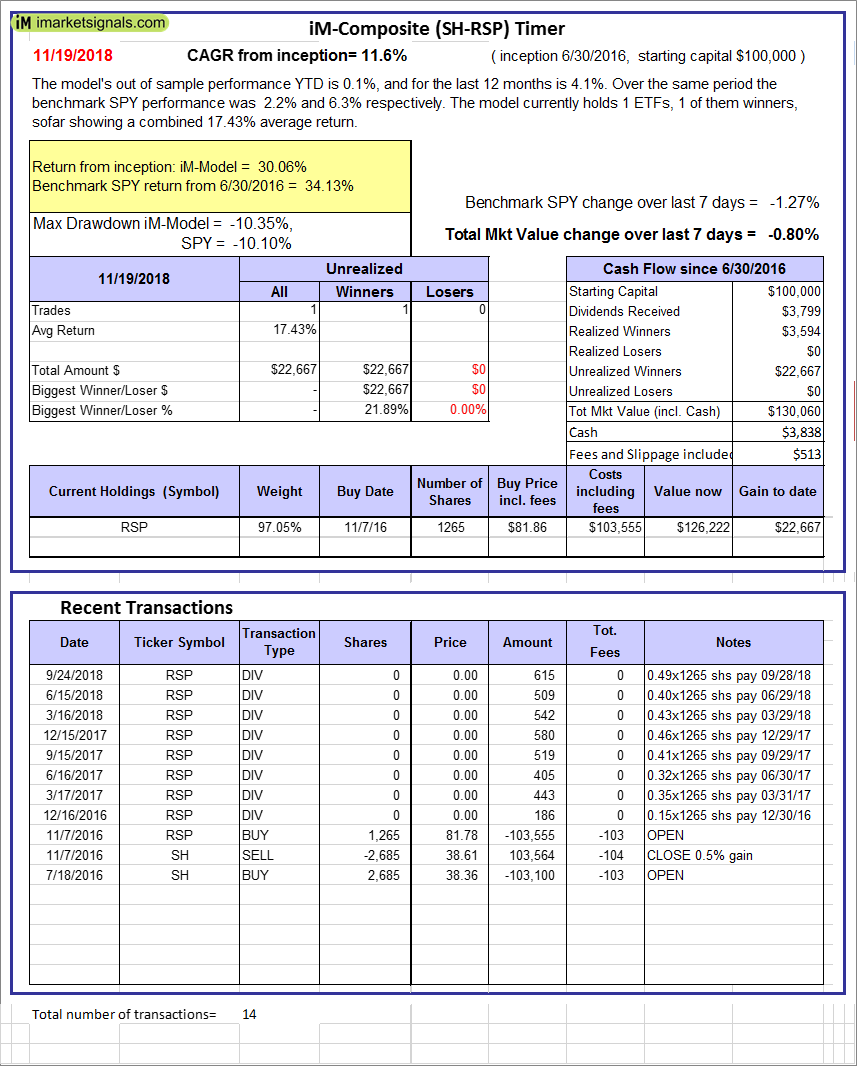 |
iM-Composite (SH-RSP) Timer: The model’s out of sample performance YTD is 0.1%, and for the last 12 months is 4.1%. Over the same period the benchmark SPY performance was 2.2% and 6.3% respectively. Over the previous week the market value of the iM-Composite (SH-RSP) Timer gained -0.80% at a time when SPY gained -1.27%. A starting capital of $100,000 at inception on 6/30/2016 would have grown to $130,060 which includes $3,838 cash and excludes $513 spent on fees and slippage. |
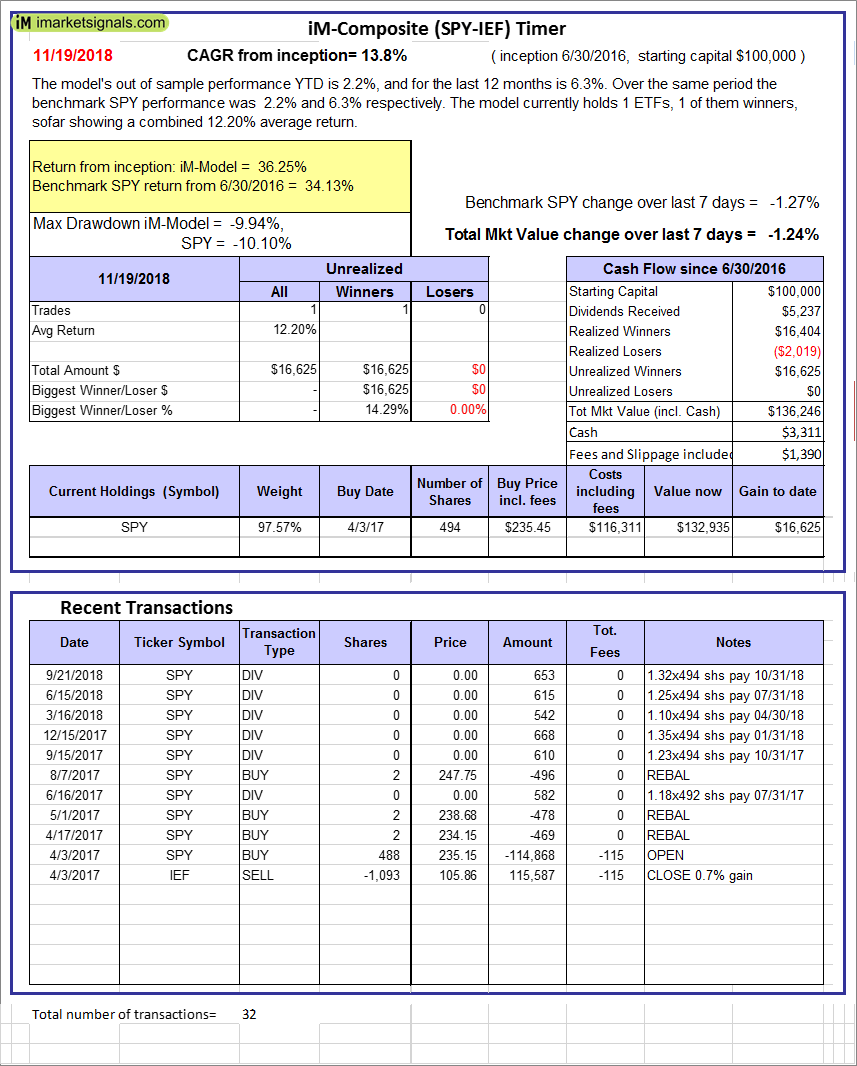 |
iM-Composite (SPY-IEF) Timer: The model’s out of sample performance YTD is 2.2%, and for the last 12 months is 6.3%. Over the same period the benchmark SPY performance was 2.2% and 6.3% respectively. Over the previous week the market value of the iM-Composite (SPY-IEF) Timer gained -1.24% at a time when SPY gained -1.27%. A starting capital of $100,000 at inception on 6/30/2016 would have grown to $136,246 which includes $3,311 cash and excludes $1,390 spent on fees and slippage. |
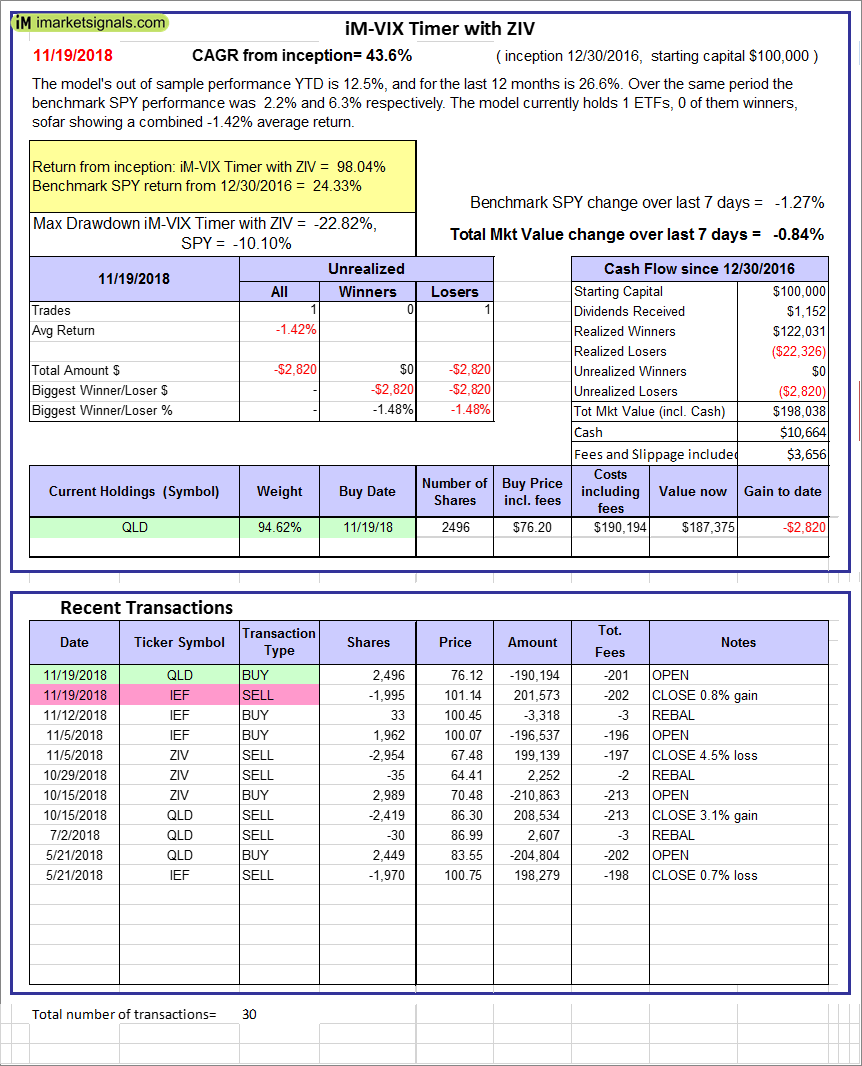 |
iM-VIX Timer with ZIV: The model’s out of sample performance YTD is 12.5%, and for the last 12 months is 26.6%. Over the same period the benchmark SPY performance was 2.2% and 6.3% respectively. Over the previous week the market value of the iM-VIX Timer with ZIV gained -0.84% at a time when SPY gained -1.27%. A starting capital of $100,000 at inception on 6/30/2016 would have grown to $198,038 which includes $10,664 cash and excludes $3,656 spent on fees and slippage. |
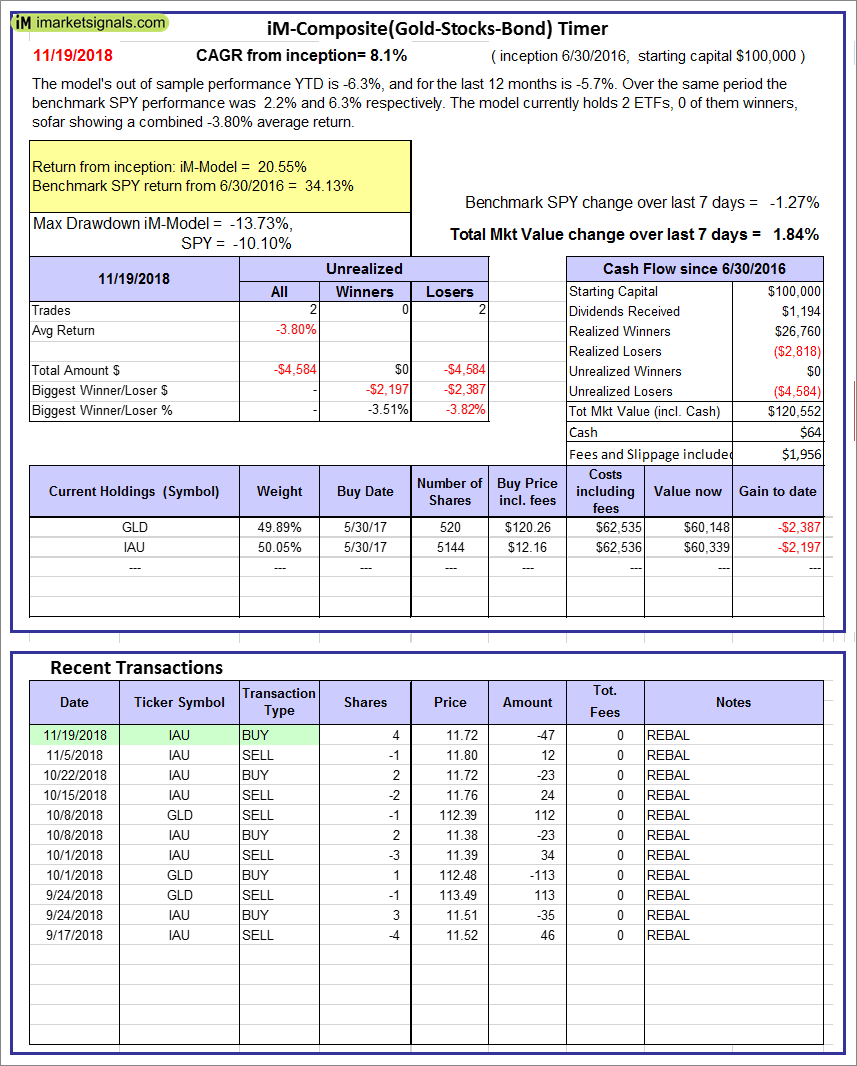 |
iM-Composite(Gold-Stocks-Bond) Timer: The model’s out of sample performance YTD is -6.3%, and for the last 12 months is -5.7%. Over the same period the benchmark SPY performance was 2.2% and 6.3% respectively. Over the previous week the market value of the iM-Composite(Gold-Stocks-Bond) Timer gained 1.84% at a time when SPY gained -1.27%. A starting capital of $100,000 at inception on 6/30/2016 would have grown to $120,552 which includes $64 cash and excludes $1,956 spent on fees and slippage. |
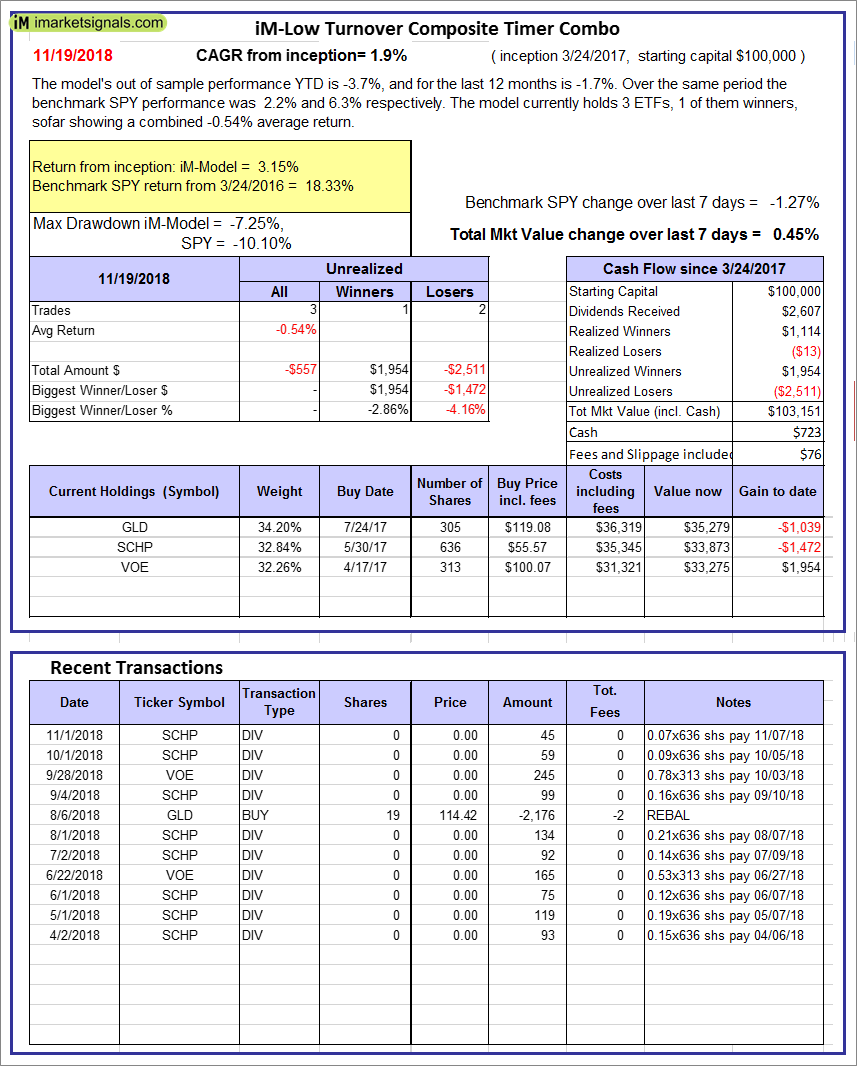 |
iM-Low Turnover Composite Timer Combo: The model’s out of sample performance YTD is -3.7%, and for the last 12 months is -1.7%. Over the same period the benchmark SPY performance was 2.2% and 6.3% respectively. Over the previous week the market value of the iM-Low Turnover Composite Timer Combo gained 0.45% at a time when SPY gained -1.27%. A starting capital of $100,000 at inception on 3/24/27 would have grown to $103,151 which includes $723 cash and excludes $76 spent on fees and slippage. |
 |
iM-Min Drawdown Combo: The model’s out of sample performance YTD is 2.2%, and for the last 12 months is 6.0%. Over the same period the benchmark SPY performance was 2.2% and 6.3% respectively. Over the previous week the market value of the iM-Min Drawdown Combo gained -0.36% at a time when SPY gained -1.27%. A starting capital of $100,000 at inception on 4/5/2017 would have grown to $110,303 which includes $2,836 cash and excludes $429 spent on fees and slippage. |
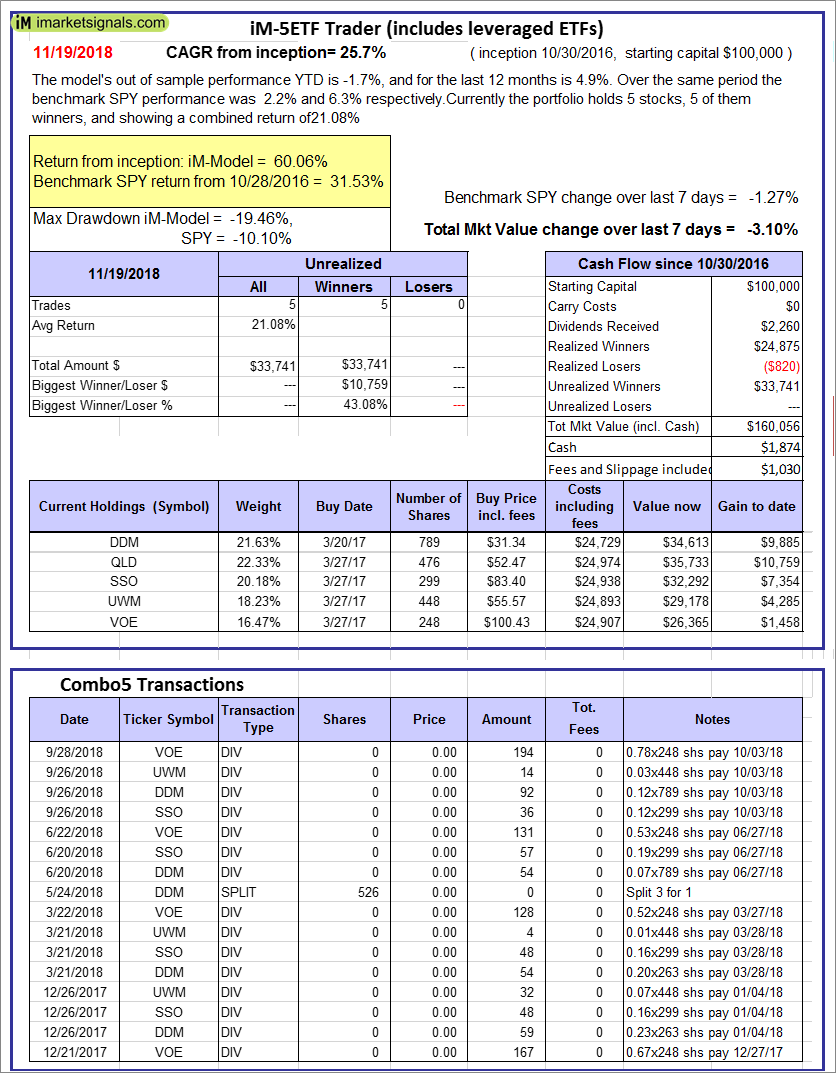 |
iM-5ETF Trader (includes leveraged ETFs): The model’s out of sample performance YTD is -1.7%, and for the last 12 months is 4.9%. Over the same period the benchmark SPY performance was 2.2% and 6.3% respectively. Over the previous week the market value of the iM-5ETF Trader (includes leveraged ETFs) gained -3.10% at a time when SPY gained -1.27%. A starting capital of $100,000 at inception on 10/30/2016 would have grown to $160,056 which includes $1,874 cash and excludes $1,030 spent on fees and slippage. |
 |
iM-Standard 5ETF Trader (excludes leveraged ETFs): The model’s out of sample performance YTD is 1.5%, and for the last 12 months is 5.9%. Over the same period the benchmark SPY performance was 2.2% and 6.3% respectively. Over the previous week the market value of the iM-Standard 5ETF Trader (excludes leveraged ETFs) gained -0.96% at a time when SPY gained -1.27%. A starting capital of $100,000 at inception on 10/30/2016 would have grown to $127,547 which includes $3,759 cash and excludes $880 spent on fees and slippage. |
iM-Best Reports – 11/19/2018
Posted in pmp SPY-SH
Leave a Reply
You must be logged in to post a comment.