
  |
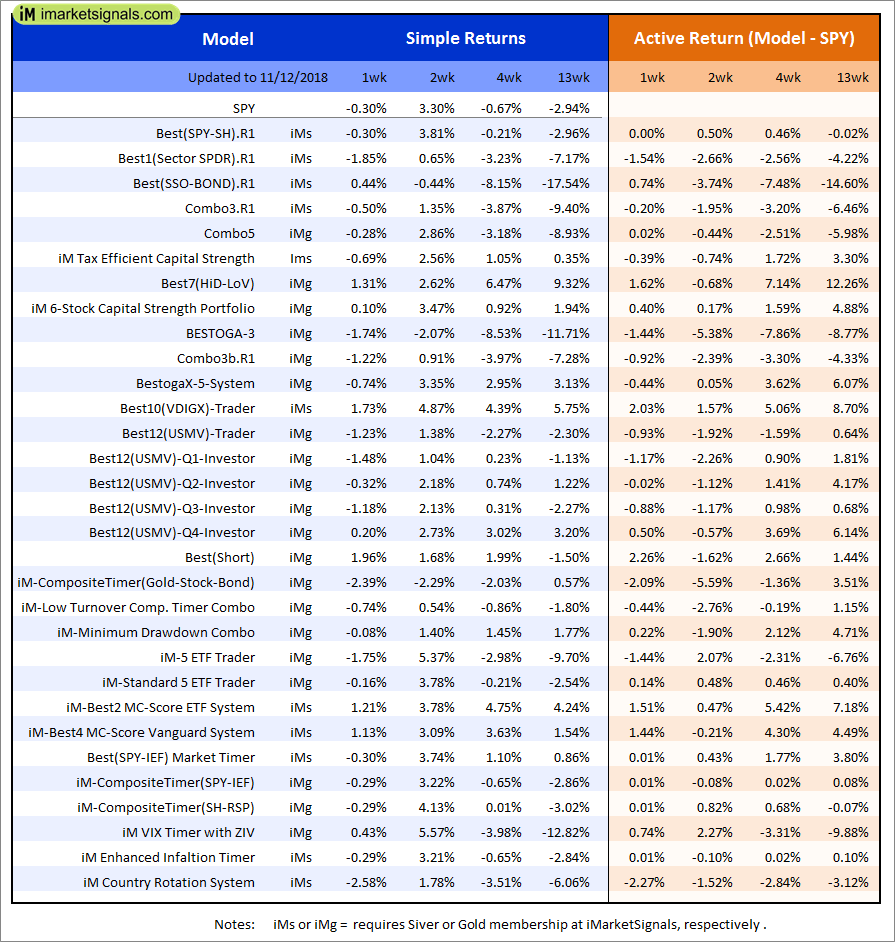
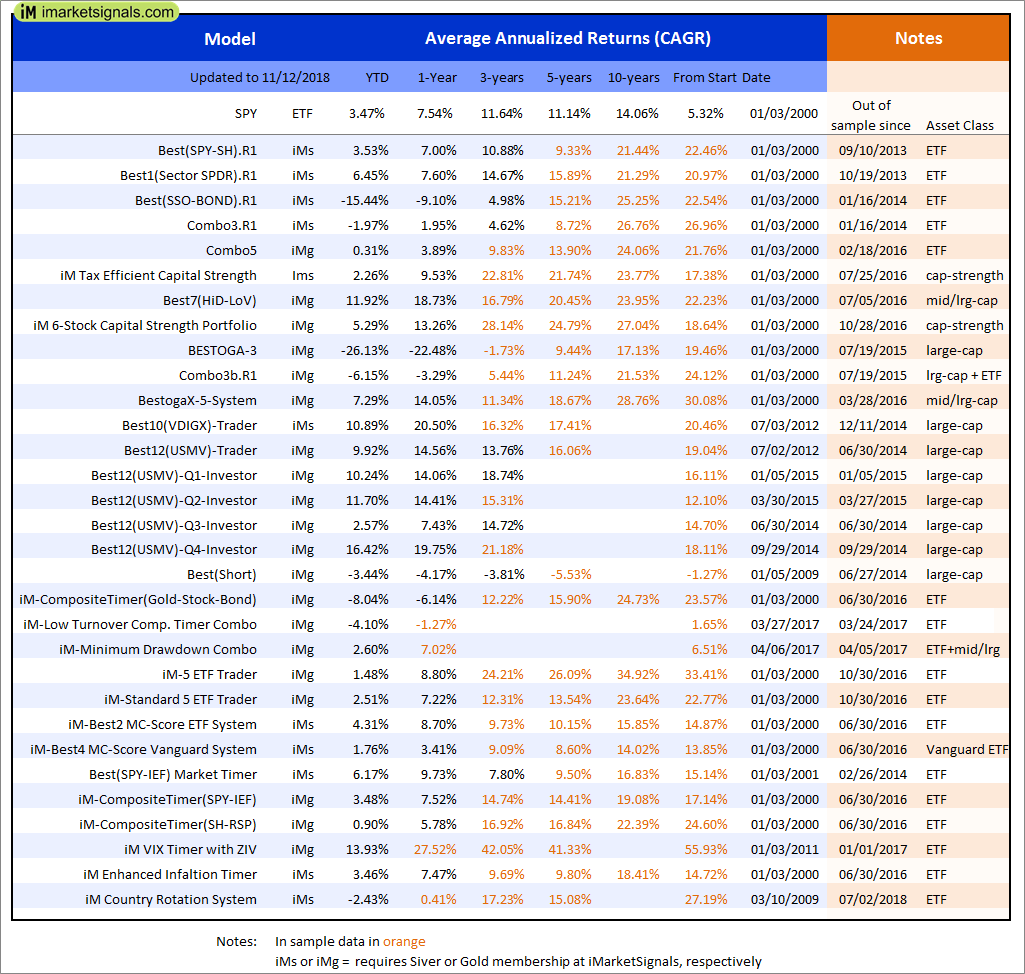
Out of sample performance summary of our models for the past 1, 2, 4 and 13 week periods. The active active return indicates how the models over- or underperformed the benchmark ETF SPY. Also the YTD, and the 1-, 3-, 5- and 10-year annualized returns are shown in the second table |
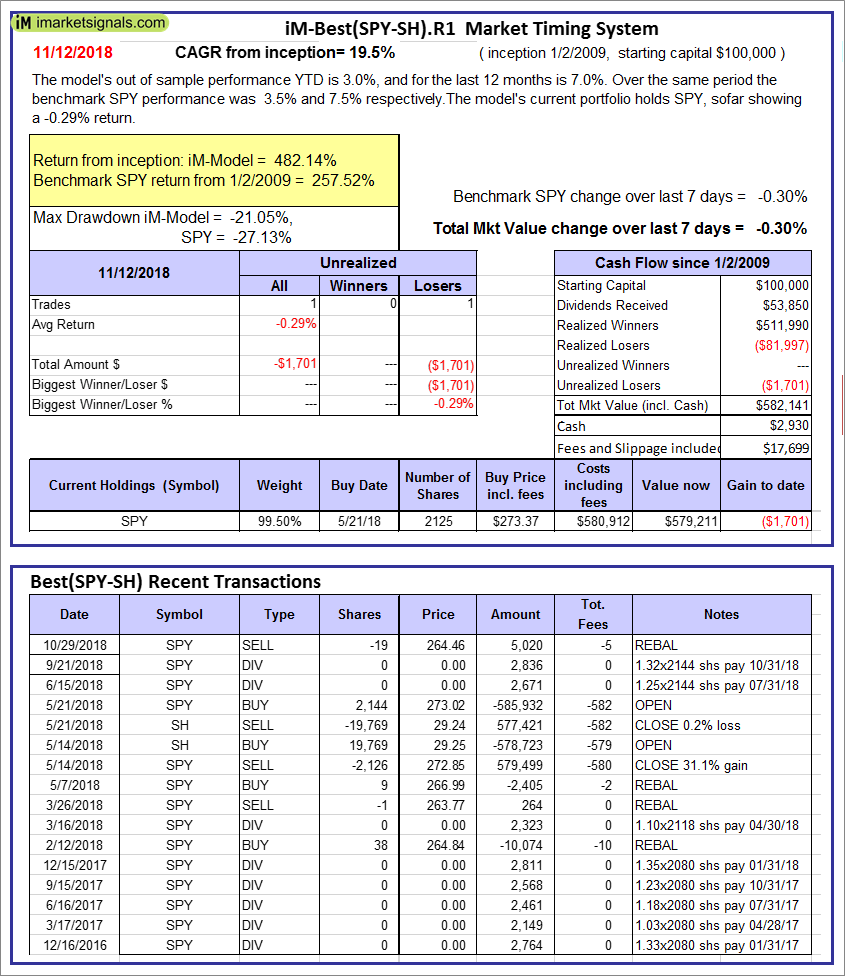 |
iM-Best(SPY-SH).R1: The model’s out of sample performance YTD is 3.0%, and for the last 12 months is 7.0%. Over the same period the benchmark SPY performance was 3.5% and 7.5% respectively. Over the previous week the market value of Best(SPY-SH) gained -0.30% at a time when SPY gained -0.30%. A starting capital of $100,000 at inception on 1/2/2009 would have grown to $582,141 which includes $2,930 cash and excludes $17,699 spent on fees and slippage. |
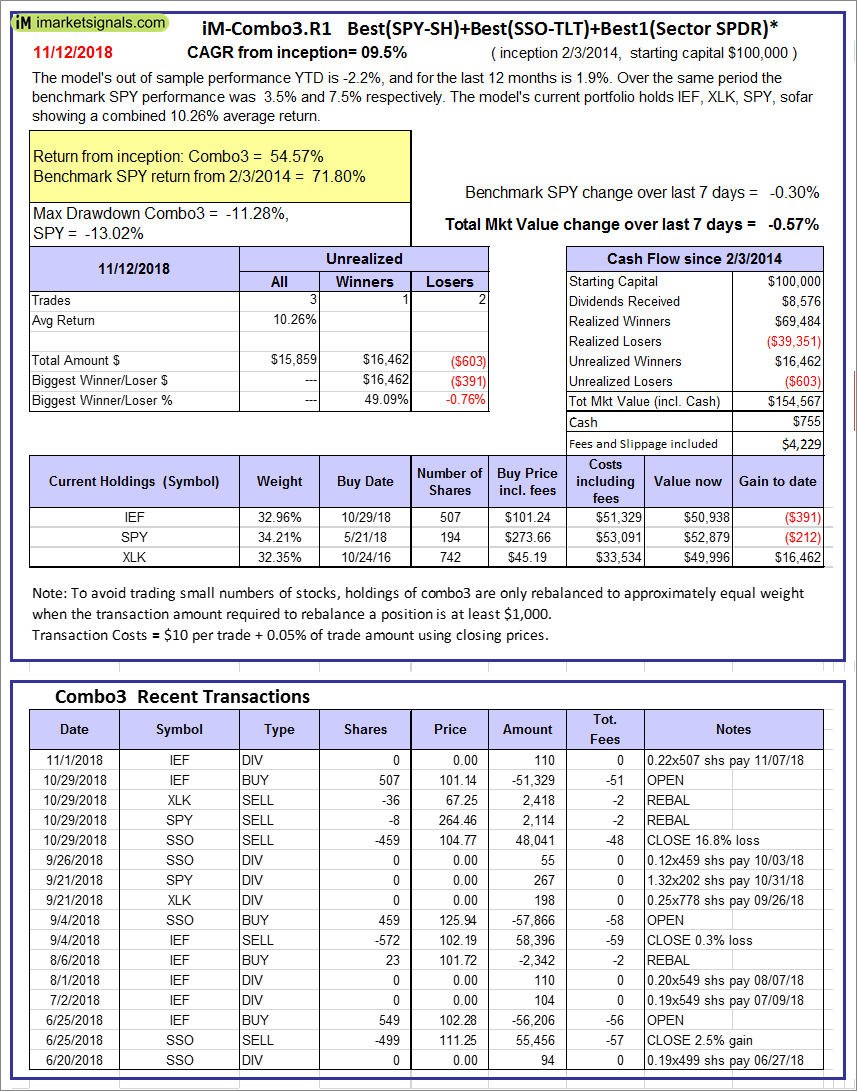 |
iM-Combo3.R1: The model’s out of sample performance YTD is -2.2%, and for the last 12 months is 1.9%. Over the same period the benchmark SPY performance was 3.5% and 7.5% respectively. Over the previous week the market value of iM-Combo3.R1 gained -0.57% at a time when SPY gained -0.30%. A starting capital of $100,000 at inception on 2/3/2014 would have grown to $154,567 which includes $755 cash and excludes $4,229 spent on fees and slippage. |
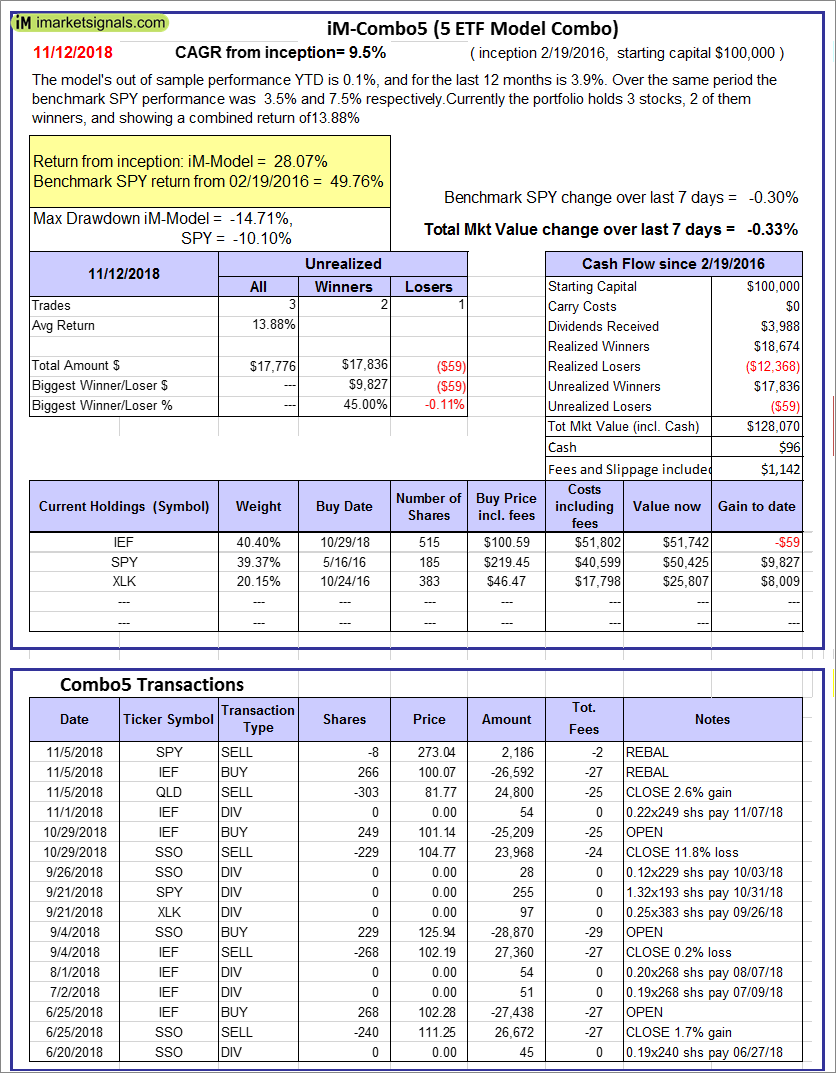 |
iM-Combo5: The model’s out of sample performance YTD is 0.1%, and for the last 12 months is 3.9%. Over the same period the benchmark SPY performance was 3.5% and 7.5% respectively. Over the previous week the market value of iM-Combo5 gained -0.33% at a time when SPY gained -0.30%. A starting capital of $100,000 at inception on 2/22/2016 would have grown to $128,070 which includes $96 cash and excludes $1,142 spent on fees and slippage. |
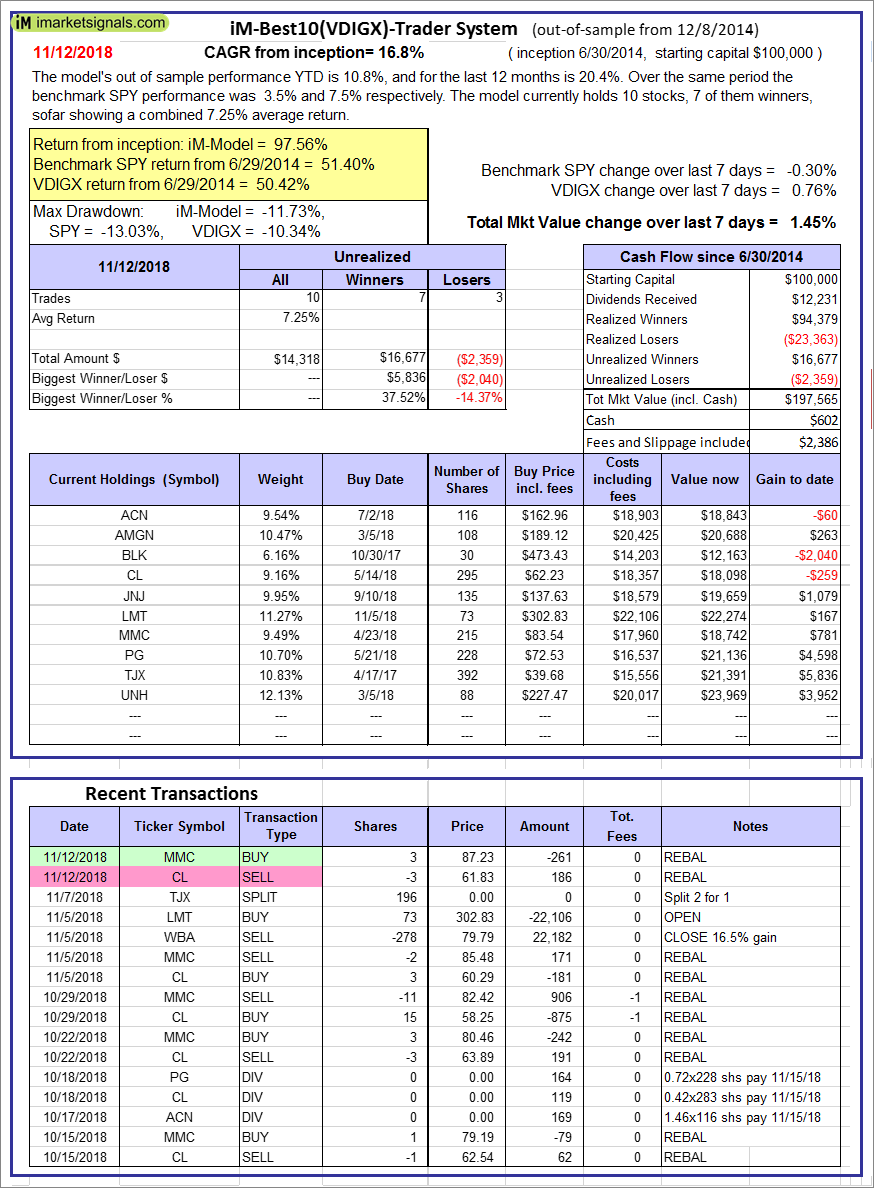 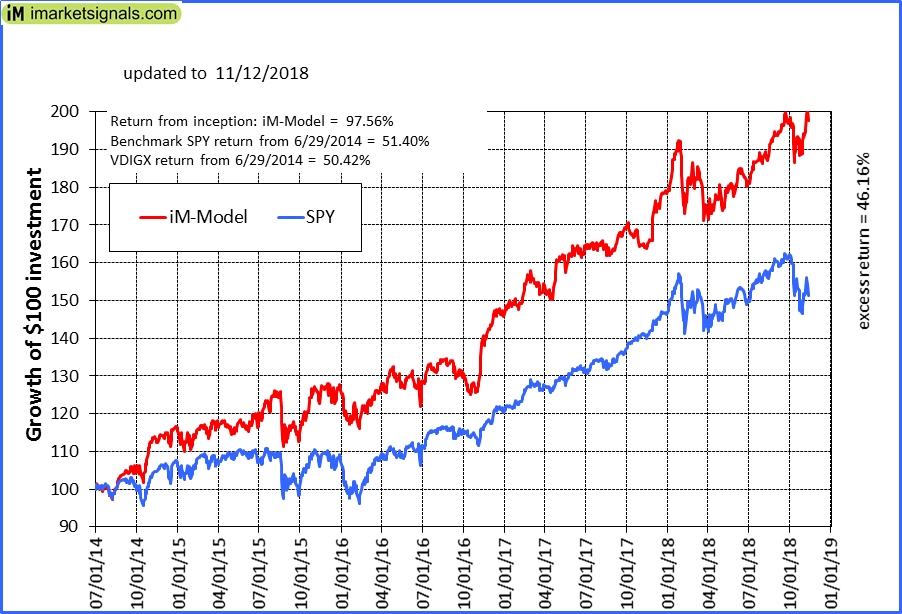 |
iM-Best10(VDIGX)-Trader: The model’s out of sample performance YTD is 10.8%, and for the last 12 months is 20.4%. Over the same period the benchmark SPY performance was 3.5% and 7.5% respectively. Since inception, on 7/1/2014, the model gained 97.56% while the benchmark SPY gained 51.40% and VDIGX gained 50.42% over the same period. Over the previous week the market value of iM-Best10(VDIGX) gained 1.45% at a time when SPY gained -0.30%. A starting capital of $100,000 at inception on 7/1/2014 would have grown to $197,565 which includes $602 cash and excludes $2,386 spent on fees and slippage. |
 |
iM-BESTOGA-3: The model’s out of sample performance YTD is -26.4%, and for the last 12 months is -22.5%. Over the same period the benchmark SPY performance was 3.5% and 7.5% respectively. Over the previous week the market value of iM-BESTOGA-3 gained -1.85% at a time when SPY gained -0.30%. A starting capital of $100,000 at inception on 2/3/2014 would have grown to $170,643 which includes $53,075 cash and excludes $3,270 spent on fees and slippage. |
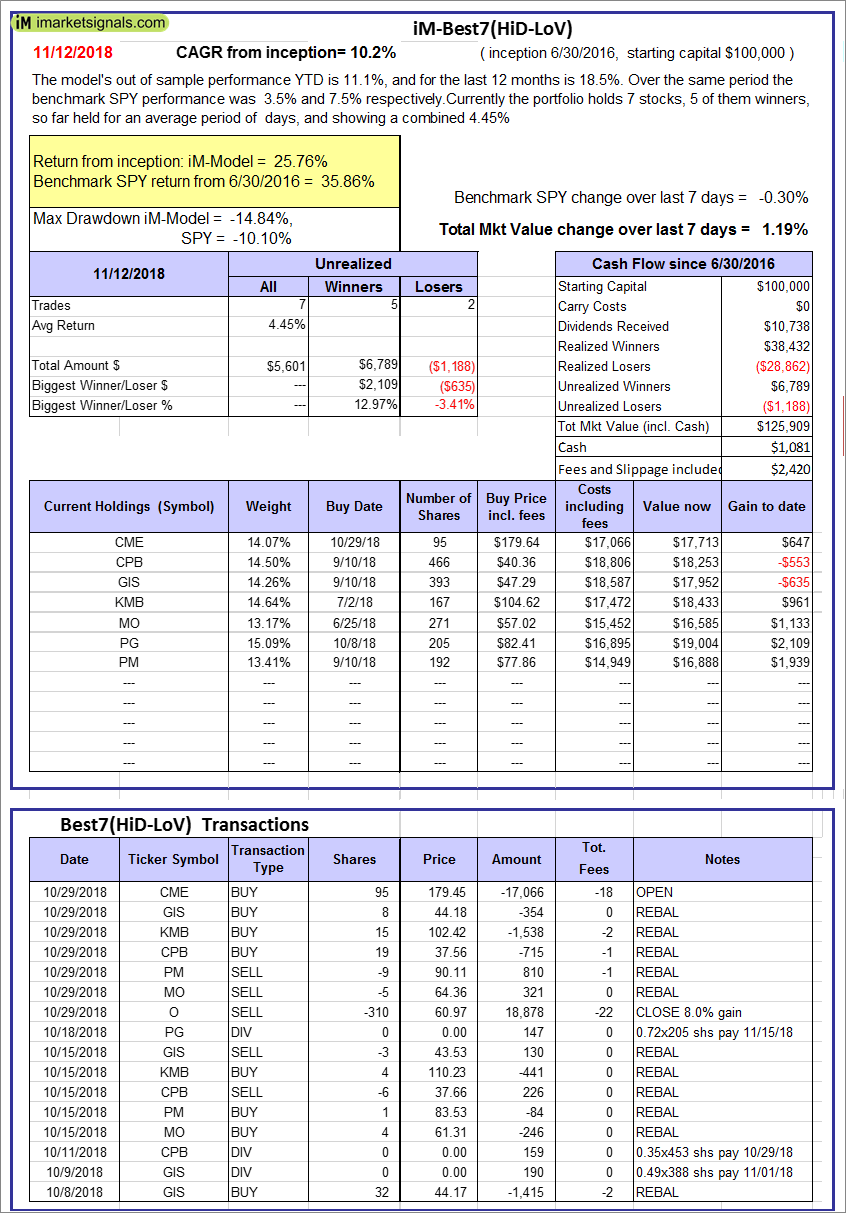 |
iM-Best7(HiD-LoV): The model’s out of sample performance YTD is 11.1%, and for the last 12 months is 18.5%. Over the same period the benchmark SPY performance was 3.5% and 7.5% respectively. Over the previous week the market value of iM-BESTOGA-3 gained 1.19% at a time when SPY gained -0.30%. A starting capital of $100,000 at inception on 6/30/2016 would have grown to $125,909 which includes $1,081 cash and excludes $2,420 spent on fees and slippage. |
 |
iM 6-Stock Capital Strength Portfolio: The model’s out of sample performance YTD is 5.0%, and for the last 12 months is 13.1%. Over the same period the benchmark SPY performance was 3.5% and 7.5% respectively. Over the previous week the market value of the iM 6-Stock Capital Strength Portfolio gained -0.04% at a time when SPY gained -0.30%. A starting capital of $100,000 at inception on 10/28/2016 would have grown to $159,234 which includes $967 cash and excludes $790 spent on fees and slippage. |
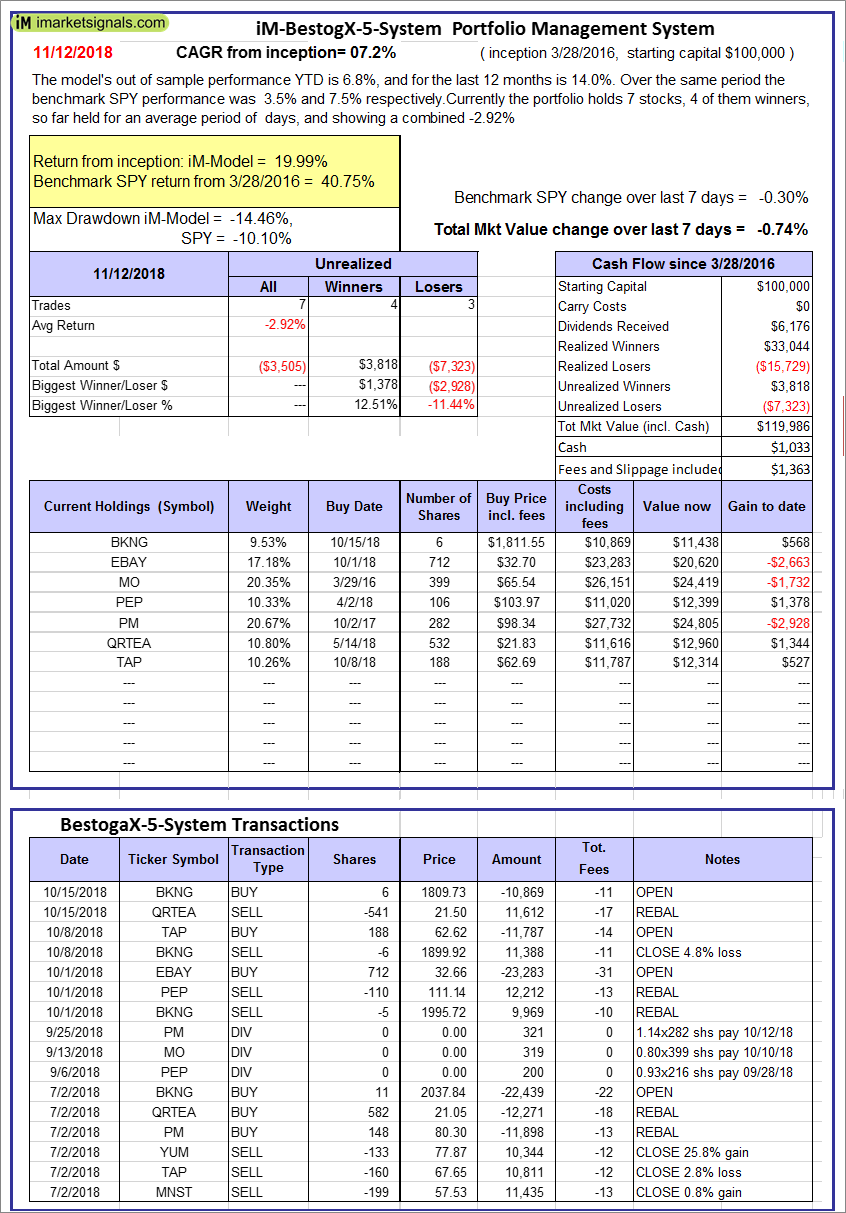 |
iM-BestogaX5-System: The model’s out of sample performance YTD is 6.8%, and for the last 12 months is 14.0%. Over the same period the benchmark SPY performance was 3.5% and 7.5% respectively. Over the previous week the market value of iM-BestogaX5-System gained -0.74% at a time when SPY gained -0.30%. A starting capital of $100,000 at inception on 3/28/2016 would have grown to $119,986 which includes $1,033 cash and excludes $1,363 spent on fees and slippage. |
 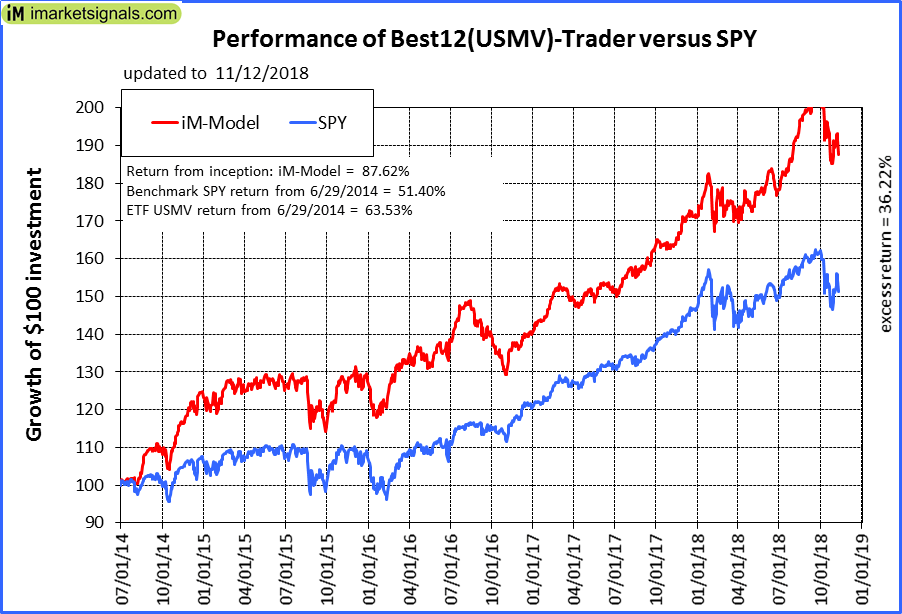 |
iM-Best12(USMV)-Trader: The model’s out of sample performance YTD is 9.7%, and for the last 12 months is 14.6%. Over the same period the benchmark SPY performance was 3.5% and 7.5% respectively. Since inception, on 6/30/2014, the model gained 87.62% while the benchmark SPY gained 51.40% and the ETF USMV gained 63.53% over the same period. Over the previous week the market value of iM-Best12(USMV)-Trader gained -1.29% at a time when SPY gained -0.30%. A starting capital of $100,000 at inception on 6/30/2014 would have grown to $187,616 which includes $448 cash and excludes $4,709 spent on fees and slippage. |
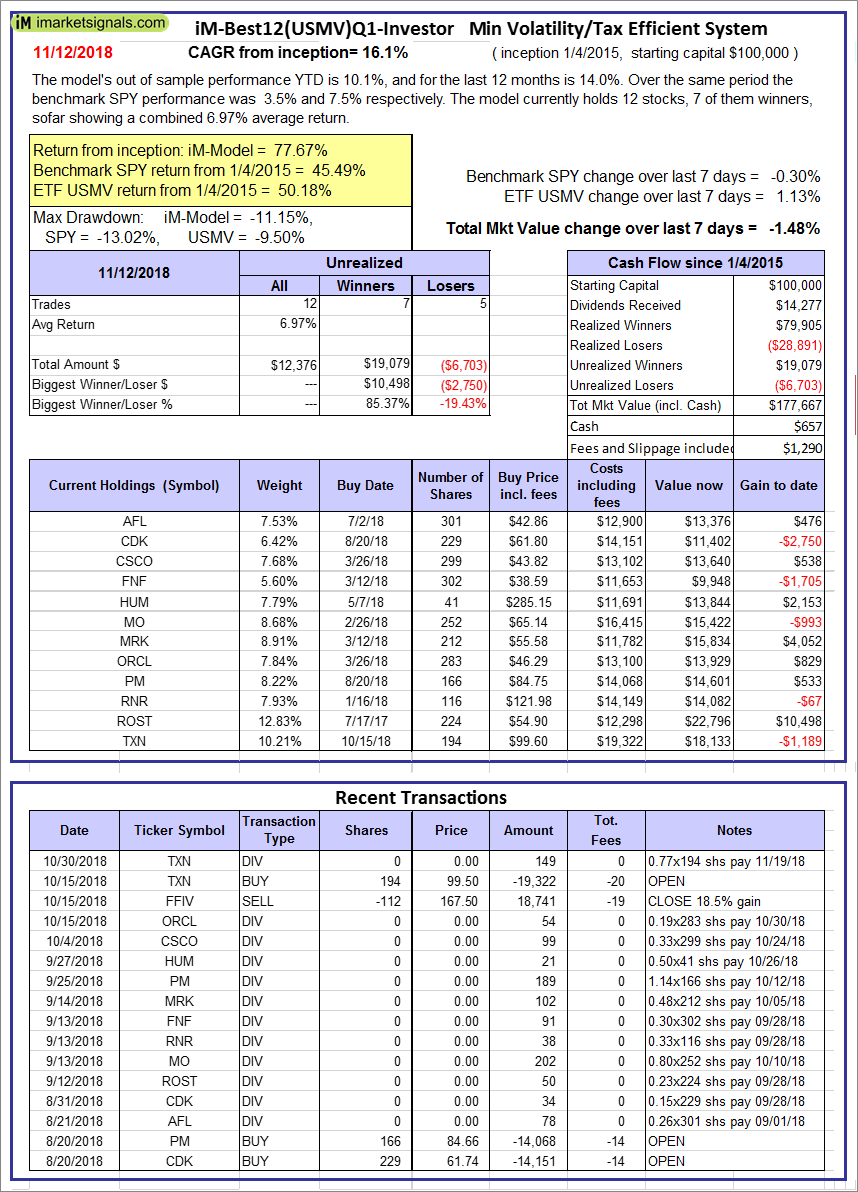  |
iM-Best12(USMV)Q1-Investor: The model’s out of sample performance YTD is 10.1%, and for the last 12 months is 14.0%. Over the same period the benchmark SPY performance was 3.5% and 7.5% respectively. Since inception, on 1/5/2015, the model gained 77.67% while the benchmark SPY gained 45.49% and the ETF USMV gained 50.18% over the same period. Over the previous week the market value of iM-Best12(USMV)Q1 gained -1.48% at a time when SPY gained -0.30%. A starting capital of $100,000 at inception on 1/5/2015 would have grown to $177,667 which includes $657 cash and excludes $1,290 spent on fees and slippage. |
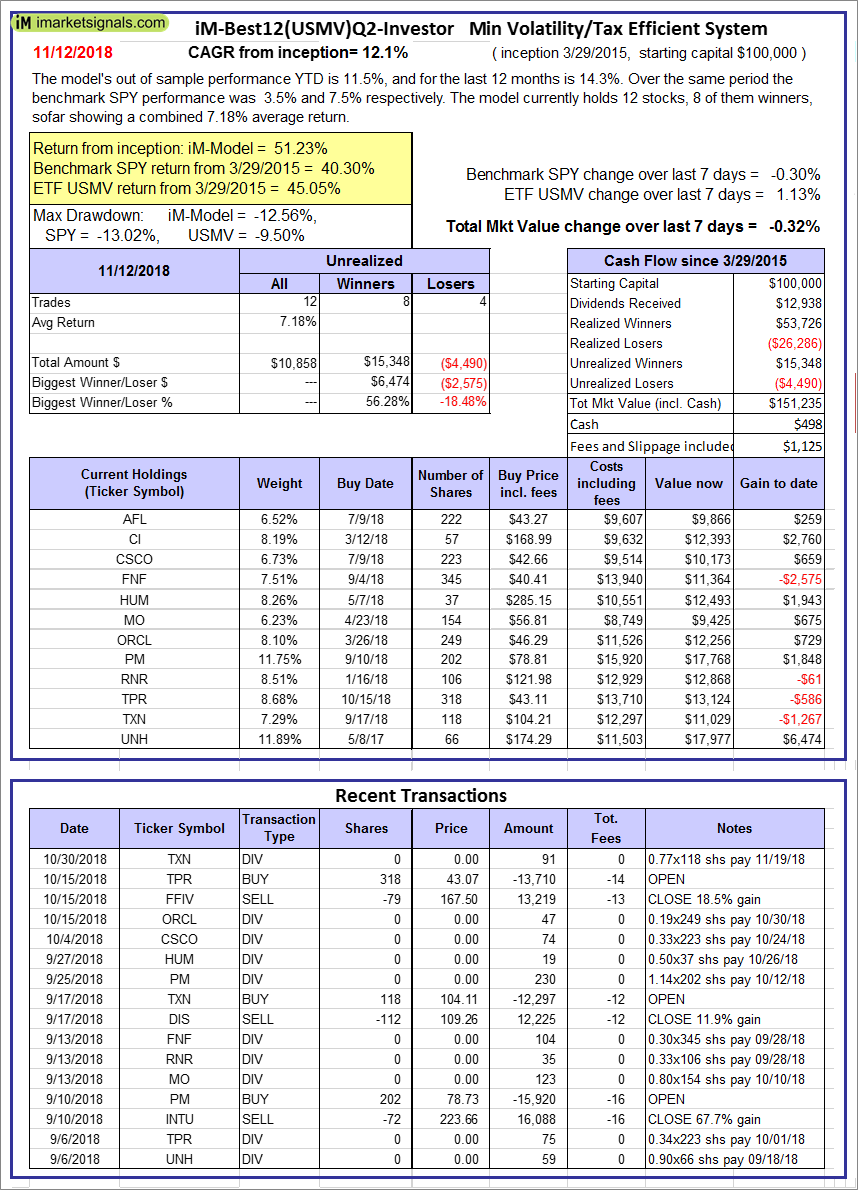 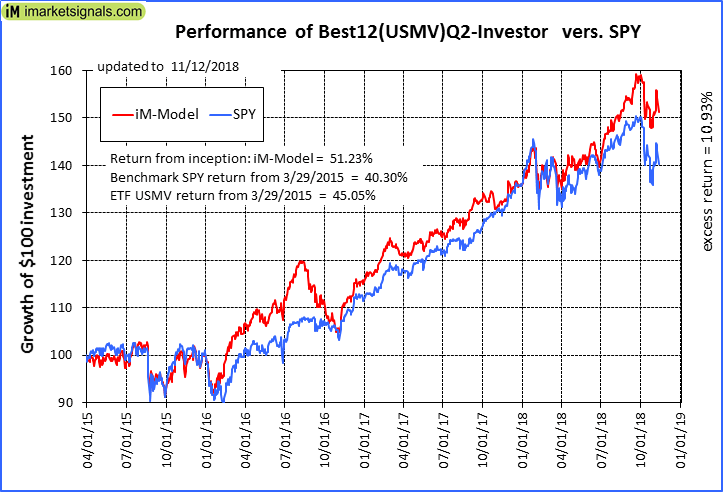 |
iM-Best12(USMV)Q2-Investor: The model’s out of sample performance YTD is 11.5%, and for the last 12 months is 14.3%. Over the same period the benchmark SPY performance was 3.5% and 7.5% respectively. Since inception, on 3/30/2015, the model gained 51.23% while the benchmark SPY gained 40.30% and the ETF USMV gained 45.05% over the same period. Over the previous week the market value of iM-Best12(USMV)Q2 gained -0.32% at a time when SPY gained -0.30%. A starting capital of $100,000 at inception on 3/30/2015 would have grown to $151,235 which includes $498 cash and excludes $1,125 spent on fees and slippage. |
  |
iM-Best12(USMV)Q3-Investor: The model’s out of sample performance YTD is 2.4%, and for the last 12 months is 7.3%. Over the same period the benchmark SPY performance was 3.5% and 7.5% respectively. Since inception, on 7/1/2014, the model gained 82.00% while the benchmark SPY gained 51.40% and the ETF USMV gained 63.53% over the same period. Over the previous week the market value of iM-Best12(USMV)Q3 gained -1.18% at a time when SPY gained -0.30%. A starting capital of $100,000 at inception on 7/1/2014 would have grown to $181,999 which includes $772 cash and excludes $1,653 spent on fees and slippage. |
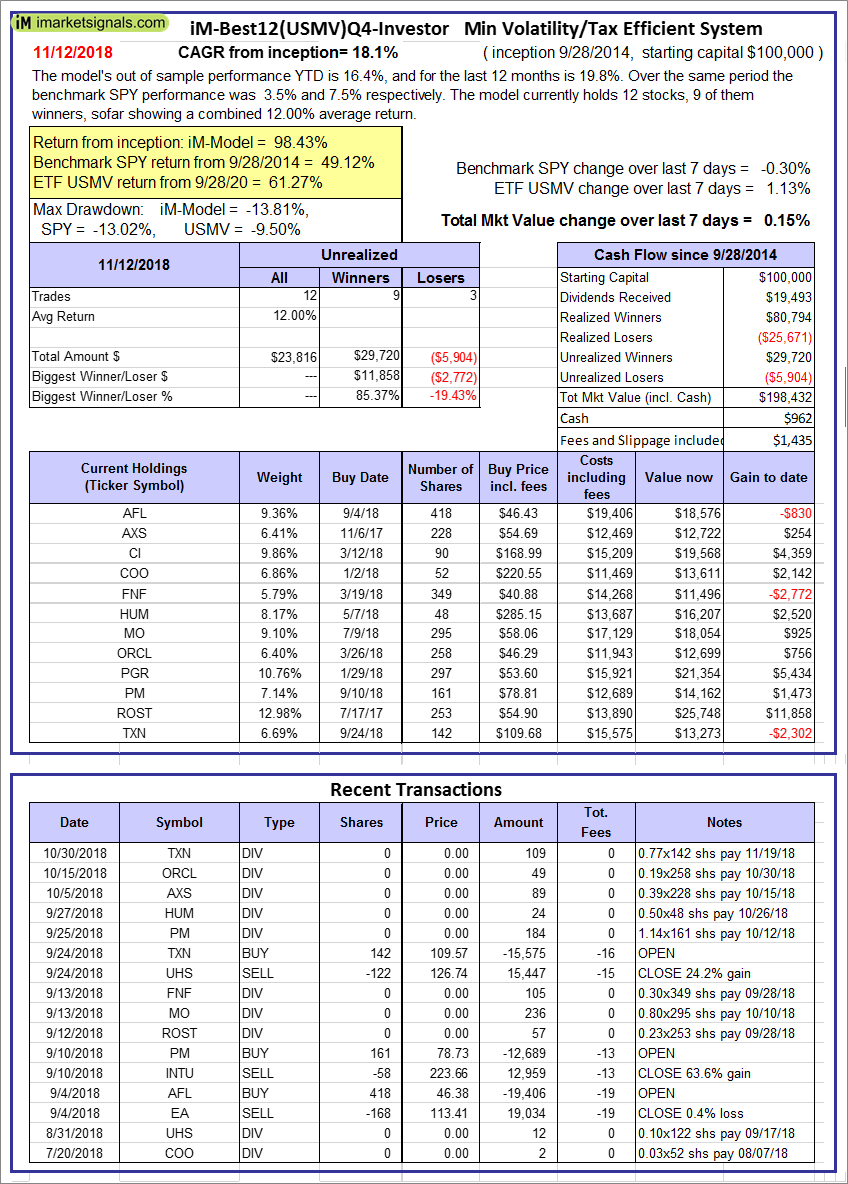 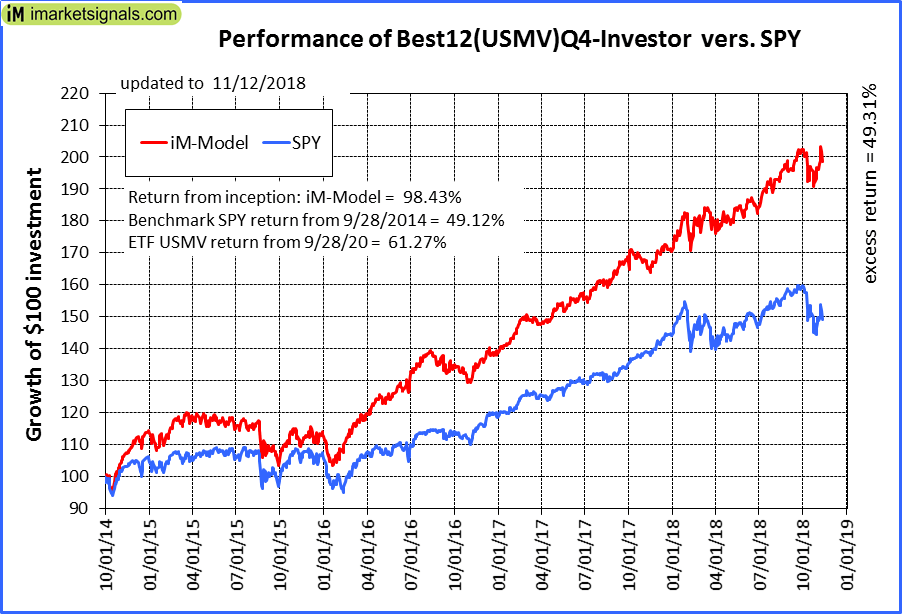 |
iM-Best12(USMV)Q4-Investor: Since inception, on 9/29/2014, the model gained 98.43% while the benchmark SPY gained 49.12% and the ETF USMV gained 61.27% over the same period. Over the previous week the market value of iM-Best12(USMV)Q4 gained 0.15% at a time when SPY gained -0.30%. A starting capital of $100,000 at inception on 9/29/2014 would have grown to $198,432 which includes $962 cash and excludes $1,435 spent on fees and slippage. |
 |
Average Performance of iM-Best12(USMV)Q1+Q2+Q3+Q4-Investor resulted in an excess return of 48.33% over SPY. (see iM-USMV Investor Portfolio) |
 |
iM-Best(Short): The model’s out of sample performance YTD is -3.4%, and for the last 12 months is -4.1%. Over the same period the benchmark SPY performance was 3.5% and 7.5% respectively. Over the previous week the market value of iM-Best(Short) gained 1.96% at a time when SPY gained -0.30%. Over the period 1/2/2009 to 11/12/2018 the starting capital of $100,000 would have grown to $88,090 which includes $88,090 cash and excludes $24,801 spent on fees and slippage. |
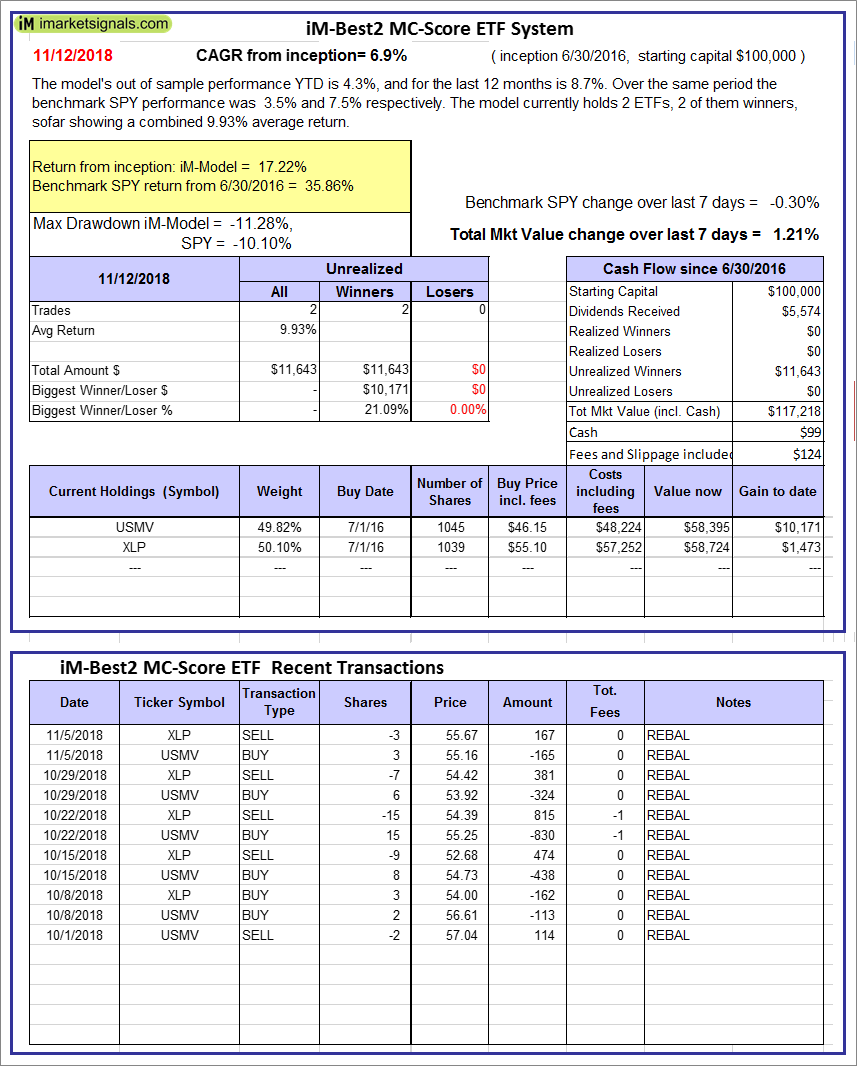 |
iM-Best2 MC-Score ETF System: The model’s out of sample performance YTD is 4.3%, and for the last 12 months is 8.7%. Over the same period the benchmark SPY performance was 3.5% and 7.5% respectively. Over the previous week the market value of the iM-Best2 MC-Score ETF System gained 1.21% at a time when SPY gained -0.30%. A starting capital of $100,000 at inception on 6/30/2016 would have grown to $117,218 which includes $99 cash and excludes $124 spent on fees and slippage. |
 |
iM-Best4 MC-Score Vanguard System: The model’s out of sample performance YTD is 1.8%, and for the last 12 months is 3.4%. Over the same period the benchmark SPY performance was 3.5% and 7.5% respectively. Over the previous week the market value of the iM-Best4 MC-Score Vanguard System gained 1.13% at a time when SPY gained -0.30%. A starting capital of $100,000 at inception on 6/30/2016 would have grown to $112,796 which includes $5,697 cash and excludes $00 spent on fees and slippage. |
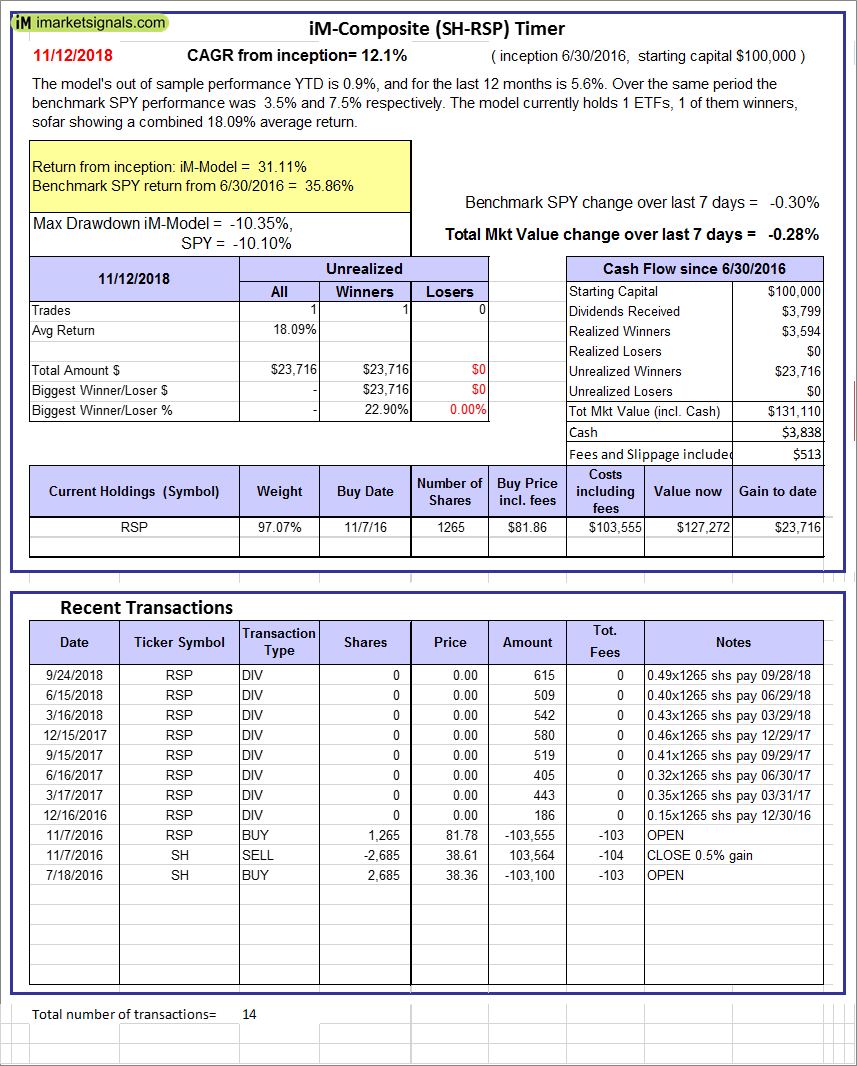 |
iM-Composite (SH-RSP) Timer: The model’s out of sample performance YTD is 0.9%, and for the last 12 months is 5.6%. Over the same period the benchmark SPY performance was 3.5% and 7.5% respectively. Over the previous week the market value of the iM-Composite (SH-RSP) Timer gained -0.28% at a time when SPY gained -0.30%. A starting capital of $100,000 at inception on 6/30/2016 would have grown to $131,110 which includes $3,838 cash and excludes $513 spent on fees and slippage. |
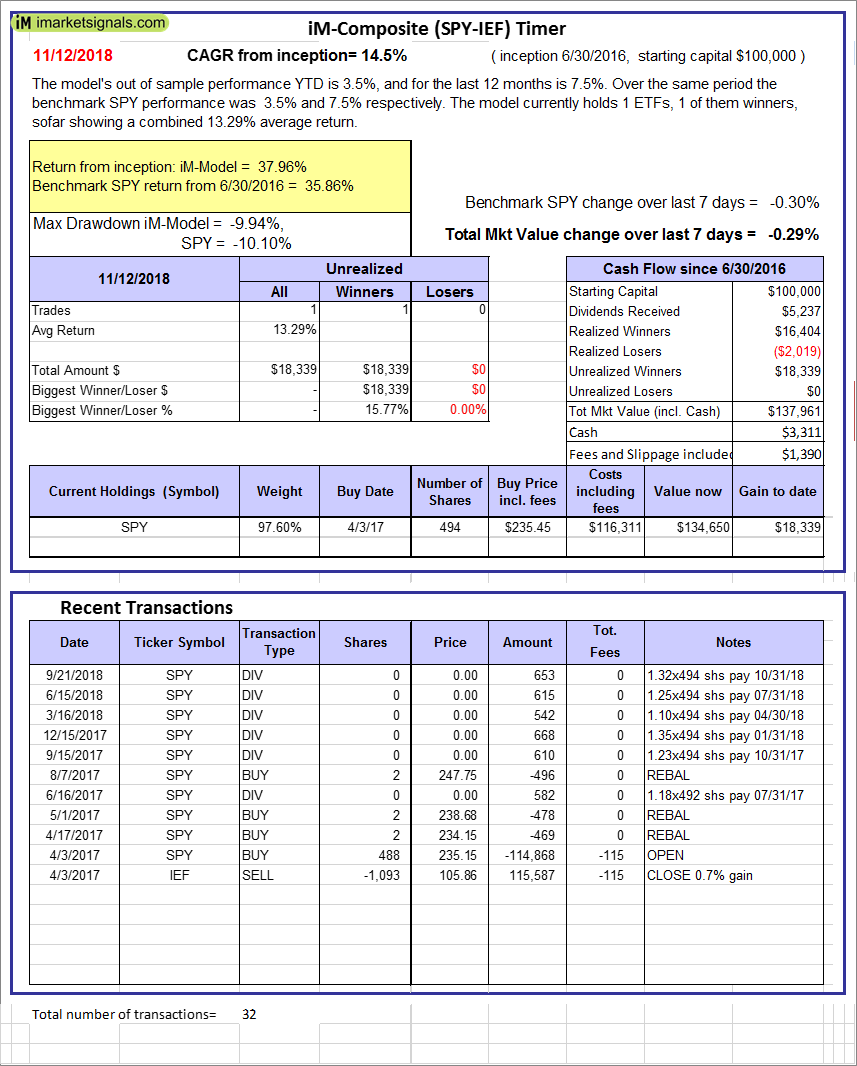 |
iM-Composite (SPY-IEF) Timer: The model’s out of sample performance YTD is 3.5%, and for the last 12 months is 7.5%. Over the same period the benchmark SPY performance was 3.5% and 7.5% respectively. Over the previous week the market value of the iM-Composite (SPY-IEF) Timer gained -0.29% at a time when SPY gained -0.30%. A starting capital of $100,000 at inception on 6/30/2016 would have grown to $137,961 which includes $3,311 cash and excludes $1,390 spent on fees and slippage. |
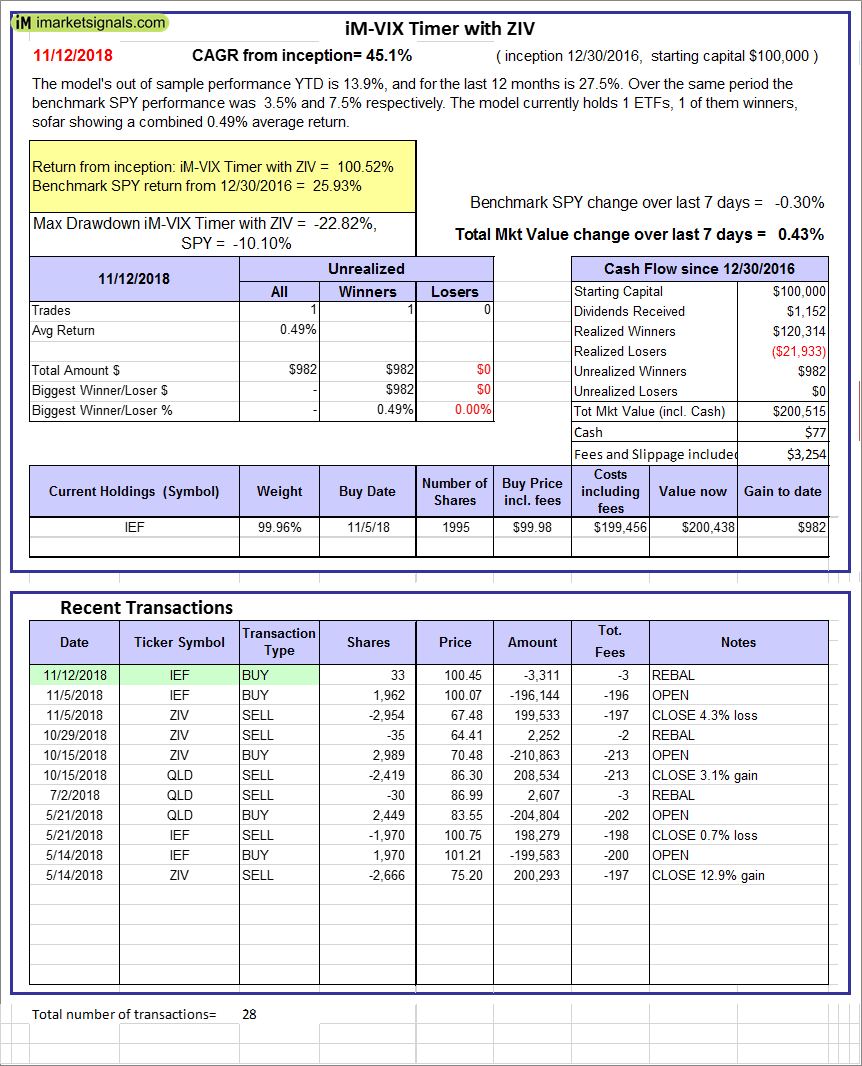 |
iM-VIX Timer with ZIV: The model’s out of sample performance YTD is 13.9%, and for the last 12 months is 27.5%. Over the same period the benchmark SPY performance was 3.5% and 7.5% respectively. Over the previous week the market value of the iM-VIX Timer with ZIV gained 0.43% at a time when SPY gained -0.30%. A starting capital of $100,000 at inception on 6/30/2016 would have grown to $200,515 which includes $77 cash and excludes $3,254 spent on fees and slippage. |
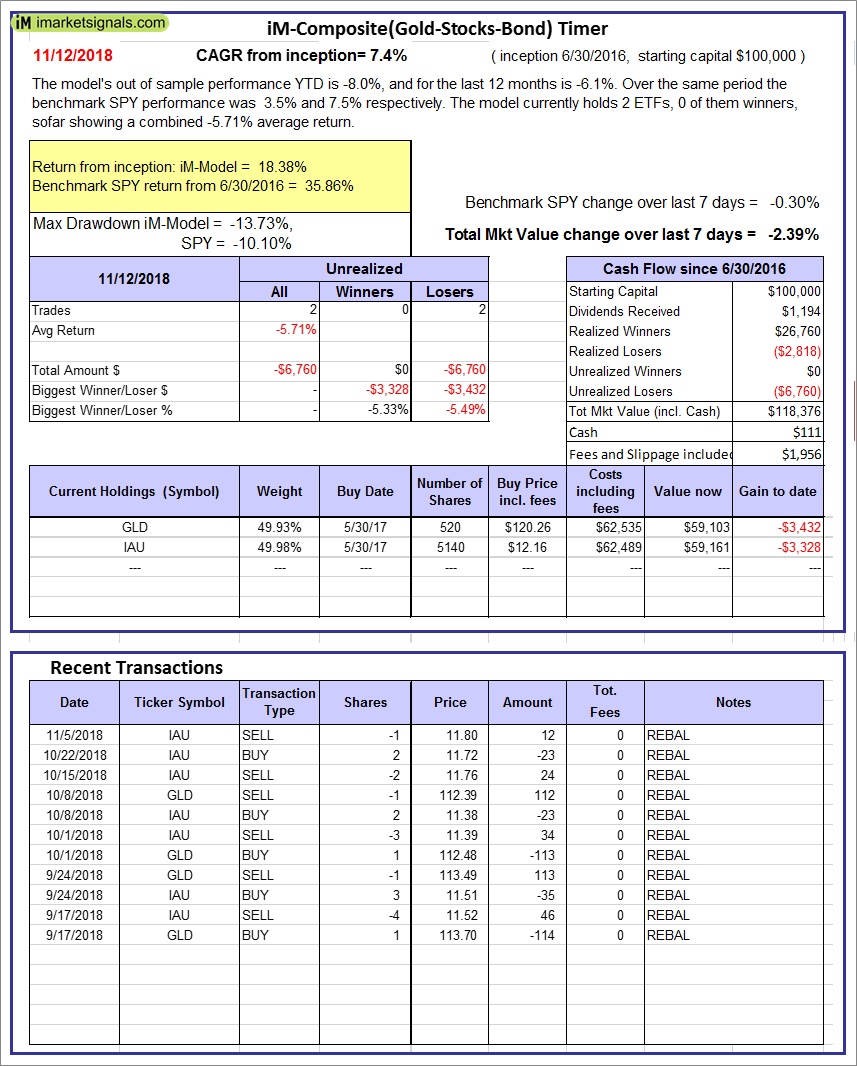 |
iM-Composite(Gold-Stocks-Bond) Timer: The model’s out of sample performance YTD is -8.0%, and for the last 12 months is -6.1%. Over the same period the benchmark SPY performance was 3.5% and 7.5% respectively. Over the previous week the market value of the iM-Composite(Gold-Stocks-Bond) Timer gained -2.39% at a time when SPY gained -0.30%. A starting capital of $100,000 at inception on 6/30/2016 would have grown to $118,376 which includes $111 cash and excludes $1,956 spent on fees and slippage. |
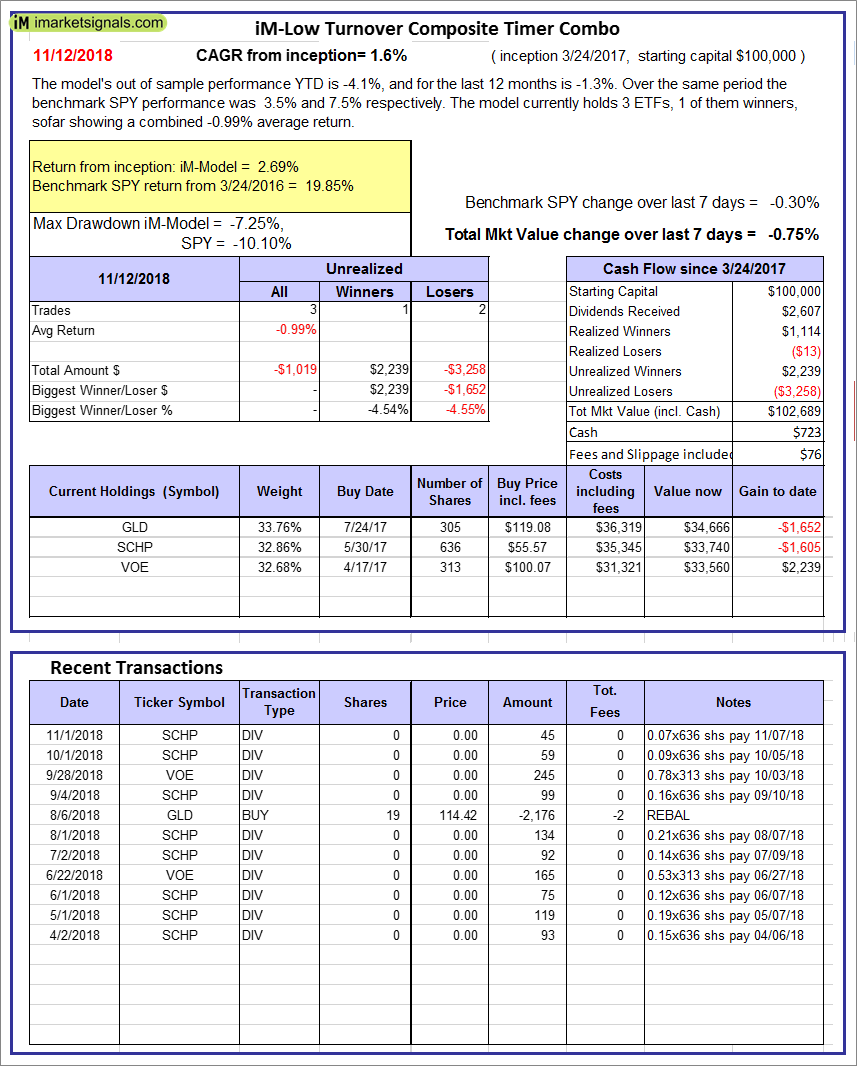 |
iM-Low Turnover Composite Timer Combo: The model’s out of sample performance YTD is -4.1%, and for the last 12 months is -1.3%. Over the same period the benchmark SPY performance was 3.5% and 7.5% respectively. Over the previous week the market value of the iM-Low Turnover Composite Timer Combo gained -0.75% at a time when SPY gained -0.30%. A starting capital of $100,000 at inception on 3/24/27 would have grown to $102,689 which includes $723 cash and excludes $76 spent on fees and slippage. |
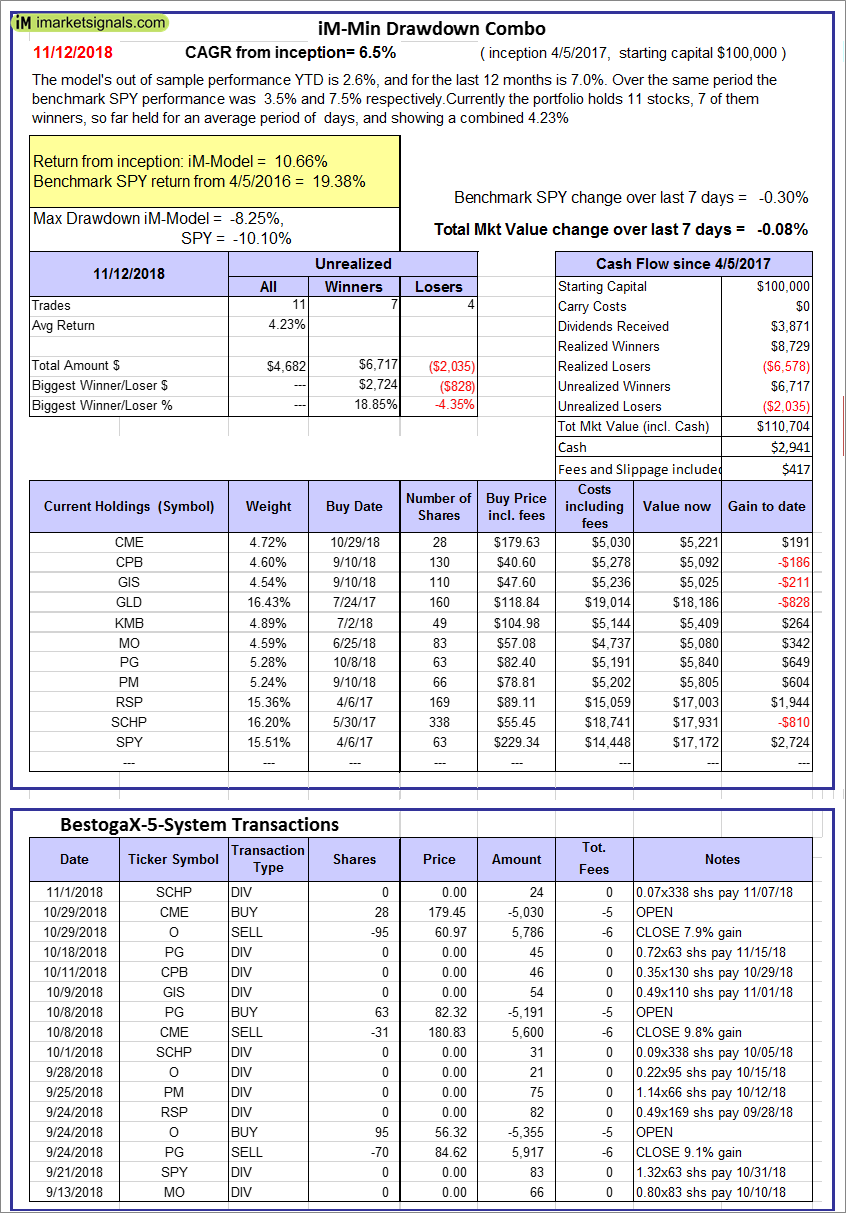 |
iM-Min Drawdown Combo: The model’s out of sample performance YTD is 2.6%, and for the last 12 months is 7.0%. Over the same period the benchmark SPY performance was 3.5% and 7.5% respectively. Over the previous week the market value of the iM-Min Drawdown Combo gained -0.08% at a time when SPY gained -0.30%. A starting capital of $100,000 at inception on 4/5/2017 would have grown to $110,704 which includes $2,941 cash and excludes $417 spent on fees and slippage. |
 |
iM-5ETF Trader (includes leveraged ETFs): The model’s out of sample performance YTD is 1.5%, and for the last 12 months is 8.8%. Over the same period the benchmark SPY performance was 3.5% and 7.5% respectively. Over the previous week the market value of the iM-5ETF Trader (includes leveraged ETFs) gained -1.74% at a time when SPY gained -0.30%. A starting capital of $100,000 at inception on 10/30/2016 would have grown to $165,173 which includes $1,874 cash and excludes $1,030 spent on fees and slippage. |
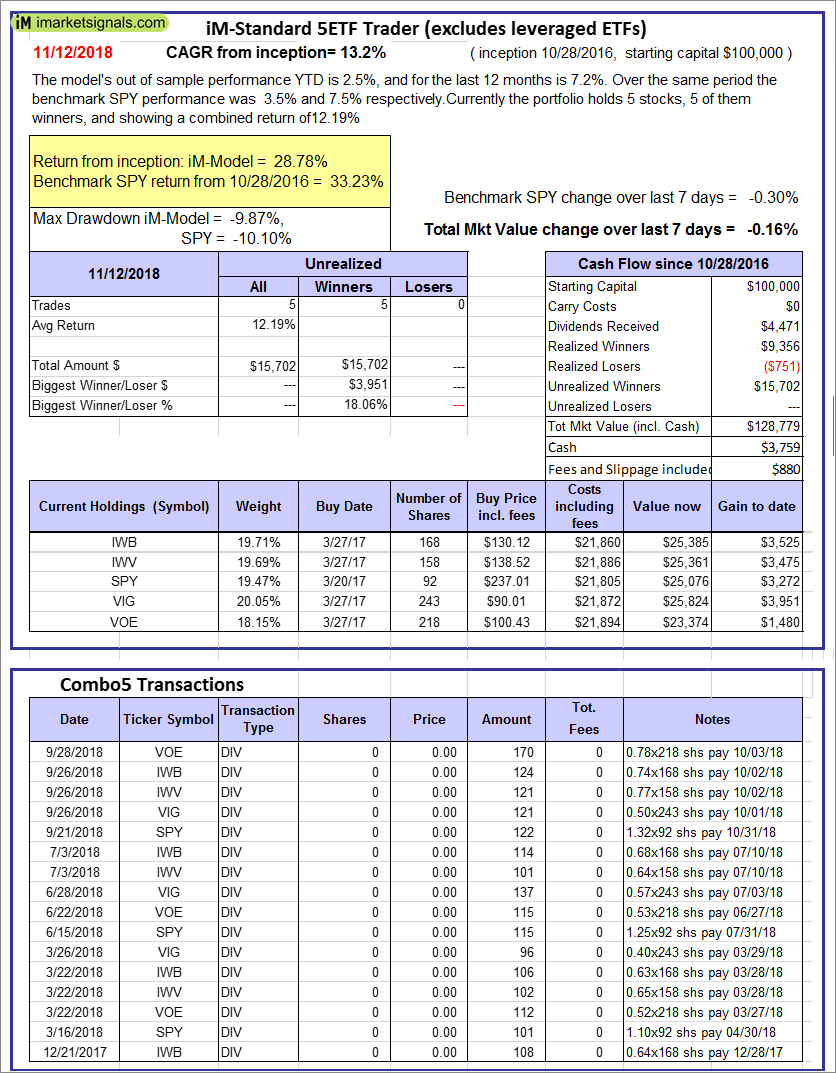 |
iM-Standard 5ETF Trader (excludes leveraged ETFs): The model’s out of sample performance YTD is 2.5%, and for the last 12 months is 7.2%. Over the same period the benchmark SPY performance was 3.5% and 7.5% respectively. Over the previous week the market value of the iM-Standard 5ETF Trader (excludes leveraged ETFs) gained -0.16% at a time when SPY gained -0.30%. A starting capital of $100,000 at inception on 10/30/2016 would have grown to $128,779 which includes $3,759 cash and excludes $880 spent on fees and slippage. |
iM-Best Reports – 11/12/2018
Posted in pmp SPY-SH
Leave a Reply
You must be logged in to post a comment.