
  |
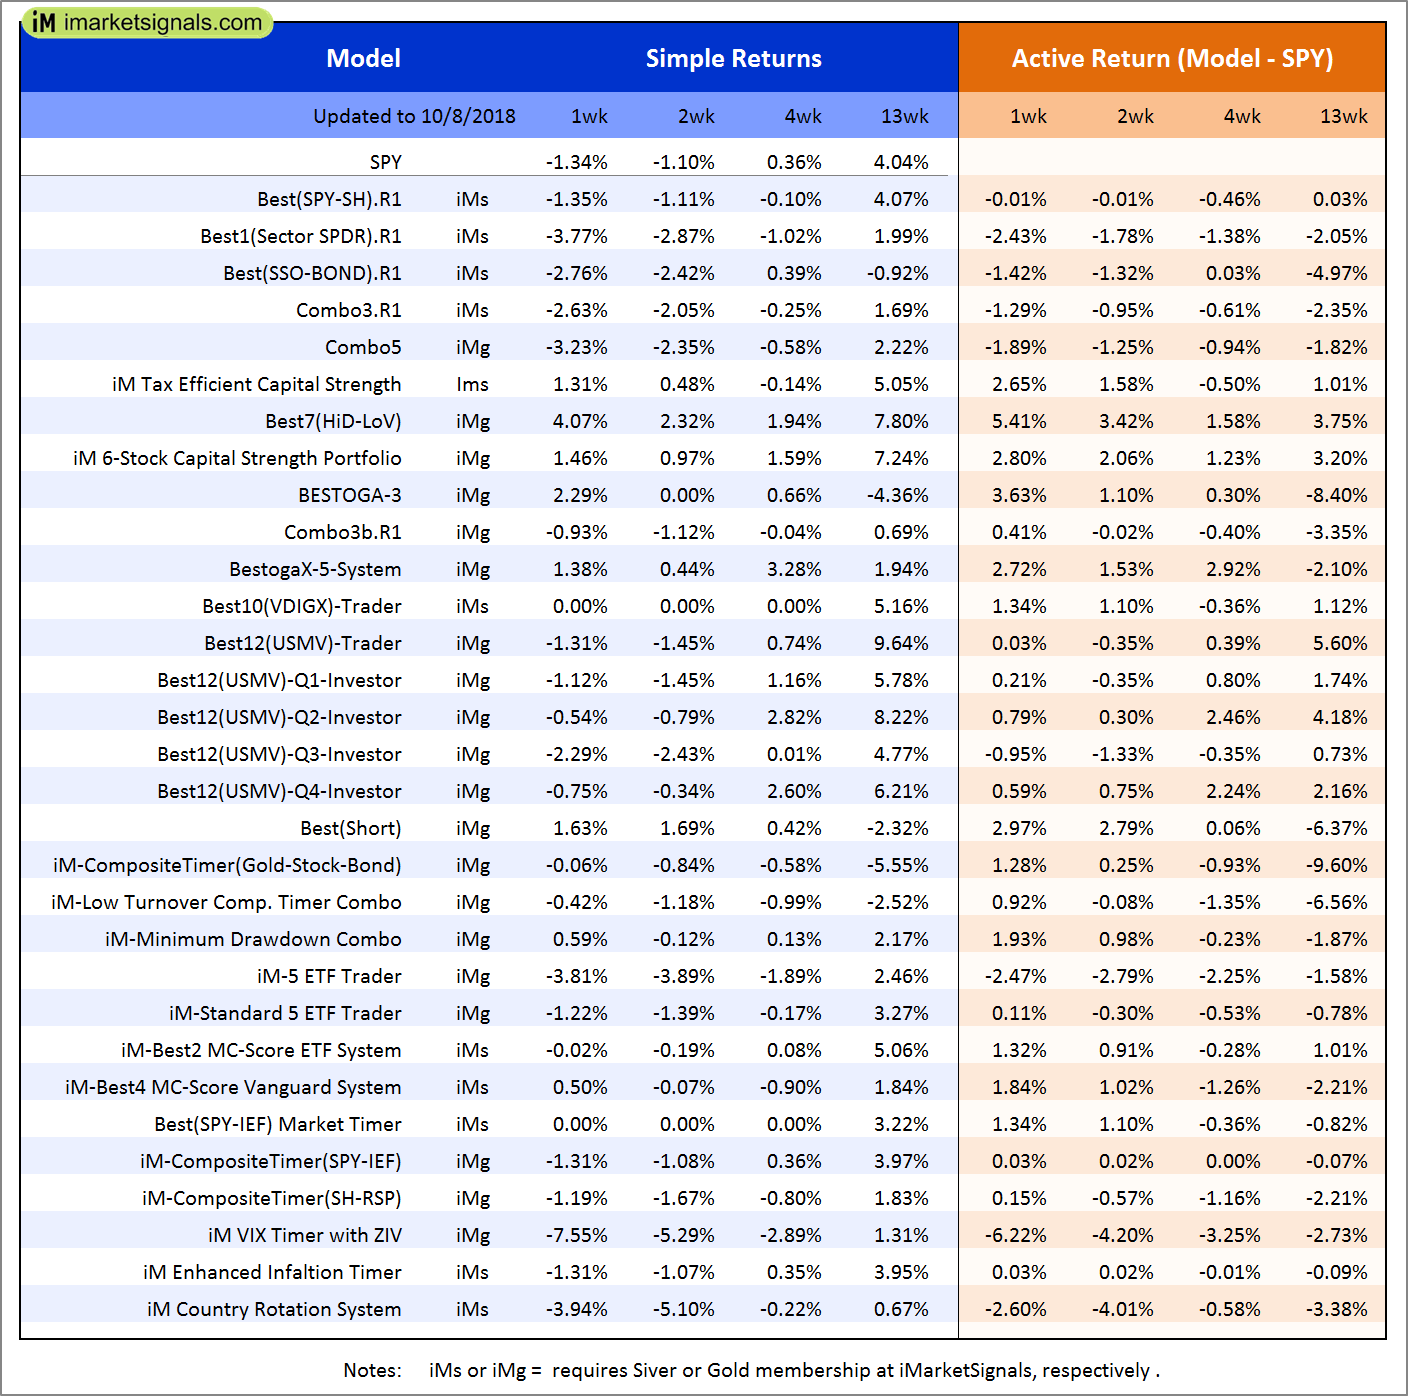
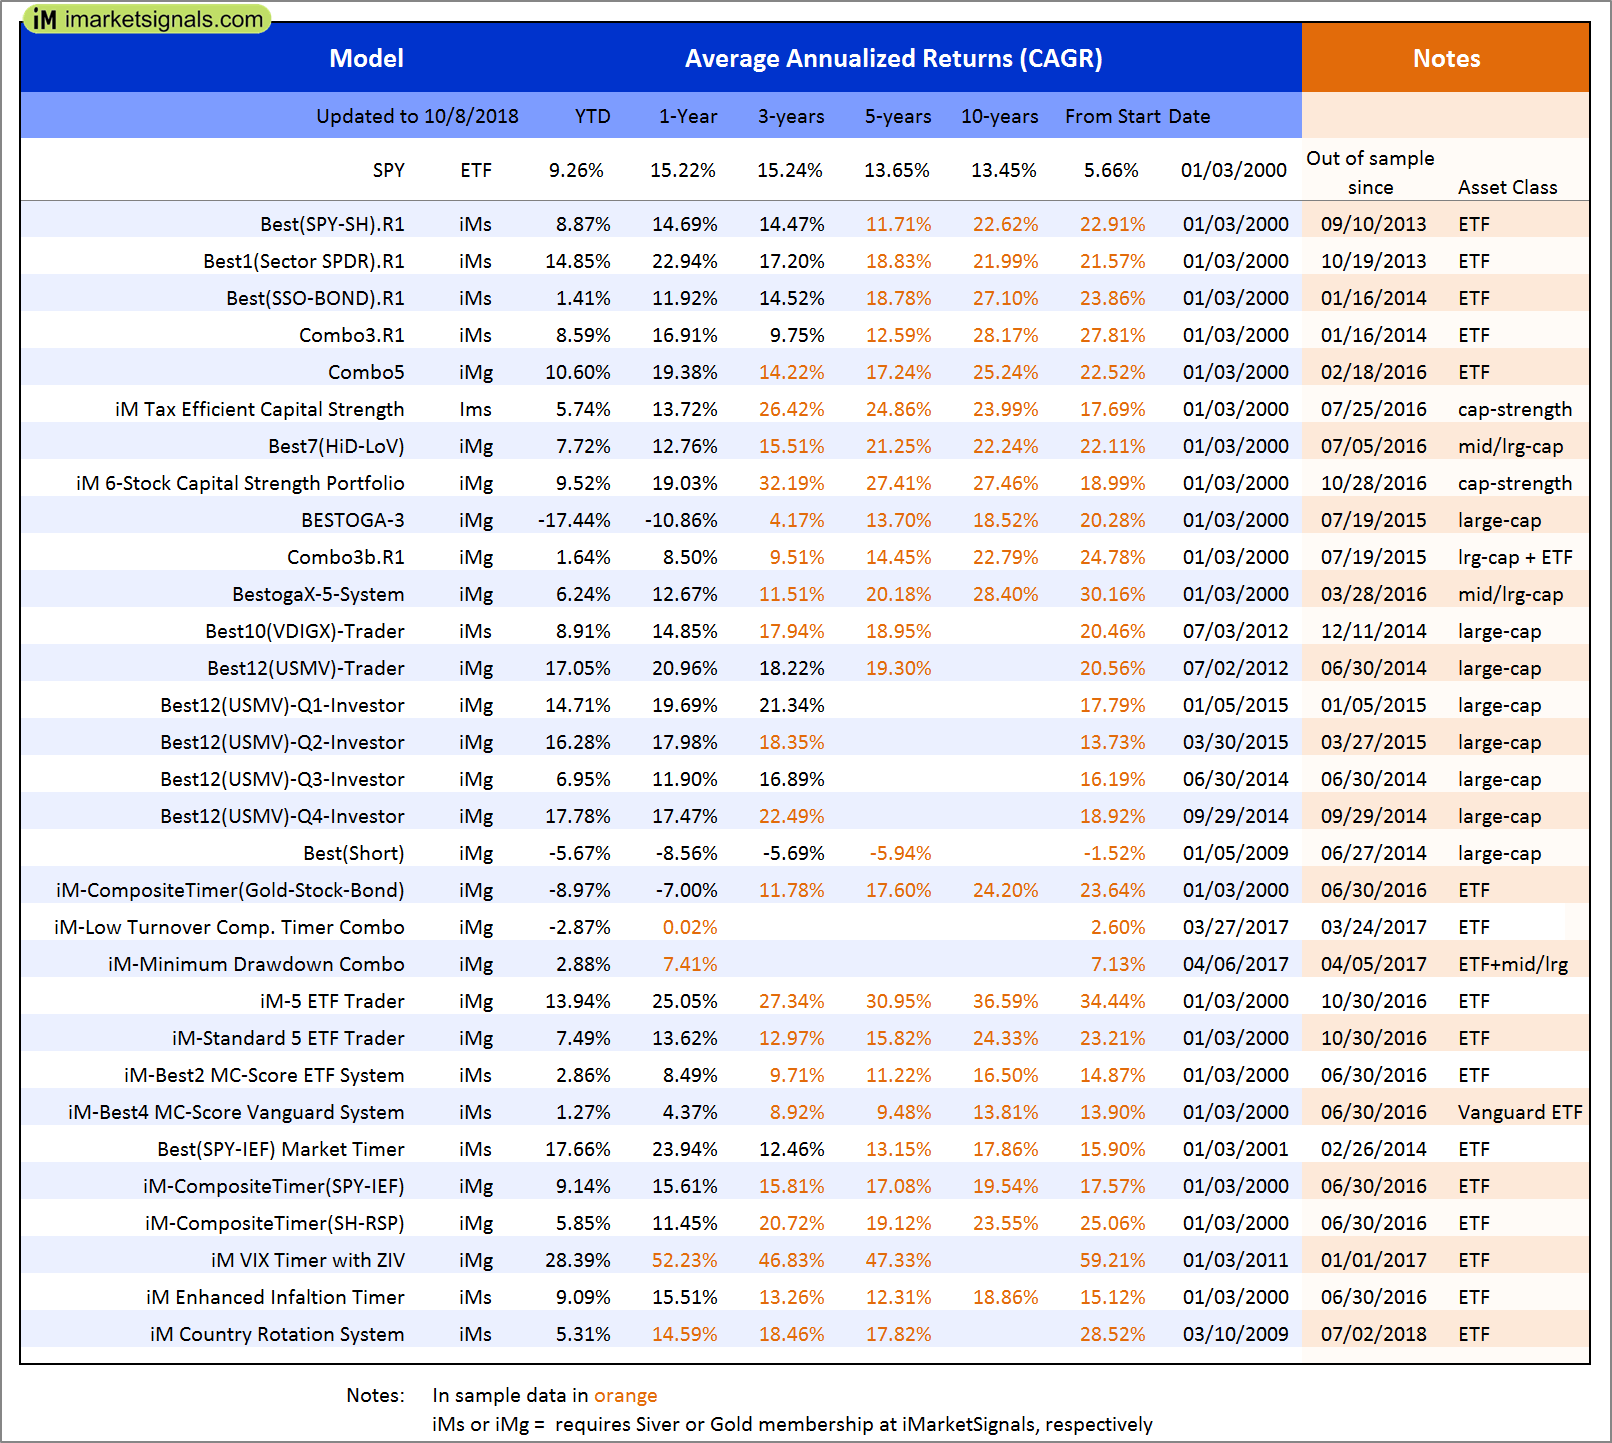
Out of sample performance summary of our models for the past 1, 2, 4 and 13 week periods. The active active return indicates how the models over- or underperformed the benchmark ETF SPY. Also the YTD, and the 1-, 3-, 5- and 10-year annualized returns are shown in the second table |
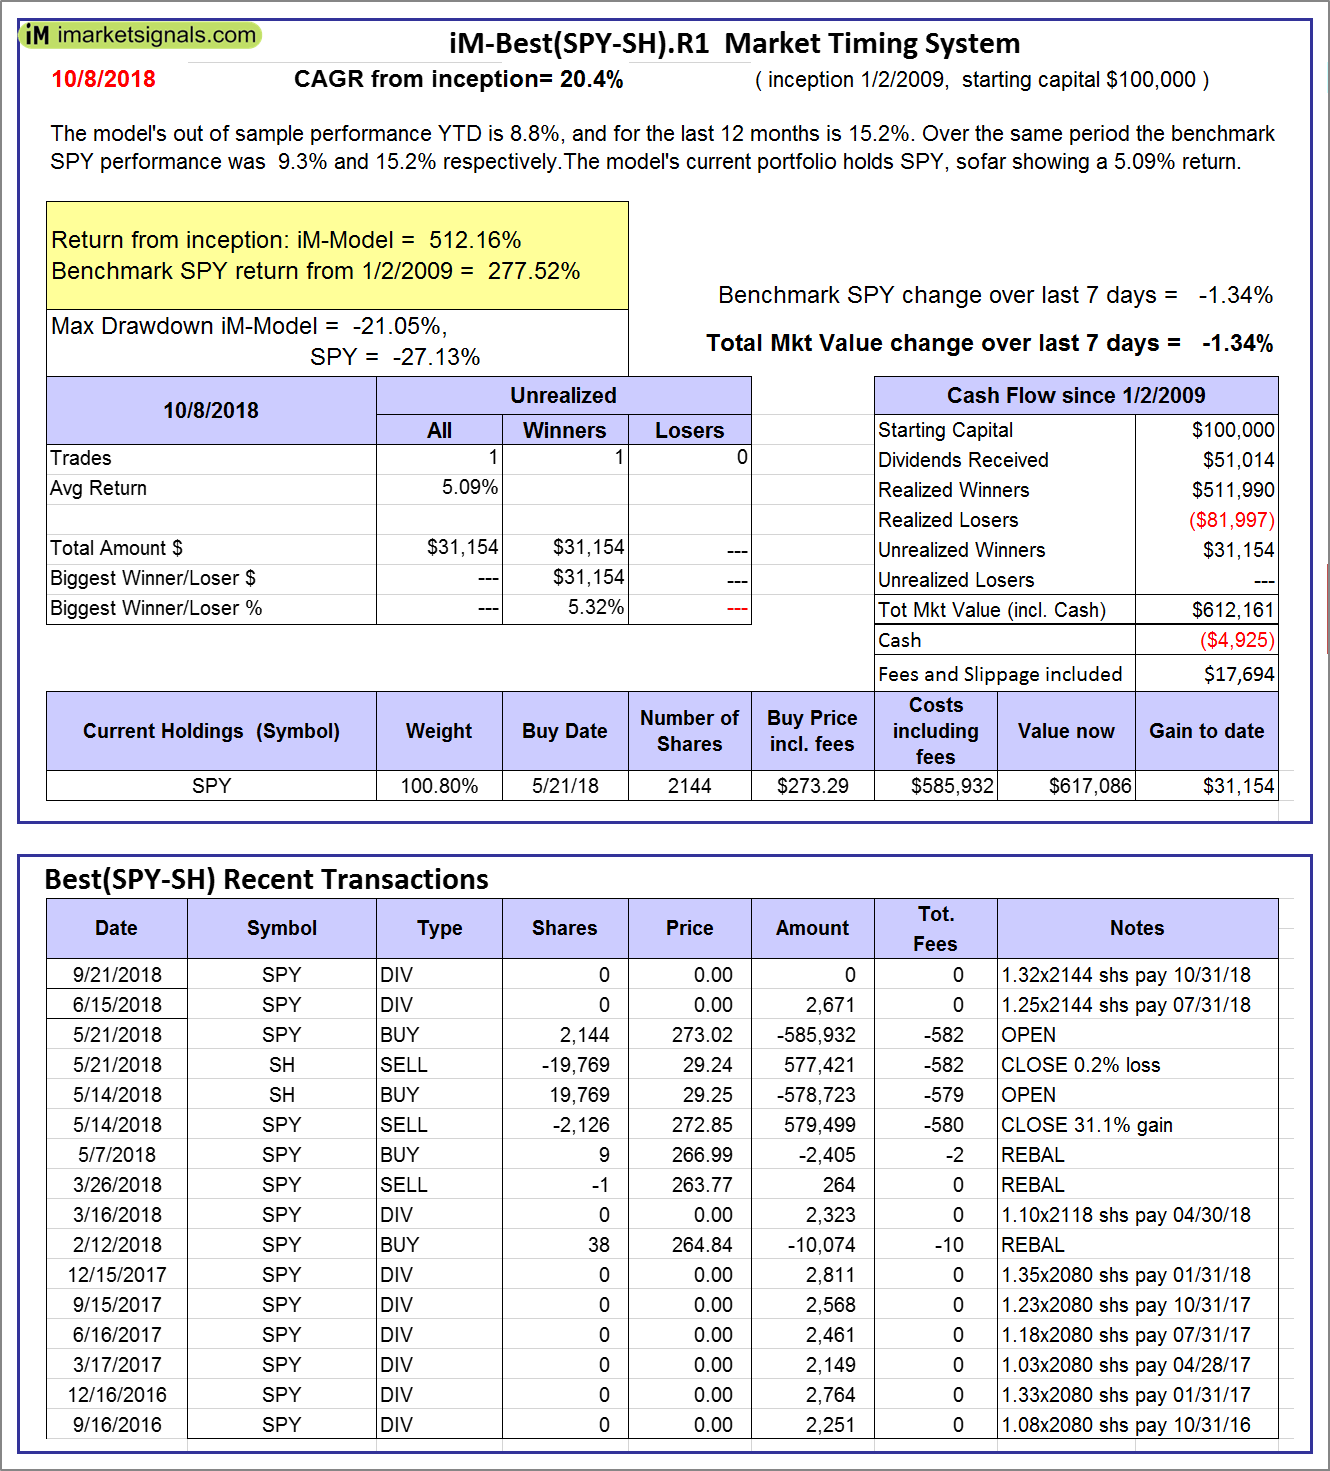 |
iM-Best(SPY-SH).R1: The model’s out of sample performance YTD is 8.8%, and for the last 12 months is 15.2%. Over the same period the benchmark SPY performance was 9.3% and 15.2% respectively. Over the previous week the market value of Best(SPY-SH) gained -1.34% at a time when SPY gained -1.34%. A starting capital of $100,000 at inception on 1/2/2009 would have grown to $612,161 which includes -$4,925 cash and excludes $17,694 spent on fees and slippage. |
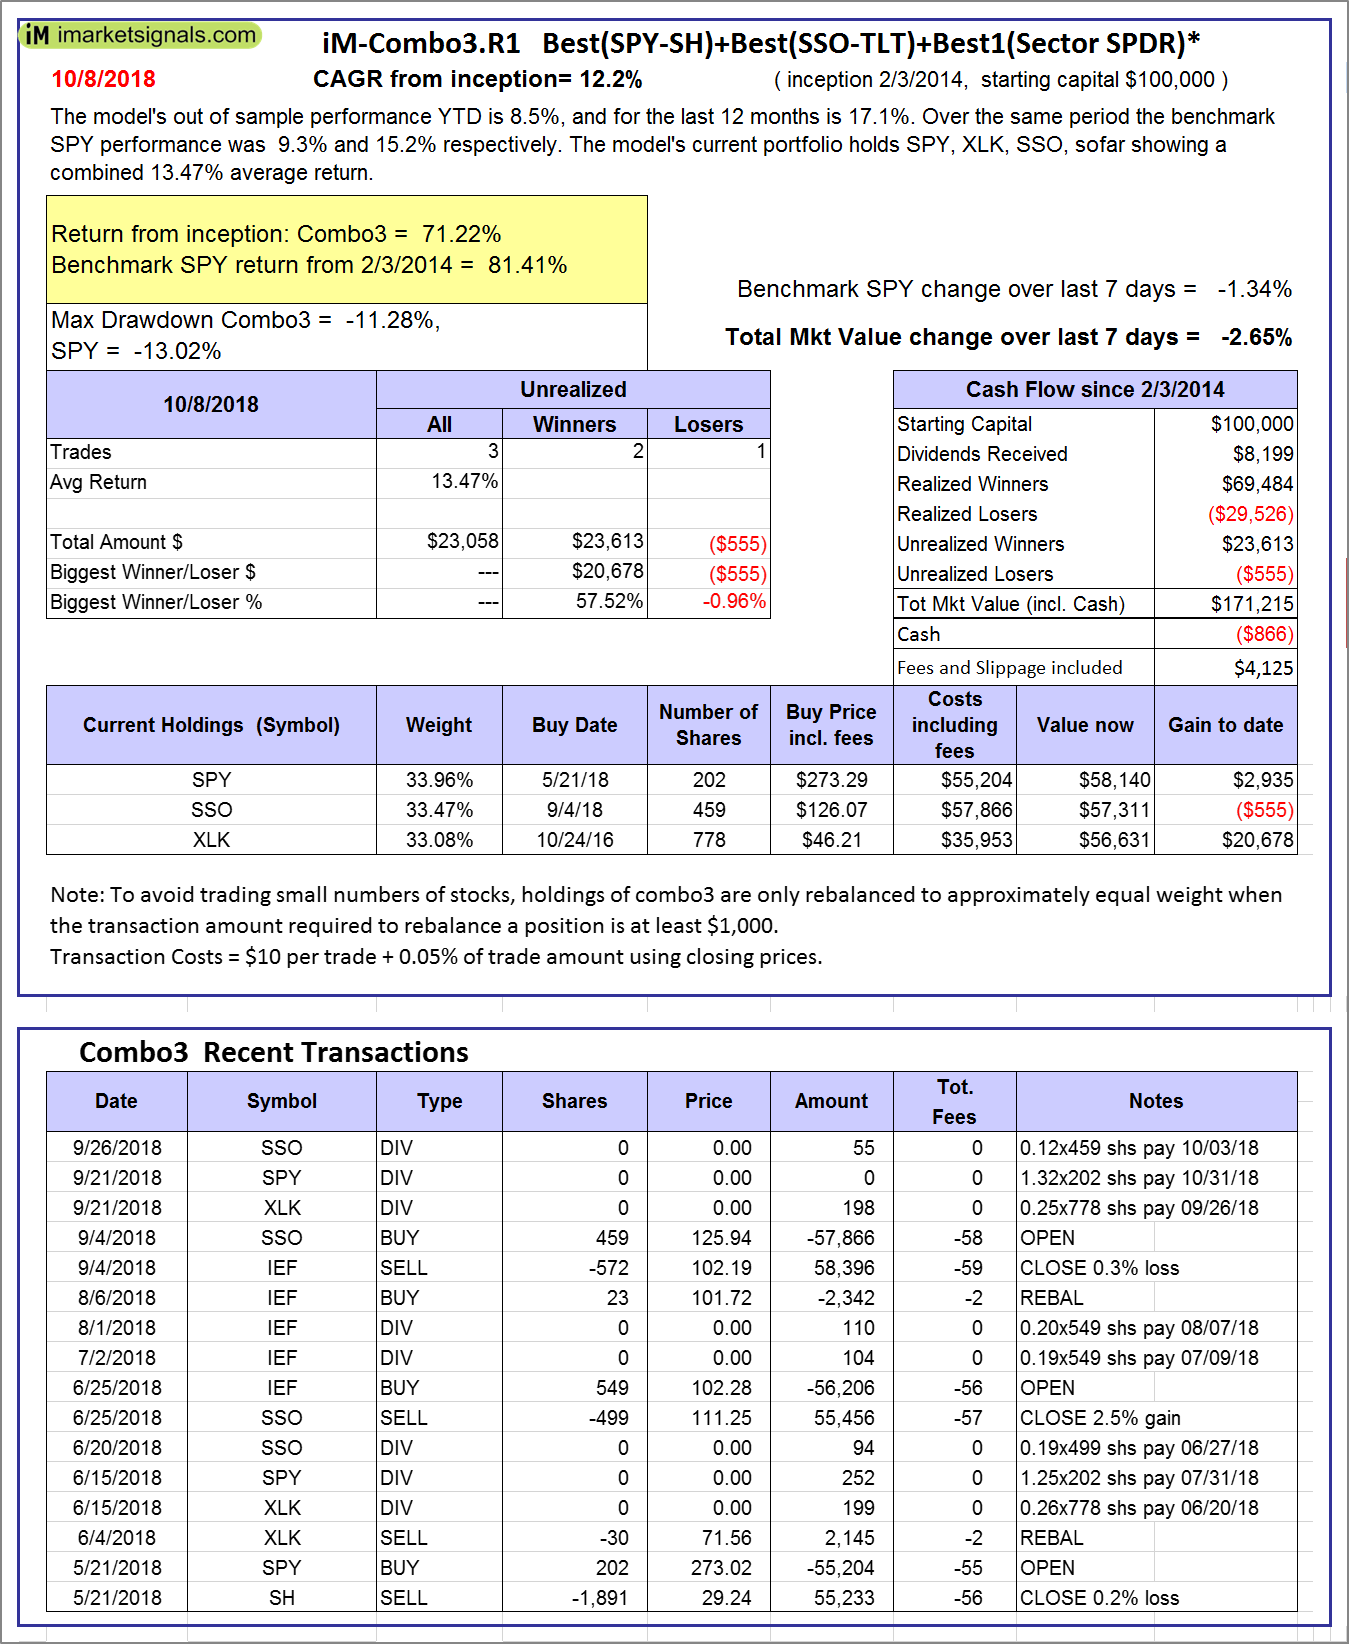 |
iM-Combo3.R1: The model’s out of sample performance YTD is 8.5%, and for the last 12 months is 17.1%. Over the same period the benchmark SPY performance was 9.3% and 15.2% respectively. Over the previous week the market value of iM-Combo3.R1 gained -2.65% at a time when SPY gained -1.34%. A starting capital of $100,000 at inception on 2/3/2014 would have grown to $171,215 which includes -$866 cash and excludes $4,125 spent on fees and slippage. |
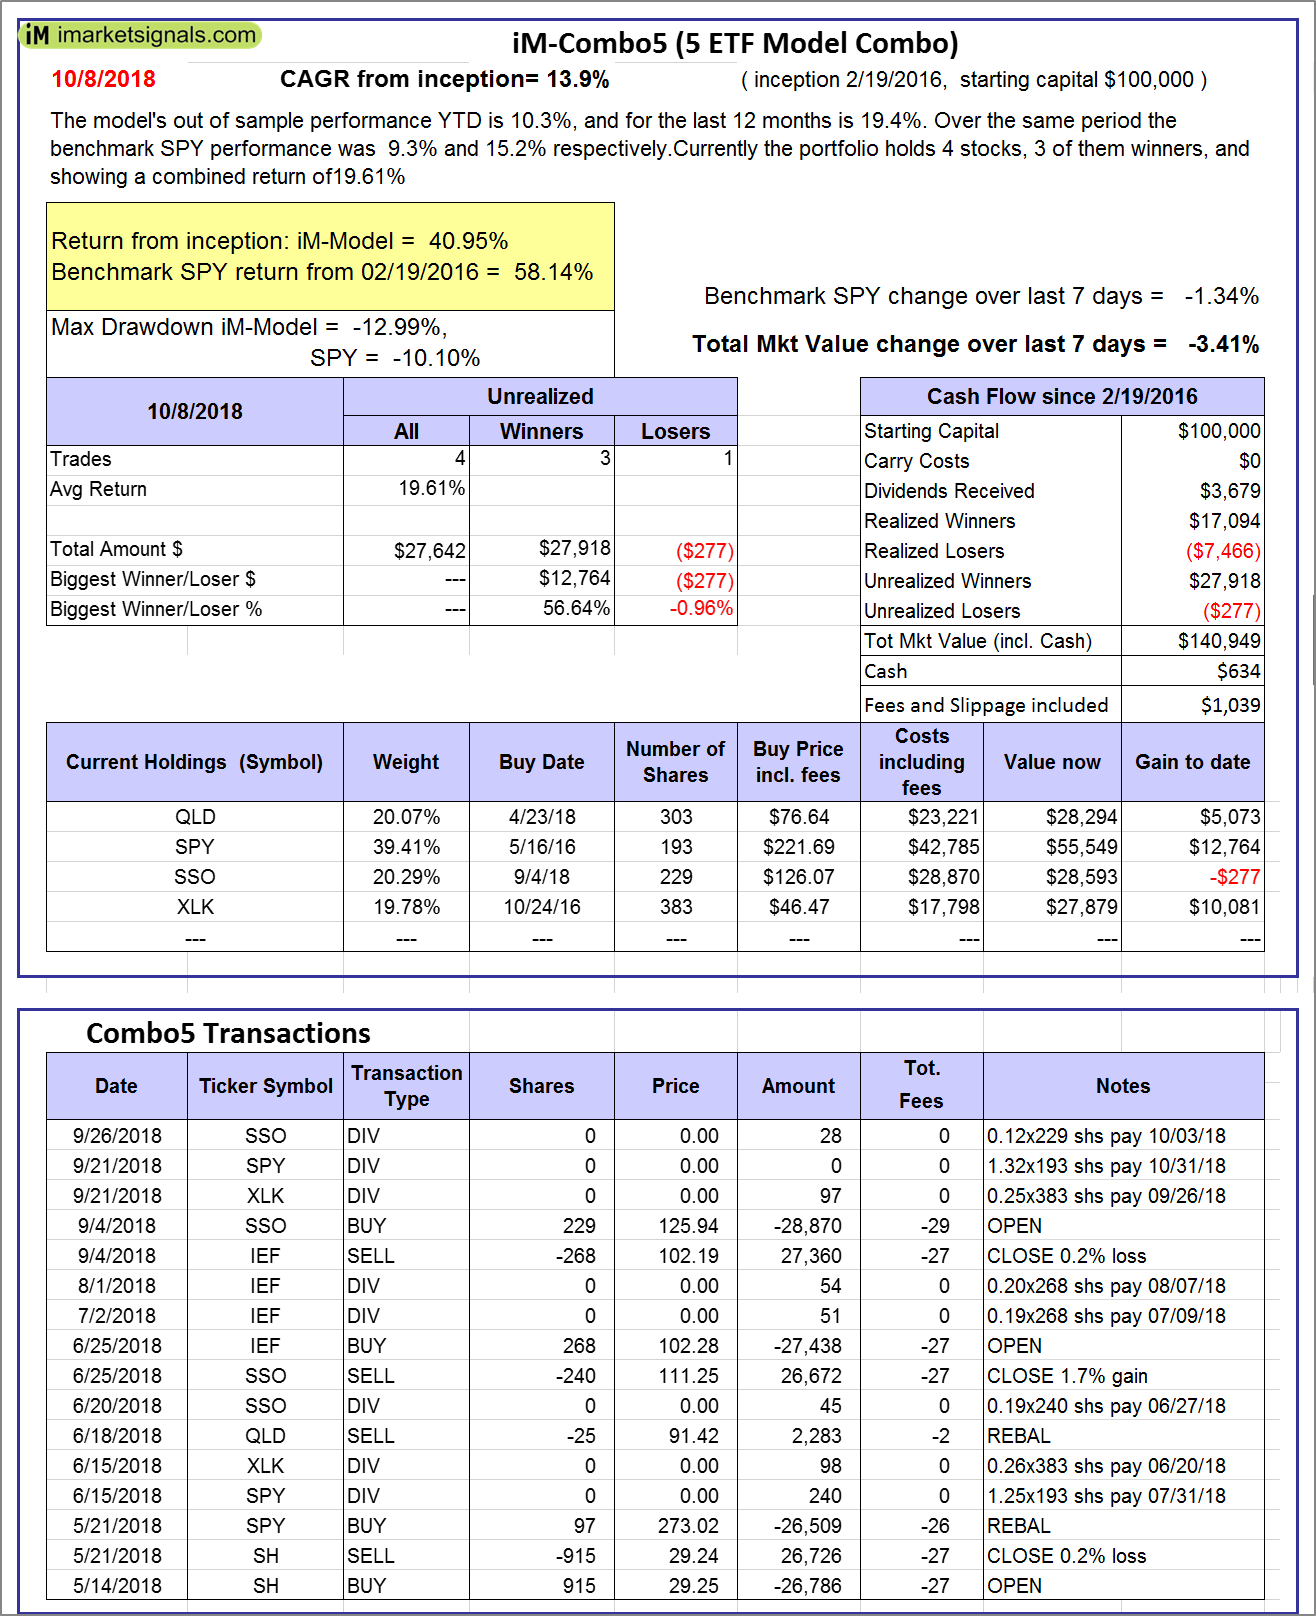 |
iM-Combo5: The model’s out of sample performance YTD is 10.3%, and for the last 12 months is 19.4%. Over the same period the benchmark SPY performance was 9.3% and 15.2% respectively. Over the previous week the market value of iM-Combo5 gained -3.41% at a time when SPY gained -1.34%. A starting capital of $100,000 at inception on 2/22/2016 would have grown to $140,949 which includes $634 cash and excludes $1,039 spent on fees and slippage. |
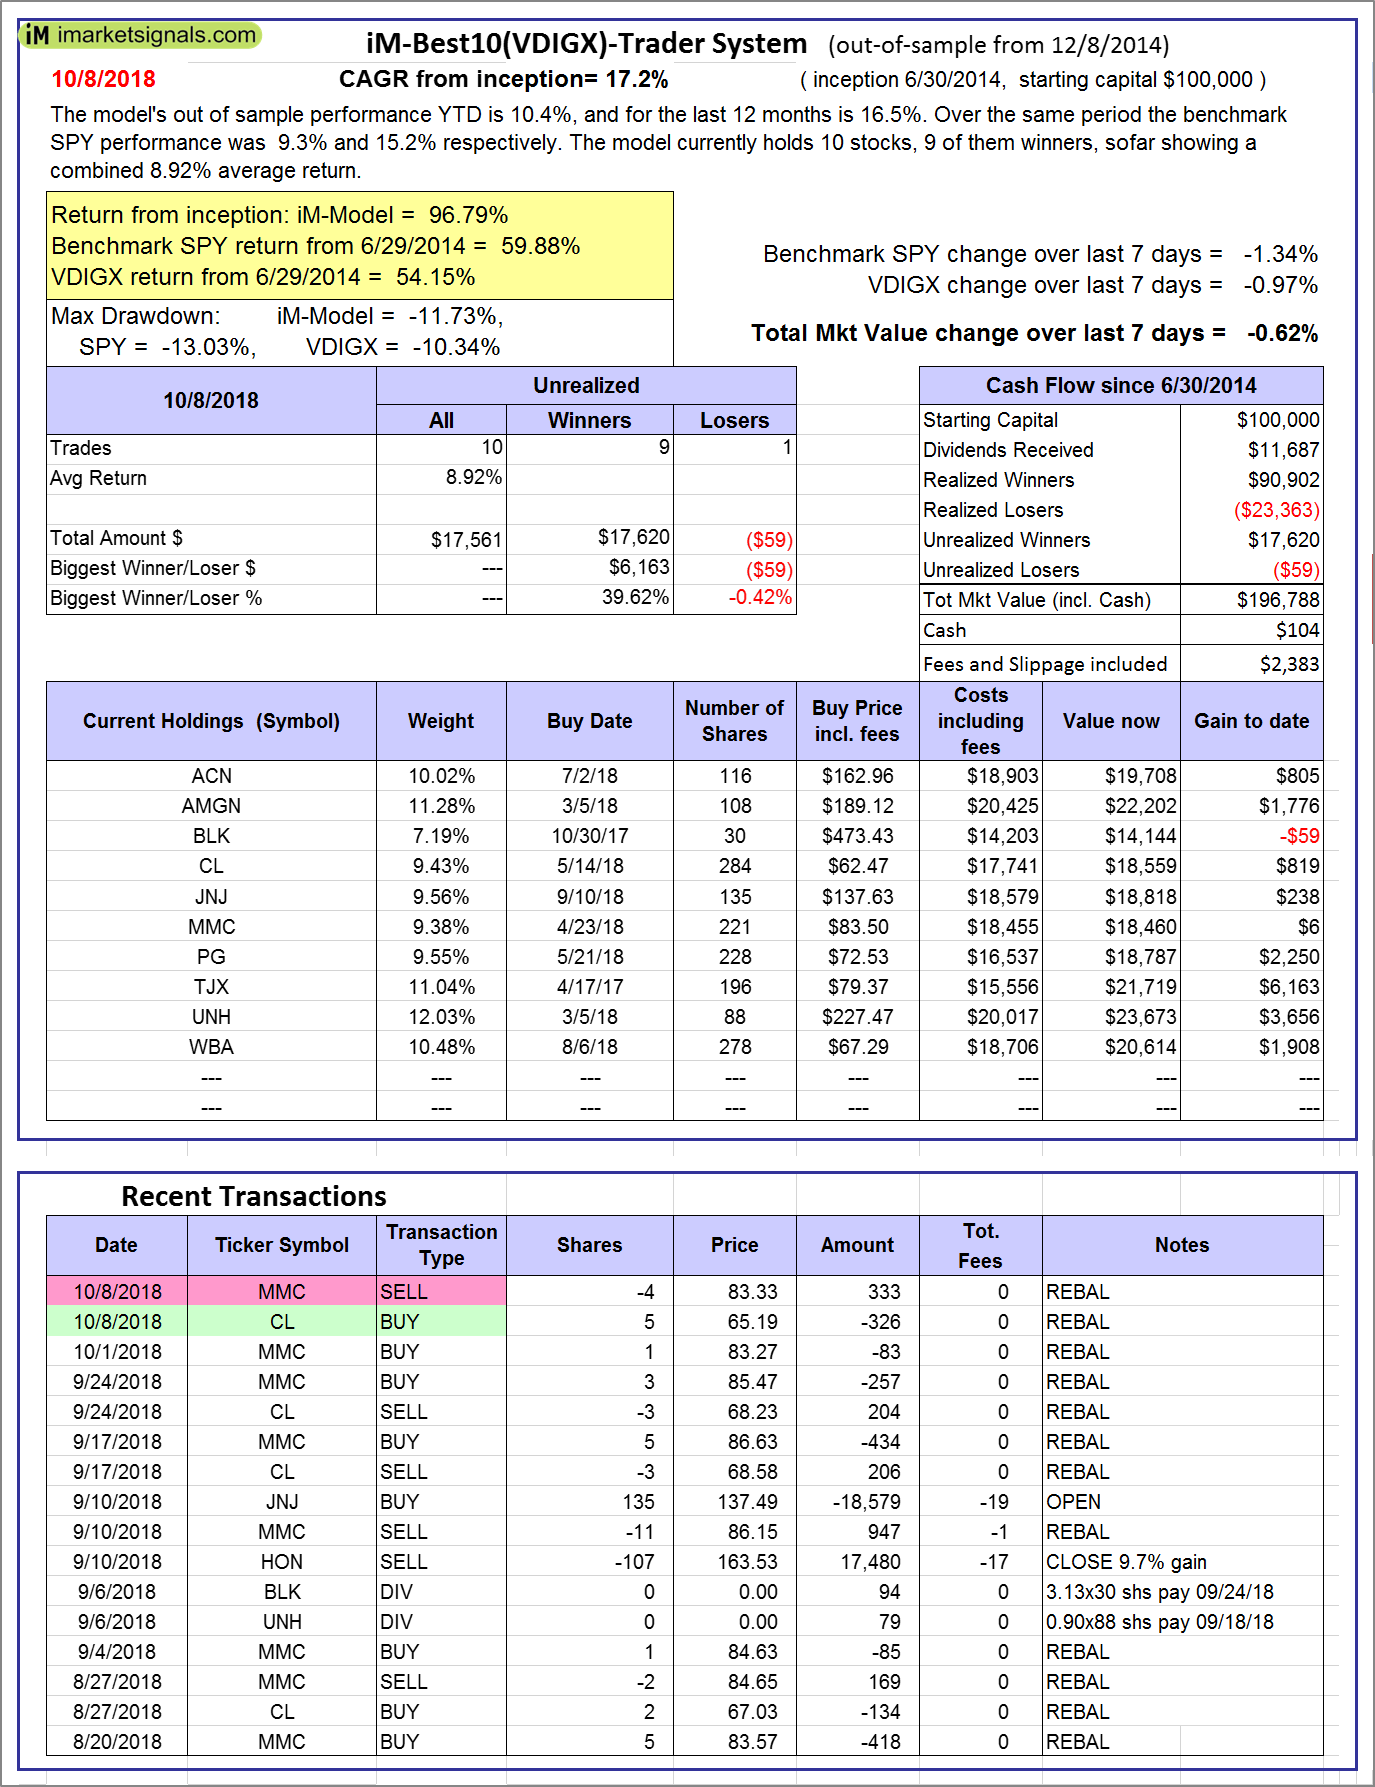 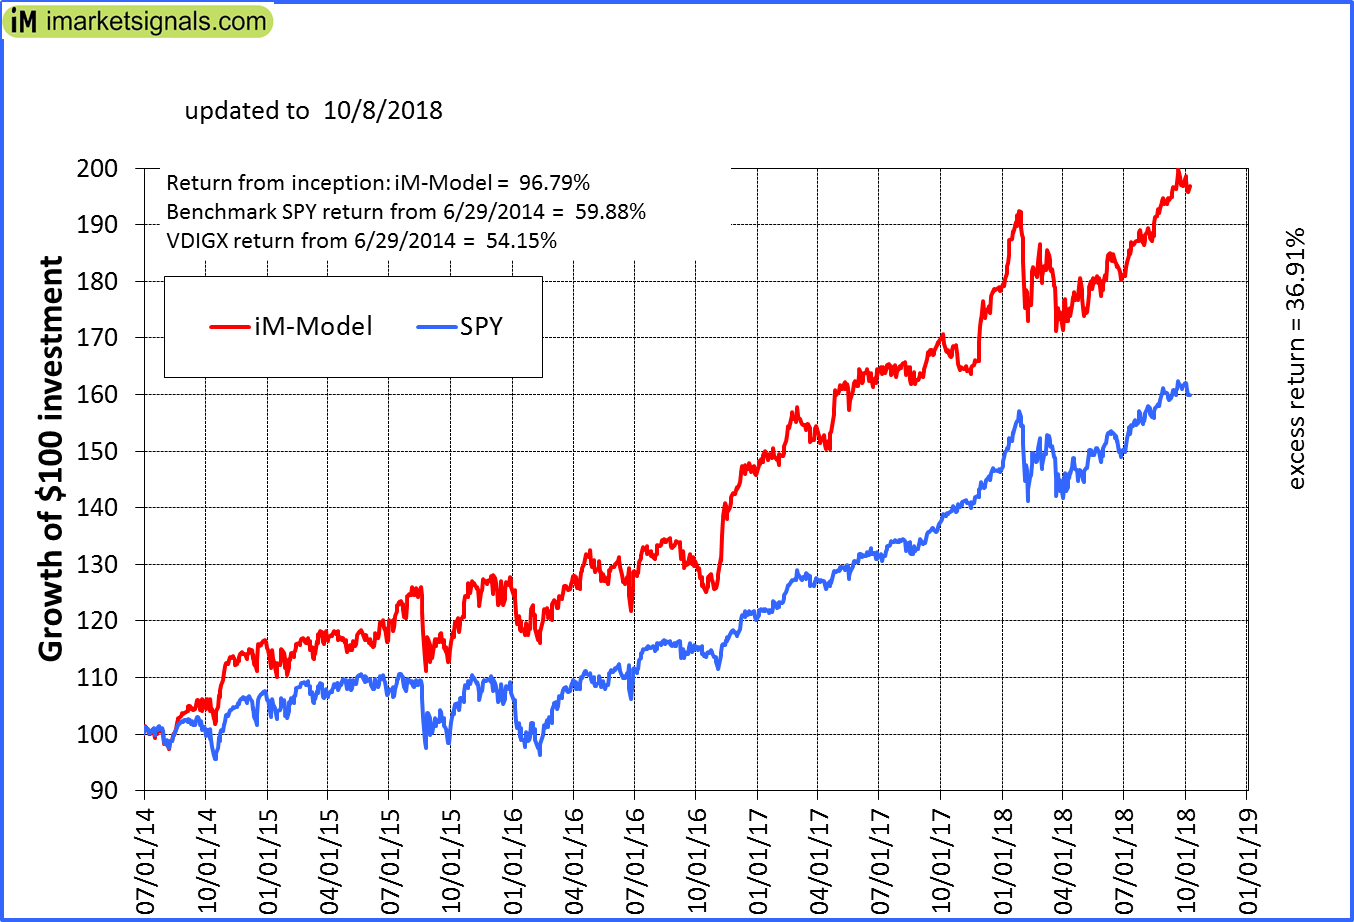 |
iM-Best10(VDIGX)-Trader: The model’s out of sample performance YTD is 10.4%, and for the last 12 months is 16.5%. Over the same period the benchmark SPY performance was 9.3% and 15.2% respectively. Since inception, on 7/1/2014, the model gained 96.79% while the benchmark SPY gained 59.88% and VDIGX gained 54.15% over the same period. Over the previous week the market value of iM-Best10(VDIGX) gained -0.62% at a time when SPY gained -1.34%. A starting capital of $100,000 at inception on 7/1/2014 would have grown to $196,788 which includes $104 cash and excludes $2,383 spent on fees and slippage. |
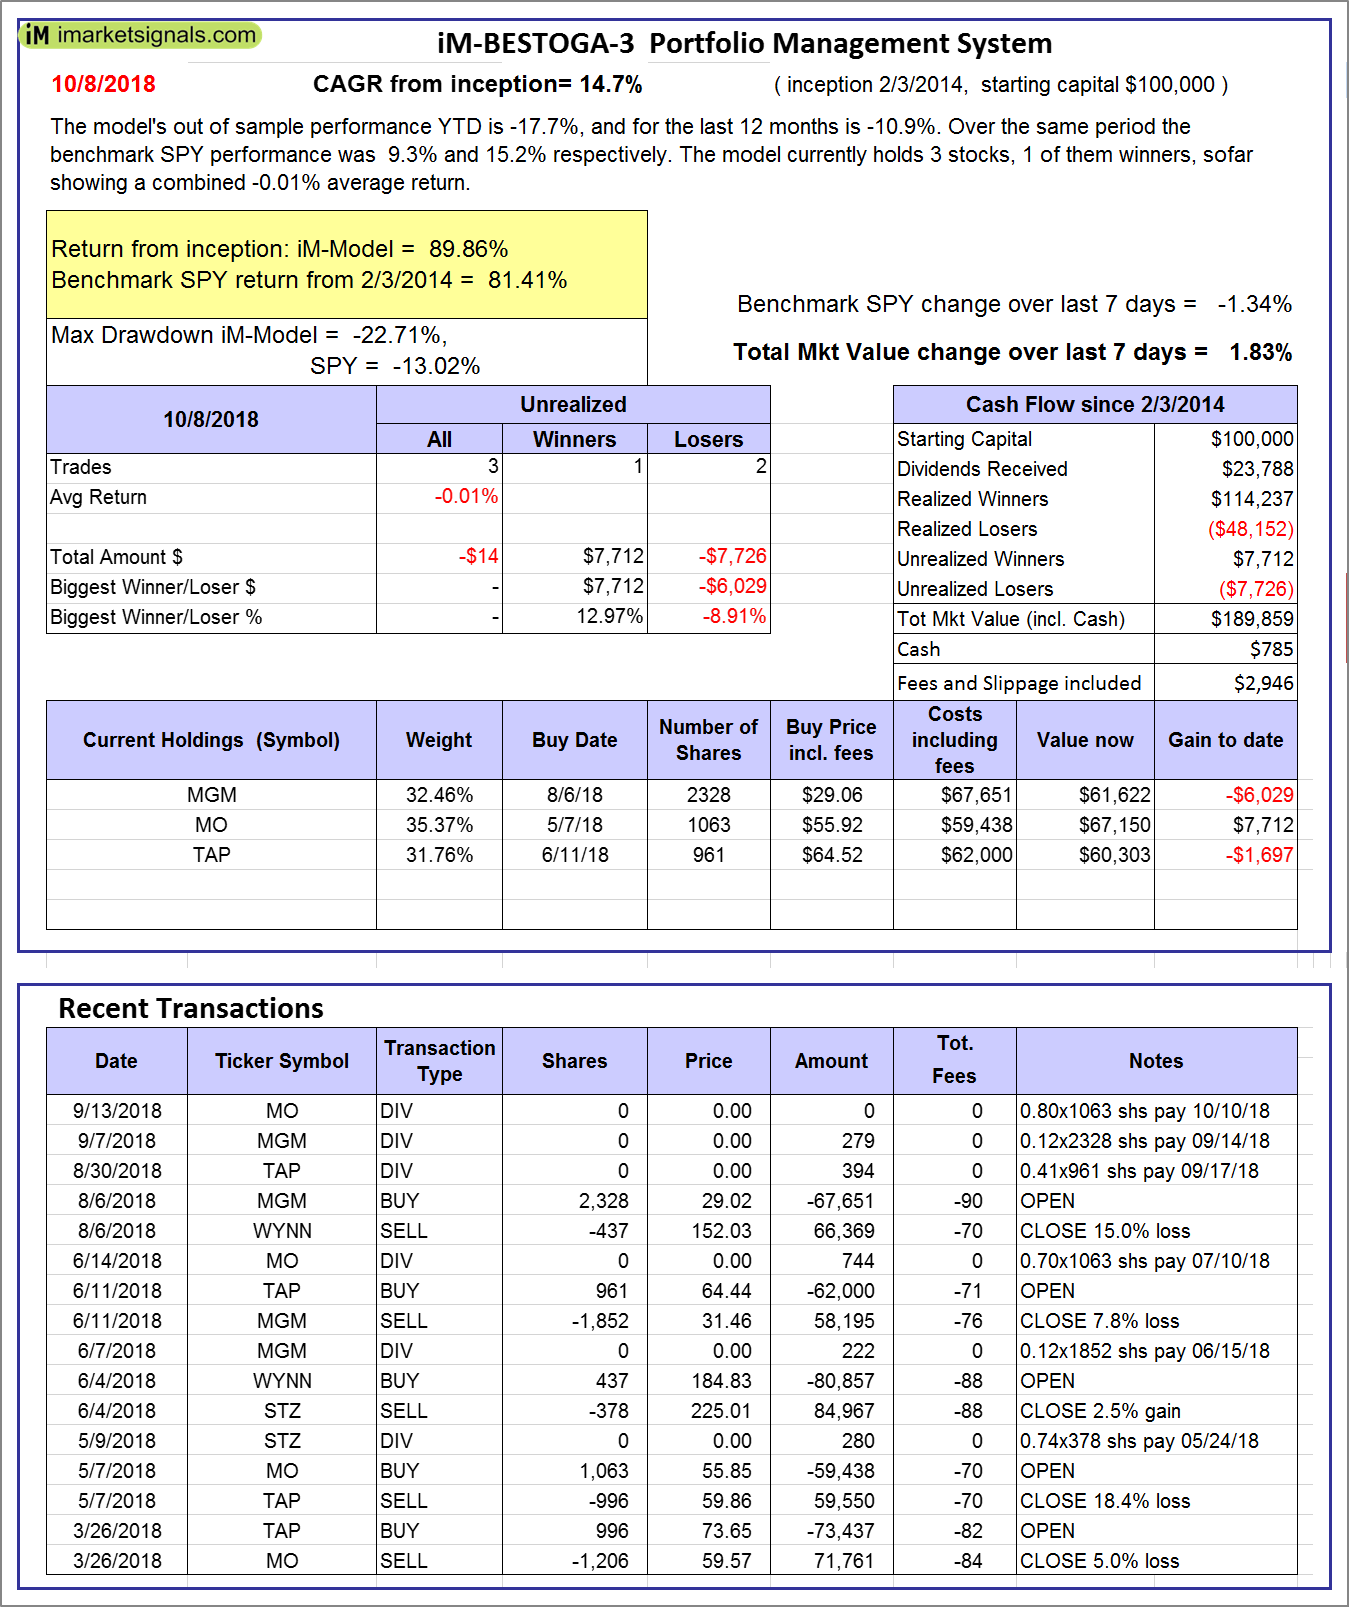 |
iM-BESTOGA-3: The model’s out of sample performance YTD is -17.7%, and for the last 12 months is -10.9%. Over the same period the benchmark SPY performance was 9.3% and 15.2% respectively. Over the previous week the market value of iM-BESTOGA-3 gained 1.83% at a time when SPY gained -1.34%. A starting capital of $100,000 at inception on 2/3/2014 would have grown to $189,859 which includes $785 cash and excludes $2,946 spent on fees and slippage. |
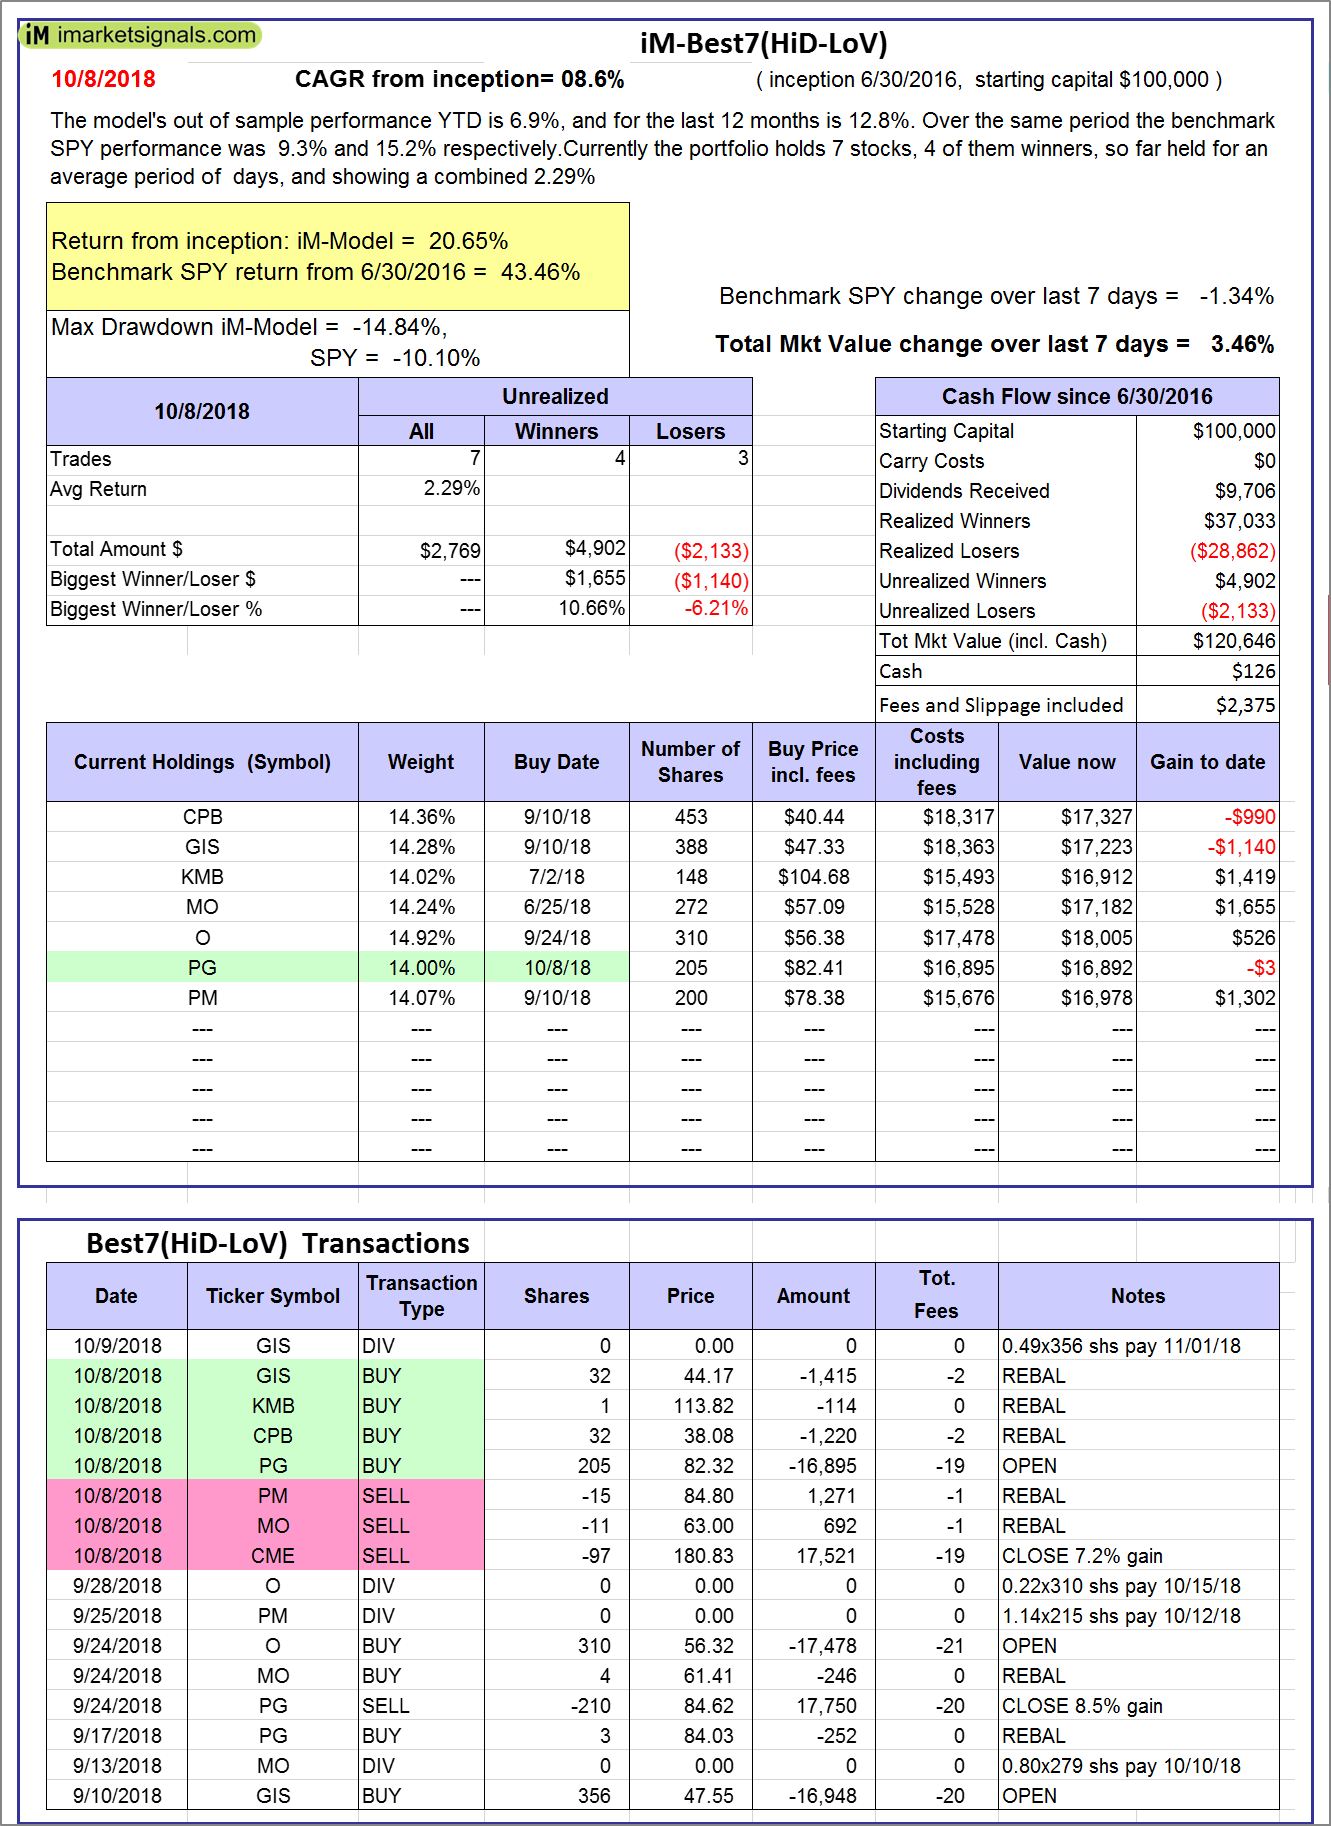 |
iM-Best7(HiD-LoV): The model’s out of sample performance YTD is 6.9%, and for the last 12 months is 12.8%. Over the same period the benchmark SPY performance was 9.3% and 15.2% respectively. Over the previous week the market value of iM-BESTOGA-3 gained 3.46% at a time when SPY gained -1.34%. A starting capital of $100,000 at inception on 6/30/2016 would have grown to $120,646 which includes $126 cash and excludes $2,375 spent on fees and slippage. |
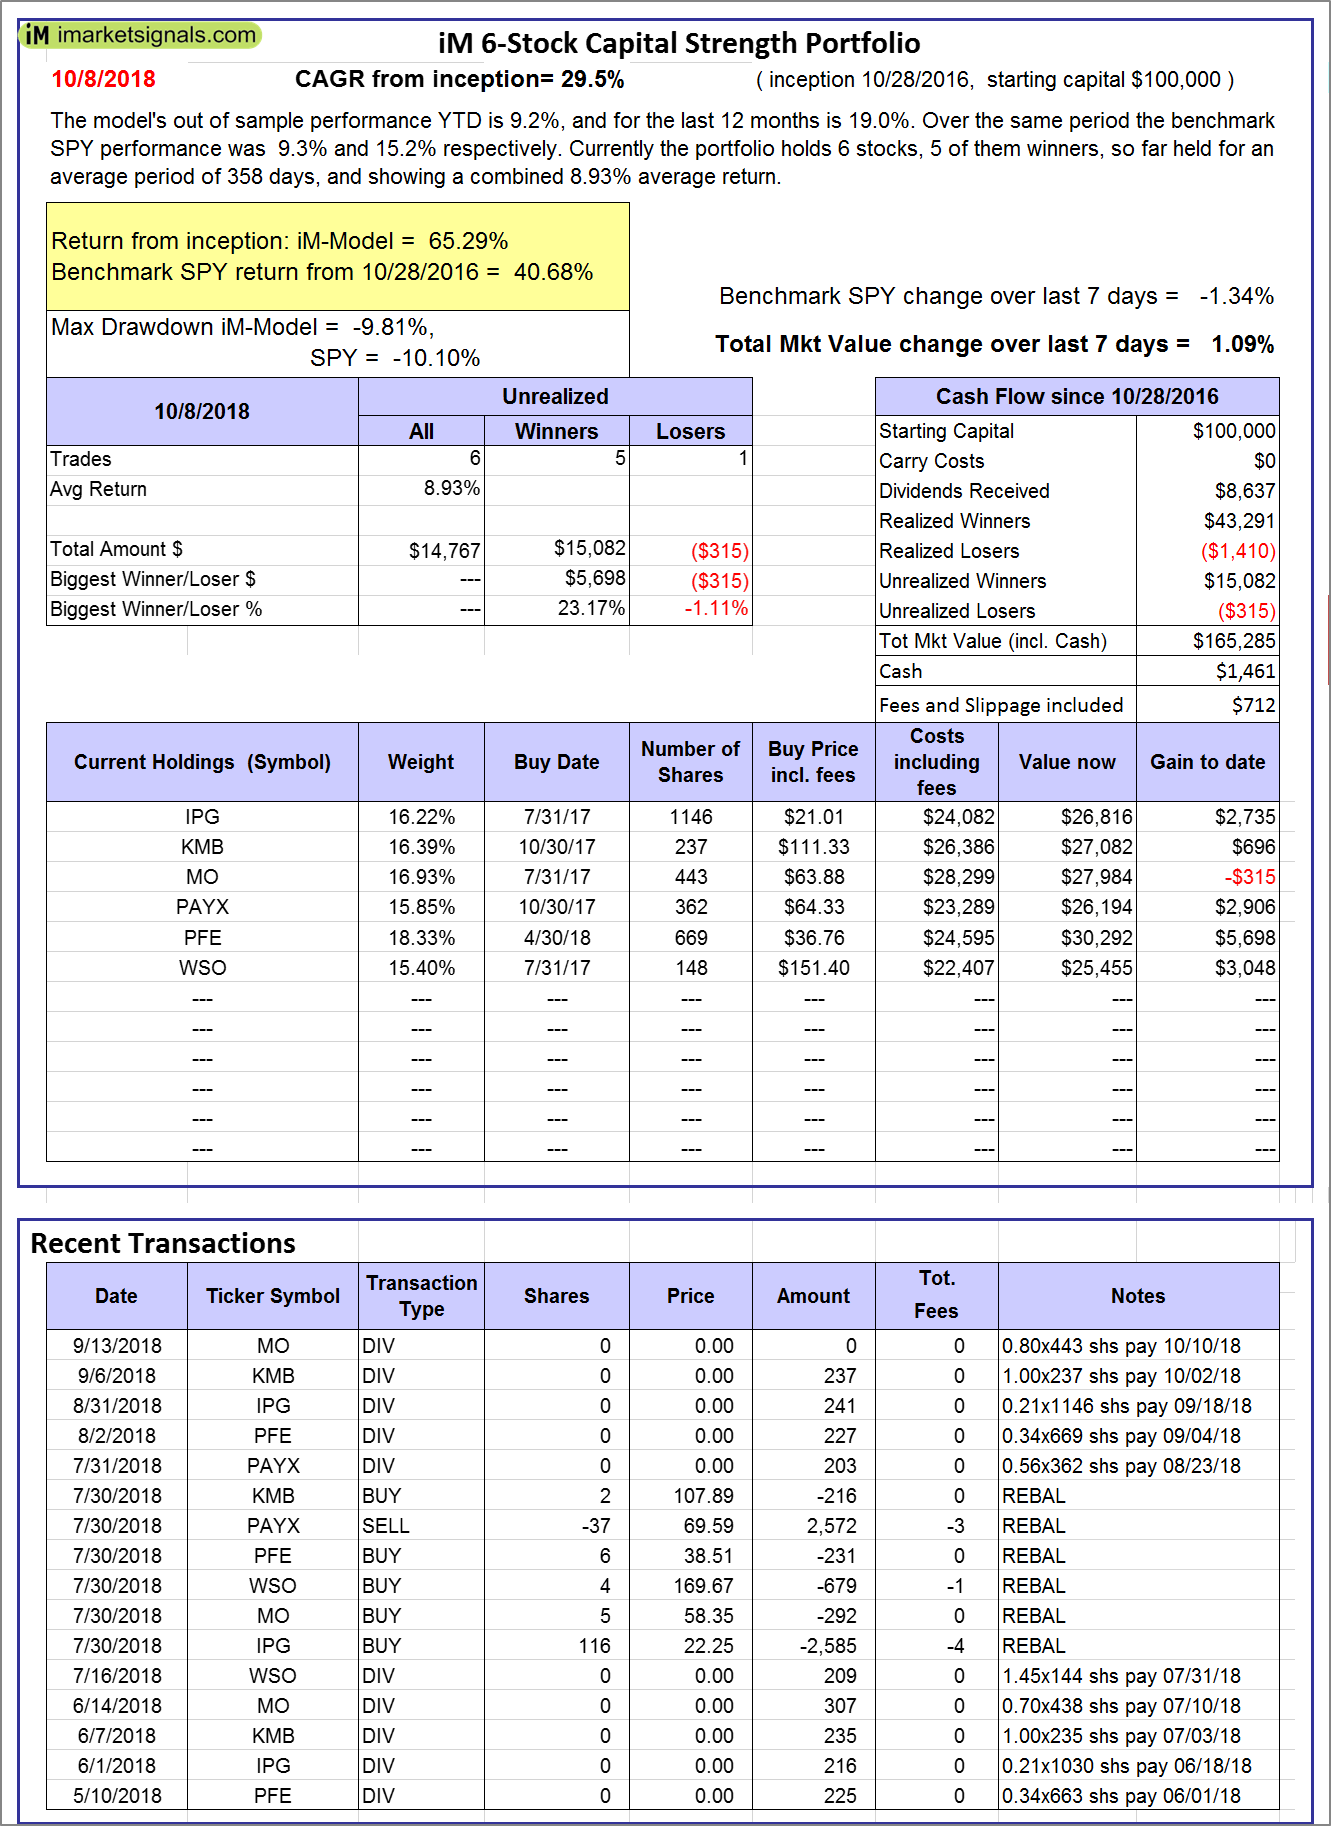 |
iM 6-Stock Capital Strength Portfolio: The model’s out of sample performance YTD is 9.2%, and for the last 12 months is 19.0%. Over the same period the benchmark SPY performance was 9.3% and 15.2% respectively. Over the previous week the market value of the iM 6-Stock Capital Strength Portfolio gained 1.09% at a time when SPY gained -1.34%. A starting capital of $100,000 at inception on 10/28/2016 would have grown to $165,285 which includes $1,461 cash and excludes $712 spent on fees and slippage. |
 |
iM-BestogaX5-System: The model’s out of sample performance YTD is 5.5%, and for the last 12 months is 12.7%. Over the same period the benchmark SPY performance was 9.3% and 15.2% respectively. Over the previous week the market value of iM-BestogaX5-System gained 0.56% at a time when SPY gained -1.34%. A starting capital of $100,000 at inception on 3/28/2016 would have grown to $117,532 which includes -$661 cash and excludes $1,335 spent on fees and slippage. |
 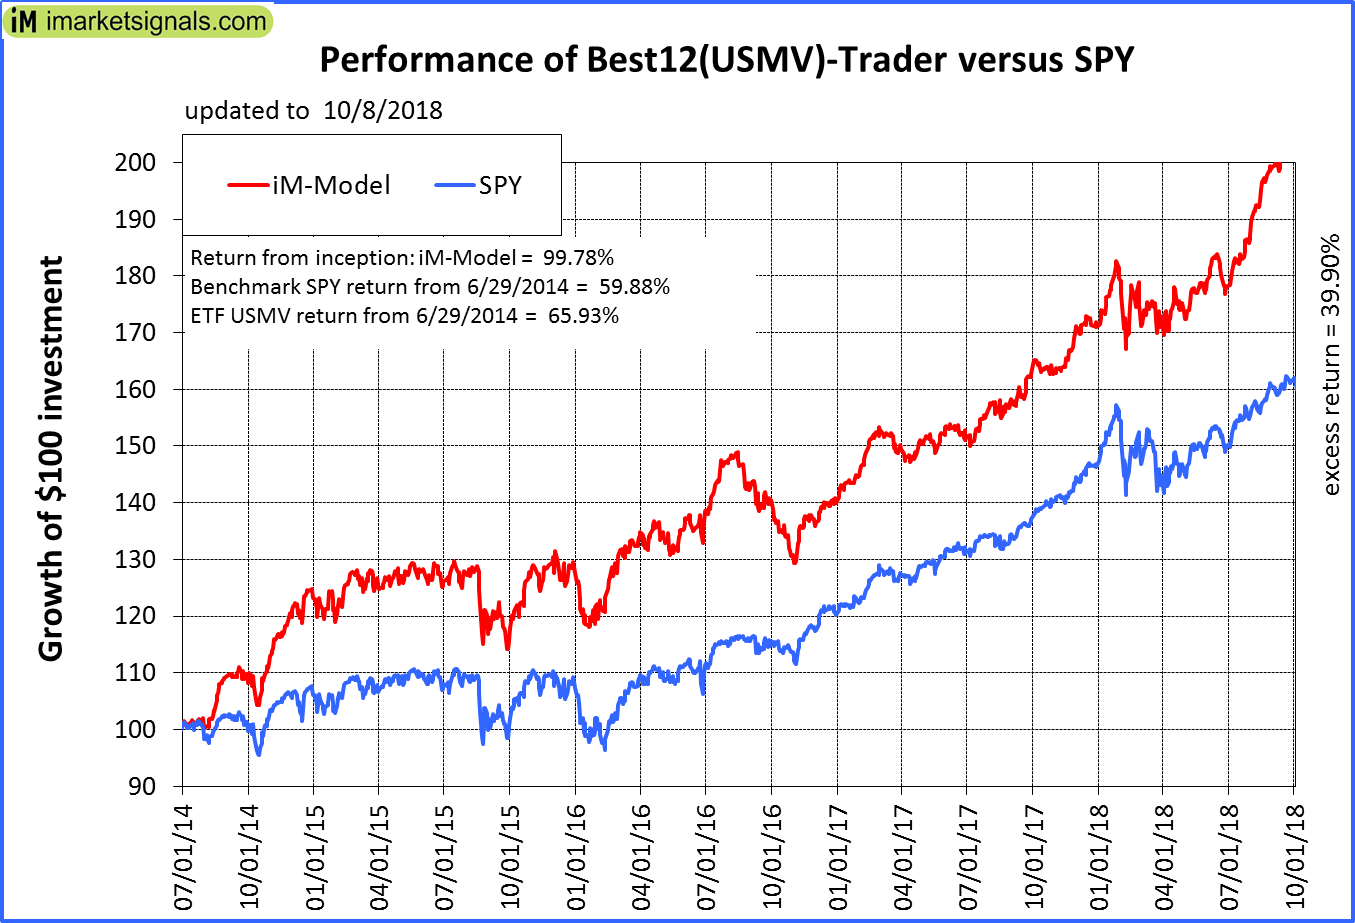 |
iM-Best12(USMV)-Trader: The model’s out of sample performance YTD is 16.8%, and for the last 12 months is 21.0%. Over the same period the benchmark SPY performance was 9.3% and 15.2% respectively. Since inception, on 6/30/2014, the model gained 99.78% while the benchmark SPY gained 59.88% and the ETF USMV gained 65.93% over the same period. Over the previous week the market value of iM-Best12(USMV)-Trader gained -1.53% at a time when SPY gained -1.34%. A starting capital of $100,000 at inception on 6/30/2014 would have grown to $199,208 which includes -$524 cash and excludes $4,578 spent on fees and slippage. |
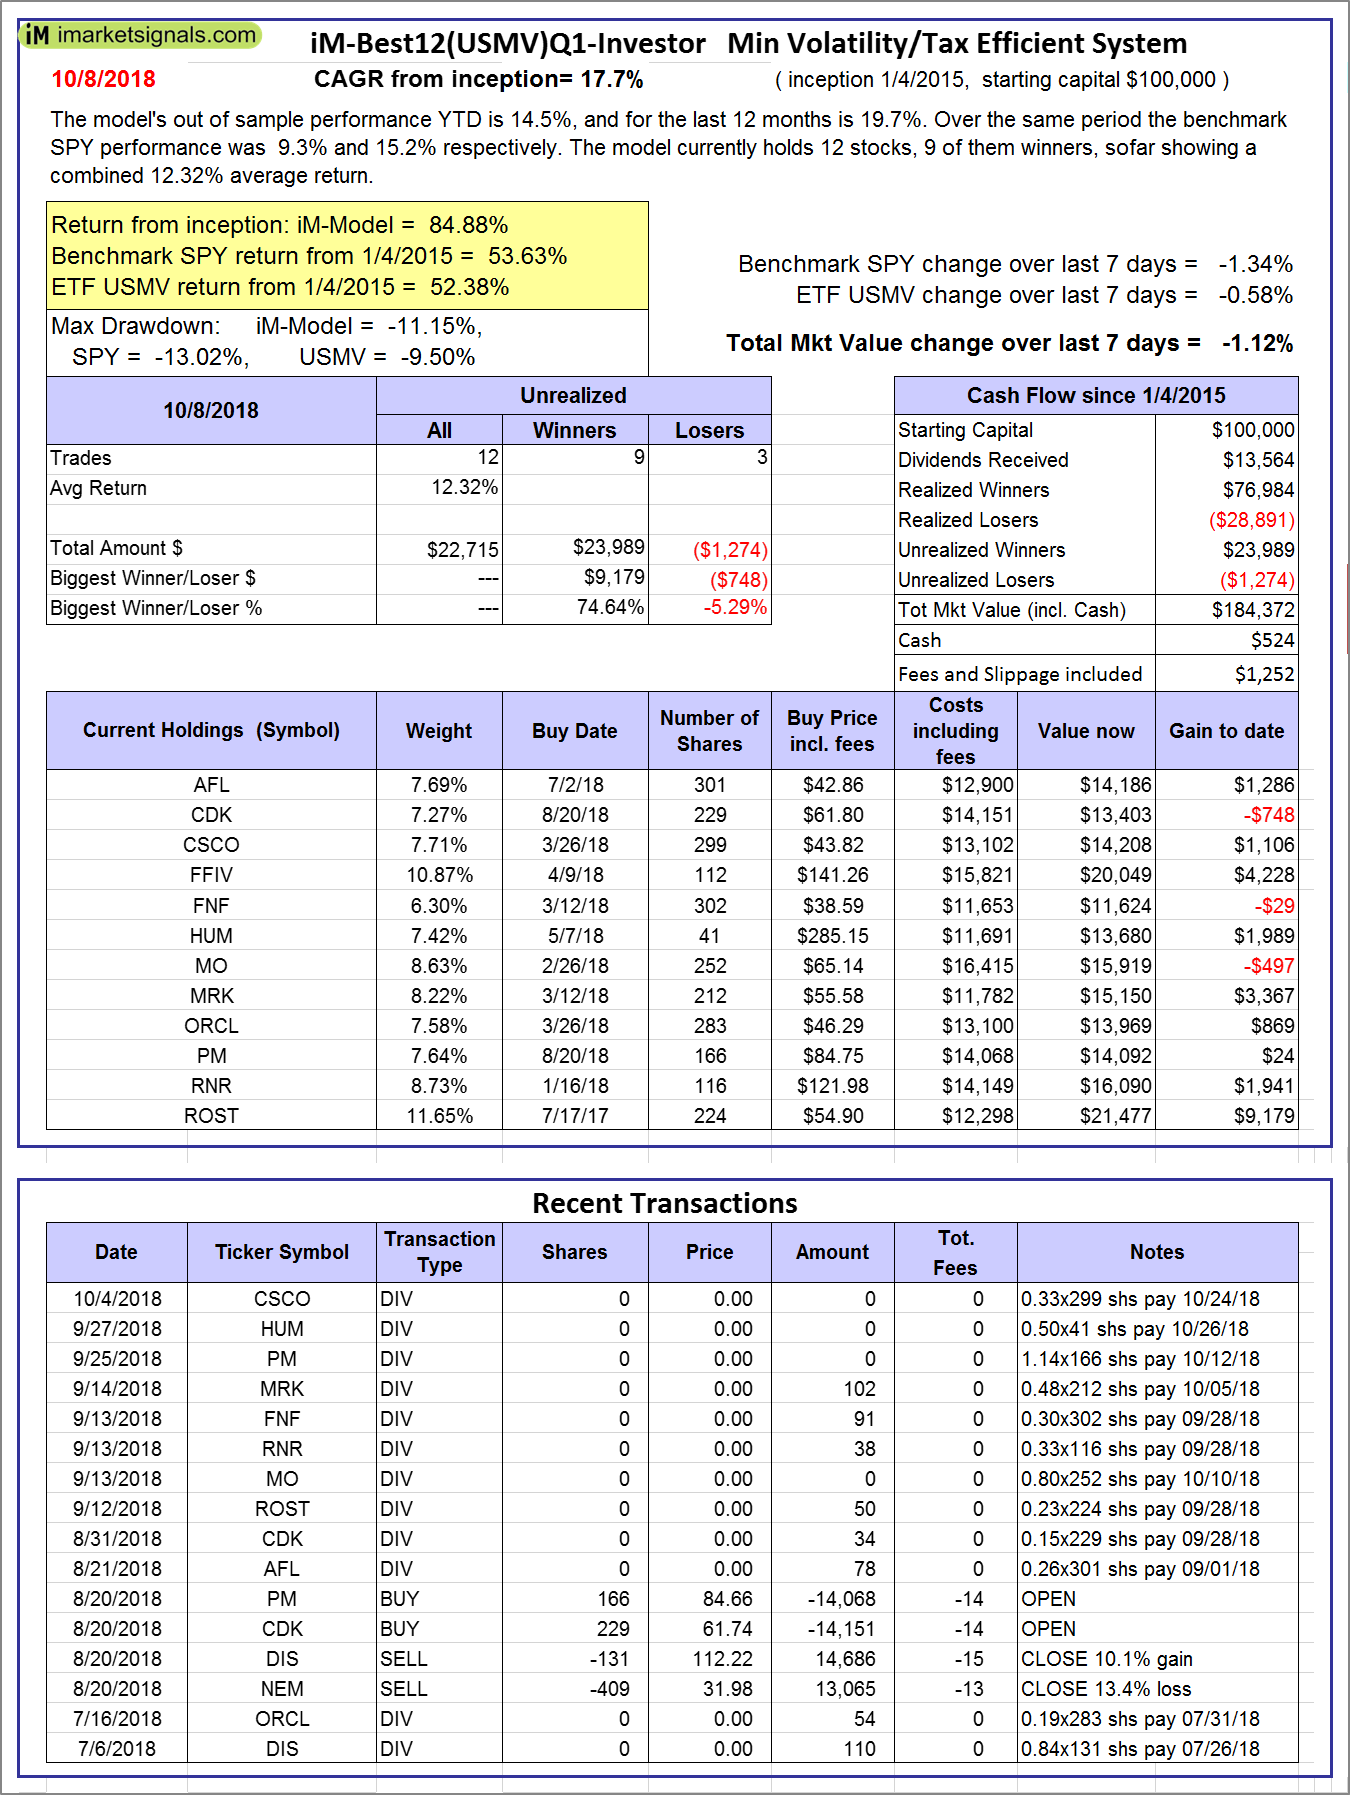 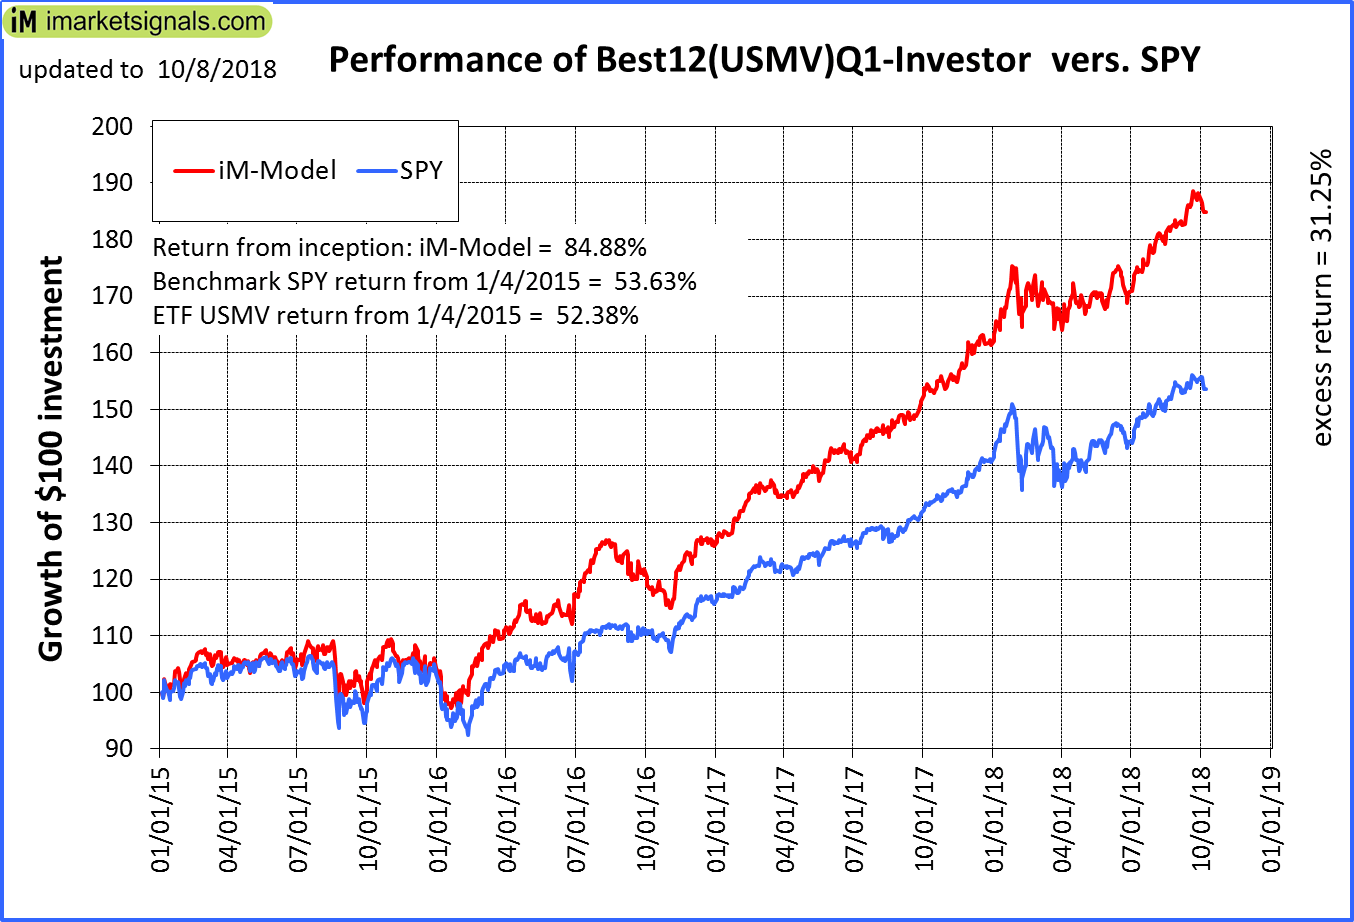 |
iM-Best12(USMV)Q1-Investor: The model’s out of sample performance YTD is 14.5%, and for the last 12 months is 19.7%. Over the same period the benchmark SPY performance was 9.3% and 15.2% respectively. Since inception, on 1/5/2015, the model gained 84.88% while the benchmark SPY gained 53.63% and the ETF USMV gained 52.38% over the same period. Over the previous week the market value of iM-Best12(USMV)Q1 gained -1.12% at a time when SPY gained -1.34%. A starting capital of $100,000 at inception on 1/5/2015 would have grown to $184,372 which includes $524 cash and excludes $1,252 spent on fees and slippage. |
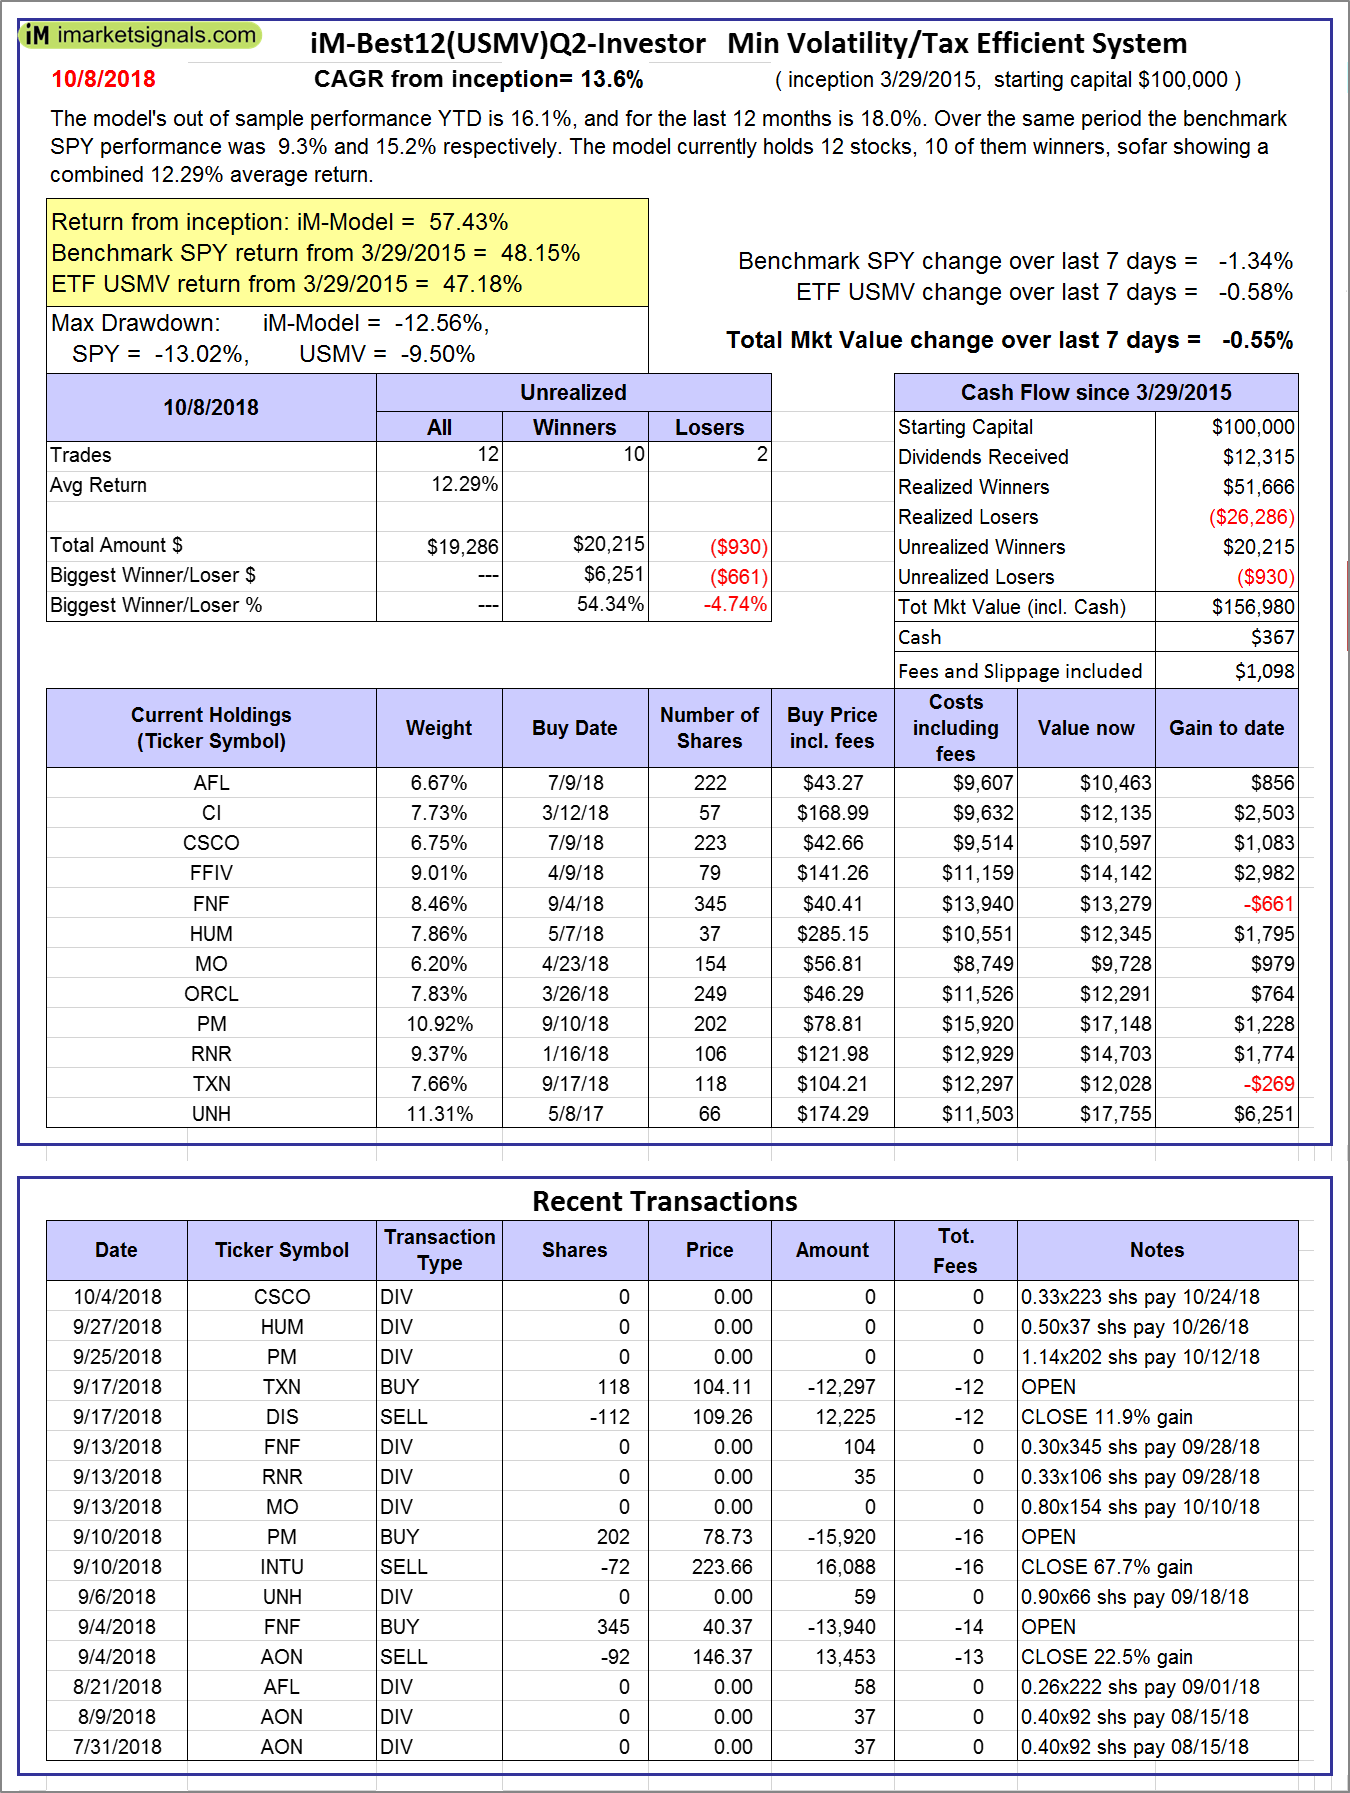 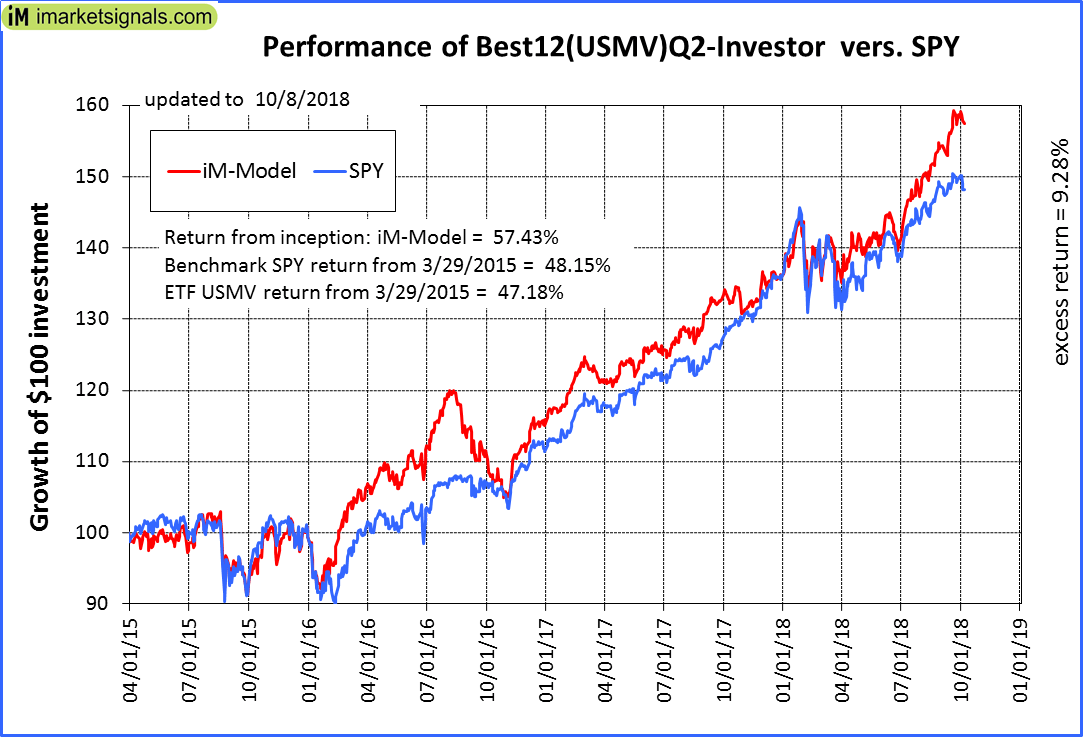 |
iM-Best12(USMV)Q2-Investor: The model’s out of sample performance YTD is 16.1%, and for the last 12 months is 18.0%. Over the same period the benchmark SPY performance was 9.3% and 15.2% respectively. Since inception, on 3/30/2015, the model gained 57.43% while the benchmark SPY gained 48.15% and the ETF USMV gained 47.18% over the same period. Over the previous week the market value of iM-Best12(USMV)Q2 gained -0.55% at a time when SPY gained -1.34%. A starting capital of $100,000 at inception on 3/30/2015 would have grown to $156,980 which includes $367 cash and excludes $1,098 spent on fees and slippage. |
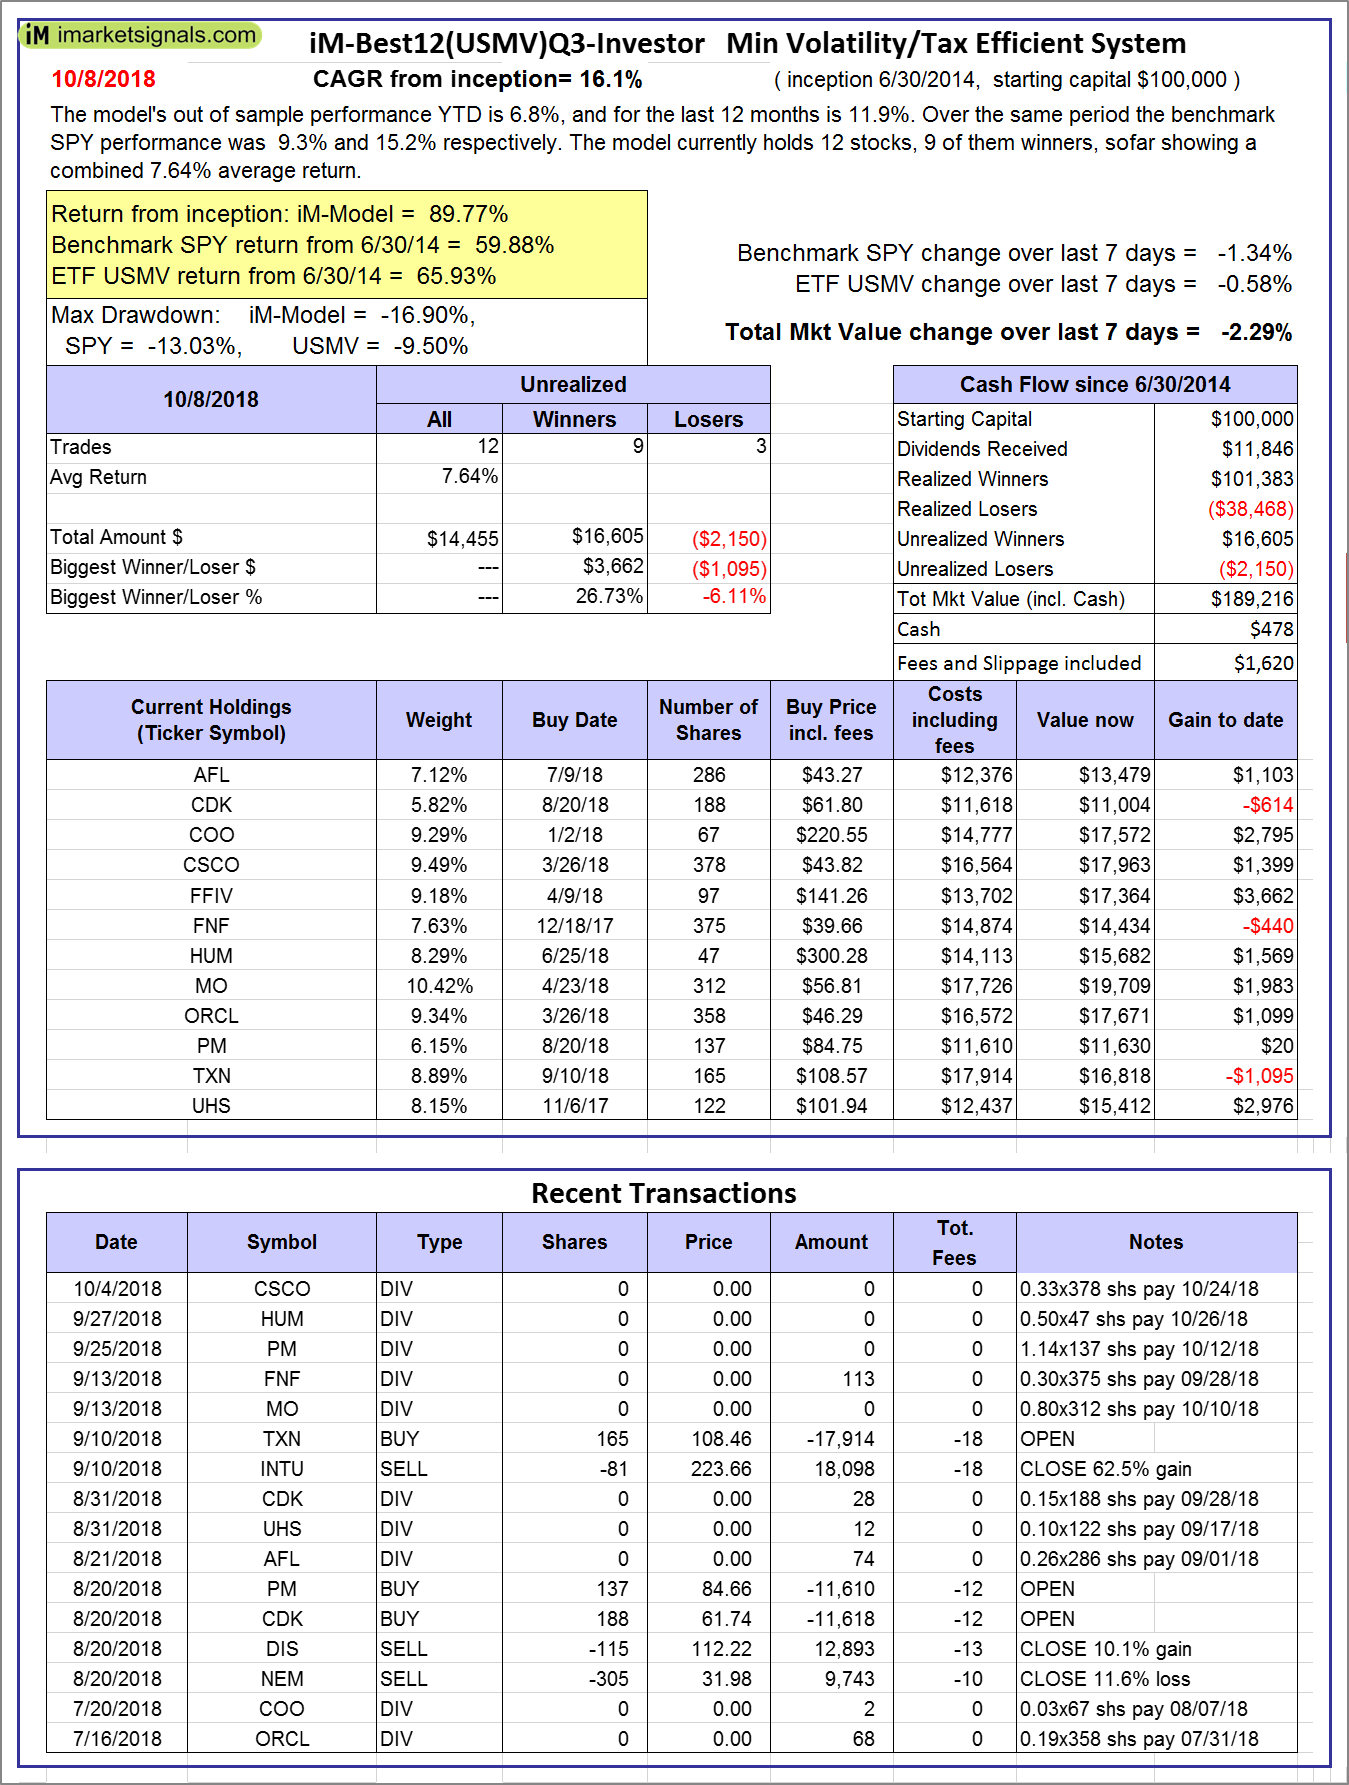 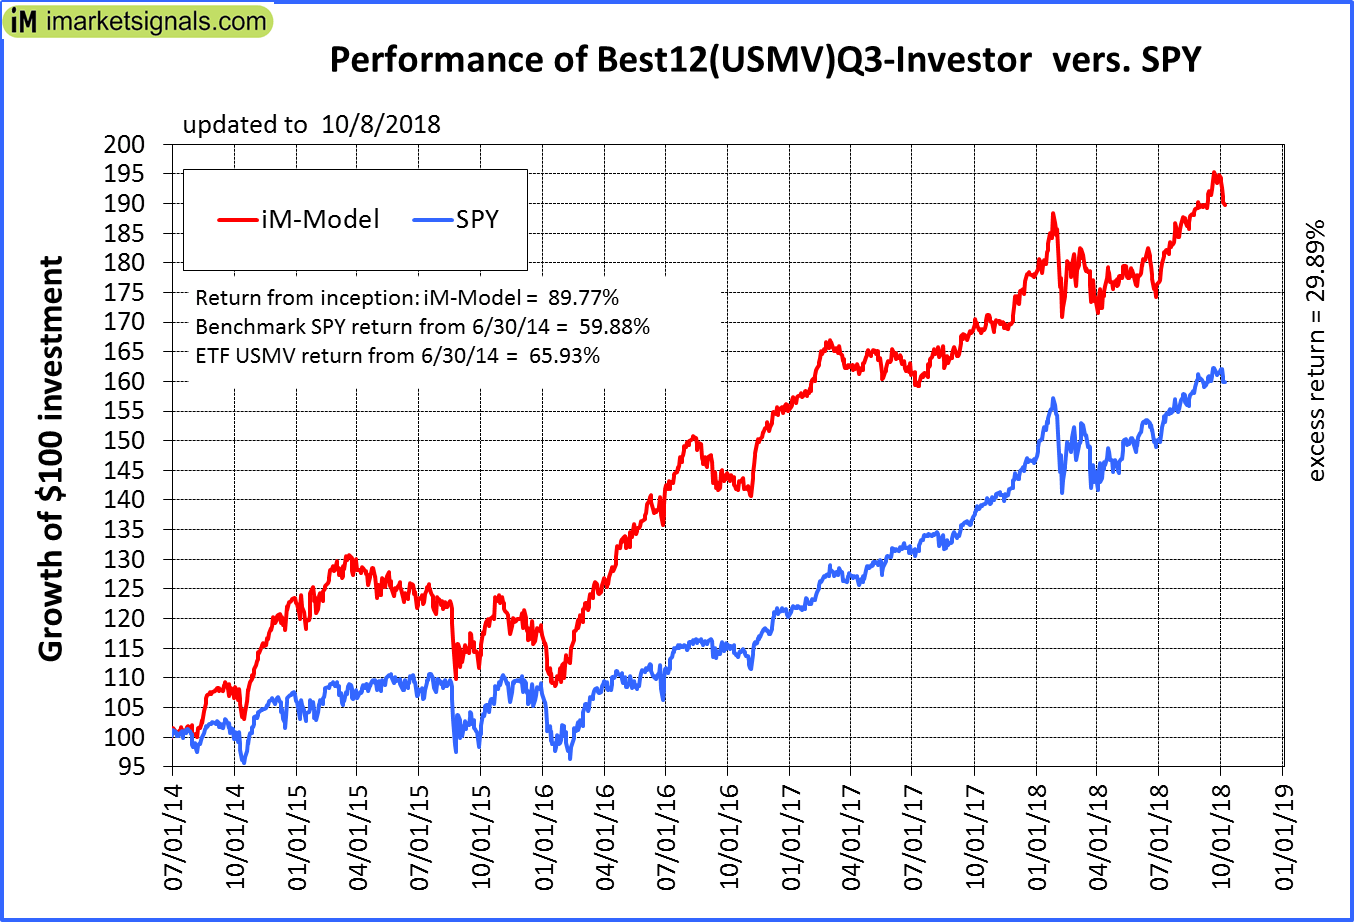 |
iM-Best12(USMV)Q3-Investor: The model’s out of sample performance YTD is 6.8%, and for the last 12 months is 11.9%. Over the same period the benchmark SPY performance was 9.3% and 15.2% respectively. Since inception, on 7/1/2014, the model gained 89.77% while the benchmark SPY gained 59.88% and the ETF USMV gained 65.93% over the same period. Over the previous week the market value of iM-Best12(USMV)Q3 gained -2.29% at a time when SPY gained -1.34%. A starting capital of $100,000 at inception on 7/1/2014 would have grown to $189,216 which includes $478 cash and excludes $1,620 spent on fees and slippage. |
  |
iM-Best12(USMV)Q4-Investor: Since inception, on 9/29/2014, the model gained 100.76% while the benchmark SPY gained 57.46% and the ETF USMV gained 63.64% over the same period. Over the previous week the market value of iM-Best12(USMV)Q4 gained -1.01% at a time when SPY gained -1.34%. A starting capital of $100,000 at inception on 9/29/2014 would have grown to $200,227 which includes $272 cash and excludes $1,435 spent on fees and slippage. |
 |
Average Performance of iM-Best12(USMV)Q1+Q2+Q3+Q4-Investor resulted in an excess return of 47.32% over SPY. (see iM-USMV Investor Portfolio) |
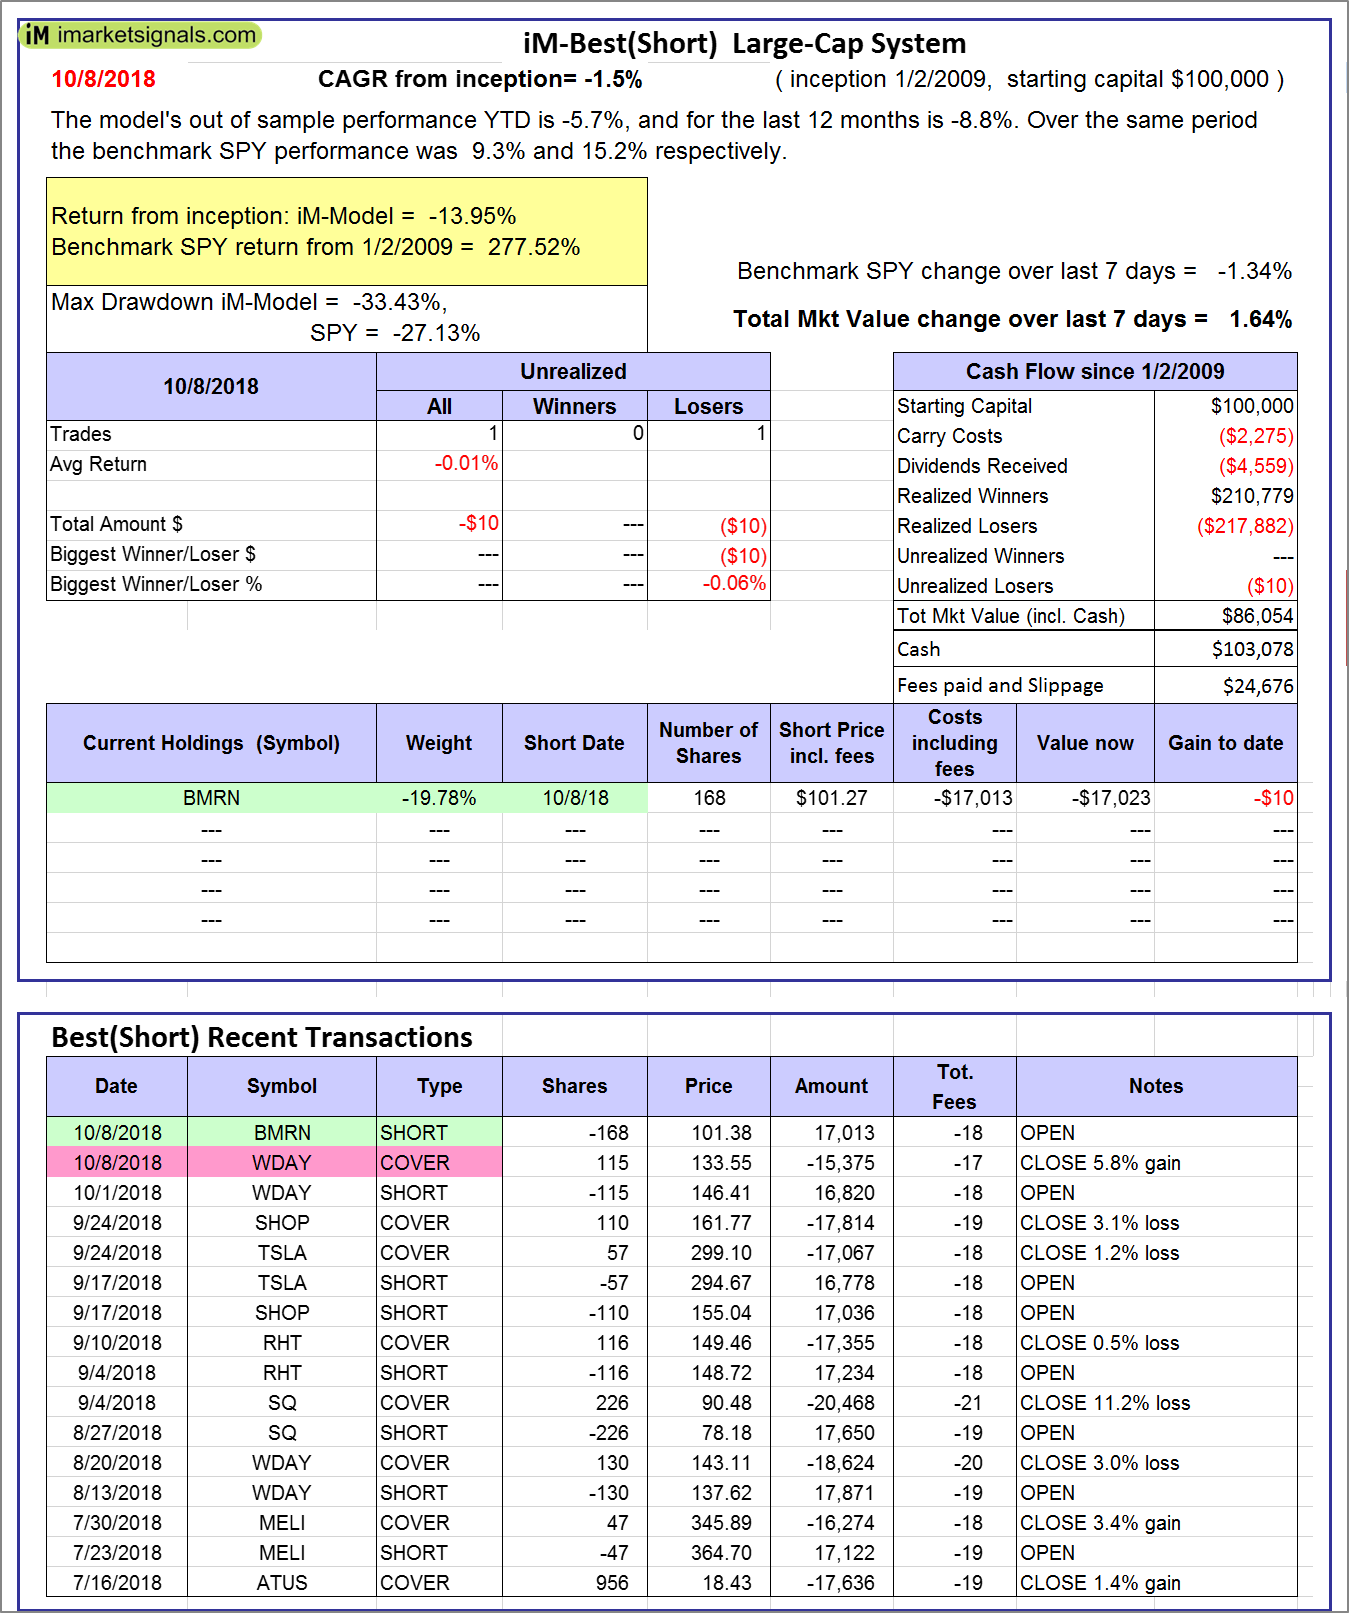 |
iM-Best(Short): The model’s out of sample performance YTD is -5.7%, and for the last 12 months is -8.8%. Over the same period the benchmark SPY performance was 9.3% and 15.2% respectively. Over the previous week the market value of iM-Best(Short) gained 1.64% at a time when SPY gained -1.34%. Over the period 1/2/2009 to 10/8/2018 the starting capital of $100,000 would have grown to $86,054 which includes $103,078 cash and excludes $24,676 spent on fees and slippage. |
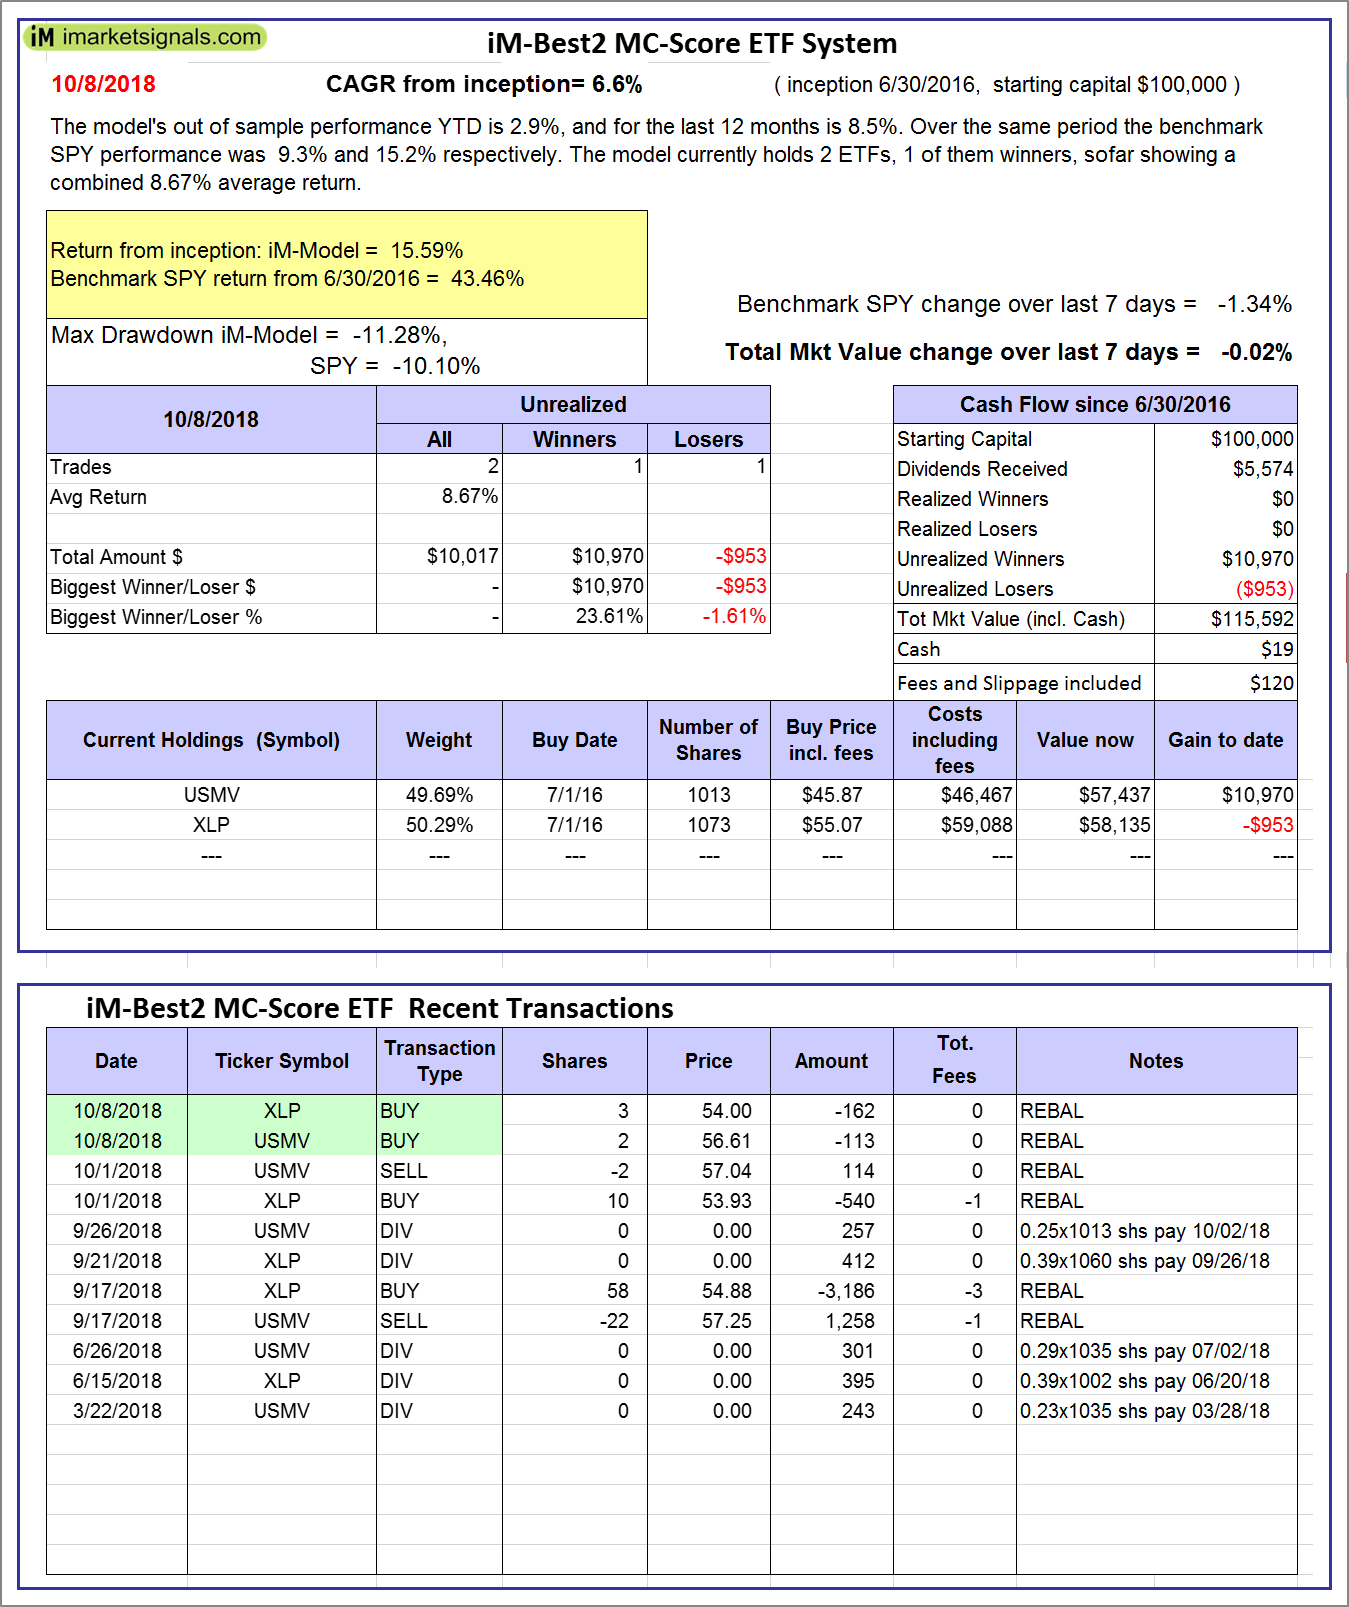 |
iM-Best2 MC-Score ETF System: The model’s out of sample performance YTD is 2.9%, and for the last 12 months is 8.5%. Over the same period the benchmark SPY performance was 9.3% and 15.2% respectively. Over the previous week the market value of the iM-Best2 MC-Score ETF System gained -0.02% at a time when SPY gained -1.34%. A starting capital of $100,000 at inception on 6/30/2016 would have grown to $115,592 which includes $19 cash and excludes $120 spent on fees and slippage. |
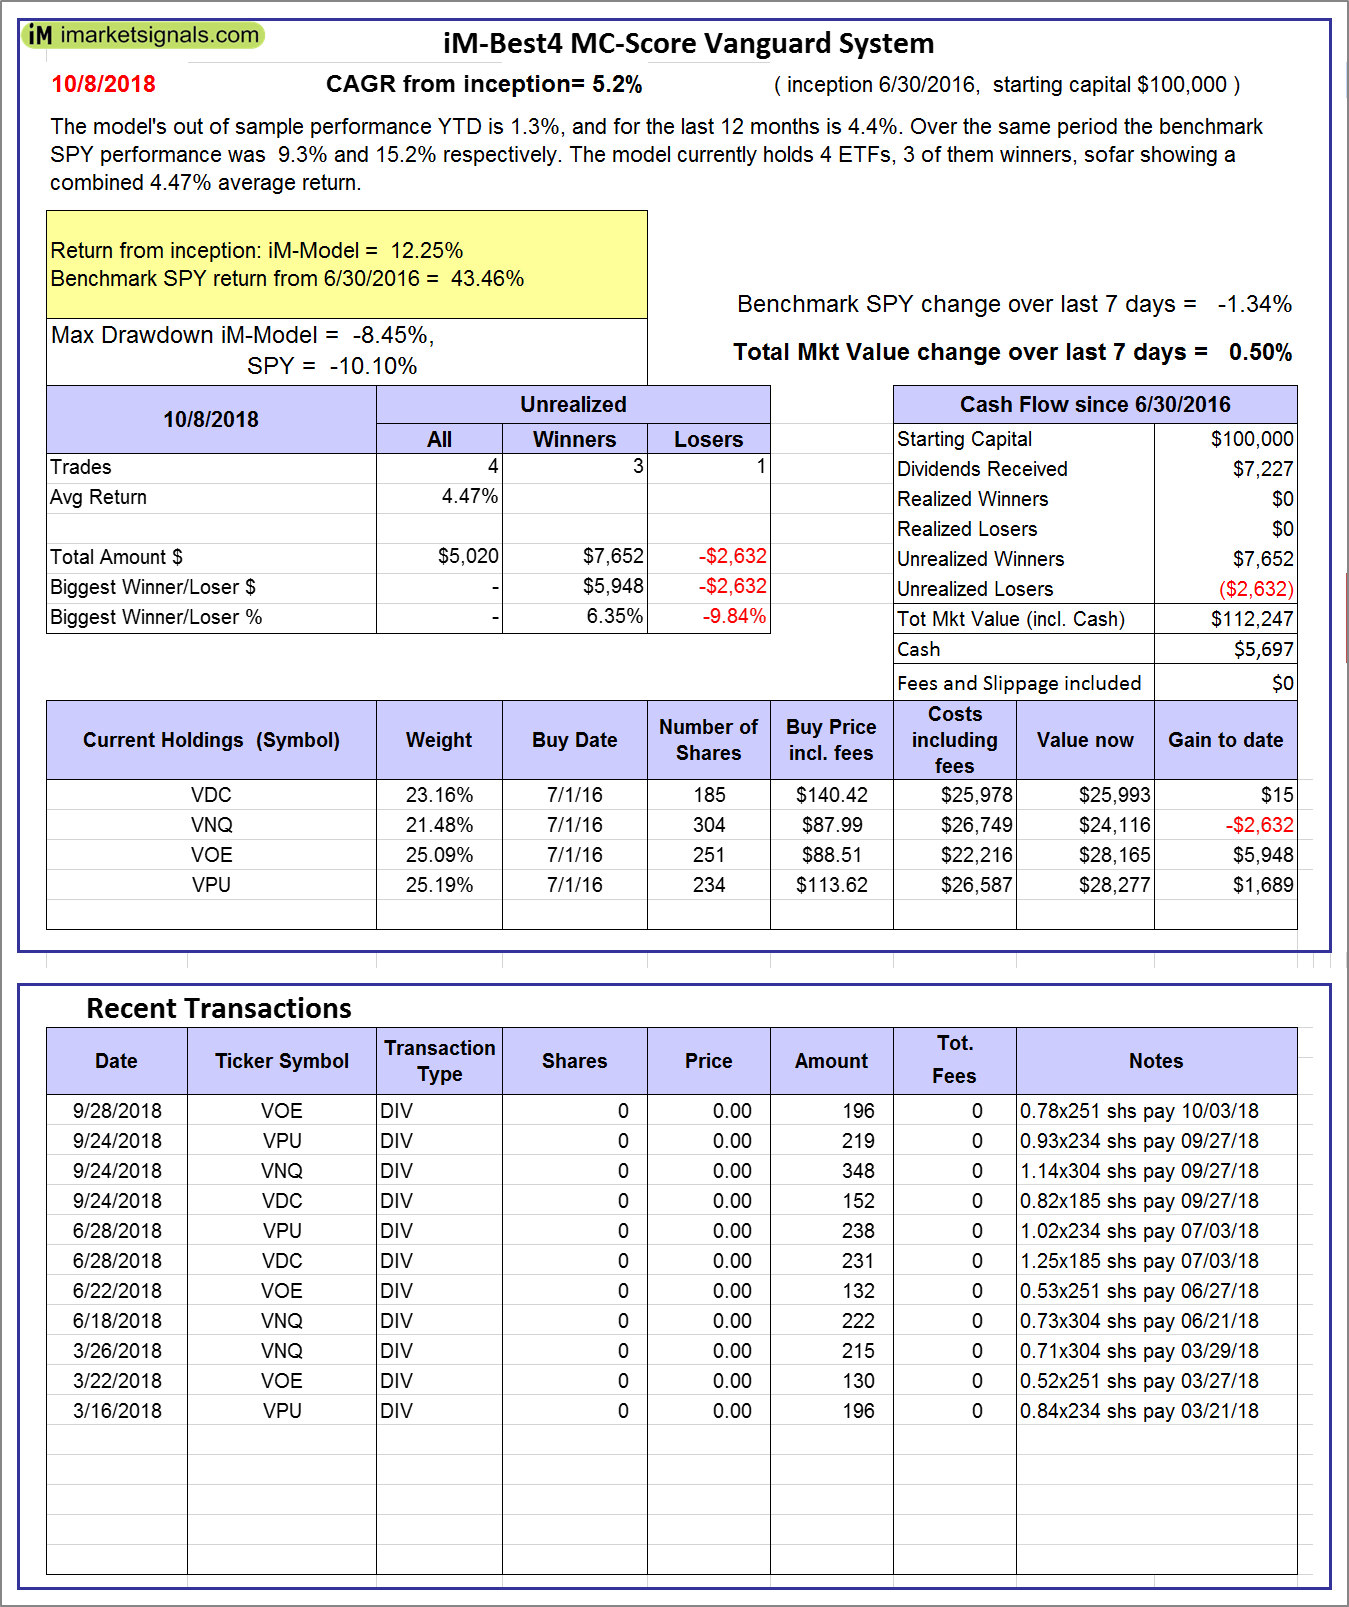 |
iM-Best4 MC-Score Vanguard System: The model’s out of sample performance YTD is 1.3%, and for the last 12 months is 4.4%. Over the same period the benchmark SPY performance was 9.3% and 15.2% respectively. Over the previous week the market value of the iM-Best4 MC-Score Vanguard System gained 0.50% at a time when SPY gained -1.34%. A starting capital of $100,000 at inception on 6/30/2016 would have grown to $112,247 which includes $5,697 cash and excludes $00 spent on fees and slippage. |
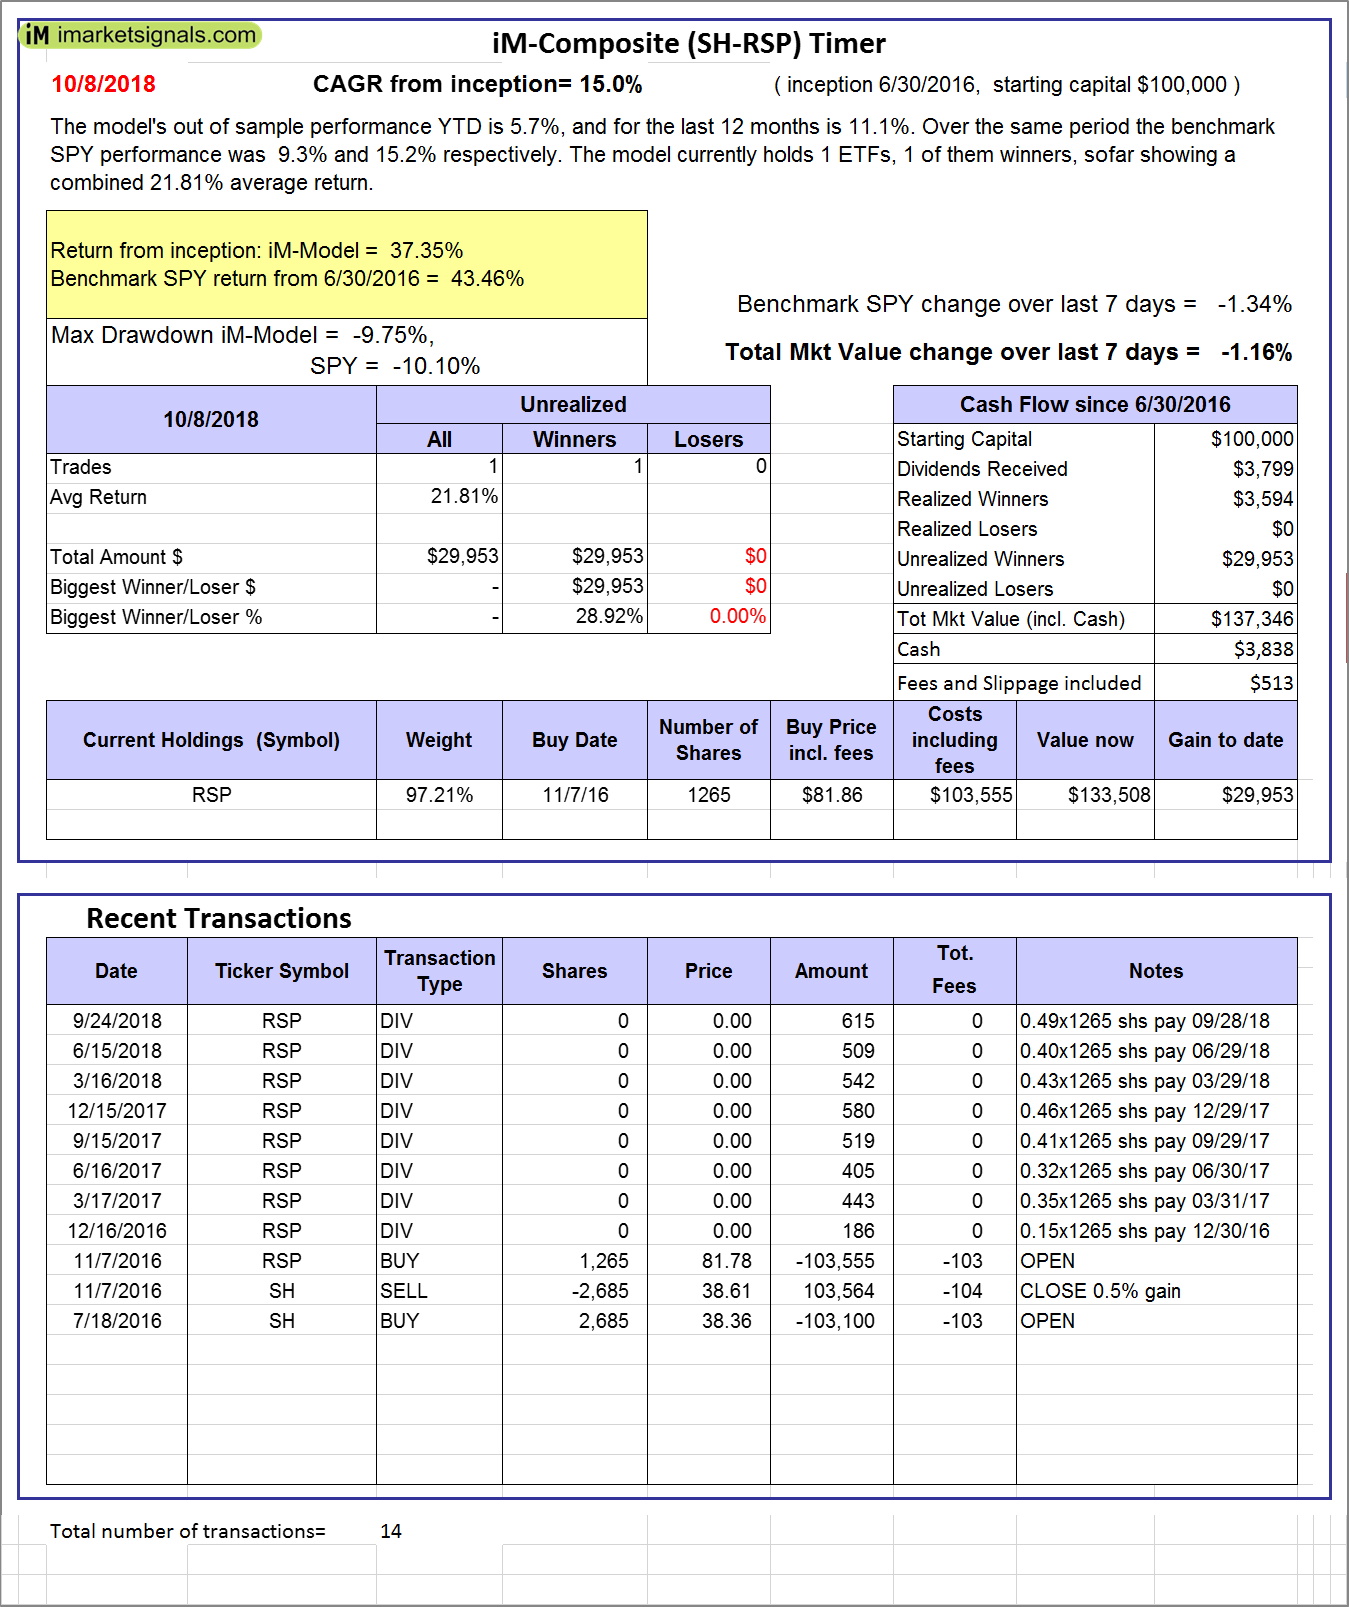 |
iM-Composite (SH-RSP) Timer: The model’s out of sample performance YTD is 5.7%, and for the last 12 months is 11.1%. Over the same period the benchmark SPY performance was 9.3% and 15.2% respectively. Over the previous week the market value of the iM-Composite (SH-RSP) Timer gained -1.16% at a time when SPY gained -1.34%. A starting capital of $100,000 at inception on 6/30/2016 would have grown to $137,346 which includes $3,838 cash and excludes $513 spent on fees and slippage. |
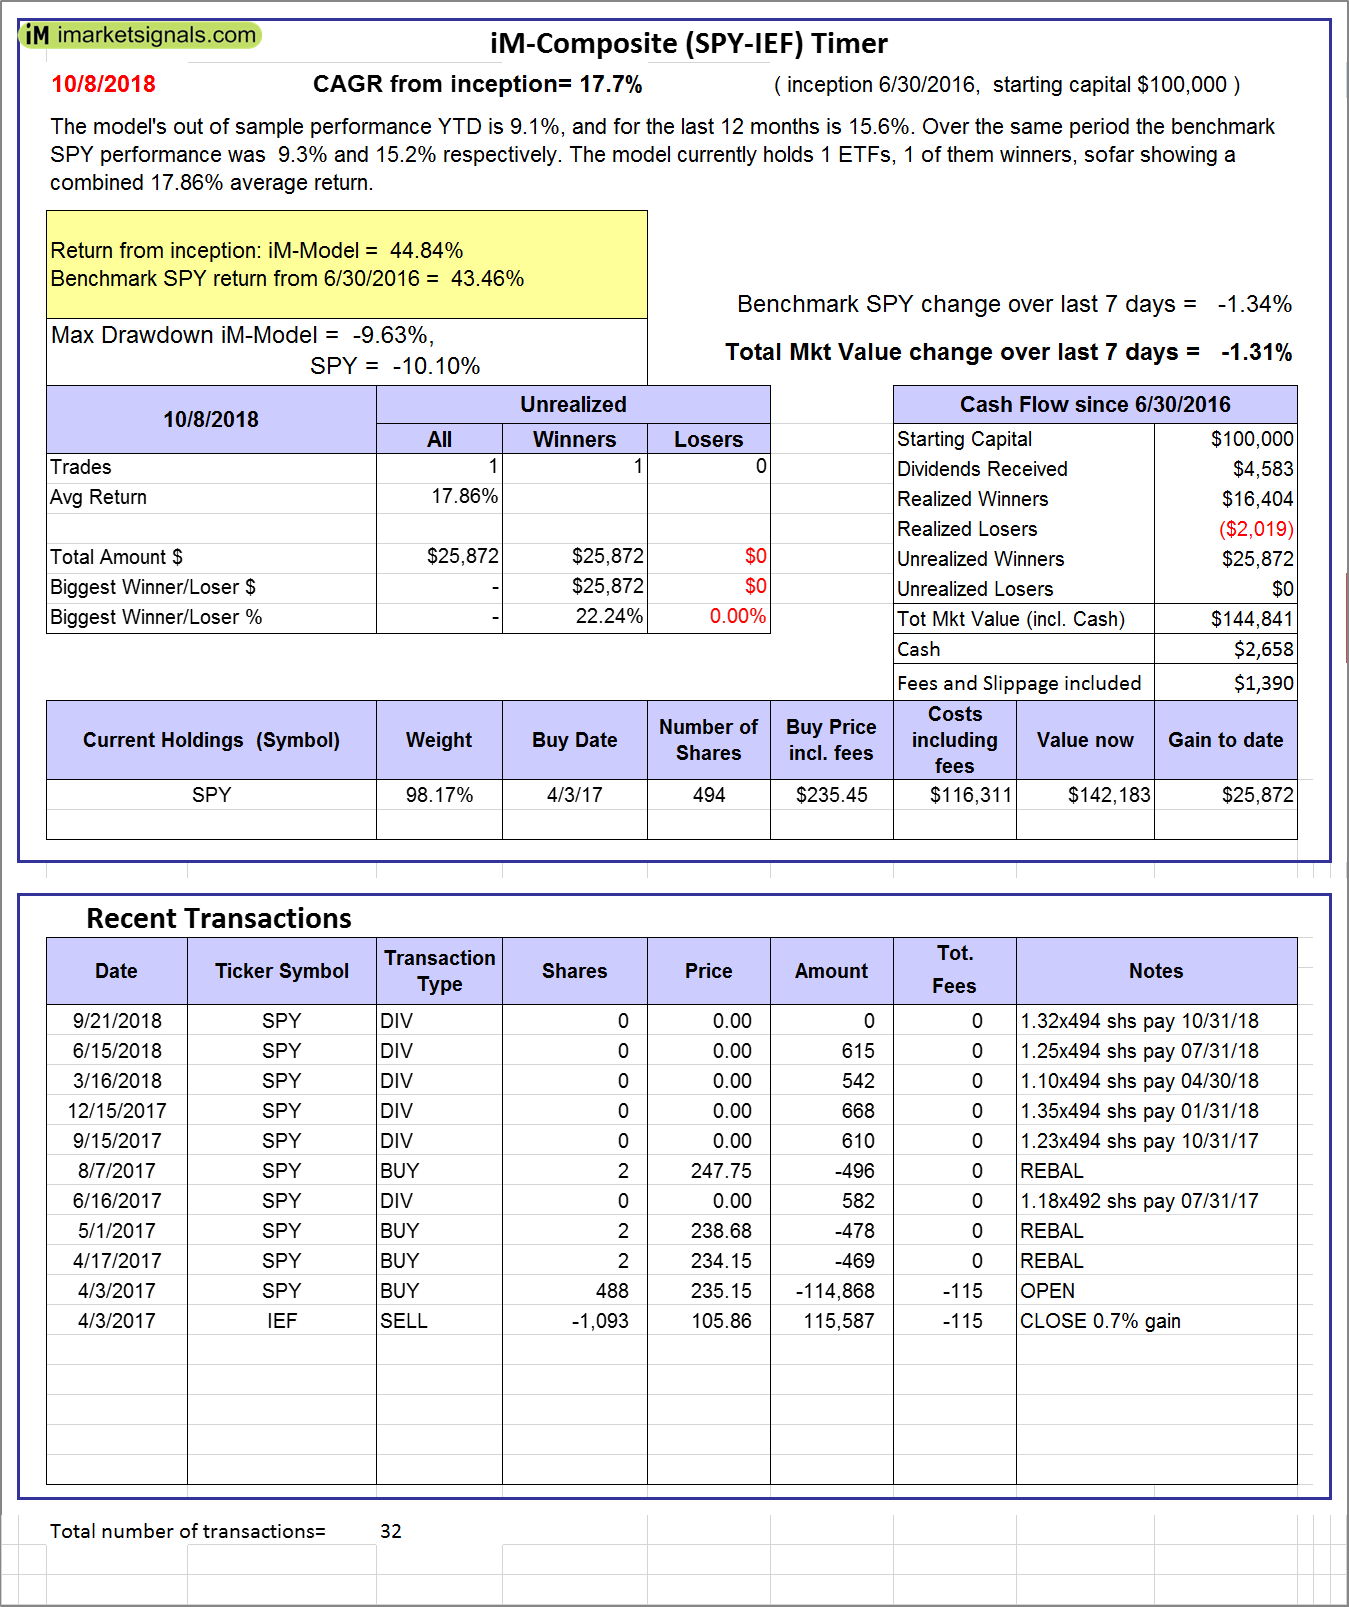 |
iM-Composite (SPY-IEF) Timer: The model’s out of sample performance YTD is 9.1%, and for the last 12 months is 15.6%. Over the same period the benchmark SPY performance was 9.3% and 15.2% respectively. Over the previous week the market value of the iM-Composite (SPY-IEF) Timer gained -1.31% at a time when SPY gained -1.34%. A starting capital of $100,000 at inception on 6/30/2016 would have grown to $144,841 which includes $2,658 cash and excludes $1,390 spent on fees and slippage. |
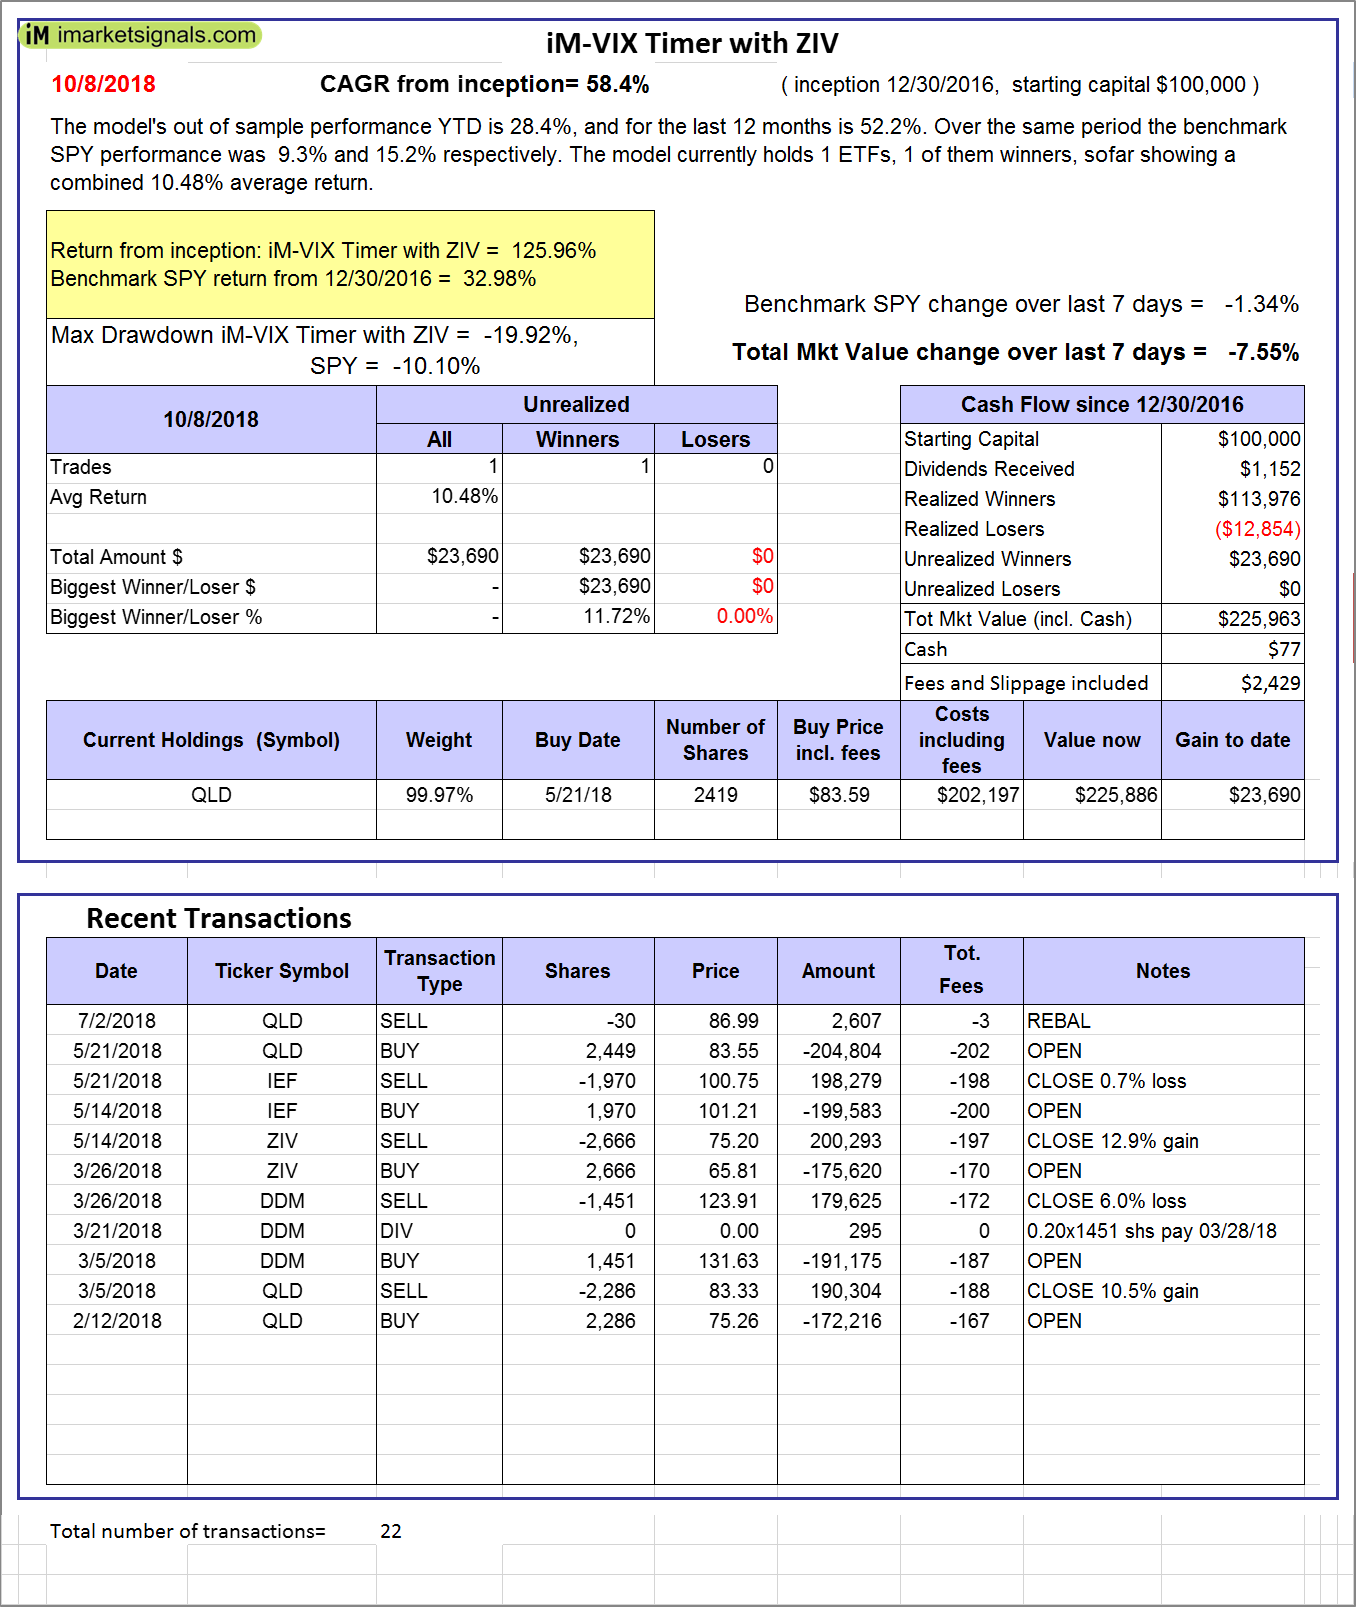 |
iM-VIX Timer with ZIV: The model’s out of sample performance YTD is 28.4%, and for the last 12 months is 52.2%. Over the same period the benchmark SPY performance was 9.3% and 15.2% respectively. Over the previous week the market value of the iM-VIX Timer with ZIV gained -7.55% at a time when SPY gained -1.34%. A starting capital of $100,000 at inception on 6/30/2016 would have grown to $225,963 which includes $77 cash and excludes $2,429 spent on fees and slippage. |
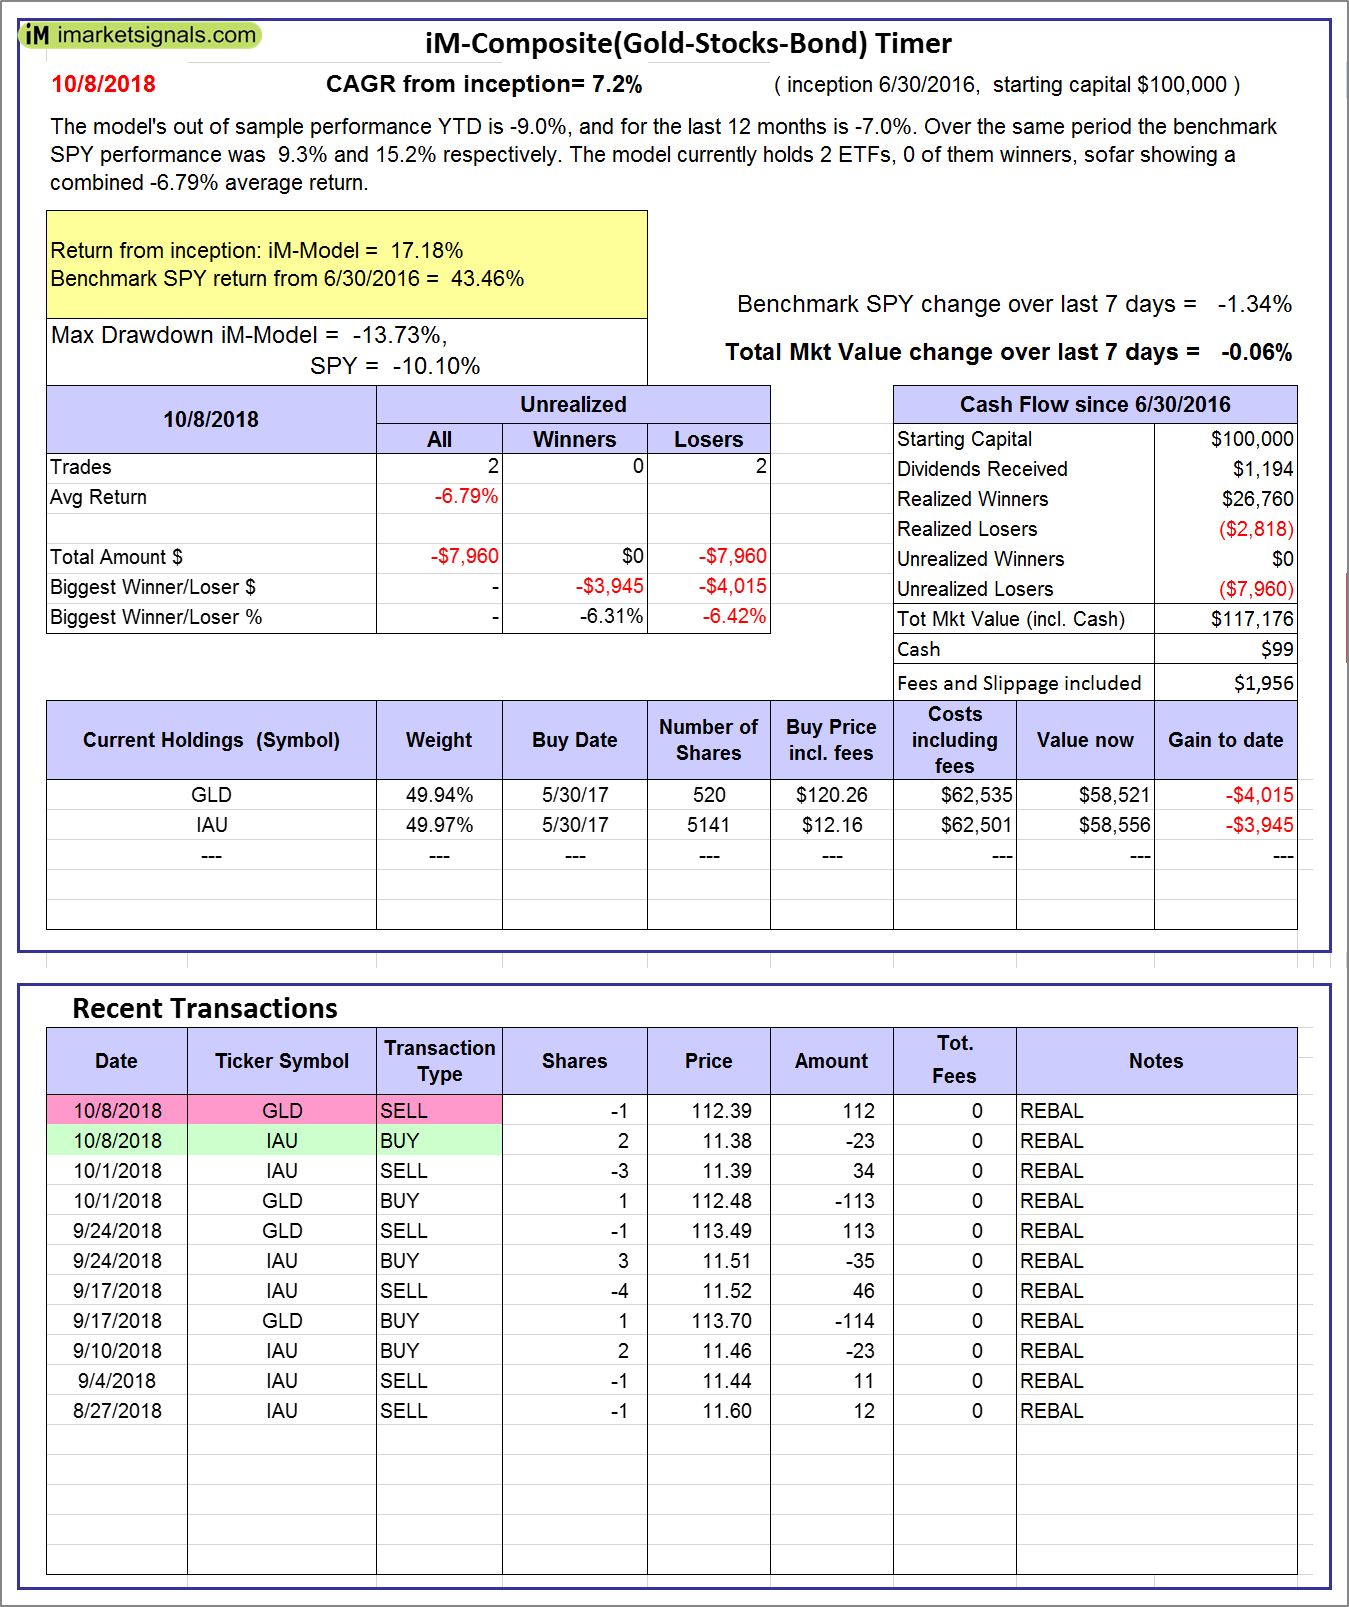 |
iM-Composite(Gold-Stocks-Bond) Timer: The model’s out of sample performance YTD is -9.0%, and for the last 12 months is -7.0%. Over the same period the benchmark SPY performance was 9.3% and 15.2% respectively. Over the previous week the market value of the iM-Composite(Gold-Stocks-Bond) Timer gained -0.06% at a time when SPY gained -1.34%. A starting capital of $100,000 at inception on 6/30/2016 would have grown to $117,176 which includes $99 cash and excludes $1,956 spent on fees and slippage. |
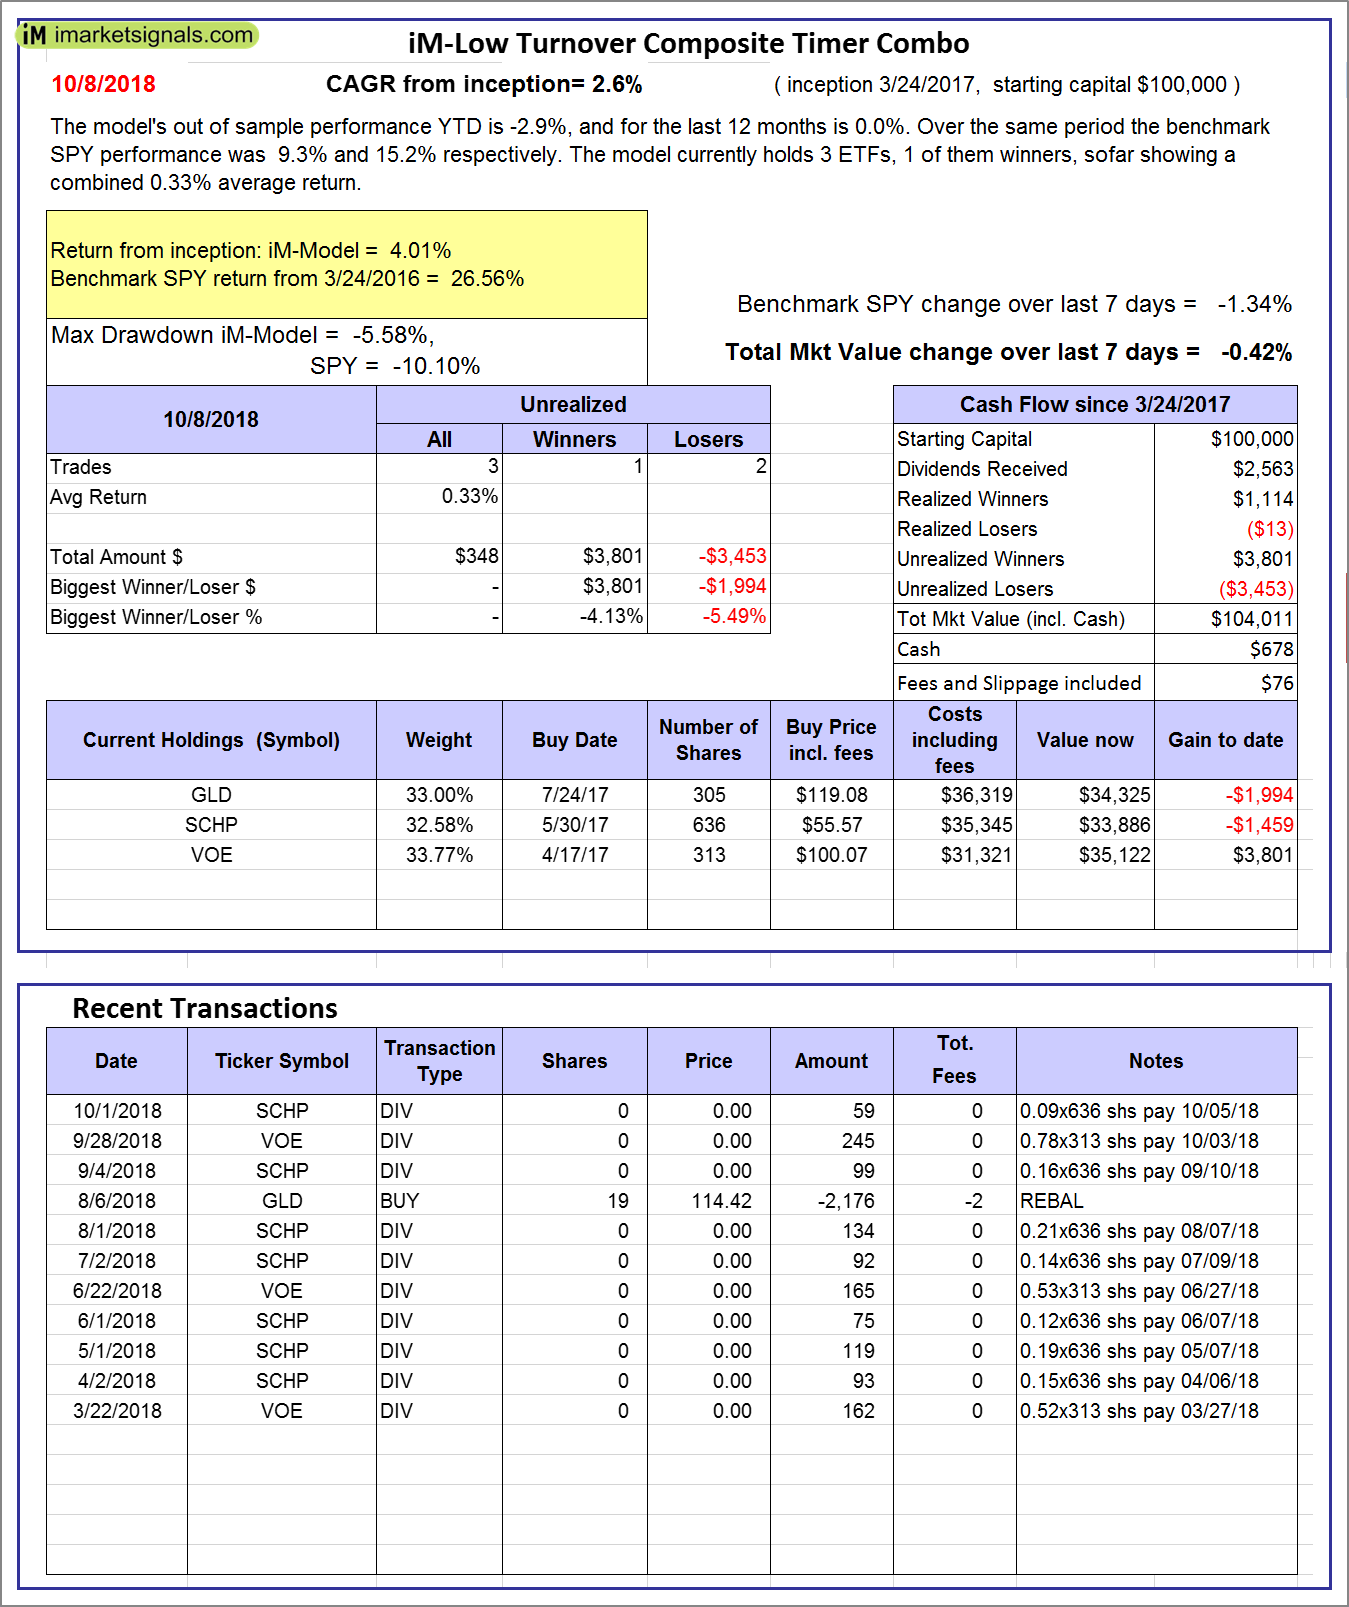 |
iM-Low Turnover Composite Timer Combo: The model’s out of sample performance YTD is -2.9%, and for the last 12 months is 0.0%. Over the same period the benchmark SPY performance was 9.3% and 15.2% respectively. Over the previous week the market value of the iM-Low Turnover Composite Timer Combo gained -0.42% at a time when SPY gained -1.34%. A starting capital of $100,000 at inception on 3/24/27 would have grown to $104,011 which includes $678 cash and excludes $76 spent on fees and slippage. |
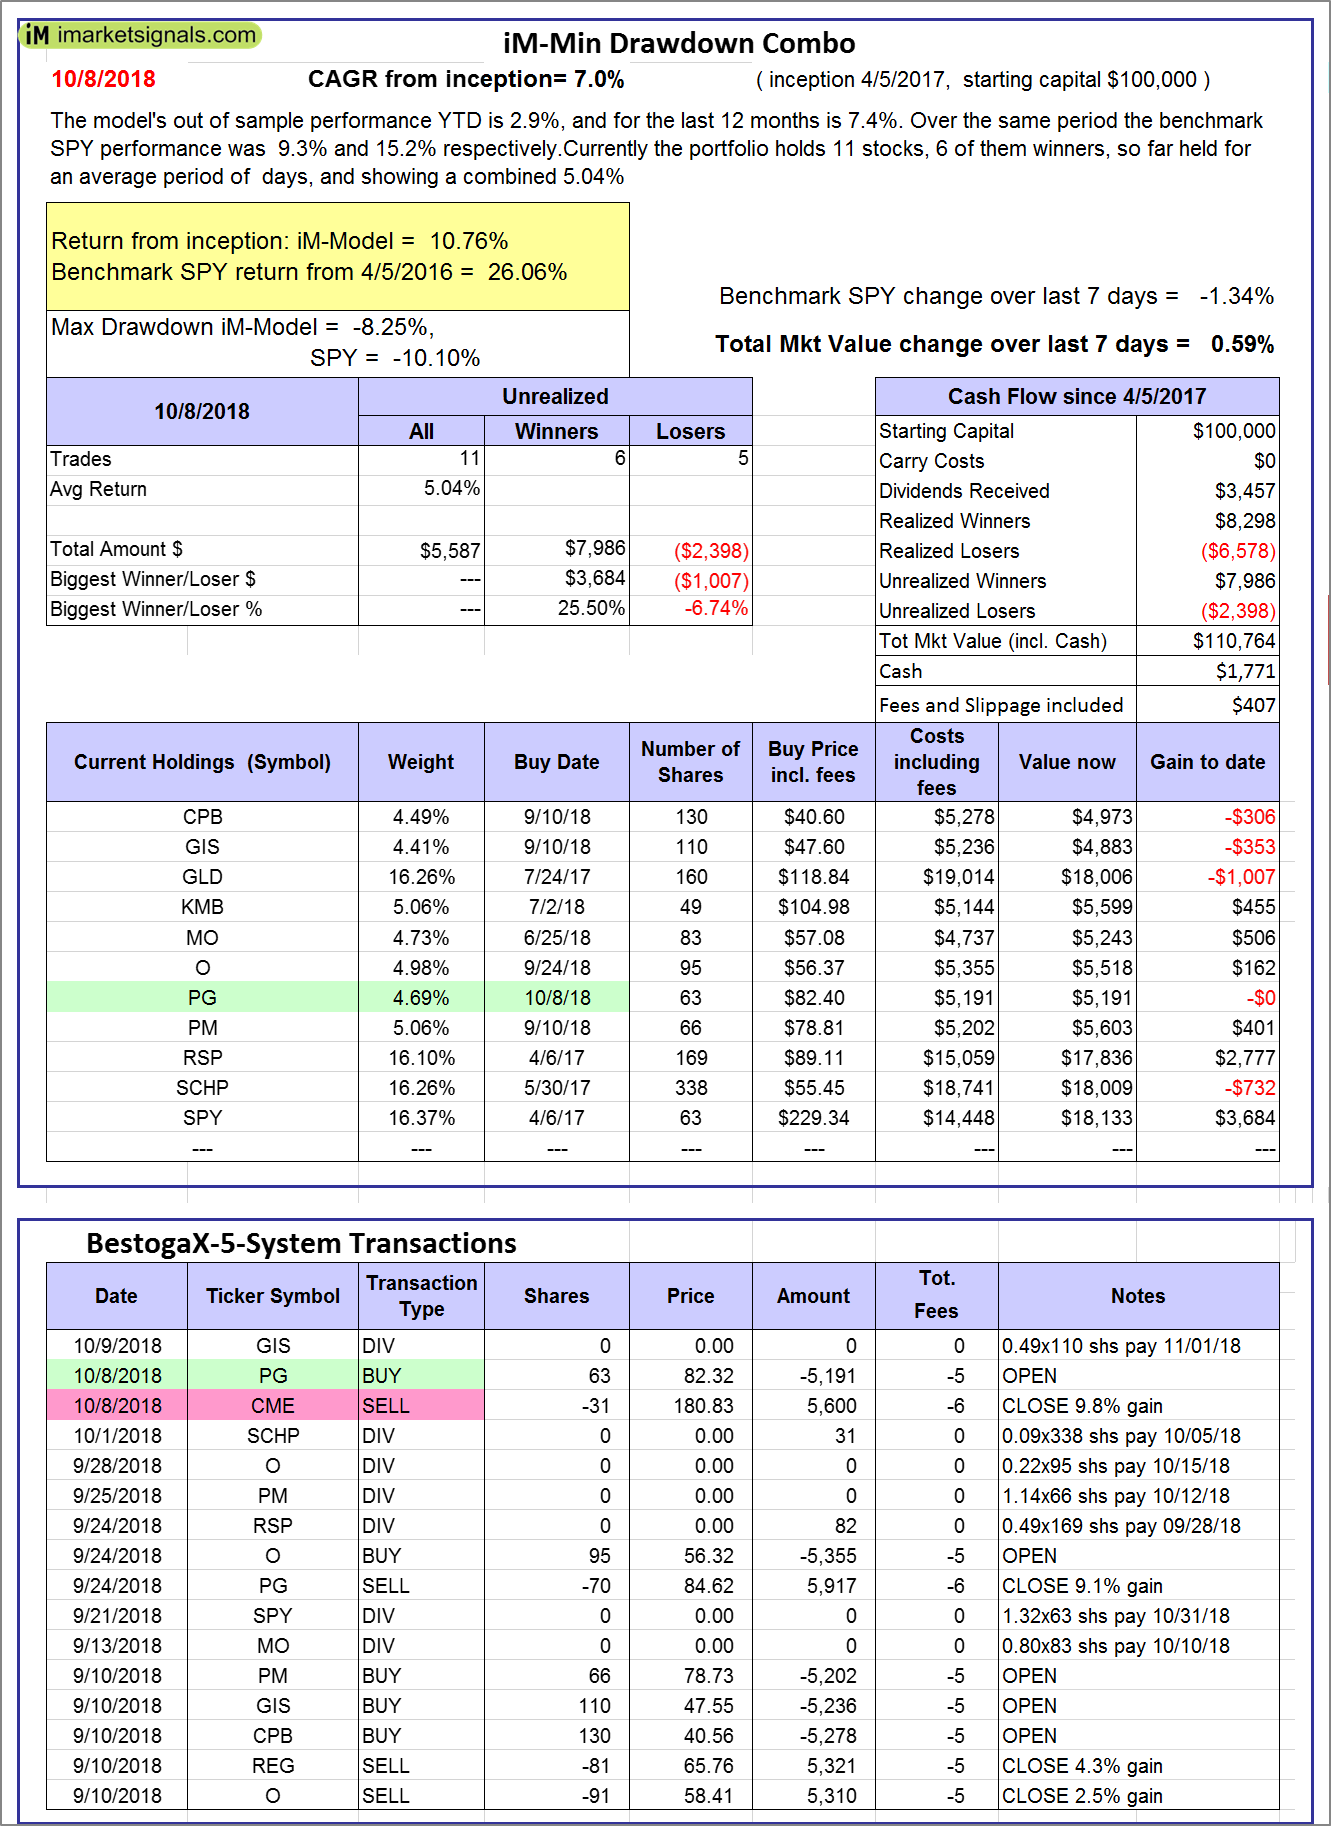 |
iM-Min Drawdown Combo: The model’s out of sample performance YTD is 2.9%, and for the last 12 months is 7.4%. Over the same period the benchmark SPY performance was 9.3% and 15.2% respectively. Over the previous week the market value of the iM-Min Drawdown Combo gained 0.59% at a time when SPY gained -1.34%. A starting capital of $100,000 at inception on 4/5/2017 would have grown to $110,764 which includes $1,771 cash and excludes $407 spent on fees and slippage. |
 |
iM-5ETF Trader (includes leveraged ETFs): The model’s out of sample performance YTD is 13.9%, and for the last 12 months is 25.0%. Over the same period the benchmark SPY performance was 9.3% and 15.2% respectively. Over the previous week the market value of the iM-5ETF Trader (includes leveraged ETFs) gained -3.81% at a time when SPY gained -1.34%. A starting capital of $100,000 at inception on 10/30/2016 would have grown to $185,430 which includes $1,874 cash and excludes $1,030 spent on fees and slippage. |
 |
iM-Standard 5ETF Trader (excludes leveraged ETFs): The model’s out of sample performance YTD is 7.5%, and for the last 12 months is 13.6%. Over the same period the benchmark SPY performance was 9.3% and 15.2% respectively. Over the previous week the market value of the iM-Standard 5ETF Trader (excludes leveraged ETFs) gained -1.22% at a time when SPY gained -1.34%. A starting capital of $100,000 at inception on 10/30/2016 would have grown to $134,894 which includes $3,638 cash and excludes $880 spent on fees and slippage. |
iM-Best Reports – 10/8/2018
Posted in pmp SPY-SH
Leave a Reply
You must be logged in to post a comment.