
  |
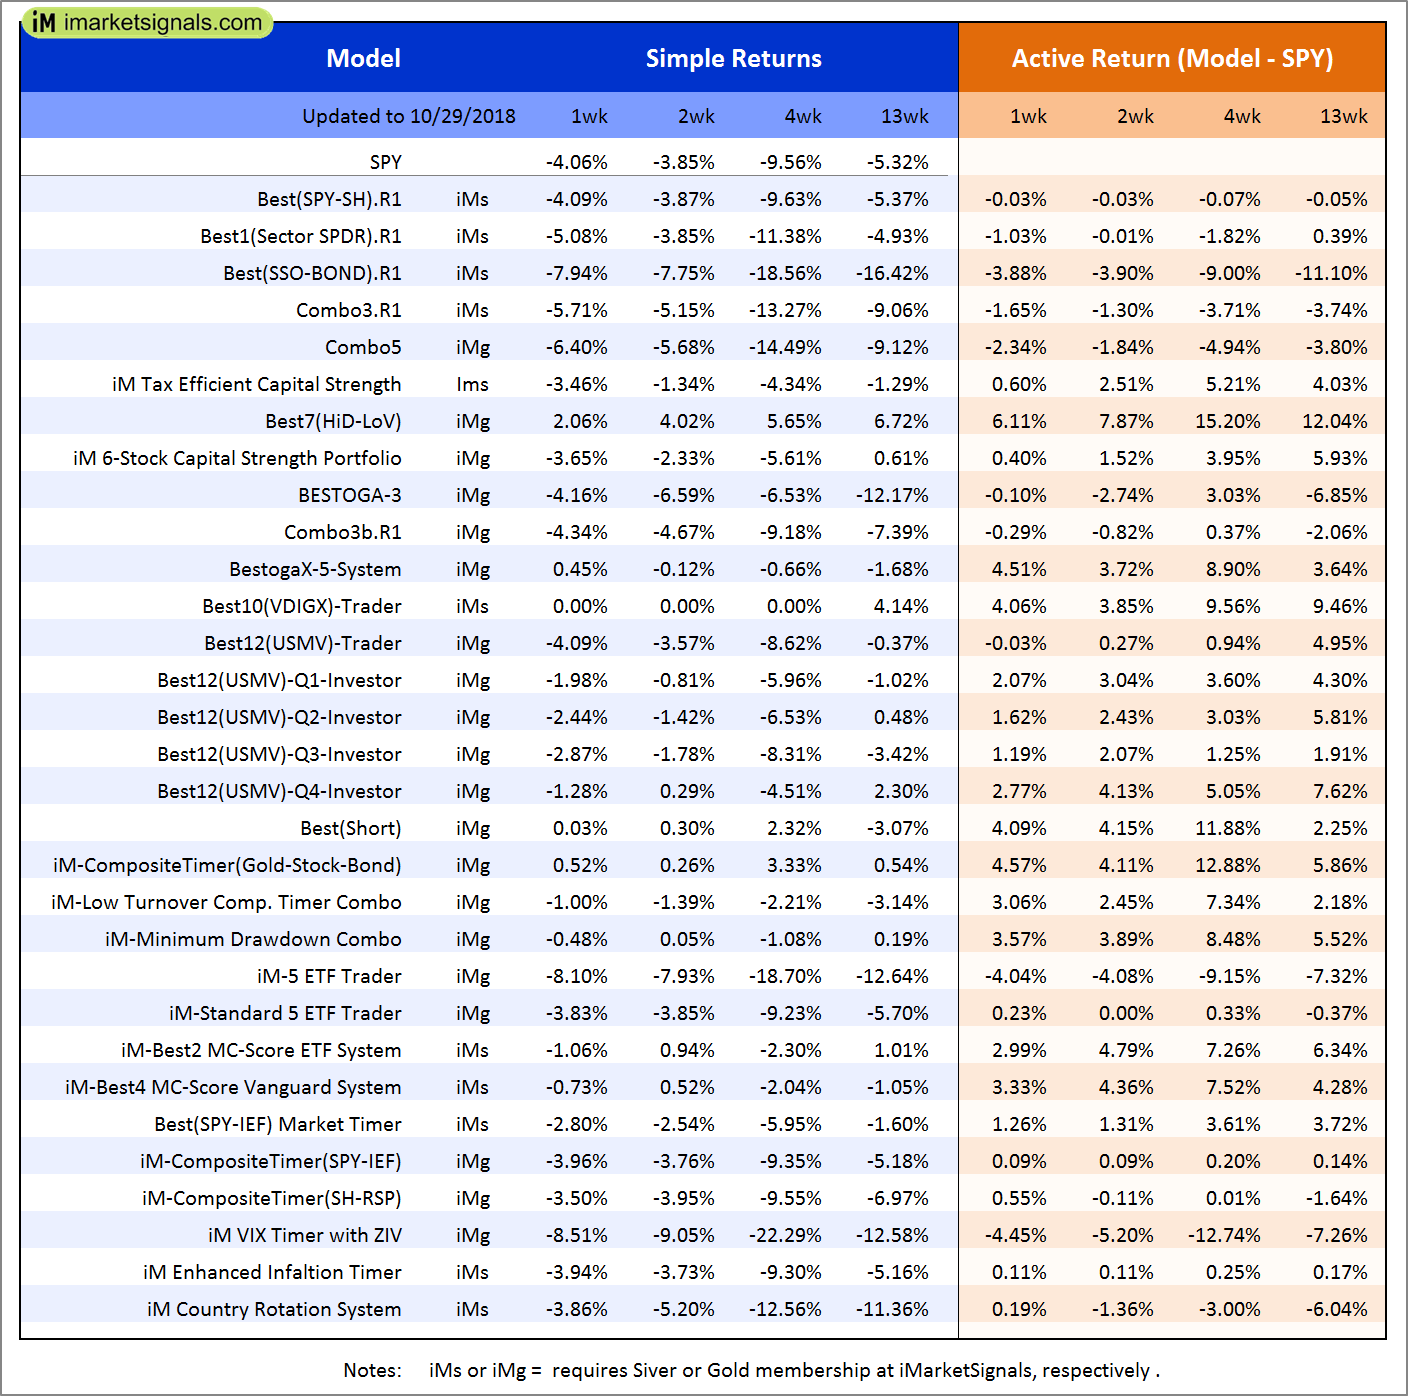
Out of sample performance summary of our models for the past 1, 2, 4 and 13 week periods. The active active return indicates how the models over- or underperformed the benchmark ETF SPY. Also the YTD, and the 1-, 3-, 5- and 10-year annualized returns are shown in the second table |
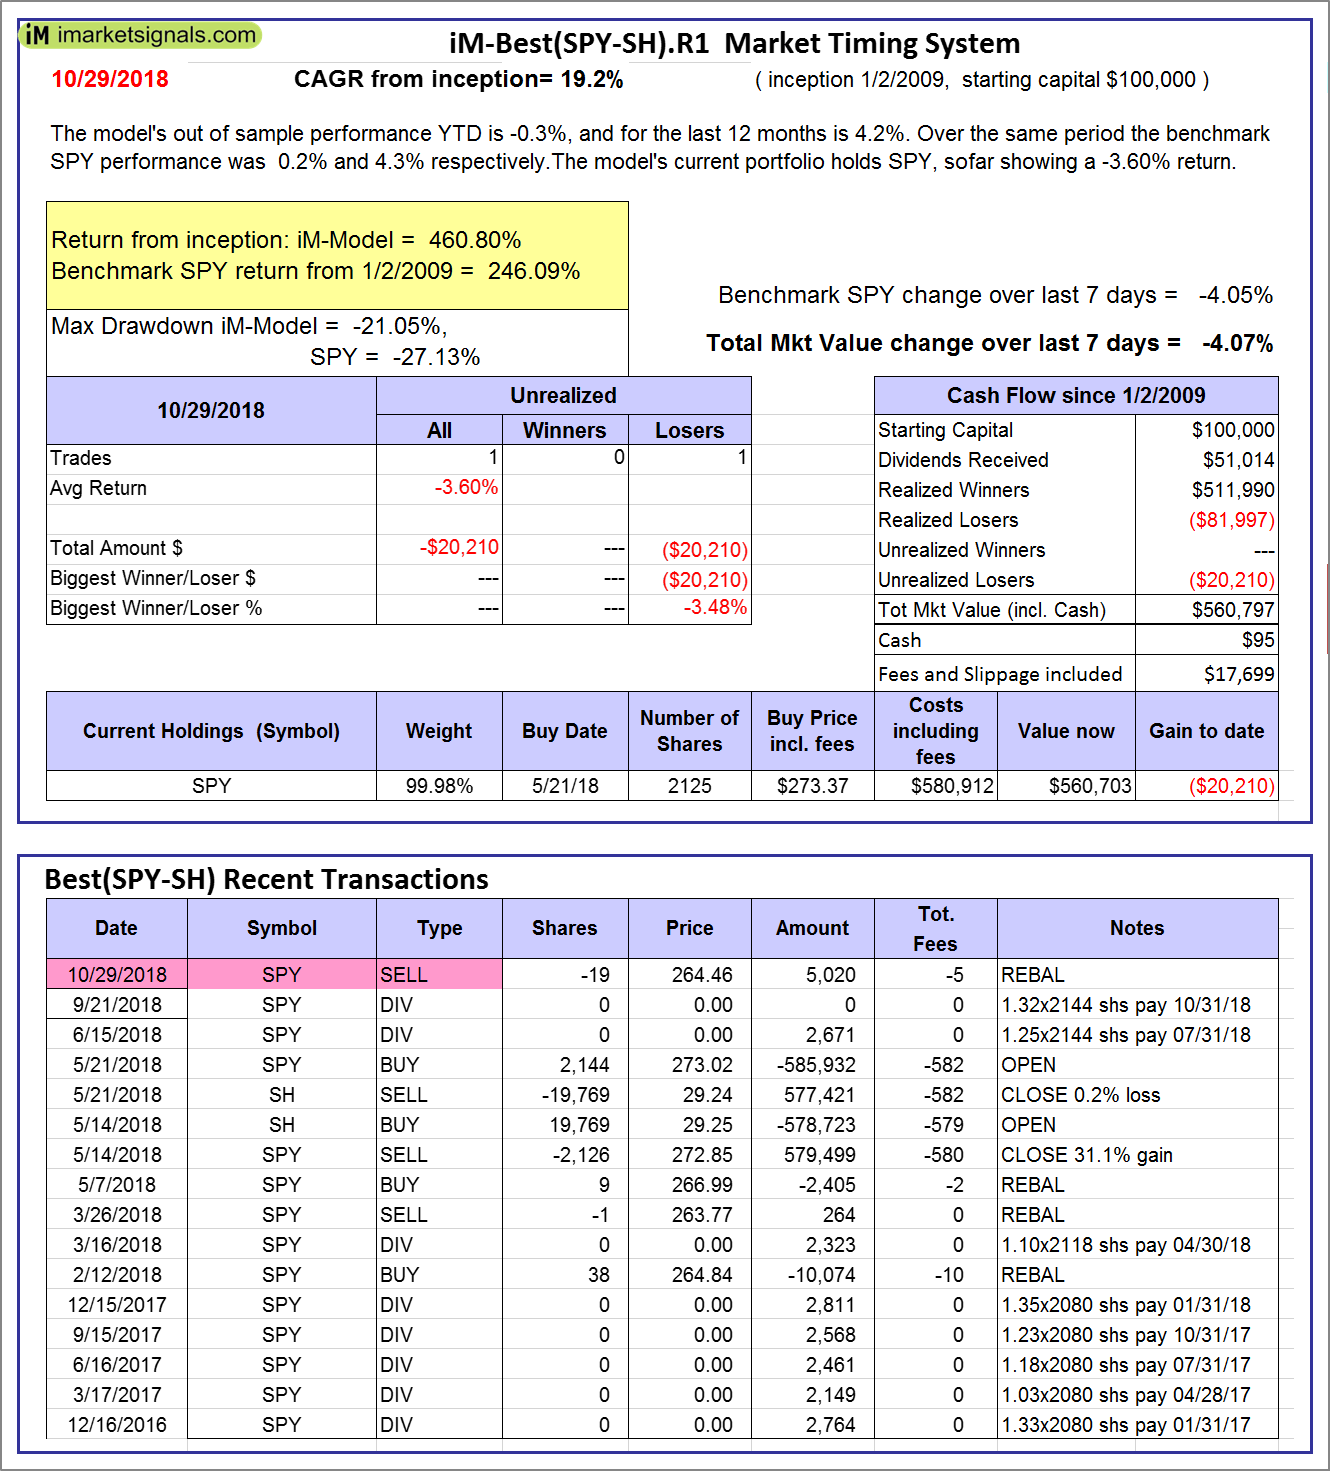 |
iM-Best(SPY-SH).R1: The model’s out of sample performance YTD is -0.3%, and for the last 12 months is 4.2%. Over the same period the benchmark SPY performance was 0.2% and 4.3% respectively. Over the previous week the market value of Best(SPY-SH) gained -4.07% at a time when SPY gained -4.05%. A starting capital of $100,000 at inception on 1/2/2009 would have grown to $560,797 which includes $95 cash and excludes $17,699 spent on fees and slippage. |
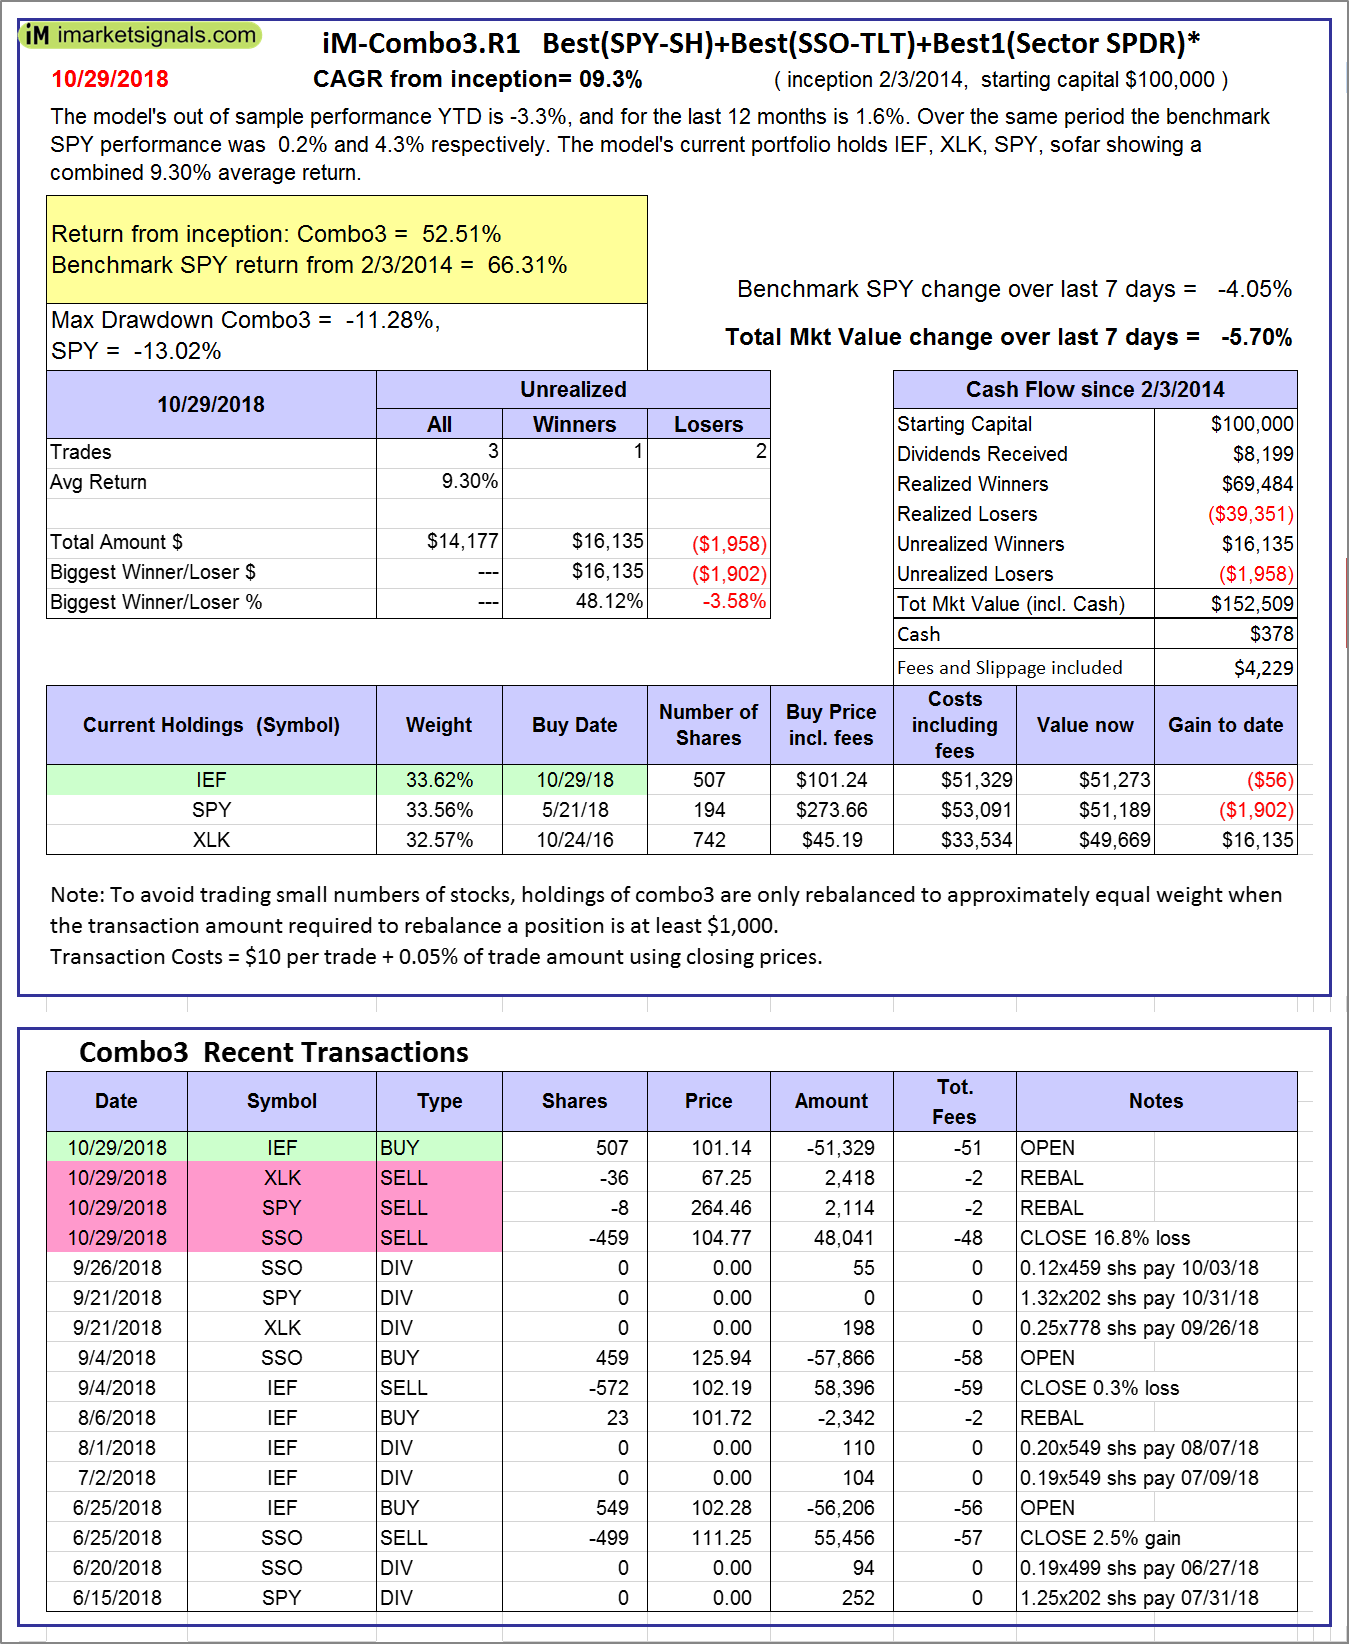 |
iM-Combo3.R1: The model’s out of sample performance YTD is -3.3%, and for the last 12 months is 1.6%. Over the same period the benchmark SPY performance was 0.2% and 4.3% respectively. Over the previous week the market value of iM-Combo3.R1 gained -5.70% at a time when SPY gained -4.05%. A starting capital of $100,000 at inception on 2/3/2014 would have grown to $152,509 which includes $378 cash and excludes $4,229 spent on fees and slippage. |
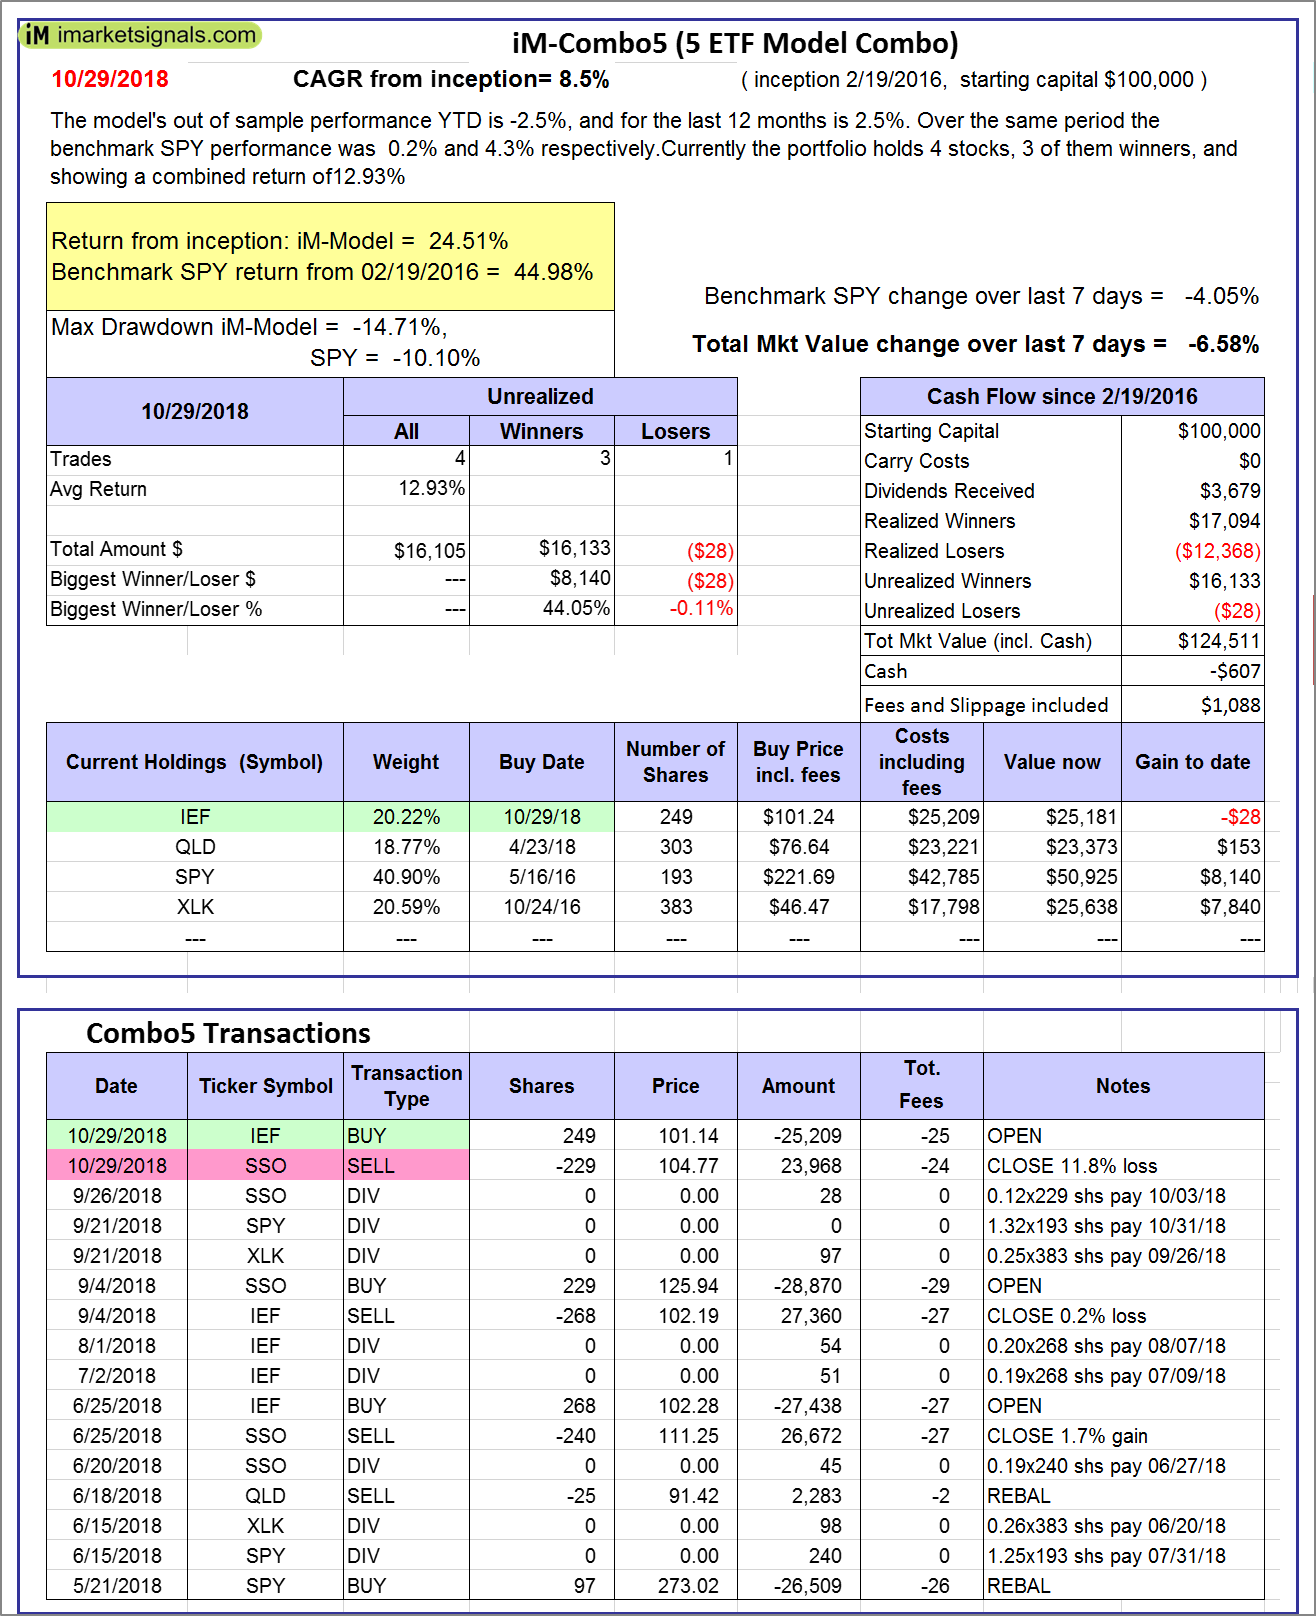 |
iM-Combo5: The model’s out of sample performance YTD is -2.5%, and for the last 12 months is 2.5%. Over the same period the benchmark SPY performance was 0.2% and 4.3% respectively. Over the previous week the market value of iM-Combo5 gained -6.58% at a time when SPY gained -4.05%. A starting capital of $100,000 at inception on 2/22/2016 would have grown to $124,511 which includes -$607 cash and excludes $1,088 spent on fees and slippage. |
 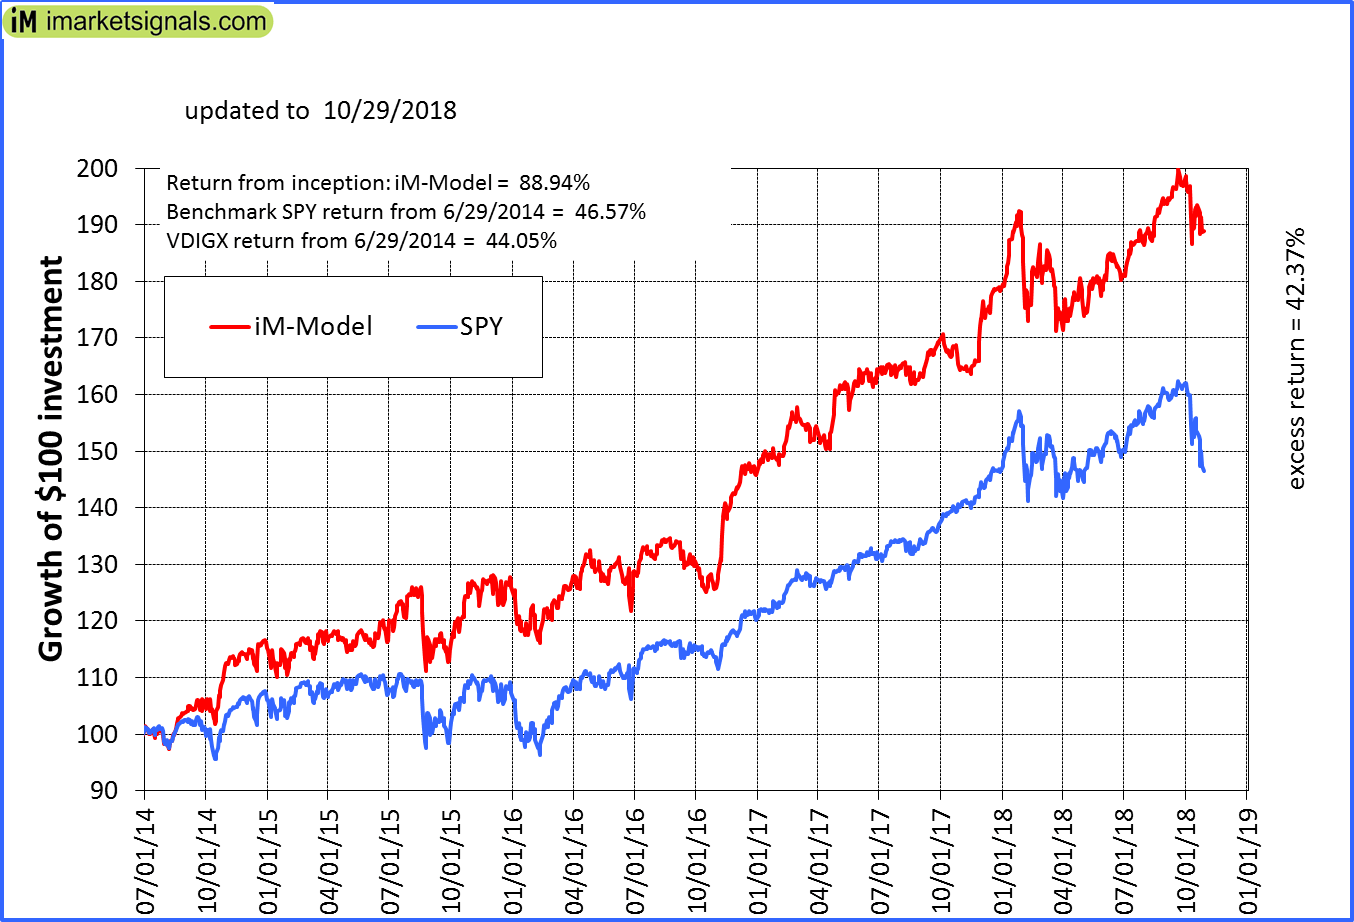 |
iM-Best10(VDIGX)-Trader: The model’s out of sample performance YTD is 6.0%, and for the last 12 months is 14.2%. Over the same period the benchmark SPY performance was 0.2% and 4.3% respectively. Since inception, on 7/1/2014, the model gained 88.94% while the benchmark SPY gained 46.57% and VDIGX gained 44.05% over the same period. Over the previous week the market value of iM-Best10(VDIGX) gained -1.88% at a time when SPY gained -4.05%. A starting capital of $100,000 at inception on 7/1/2014 would have grown to $41,819 which includes -$146,507 cash and excludes $2,385 spent on fees and slippage. |
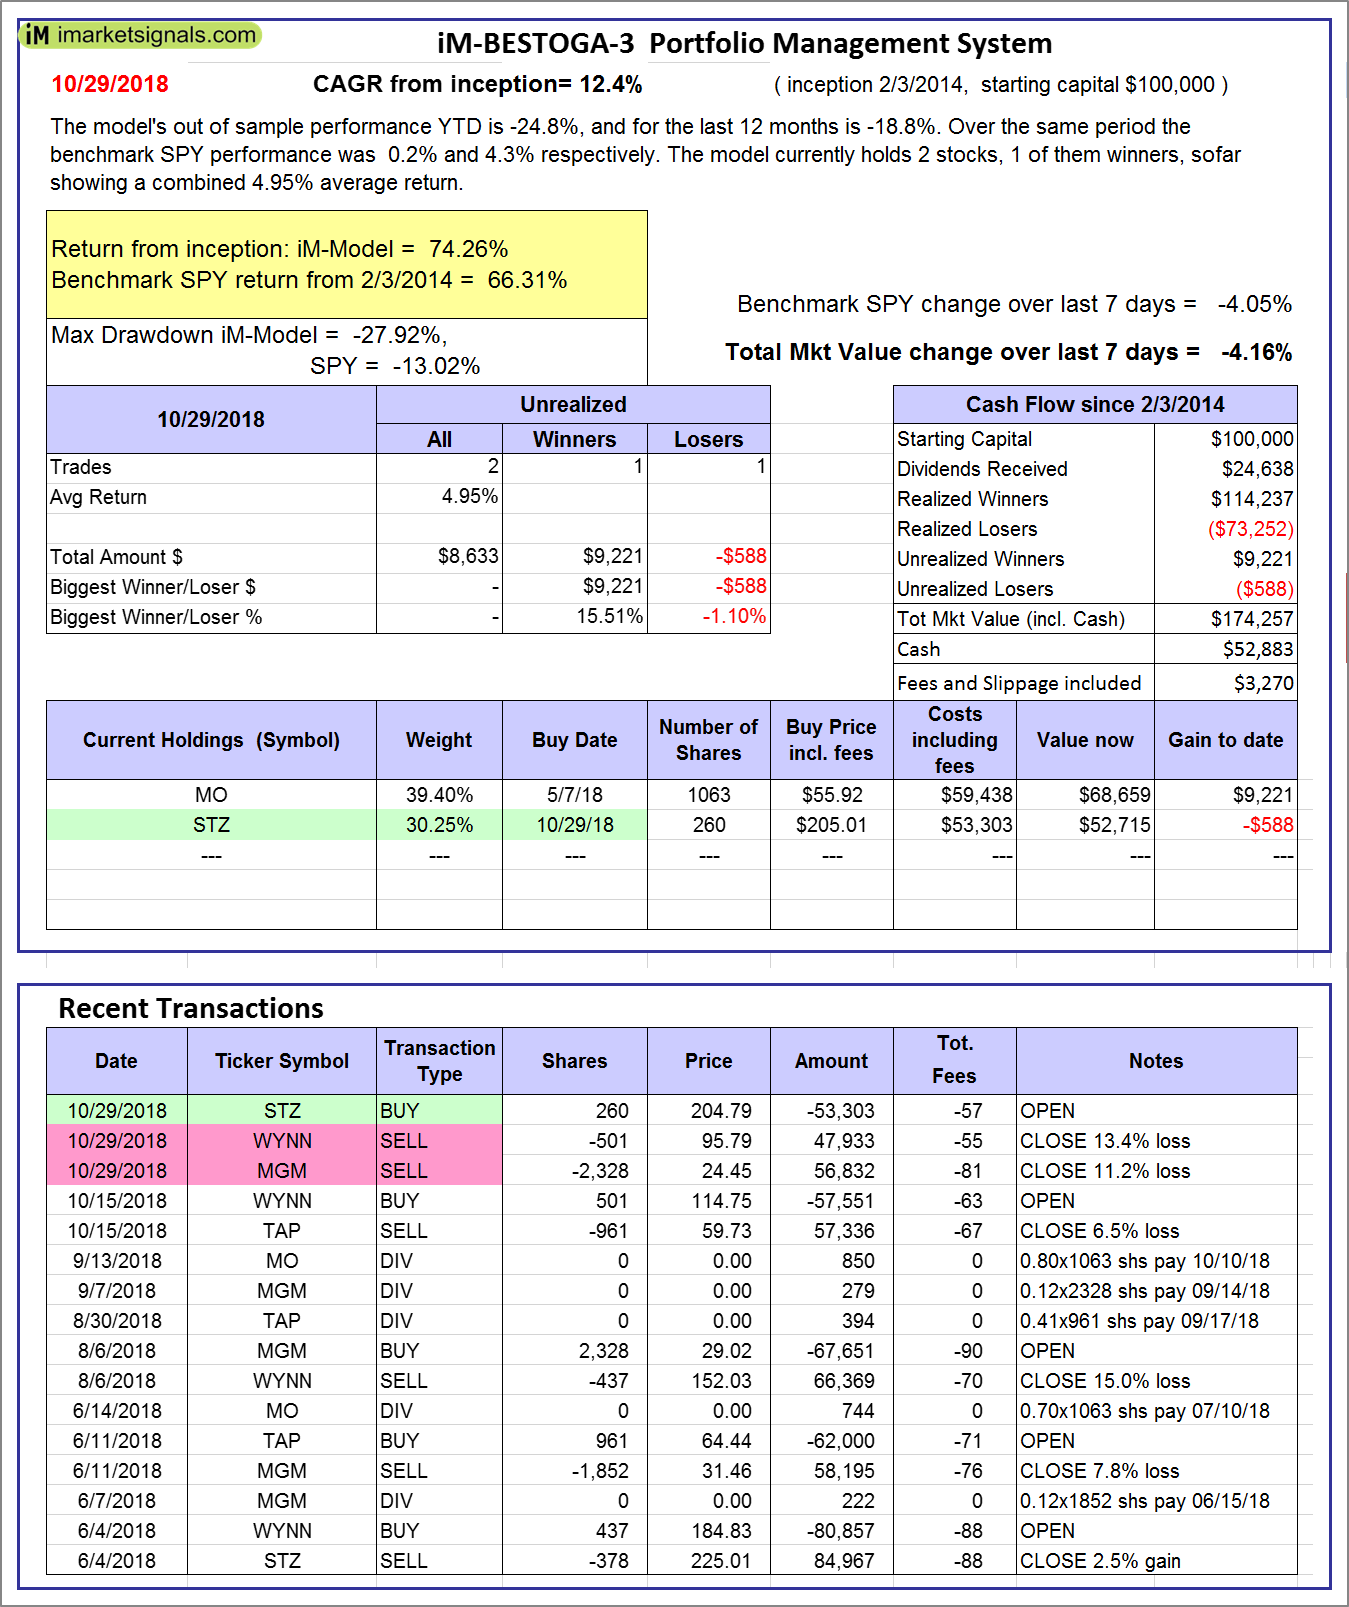 |
iM-BESTOGA-3: The model’s out of sample performance YTD is -24.8%, and for the last 12 months is -18.8%. Over the same period the benchmark SPY performance was 0.2% and 4.3% respectively. Over the previous week the market value of iM-BESTOGA-3 gained -4.16% at a time when SPY gained -4.05%. A starting capital of $100,000 at inception on 2/3/2014 would have grown to $174,257 which includes $52,883 cash and excludes $3,270 spent on fees and slippage. |
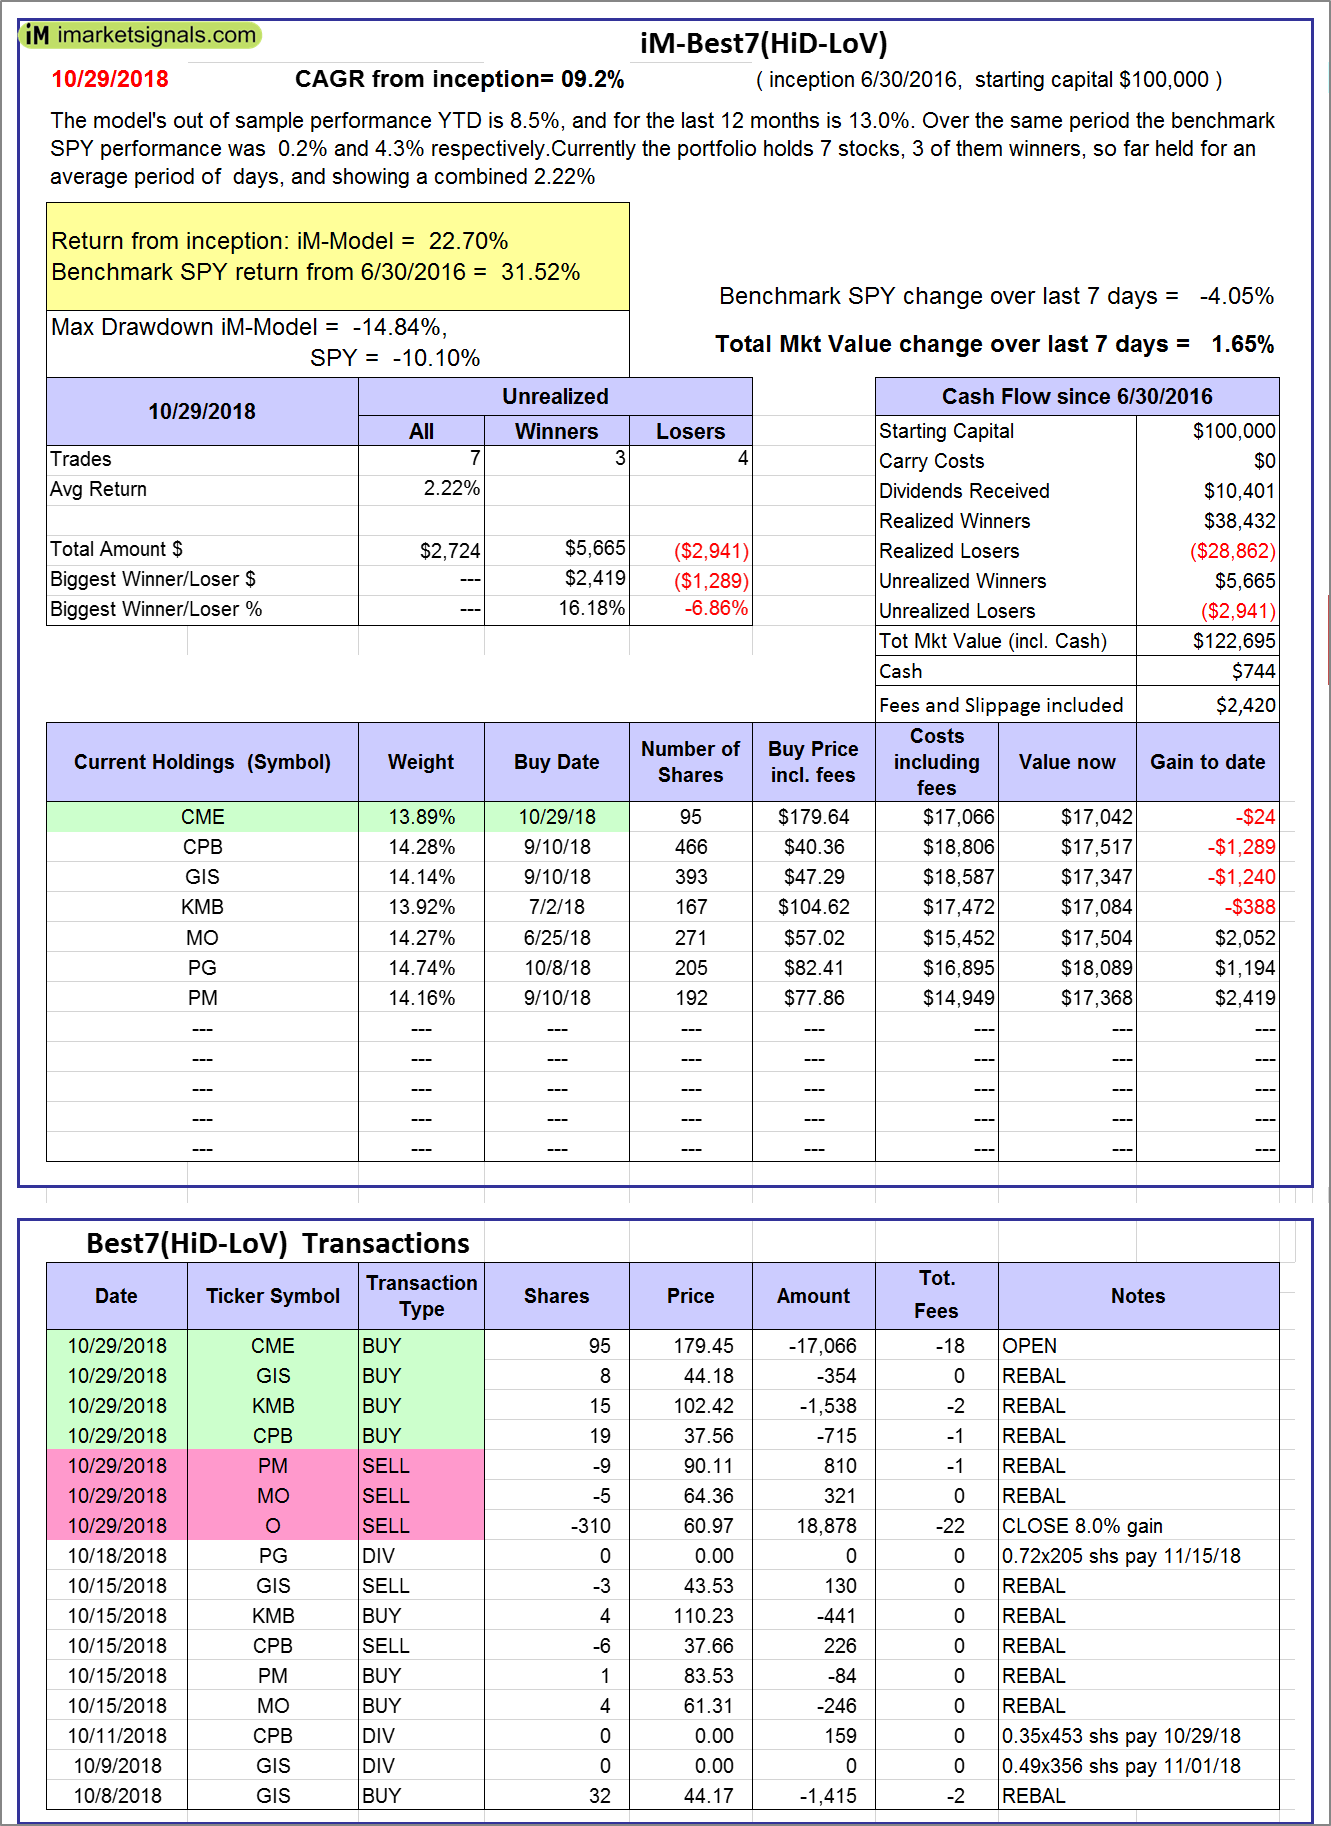 |
iM-Best7(HiD-LoV): The model’s out of sample performance YTD is 8.5%, and for the last 12 months is 13.0%. Over the same period the benchmark SPY performance was 0.2% and 4.3% respectively. Over the previous week the market value of iM-BESTOGA-3 gained 1.65% at a time when SPY gained -4.05%. A starting capital of $100,000 at inception on 6/30/2016 would have grown to $122,695 which includes $744 cash and excludes $2,420 spent on fees and slippage. |
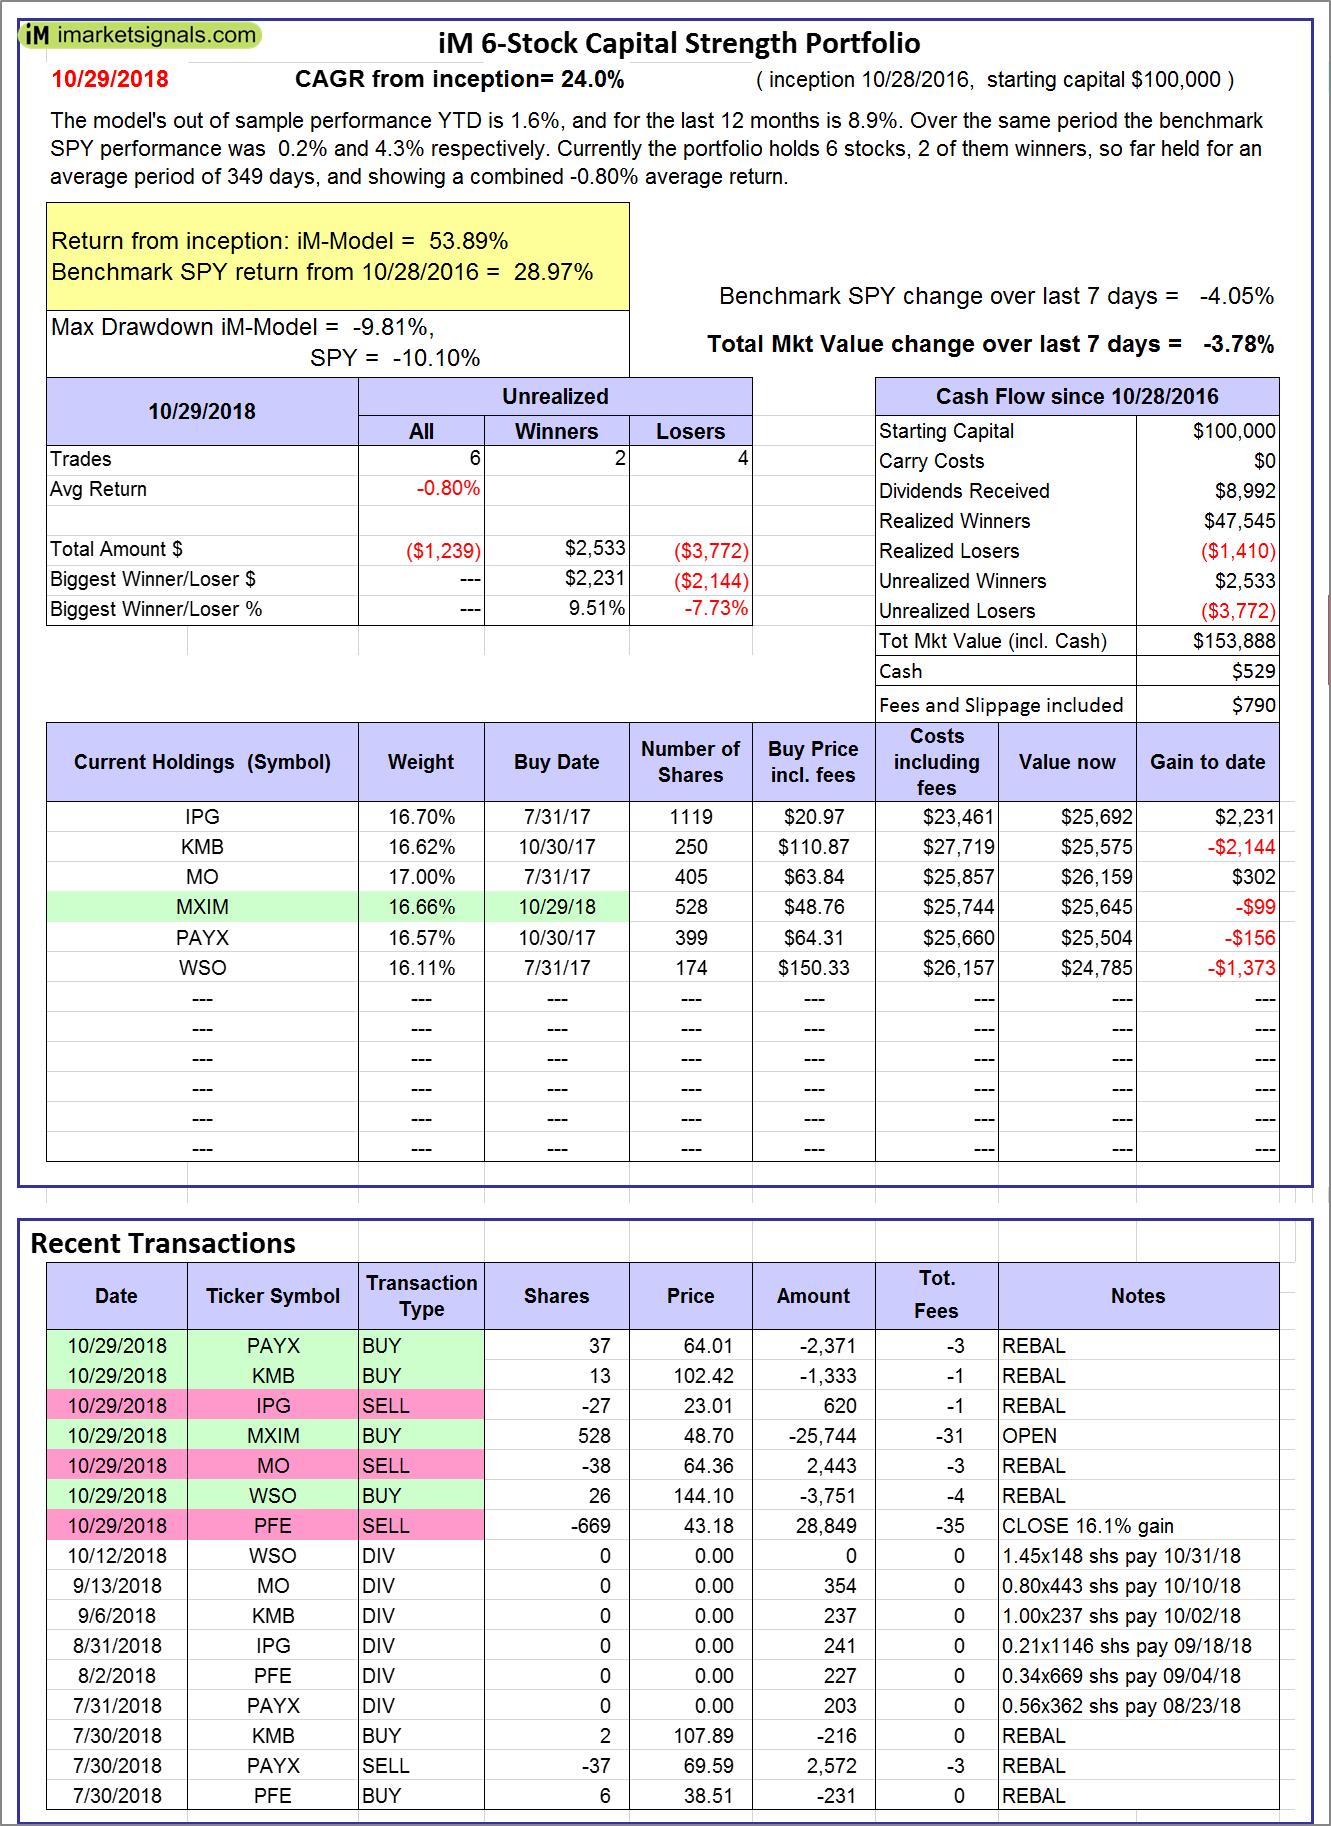 |
iM 6-Stock Capital Strength Portfolio: The model’s out of sample performance YTD is 1.6%, and for the last 12 months is 8.9%. Over the same period the benchmark SPY performance was 0.2% and 4.3% respectively. Over the previous week the market value of the iM 6-Stock Capital Strength Portfolio gained -3.78% at a time when SPY gained -4.05%. A starting capital of $100,000 at inception on 10/28/2016 would have grown to $153,888 which includes $529 cash and excludes $790 spent on fees and slippage. |
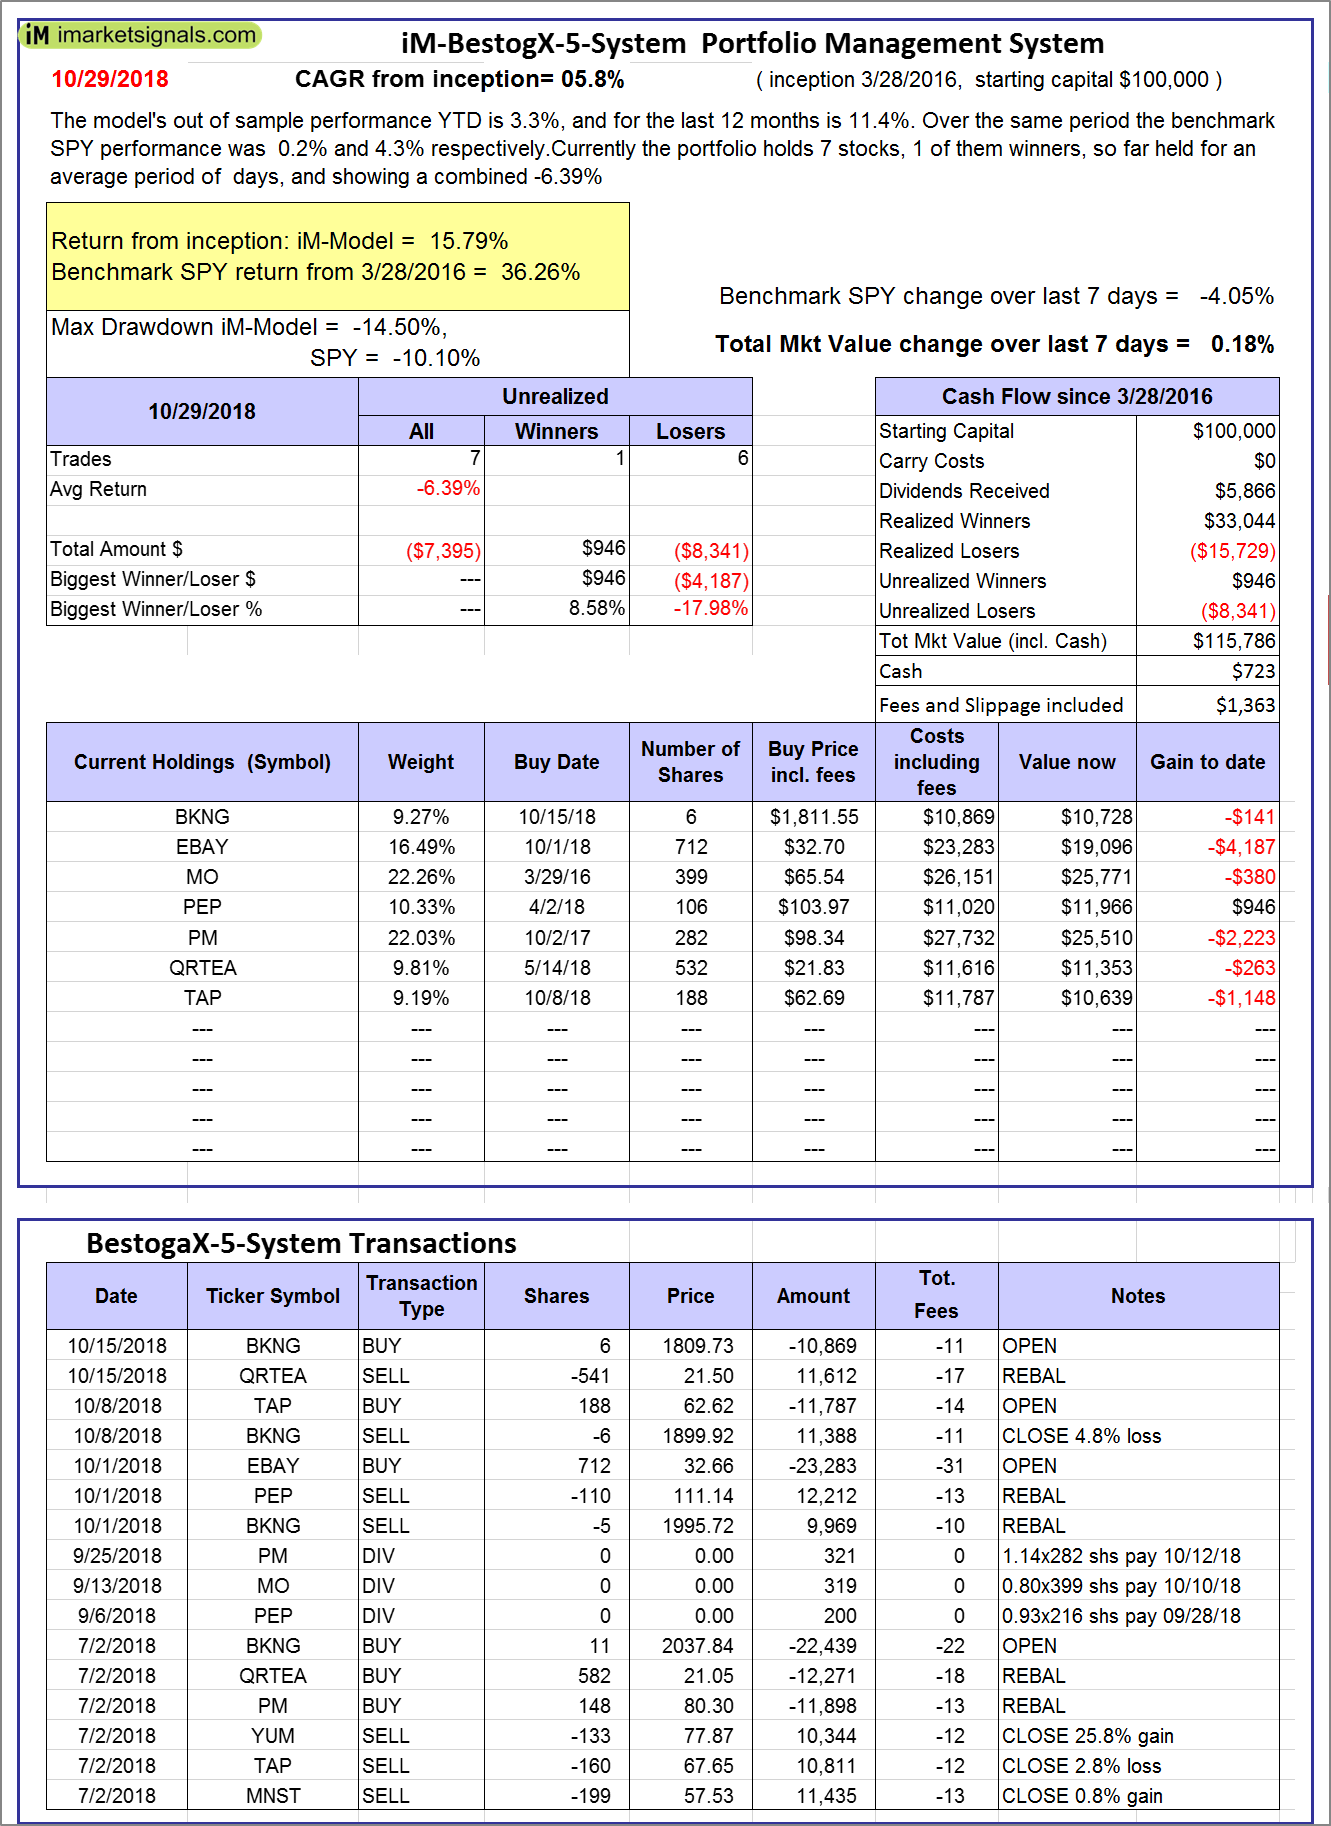 |
iM-BestogaX5-System: The model’s out of sample performance YTD is 3.3%, and for the last 12 months is 11.4%. Over the same period the benchmark SPY performance was 0.2% and 4.3% respectively. Over the previous week the market value of iM-BestogaX5-System gained 0.18% at a time when SPY gained -4.05%. A starting capital of $100,000 at inception on 3/28/2016 would have grown to $115,786 which includes $723 cash and excludes $1,363 spent on fees and slippage. |
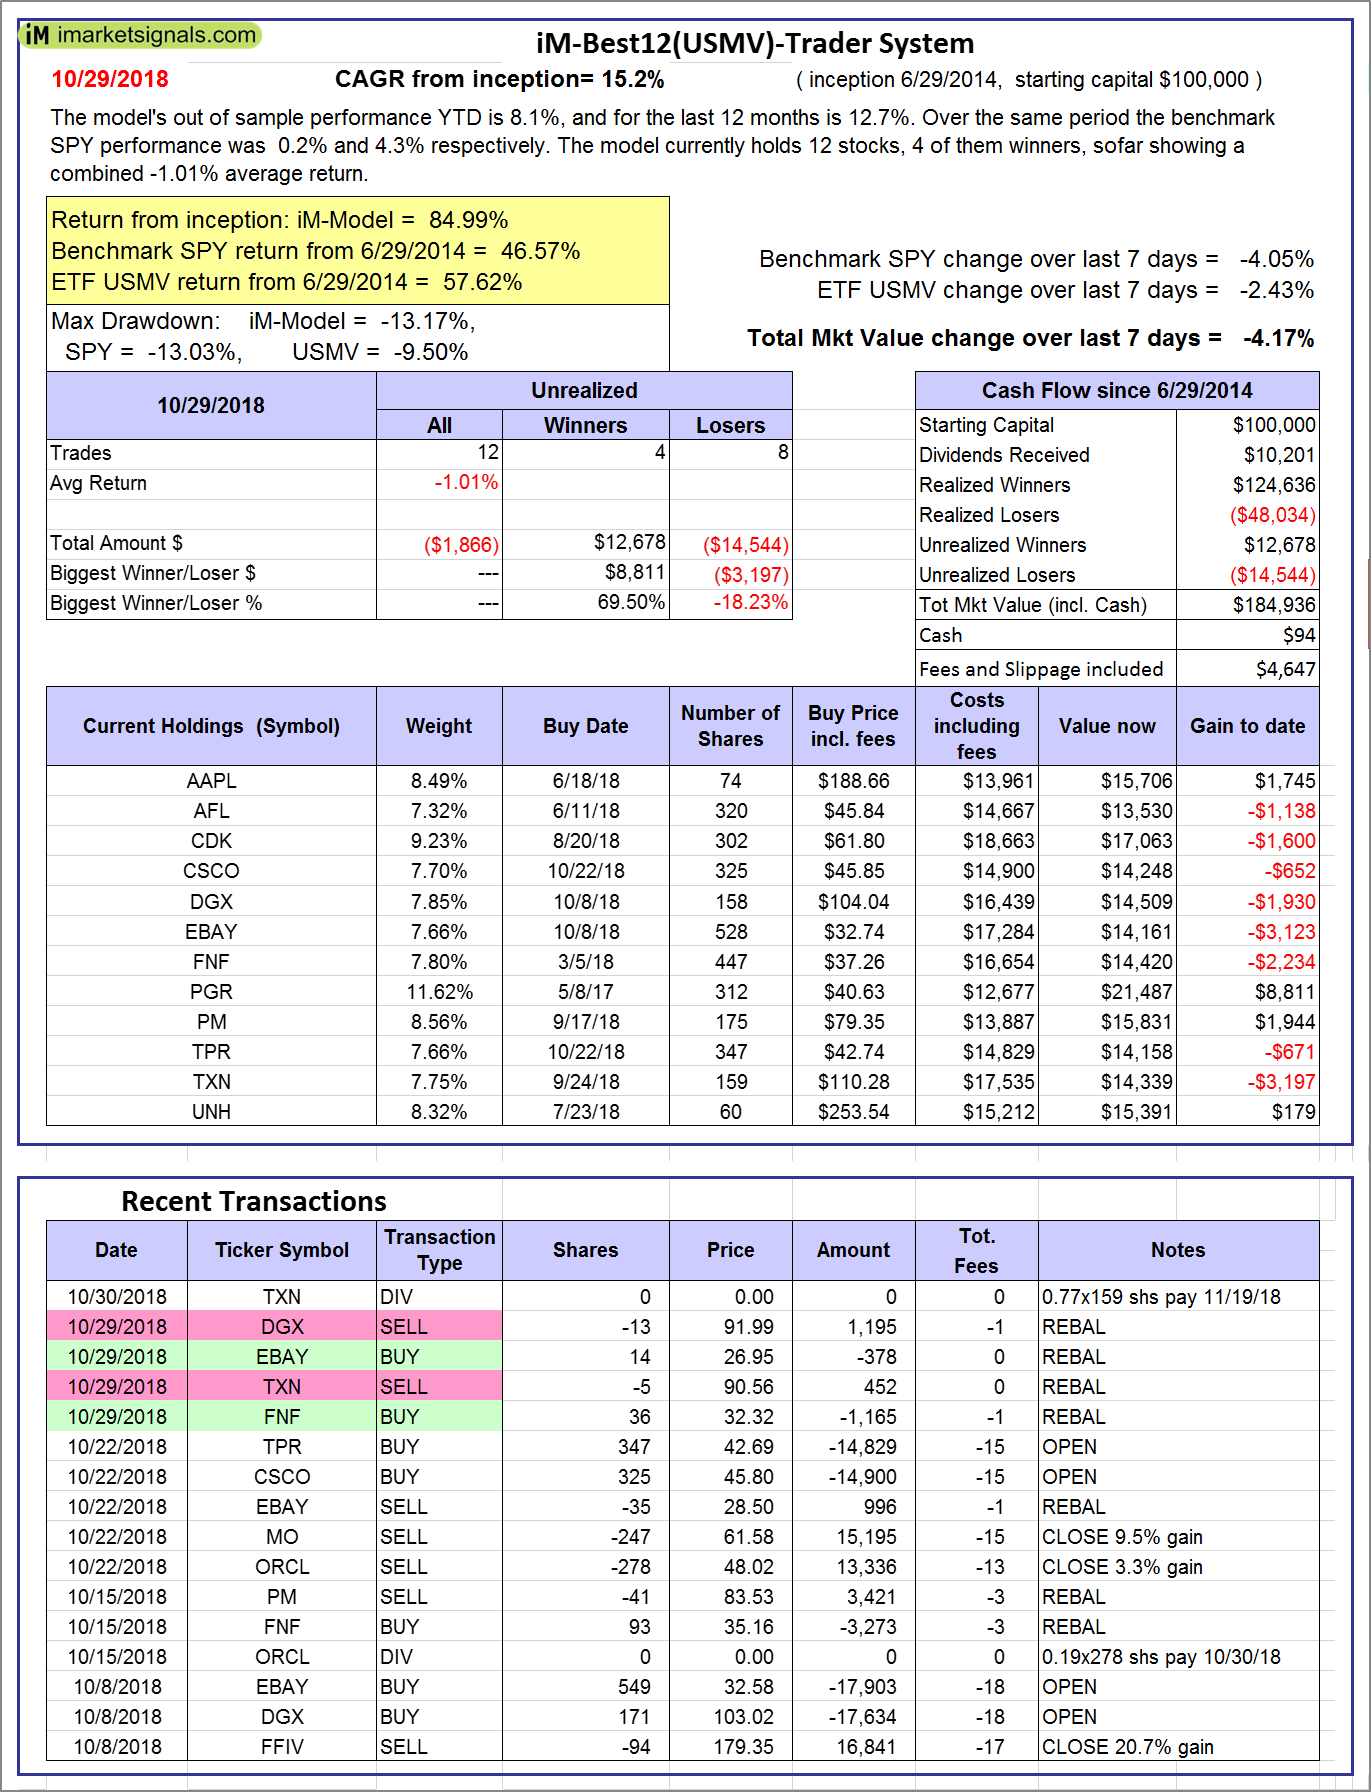  |
iM-Best12(USMV)-Trader: The model’s out of sample performance YTD is 8.1%, and for the last 12 months is 12.7%. Over the same period the benchmark SPY performance was 0.2% and 4.3% respectively. Since inception, on 6/30/2014, the model gained 84.99% while the benchmark SPY gained 46.57% and the ETF USMV gained 57.62% over the same period. Over the previous week the market value of iM-Best12(USMV)-Trader gained -4.17% at a time when SPY gained -4.05%. A starting capital of $100,000 at inception on 6/30/2014 would have grown to $184,936 which includes $94 cash and excludes $4,647 spent on fees and slippage. |
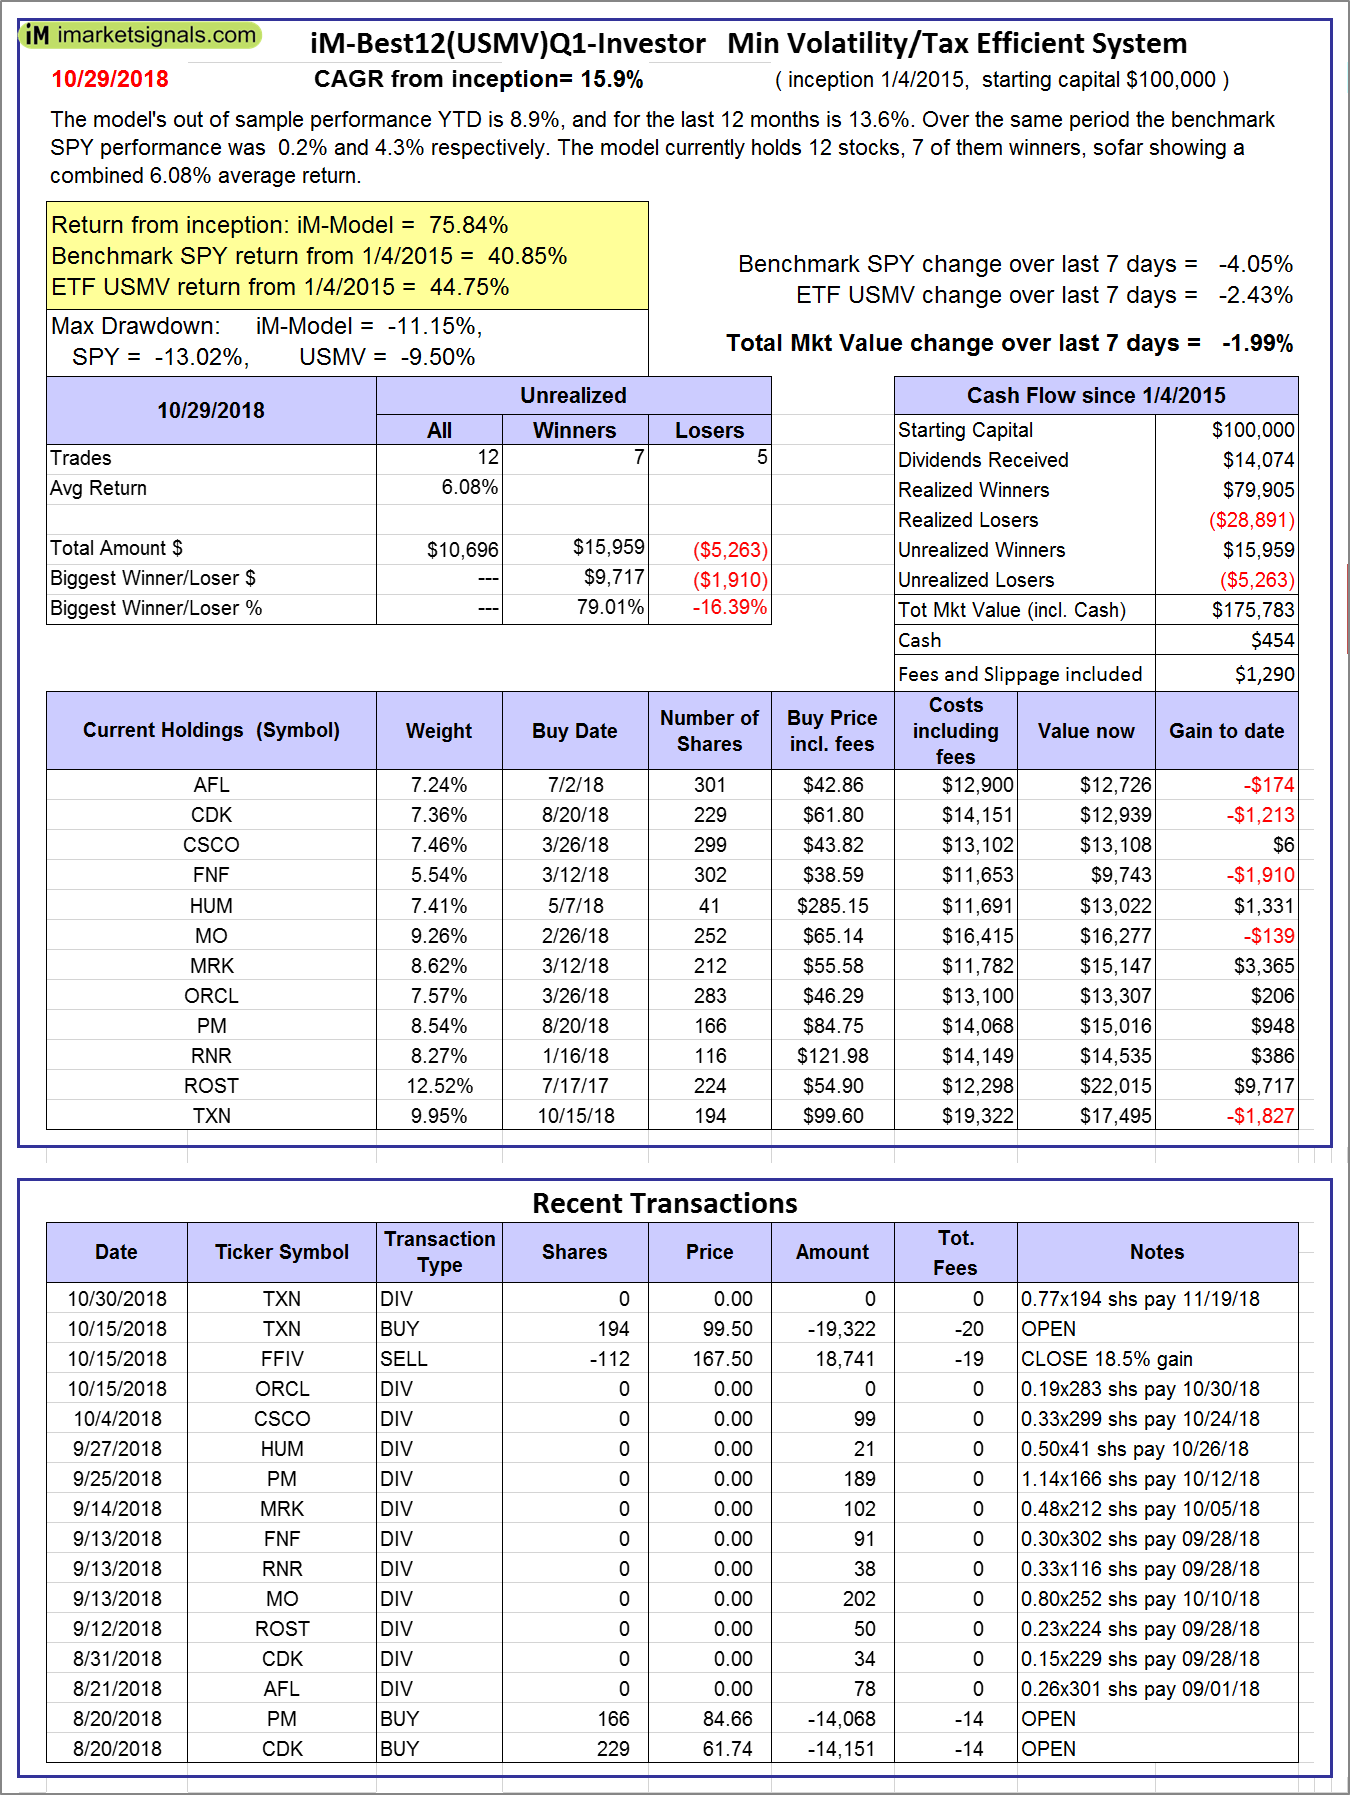 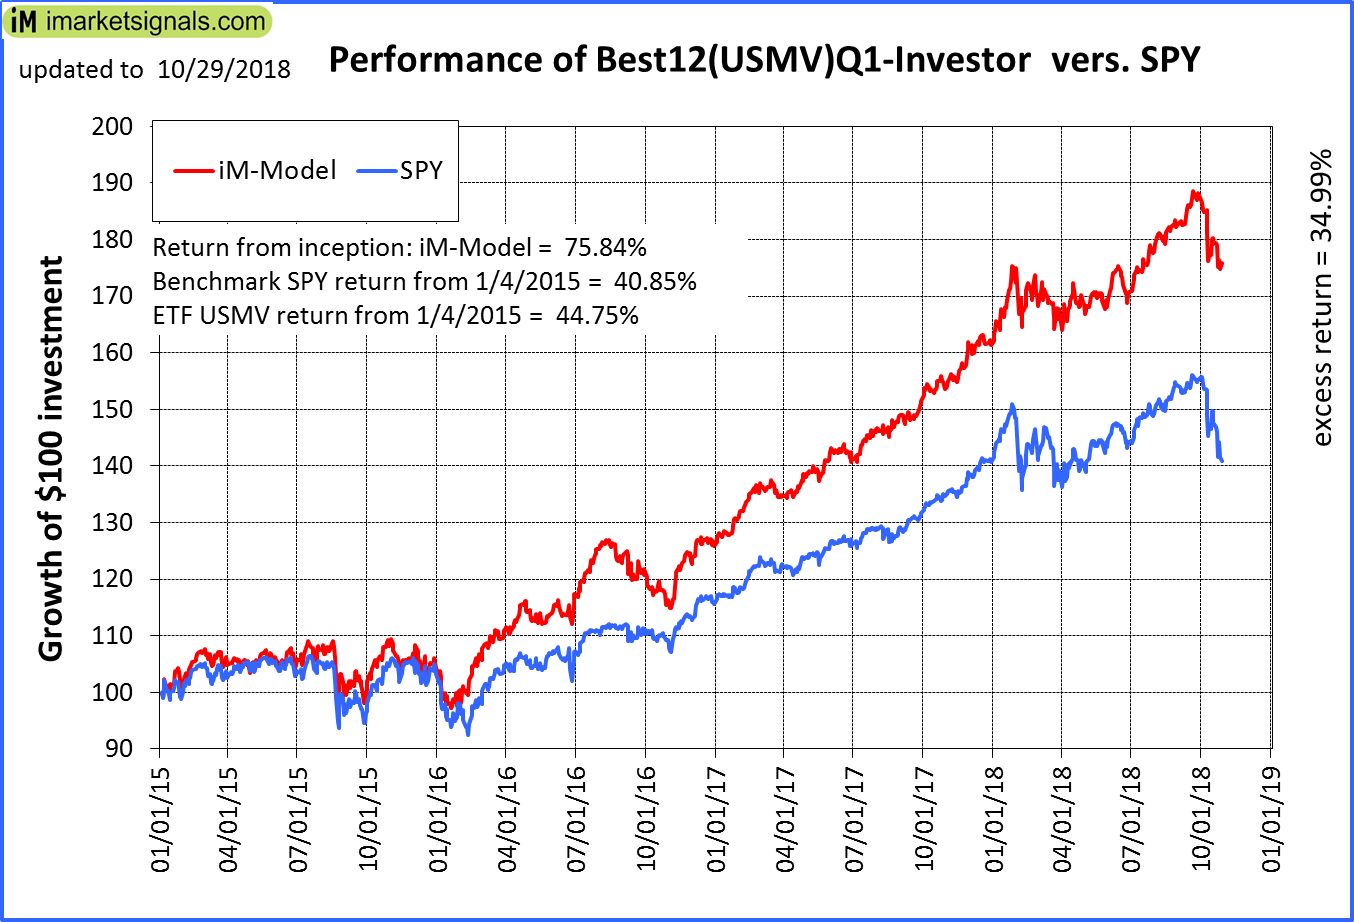 |
iM-Best12(USMV)Q1-Investor: The model’s out of sample performance YTD is 8.9%, and for the last 12 months is 13.6%. Over the same period the benchmark SPY performance was 0.2% and 4.3% respectively. Since inception, on 1/5/2015, the model gained 75.84% while the benchmark SPY gained 40.85% and the ETF USMV gained 44.75% over the same period. Over the previous week the market value of iM-Best12(USMV)Q1 gained -1.99% at a time when SPY gained -4.05%. A starting capital of $100,000 at inception on 1/5/2015 would have grown to $175,783 which includes $454 cash and excludes $1,290 spent on fees and slippage. |
 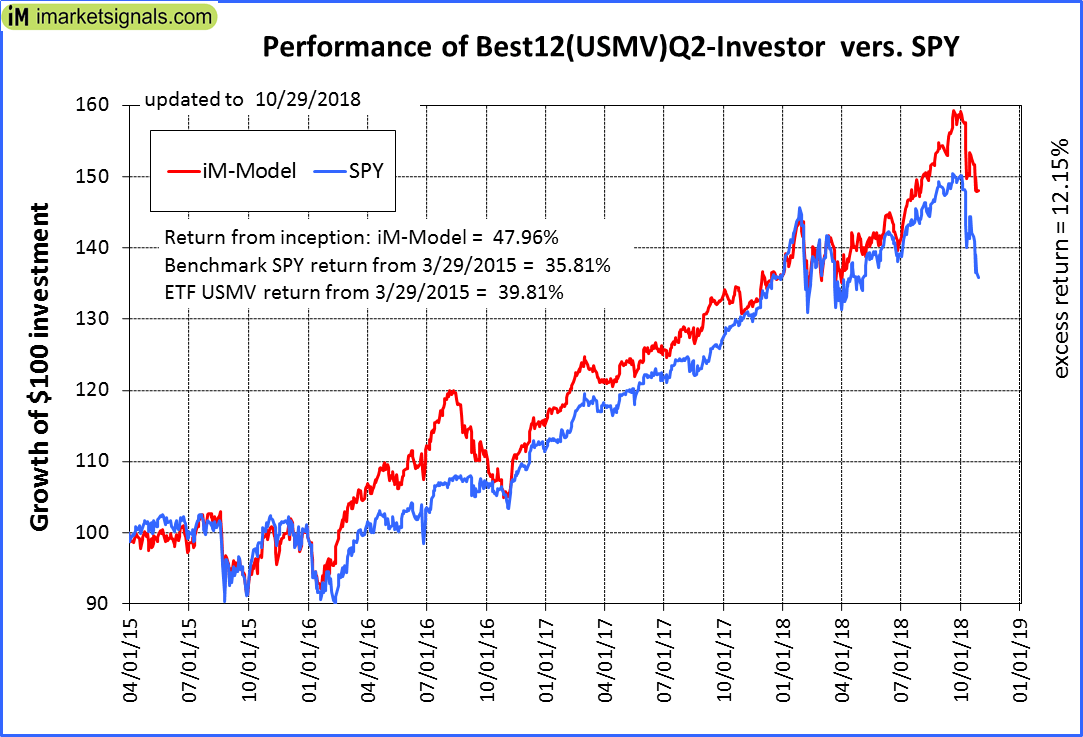 |
iM-Best12(USMV)Q2-Investor: The model’s out of sample performance YTD is 9.1%, and for the last 12 months is 11.6%. Over the same period the benchmark SPY performance was 0.2% and 4.3% respectively. Since inception, on 3/30/2015, the model gained 47.96% while the benchmark SPY gained 35.81% and the ETF USMV gained 39.81% over the same period. Over the previous week the market value of iM-Best12(USMV)Q2 gained -2.44% at a time when SPY gained -4.05%. A starting capital of $100,000 at inception on 3/30/2015 would have grown to $147,912 which includes $322 cash and excludes $1,125 spent on fees and slippage. |
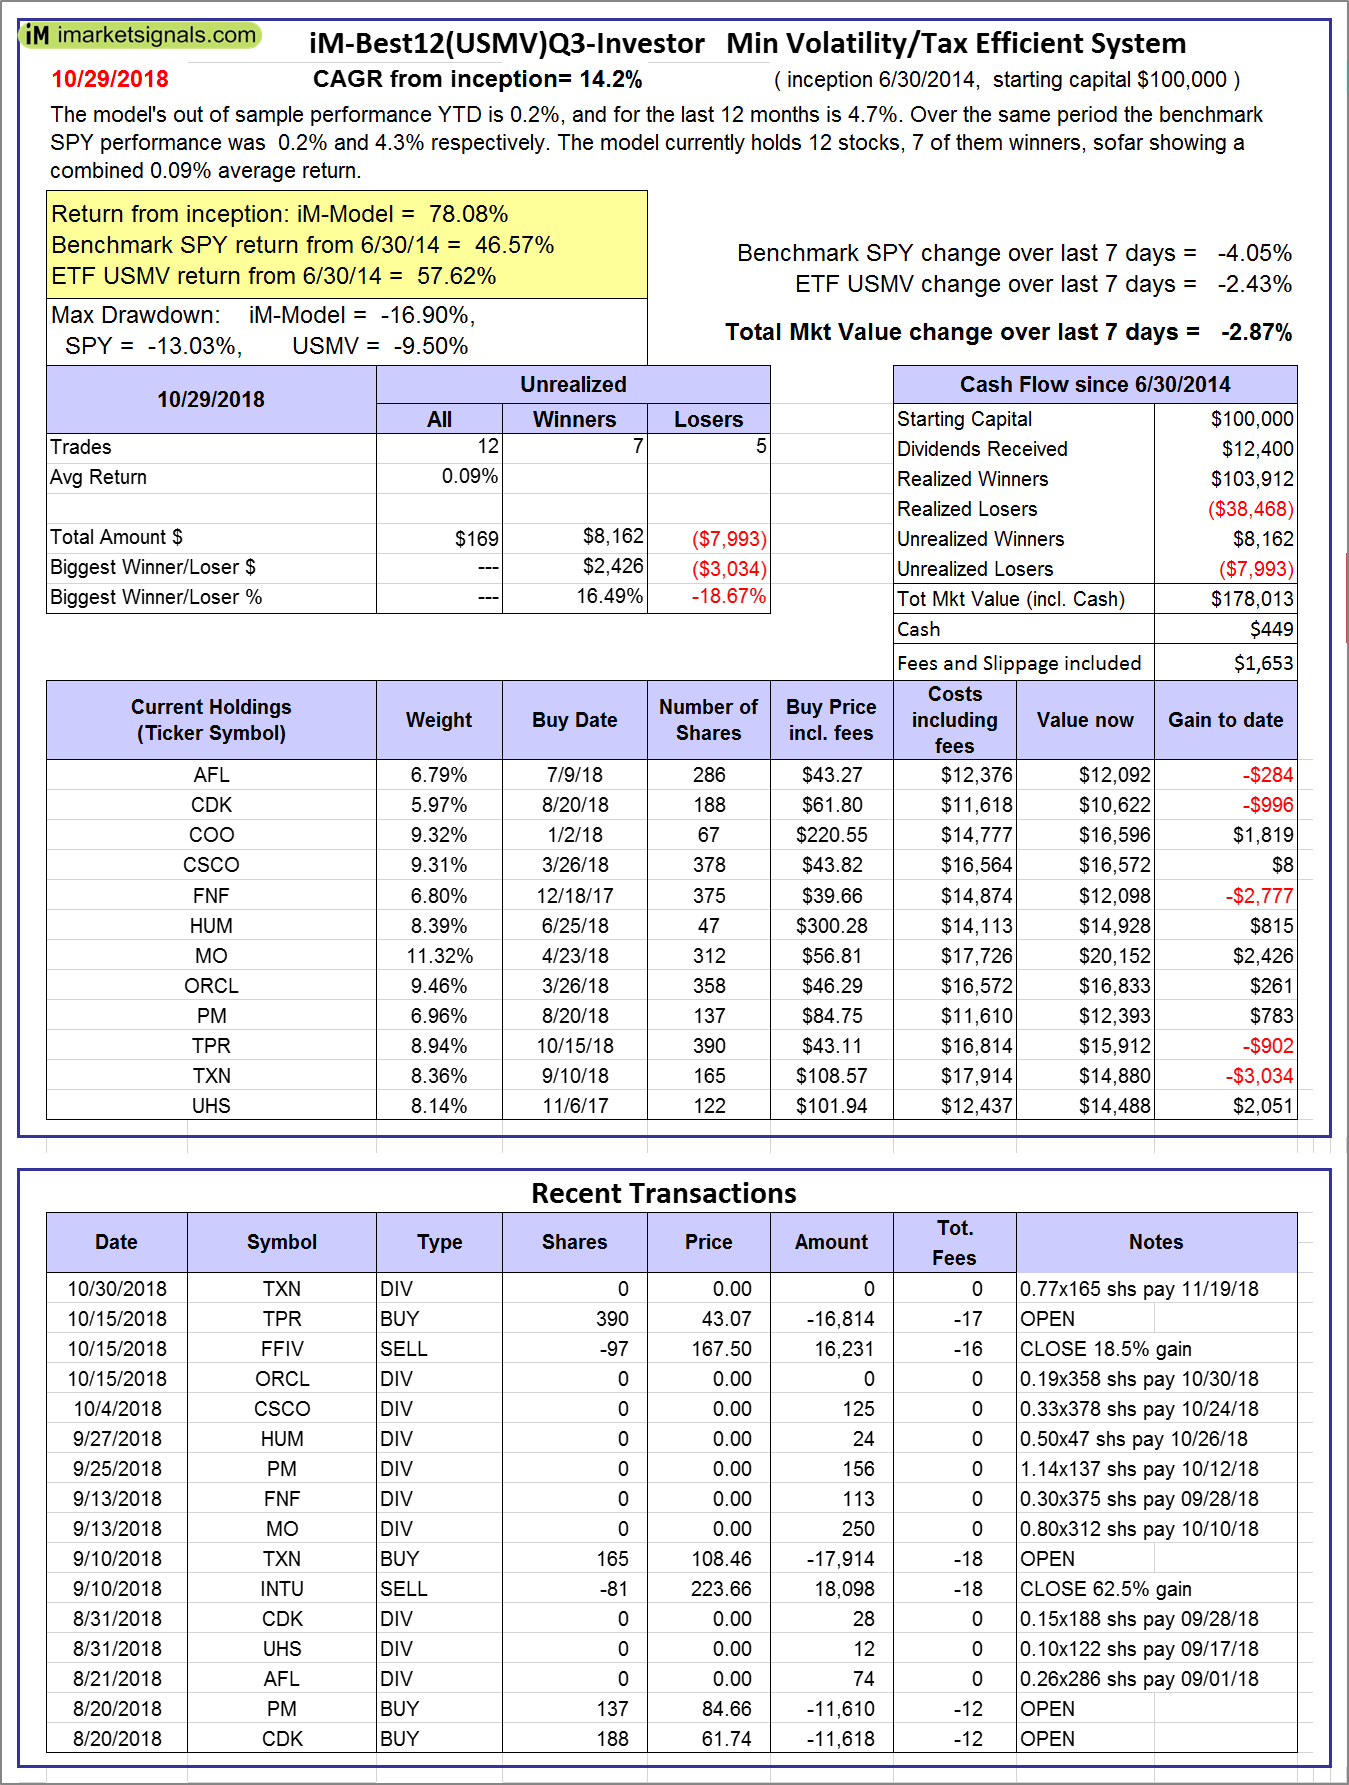 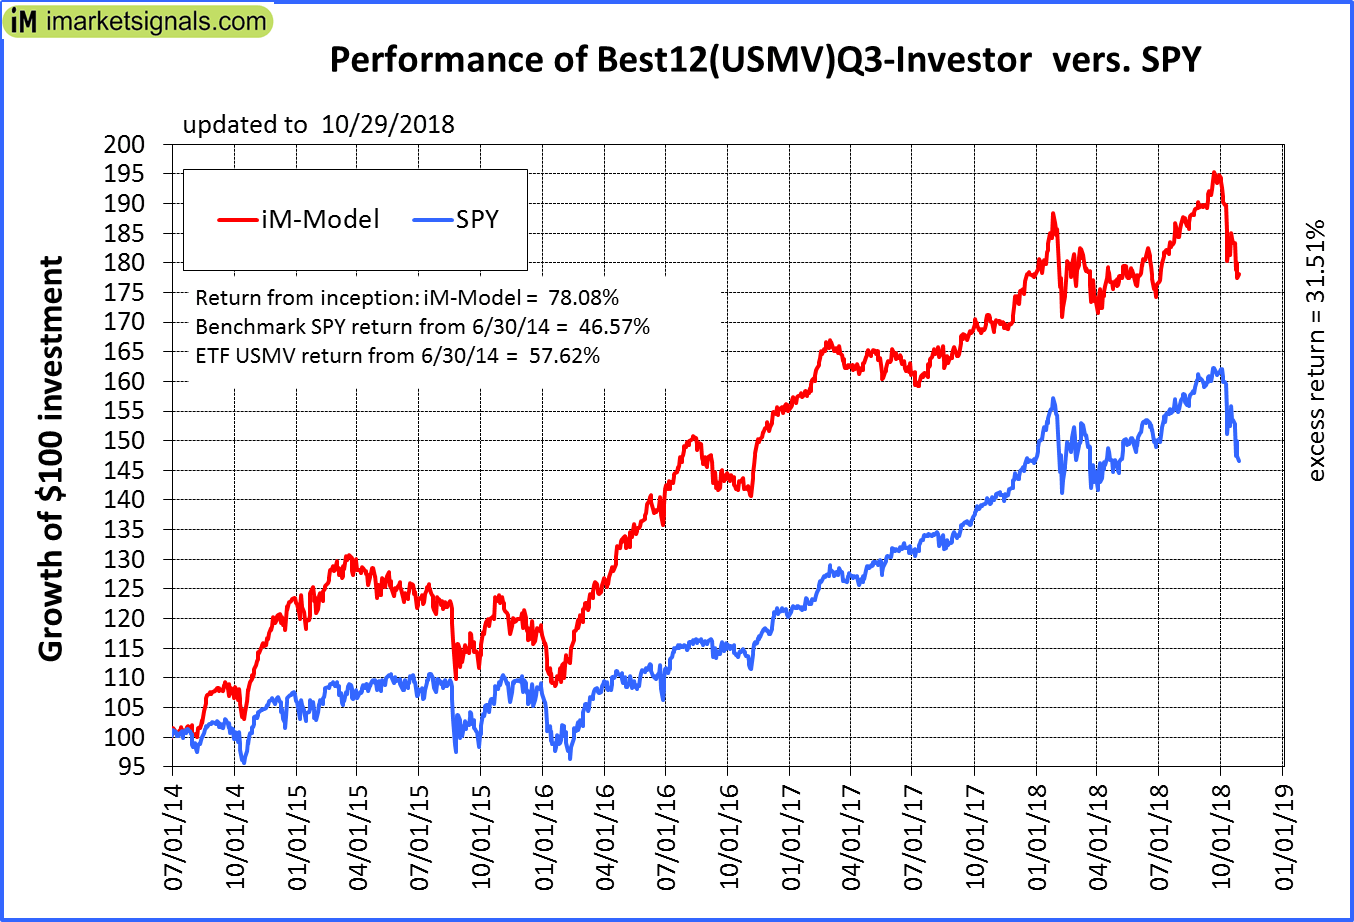 |
iM-Best12(USMV)Q3-Investor: The model’s out of sample performance YTD is 0.2%, and for the last 12 months is 4.7%. Over the same period the benchmark SPY performance was 0.2% and 4.3% respectively. Since inception, on 7/1/2014, the model gained 78.08% while the benchmark SPY gained 46.57% and the ETF USMV gained 57.62% over the same period. Over the previous week the market value of iM-Best12(USMV)Q3 gained -2.87% at a time when SPY gained -4.05%. A starting capital of $100,000 at inception on 7/1/2014 would have grown to $178,013 which includes $449 cash and excludes $1,653 spent on fees and slippage. |
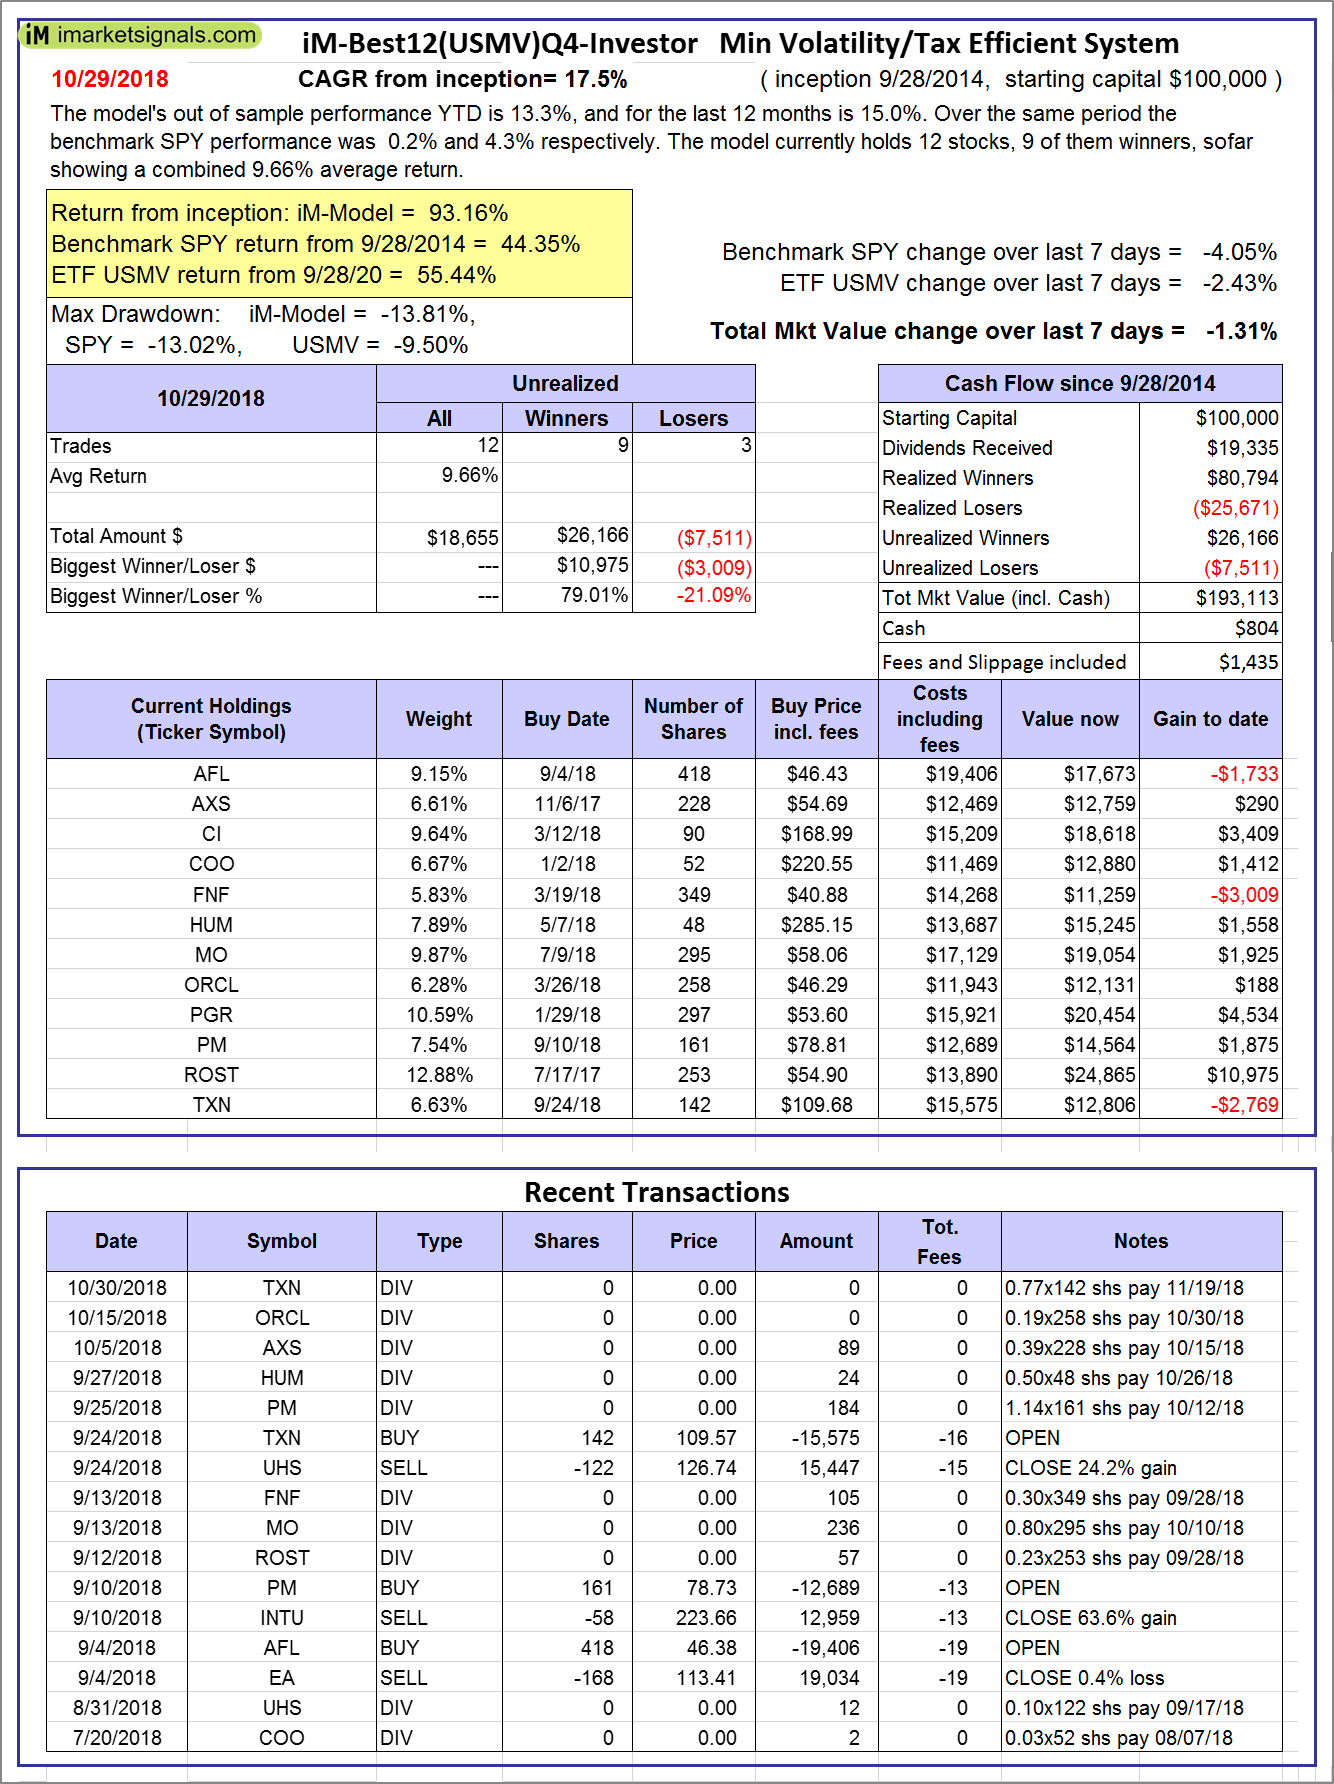 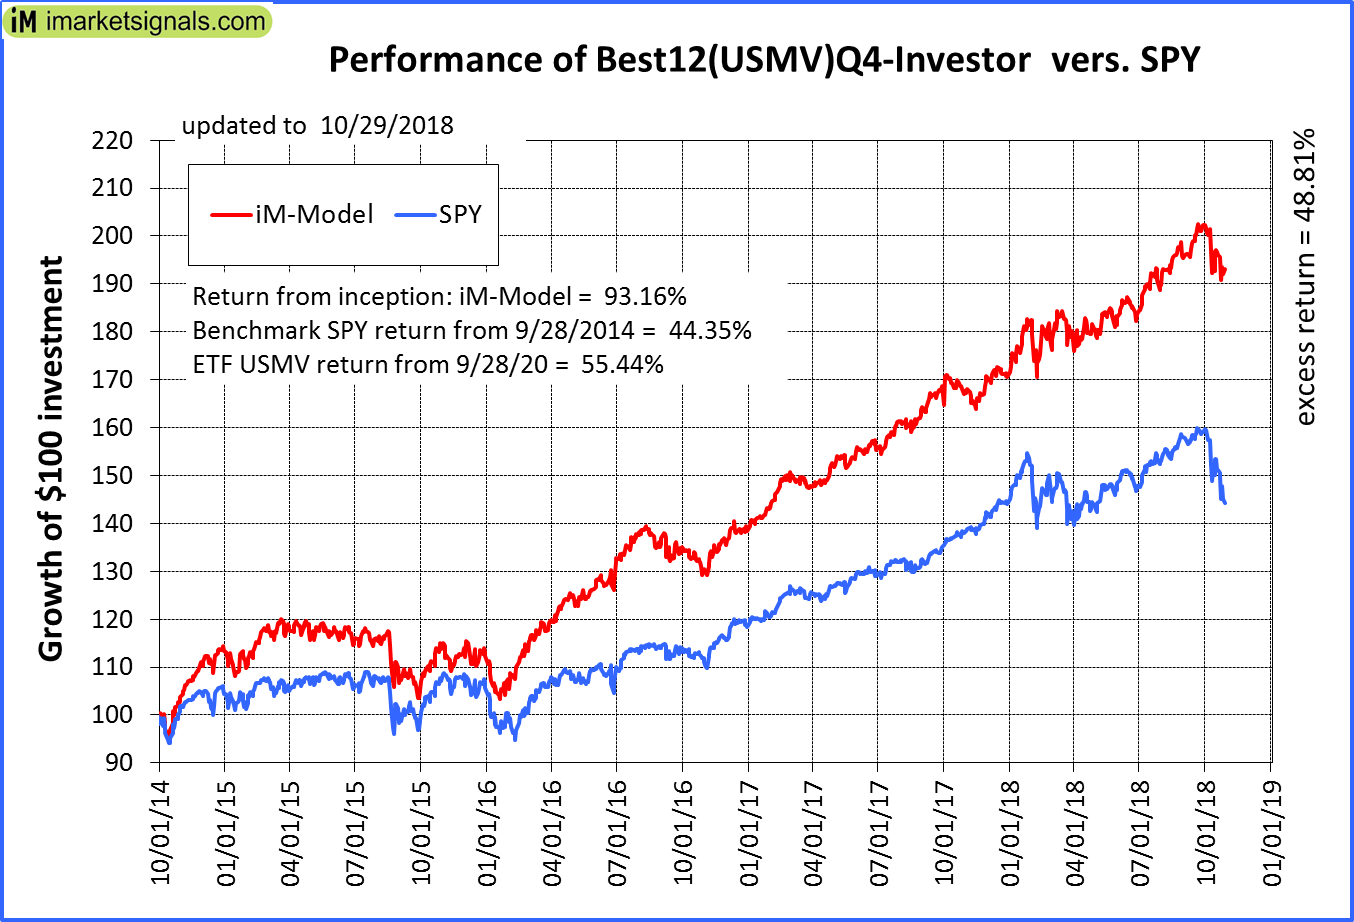 |
iM-Best12(USMV)Q4-Investor: Since inception, on 9/29/2014, the model gained 93.16% while the benchmark SPY gained 44.35% and the ETF USMV gained 55.44% over the same period. Over the previous week the market value of iM-Best12(USMV)Q4 gained -1.31% at a time when SPY gained -4.05%. A starting capital of $100,000 at inception on 9/29/2014 would have grown to $193,113 which includes $804 cash and excludes $1,435 spent on fees and slippage. |
 |
Average Performance of iM-Best12(USMV)Q1+Q2+Q3+Q4-Investor resulted in an excess return of 48.68% over SPY. (see iM-USMV Investor Portfolio) |
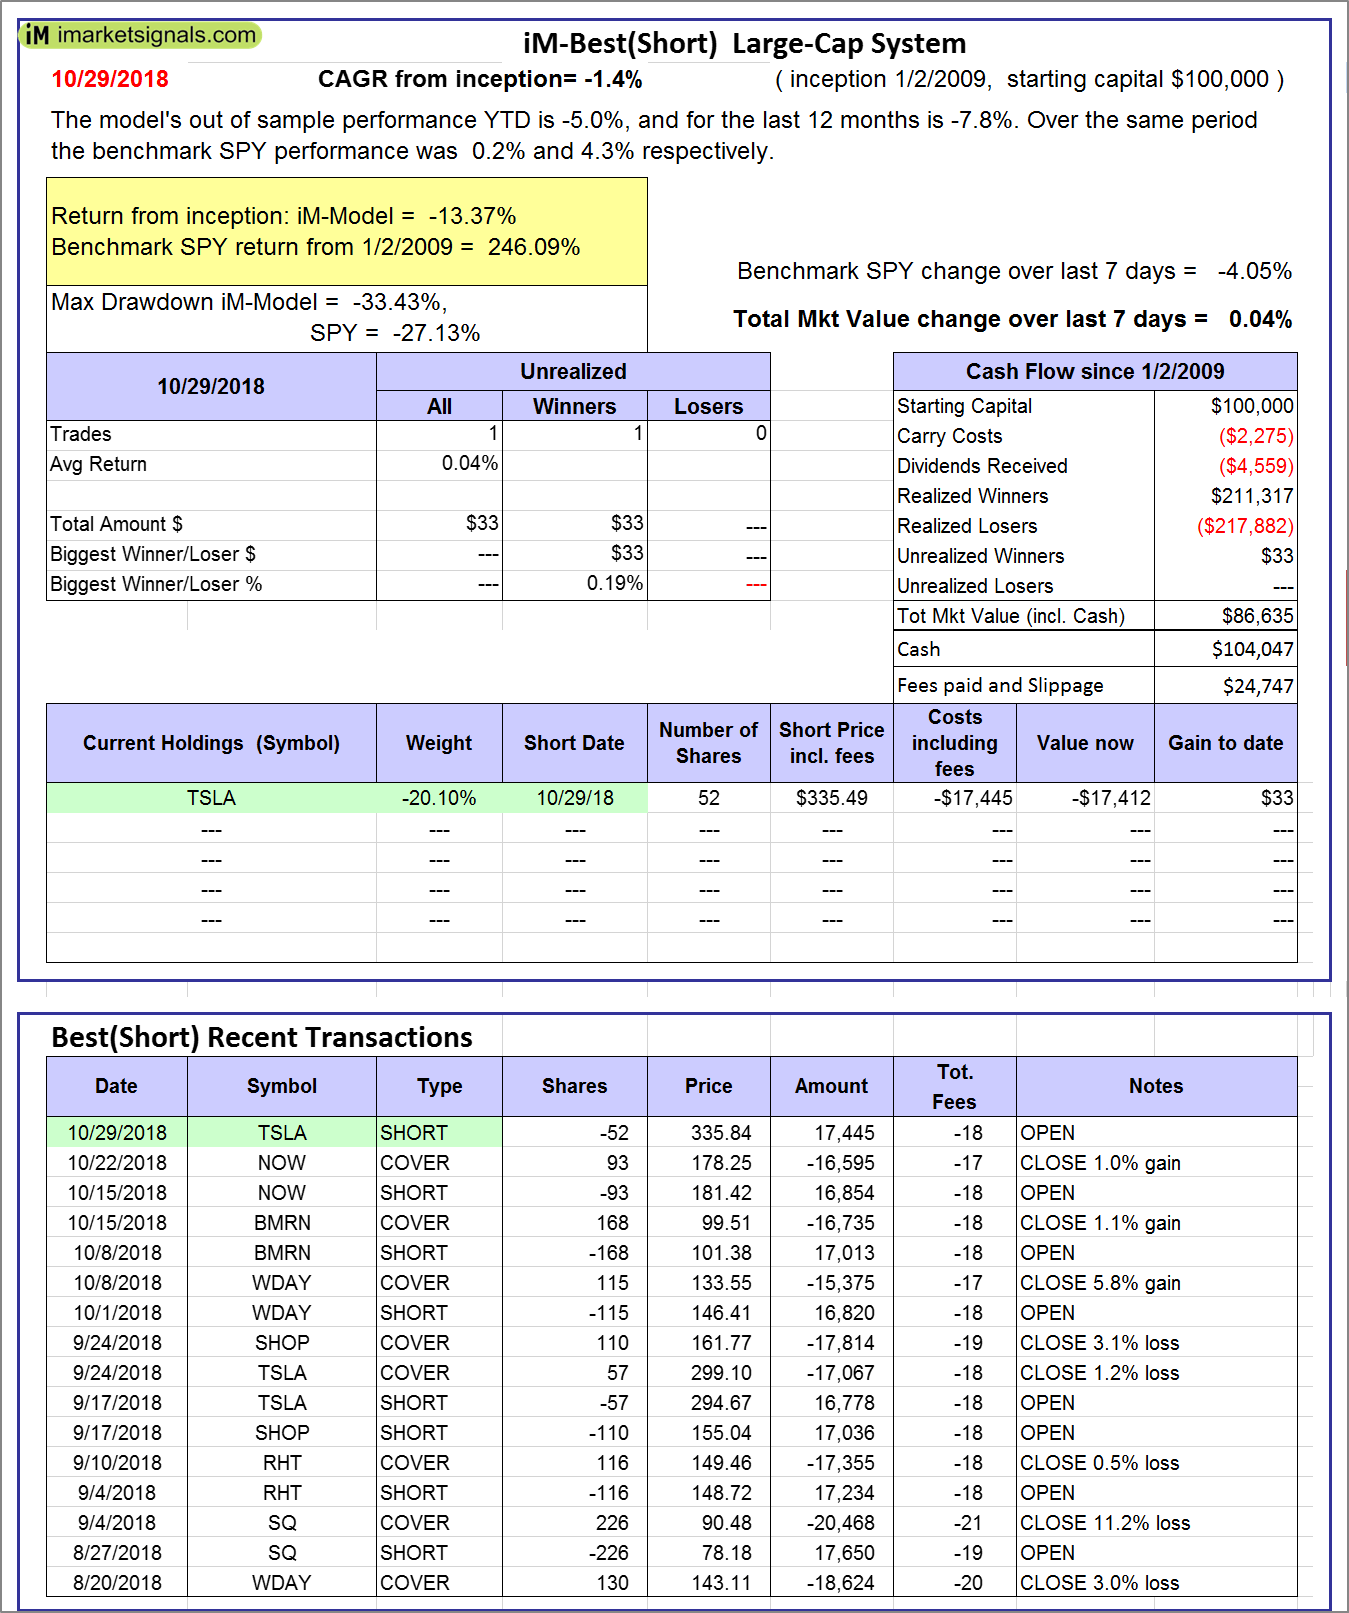 |
iM-Best(Short): The model’s out of sample performance YTD is -5.0%, and for the last 12 months is -7.8%. Over the same period the benchmark SPY performance was 0.2% and 4.3% respectively. Over the previous week the market value of iM-Best(Short) gained 0.04% at a time when SPY gained -4.05%. Over the period 1/2/2009 to 10/29/2018 the starting capital of $100,000 would have grown to $86,635 which includes $104,047 cash and excludes $24,747 spent on fees and slippage. |
 |
iM-Best2 MC-Score ETF System: The model’s out of sample performance YTD is 0.5%, and for the last 12 months is 5.9%. Over the same period the benchmark SPY performance was 0.2% and 4.3% respectively. Over the previous week the market value of the iM-Best2 MC-Score ETF System gained -1.06% at a time when SPY gained -4.05%. A starting capital of $100,000 at inception on 6/30/2016 would have grown to $112,956 which includes $97 cash and excludes $123 spent on fees and slippage. |
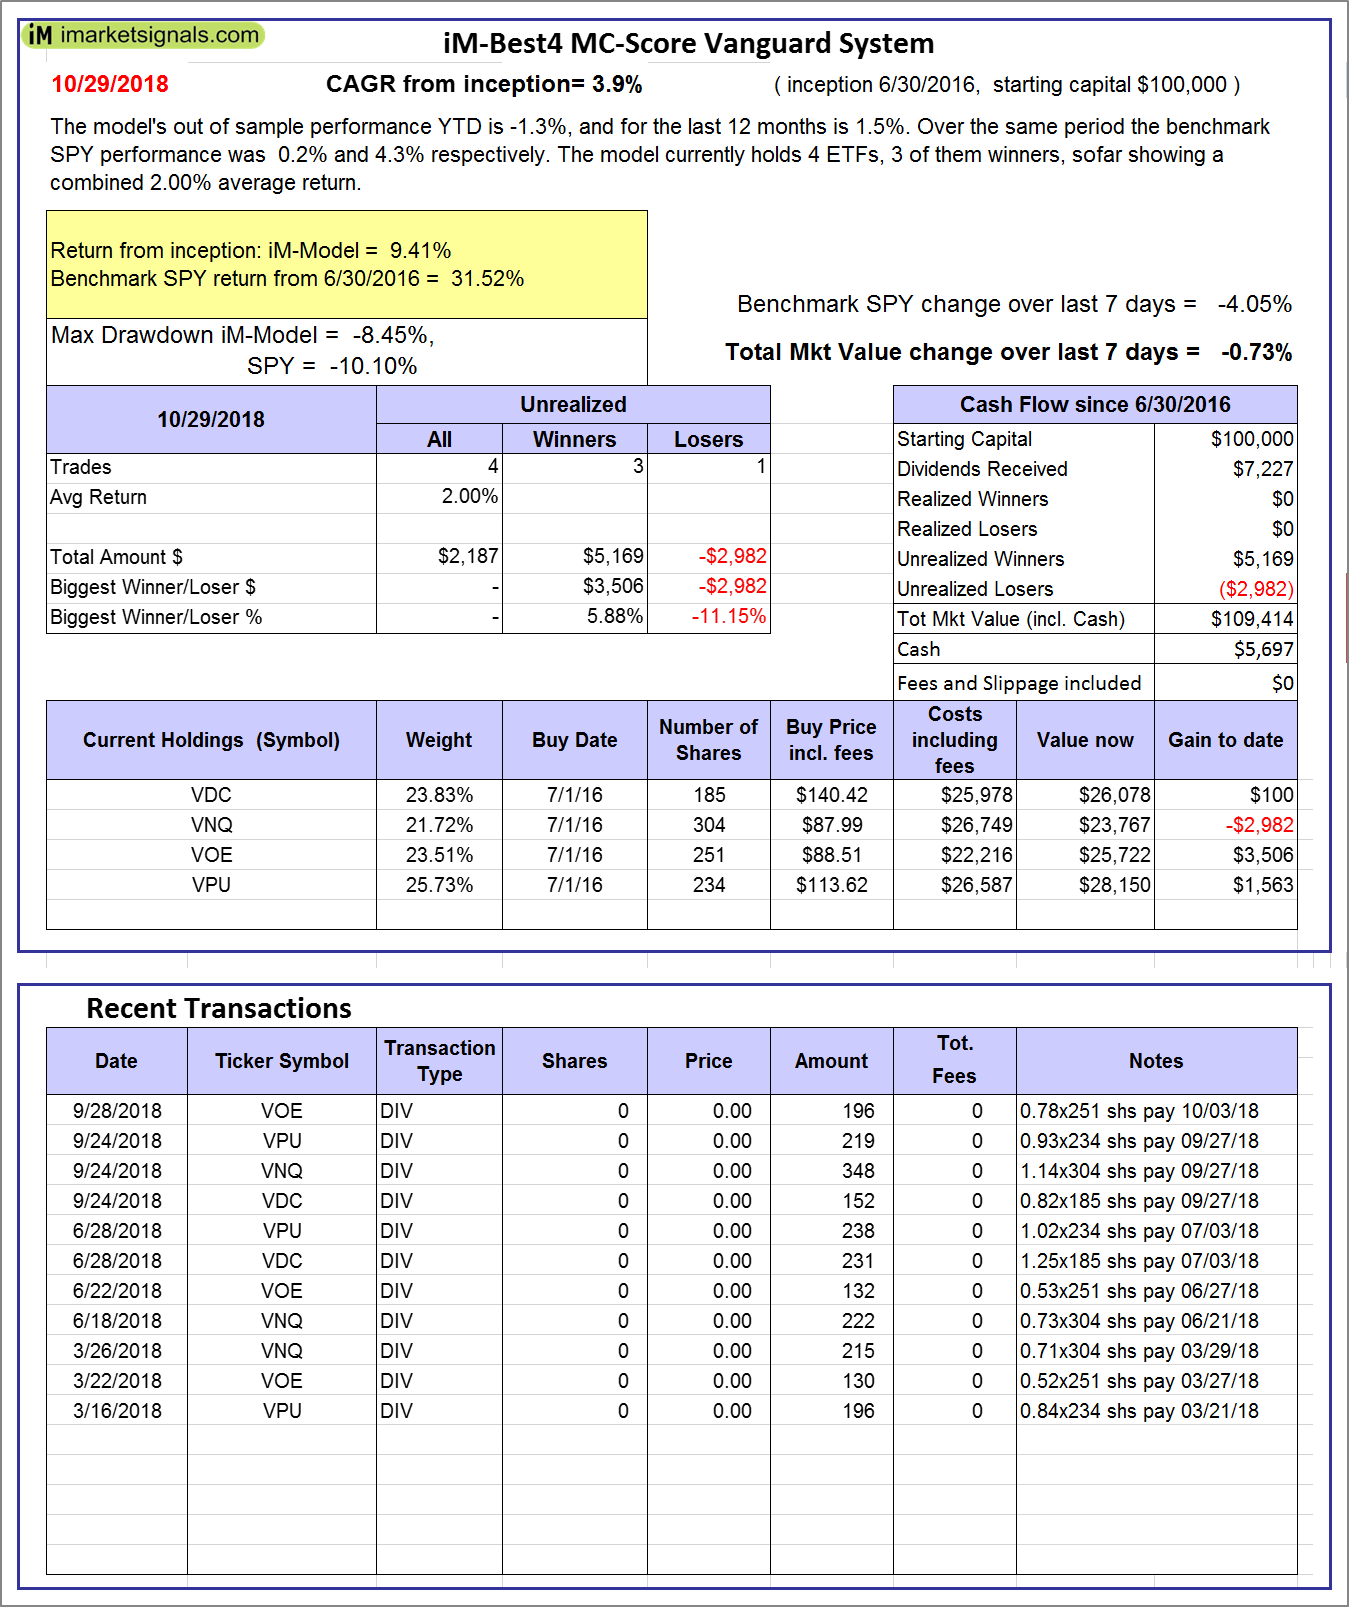 |
iM-Best4 MC-Score Vanguard System: The model’s out of sample performance YTD is -1.3%, and for the last 12 months is 1.5%. Over the same period the benchmark SPY performance was 0.2% and 4.3% respectively. Over the previous week the market value of the iM-Best4 MC-Score Vanguard System gained -0.73% at a time when SPY gained -4.05%. A starting capital of $100,000 at inception on 6/30/2016 would have grown to $109,414 which includes $5,697 cash and excludes $00 spent on fees and slippage. |
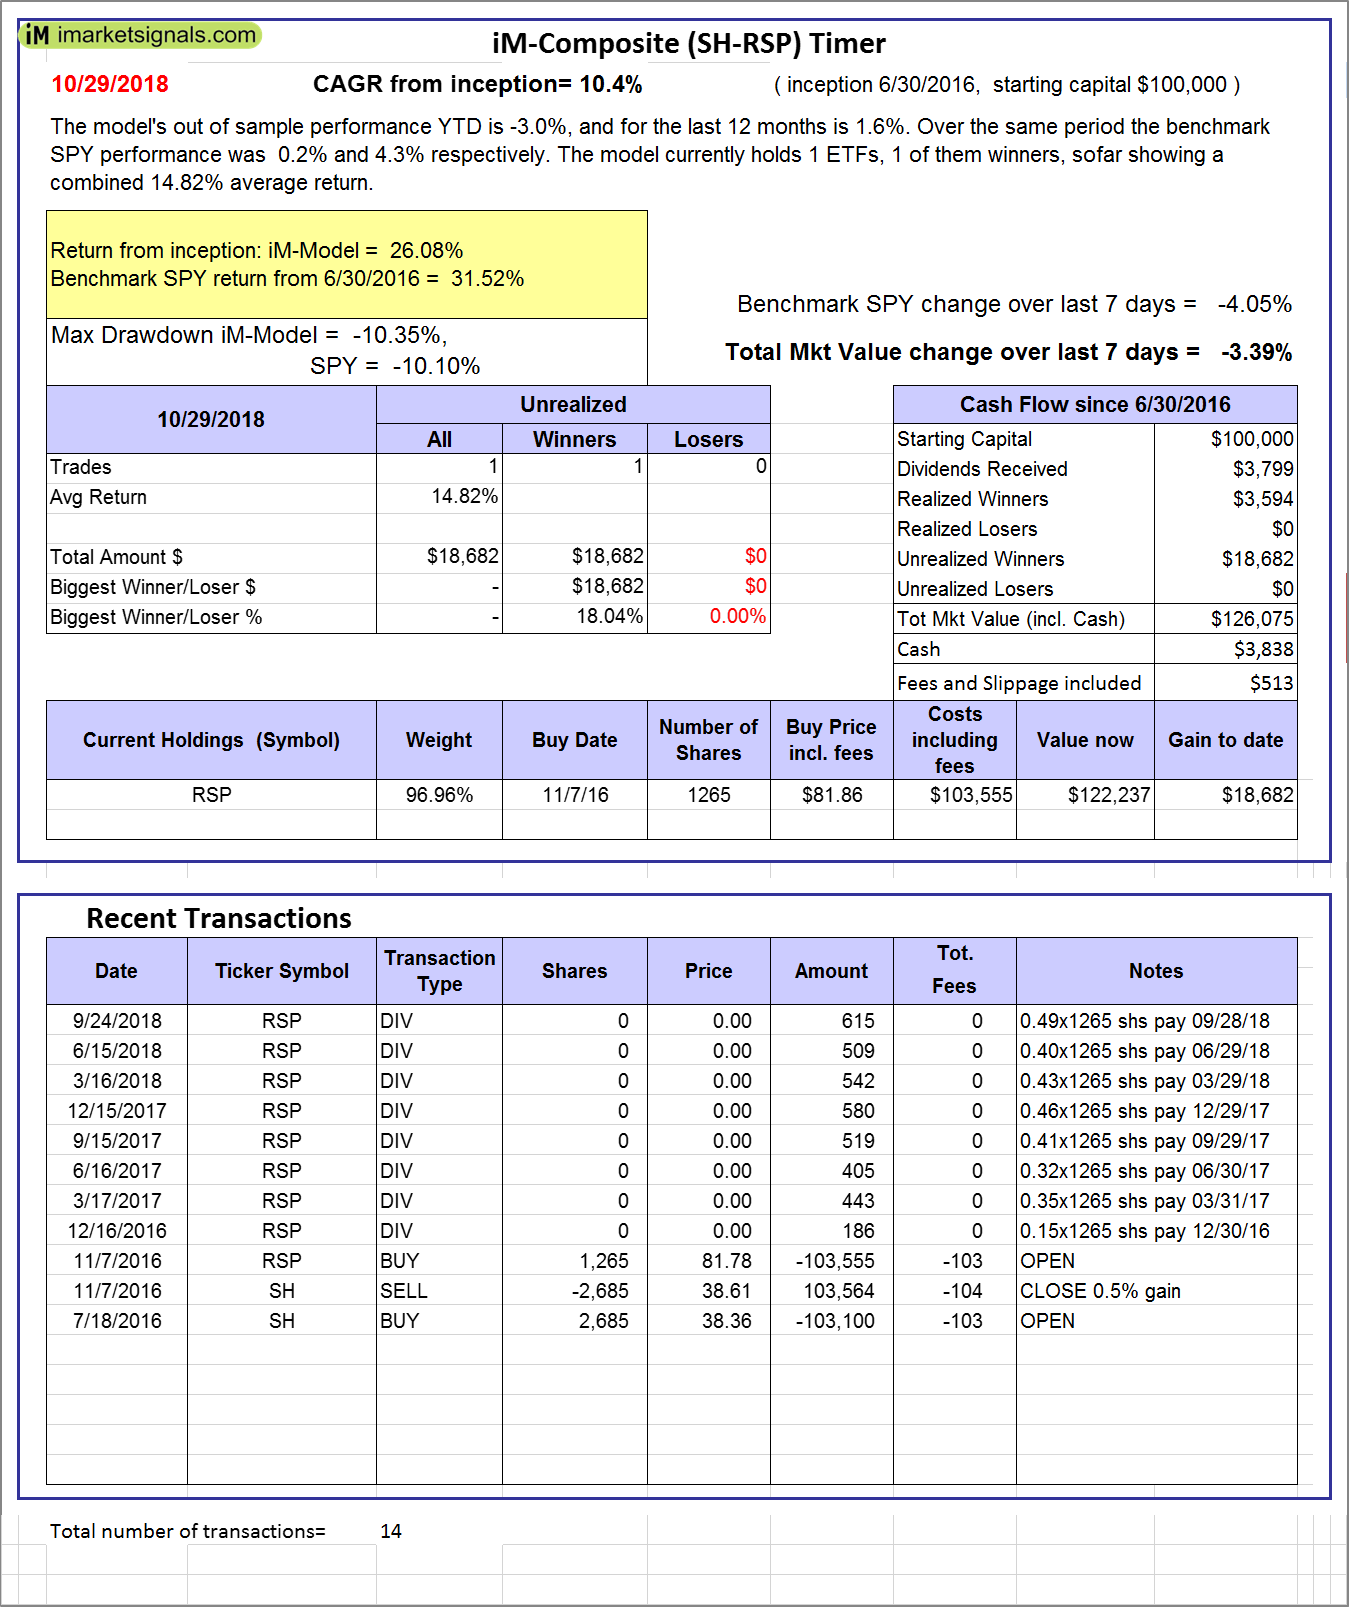 |
iM-Composite (SH-RSP) Timer: The model’s out of sample performance YTD is -3.0%, and for the last 12 months is 1.6%. Over the same period the benchmark SPY performance was 0.2% and 4.3% respectively. Over the previous week the market value of the iM-Composite (SH-RSP) Timer gained -3.39% at a time when SPY gained -4.05%. A starting capital of $100,000 at inception on 6/30/2016 would have grown to $126,075 which includes $3,838 cash and excludes $513 spent on fees and slippage. |
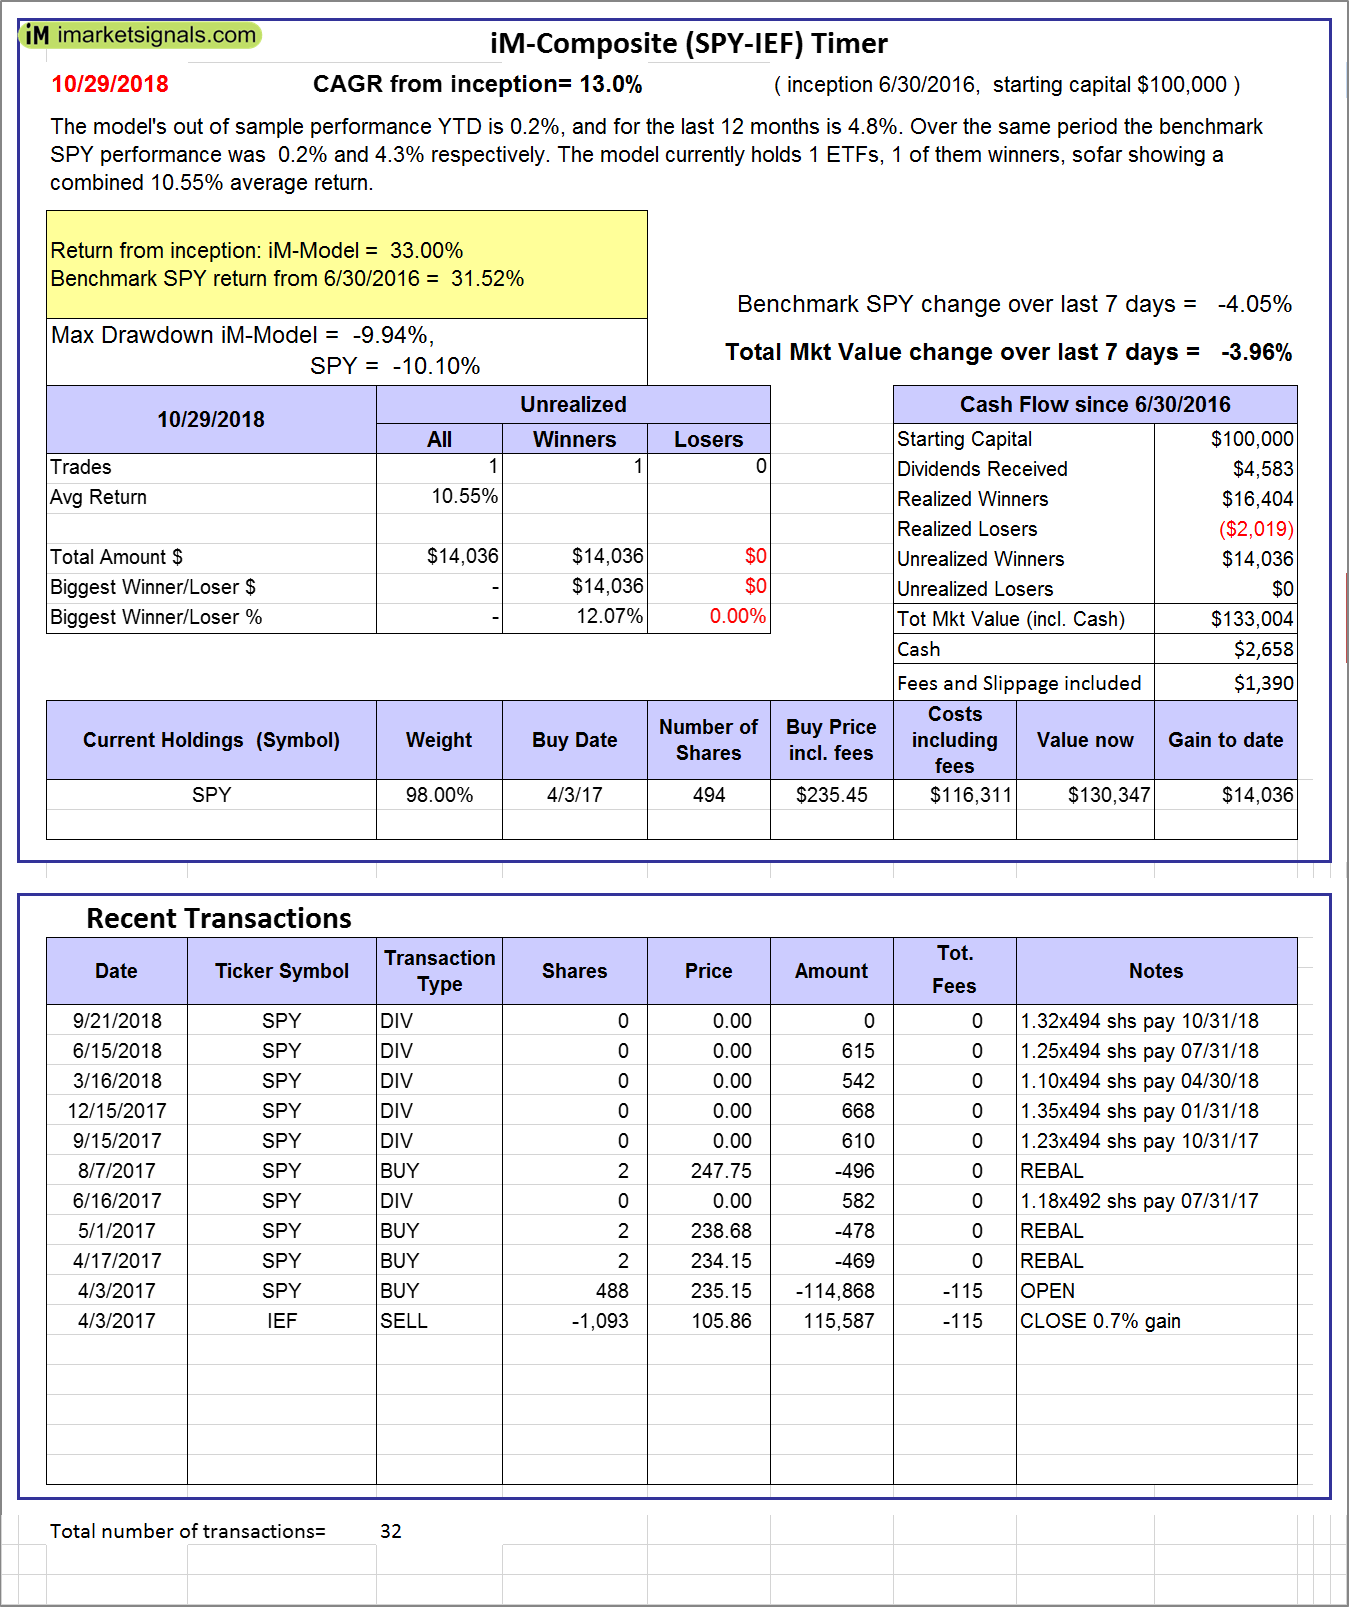 |
iM-Composite (SPY-IEF) Timer: The model’s out of sample performance YTD is 0.2%, and for the last 12 months is 4.8%. Over the same period the benchmark SPY performance was 0.2% and 4.3% respectively. Over the previous week the market value of the iM-Composite (SPY-IEF) Timer gained -3.96% at a time when SPY gained -4.05%. A starting capital of $100,000 at inception on 6/30/2016 would have grown to $133,004 which includes $2,658 cash and excludes $1,390 spent on fees and slippage. |
 |
iM-VIX Timer with ZIV: The model’s out of sample performance YTD is 7.9%, and for the last 12 months is 20.9%. Over the same period the benchmark SPY performance was 0.2% and 4.3% respectively. Over the previous week the market value of the iM-VIX Timer with ZIV gained -8.51% at a time when SPY gained -4.05%. A starting capital of $100,000 at inception on 6/30/2016 would have grown to $189,943 which includes $1 cash and excludes $2,858 spent on fees and slippage. |
 |
iM-Composite(Gold-Stocks-Bond) Timer: The model’s out of sample performance YTD is -5.9%, and for the last 12 months is -3.7%. Over the same period the benchmark SPY performance was 0.2% and 4.3% respectively. Over the previous week the market value of the iM-Composite(Gold-Stocks-Bond) Timer gained 0.51% at a time when SPY gained -4.05%. A starting capital of $100,000 at inception on 6/30/2016 would have grown to $121,141 which includes $99 cash and excludes $1,956 spent on fees and slippage. |
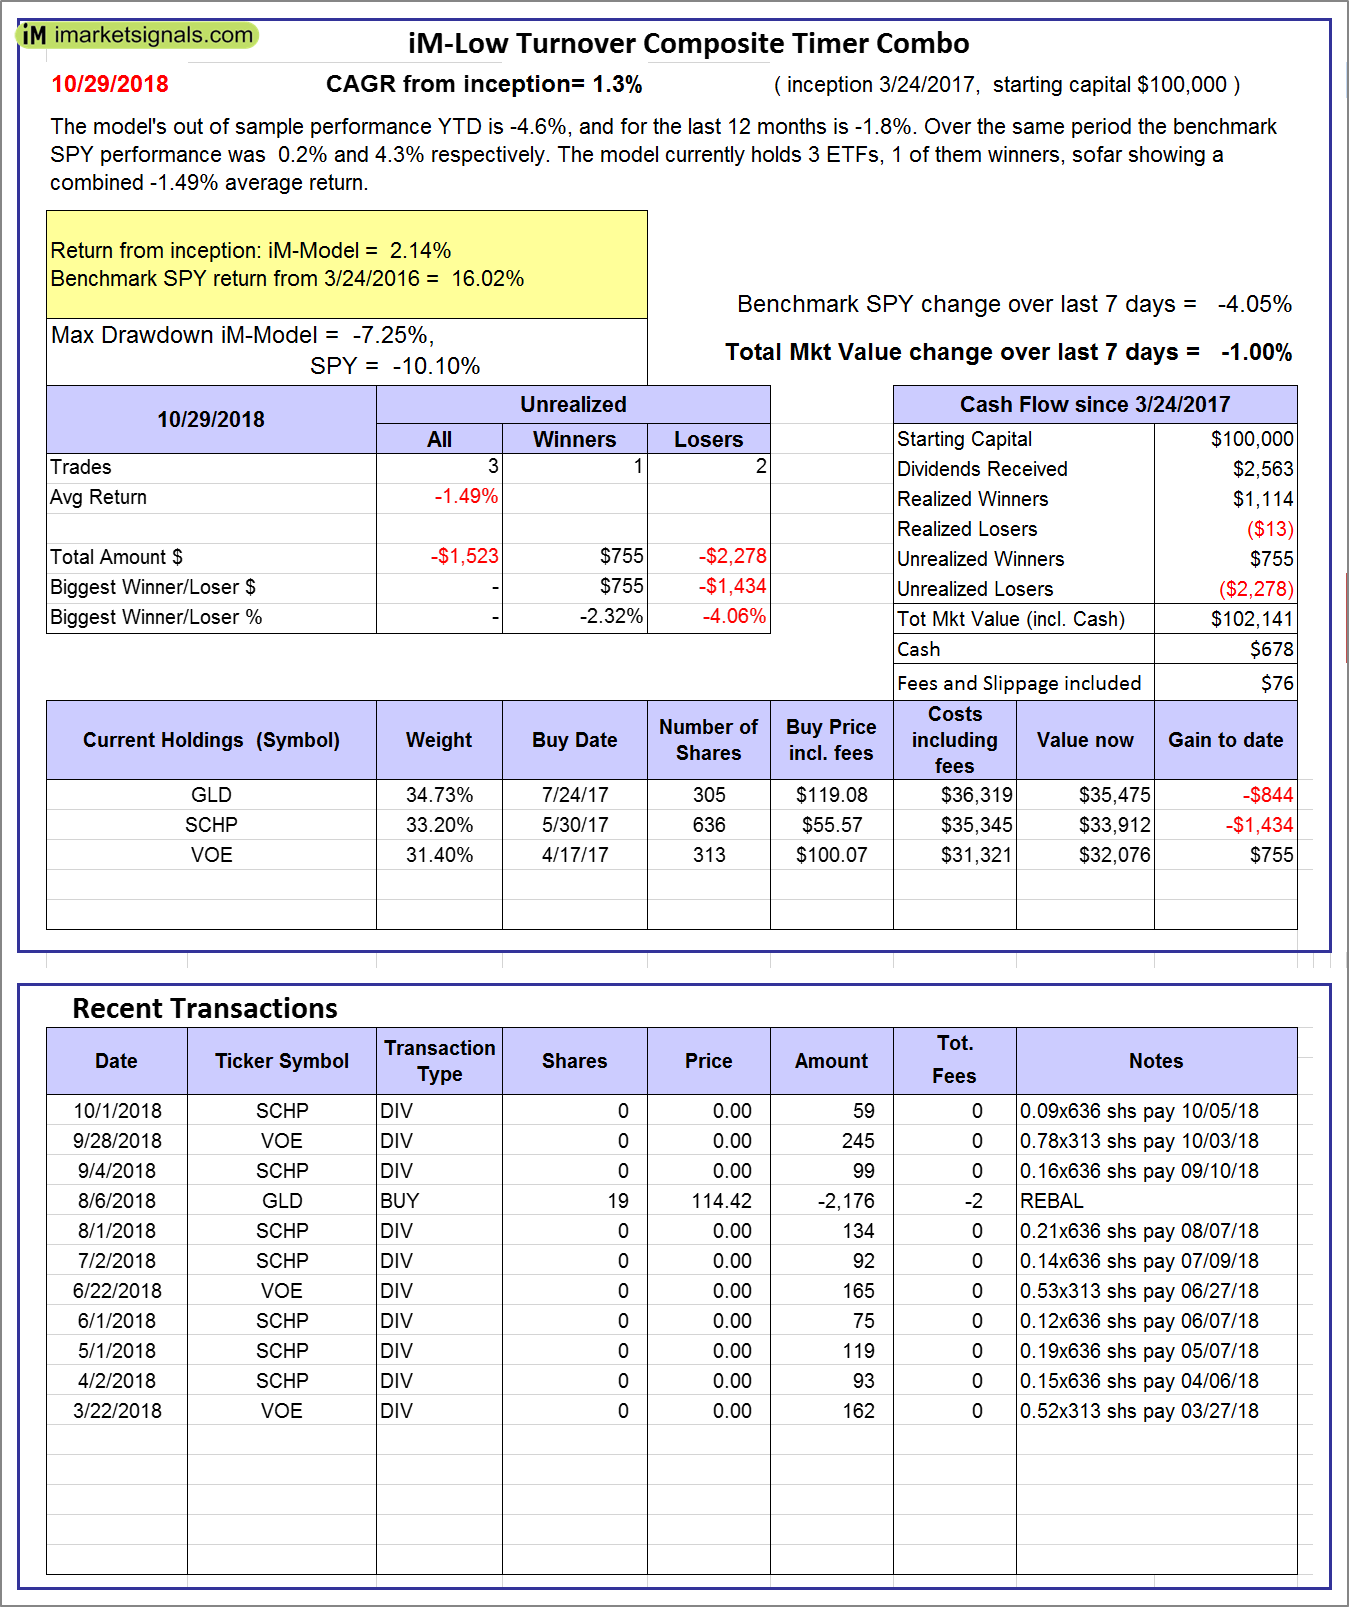 |
iM-Low Turnover Composite Timer Combo: The model’s out of sample performance YTD is -4.6%, and for the last 12 months is -1.8%. Over the same period the benchmark SPY performance was 0.2% and 4.3% respectively. Over the previous week the market value of the iM-Low Turnover Composite Timer Combo gained -1.00% at a time when SPY gained -4.05%. A starting capital of $100,000 at inception on 3/24/27 would have grown to $102,141 which includes $678 cash and excludes $76 spent on fees and slippage. |
 |
iM-Min Drawdown Combo: The model’s out of sample performance YTD is 1.2%, and for the last 12 months is 4.9%. Over the same period the benchmark SPY performance was 0.2% and 4.3% respectively. Over the previous week the market value of the iM-Min Drawdown Combo gained -0.49% at a time when SPY gained -4.05%. A starting capital of $100,000 at inception on 4/5/2017 would have grown to $108,989 which includes $2,735 cash and excludes $417 spent on fees and slippage. |
 |
iM-5ETF Trader (includes leveraged ETFs): The model’s out of sample performance YTD is -3.7%, and for the last 12 months is 3.0%. Over the same period the benchmark SPY performance was 0.2% and 4.3% respectively. Over the previous week the market value of the iM-5ETF Trader (includes leveraged ETFs) gained -8.09% at a time when SPY gained -4.05%. A starting capital of $100,000 at inception on 10/30/2016 would have grown to $156,769 which includes $1,874 cash and excludes $1,030 spent on fees and slippage. |
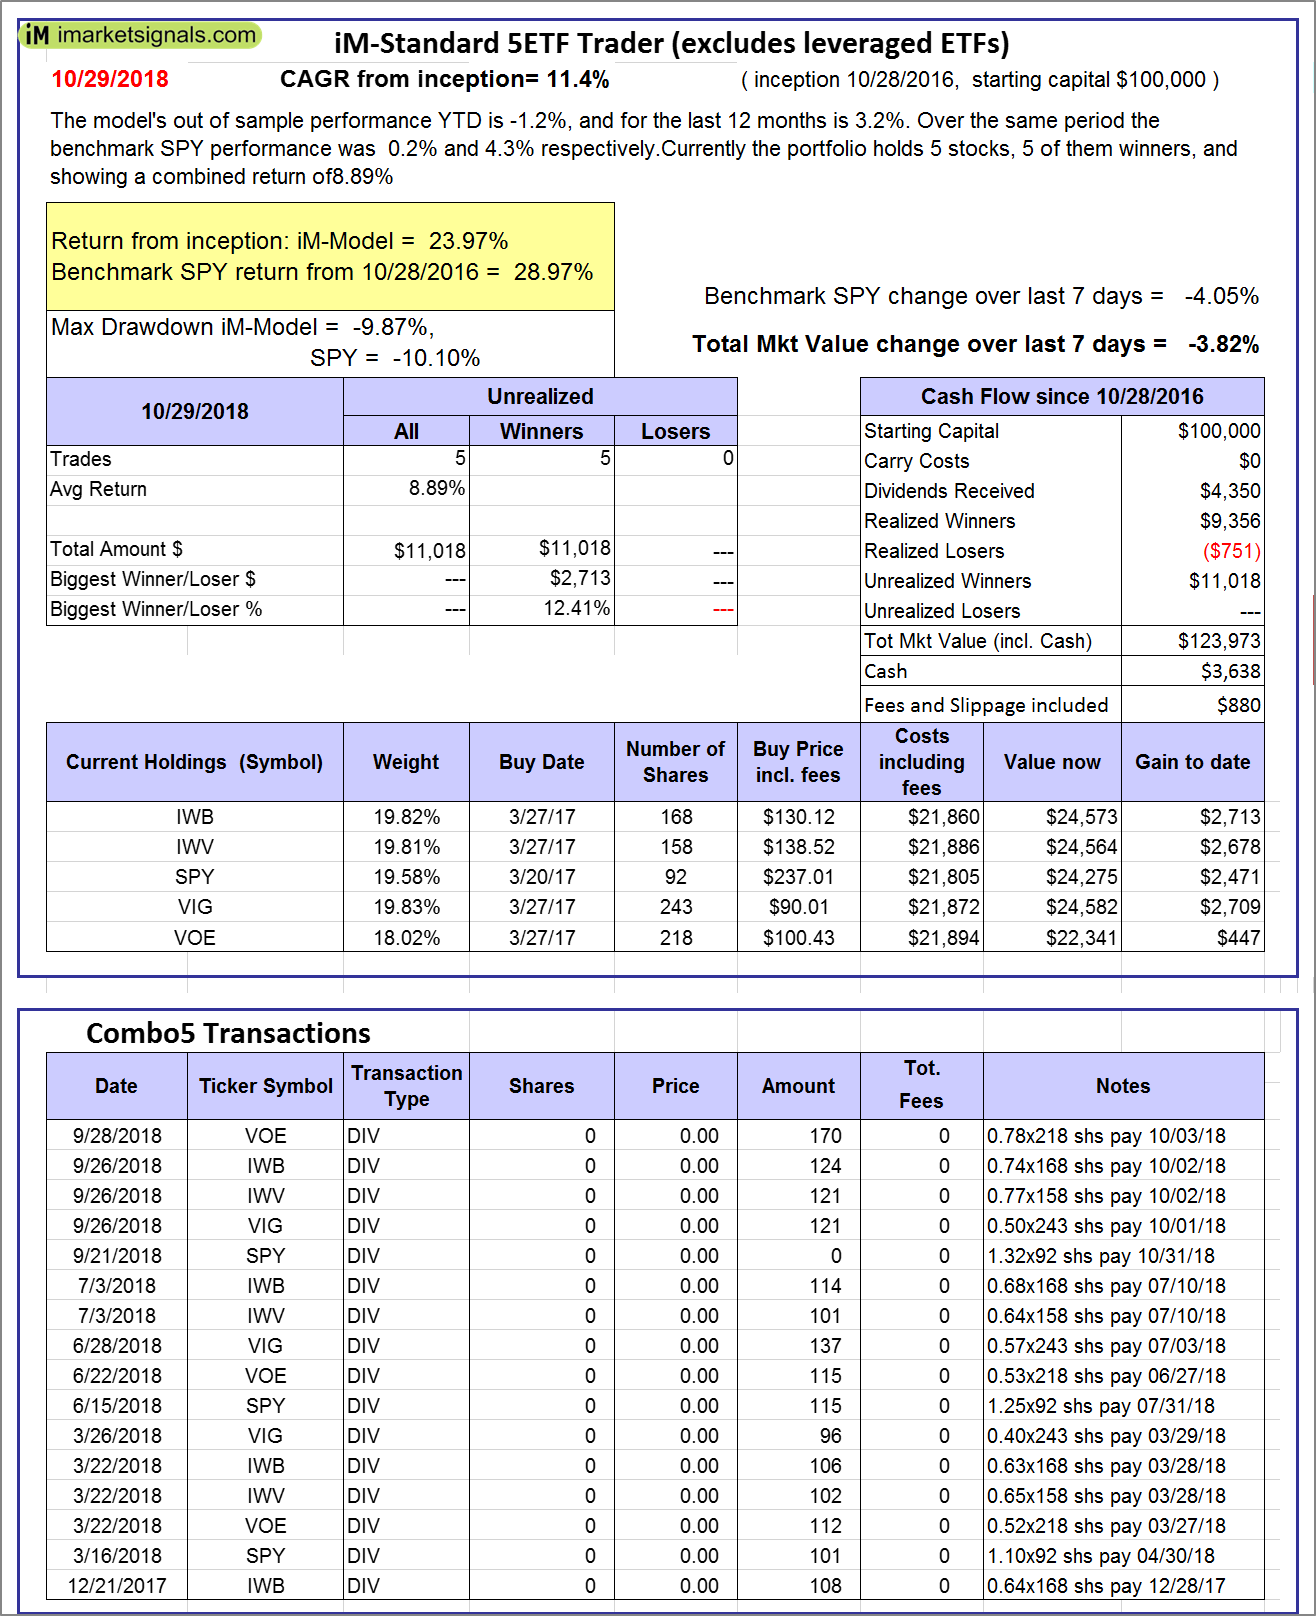 |
iM-Standard 5ETF Trader (excludes leveraged ETFs): The model’s out of sample performance YTD is -1.2%, and for the last 12 months is 3.2%. Over the same period the benchmark SPY performance was 0.2% and 4.3% respectively. Over the previous week the market value of the iM-Standard 5ETF Trader (excludes leveraged ETFs) gained -3.82% at a time when SPY gained -4.05%. A starting capital of $100,000 at inception on 10/30/2016 would have grown to $123,973 which includes $3,638 cash and excludes $880 spent on fees and slippage. |
iM-Best Reports – 10/29/2018
Posted in pmp SPY-SH
Leave a Reply
You must be logged in to post a comment.