
  |
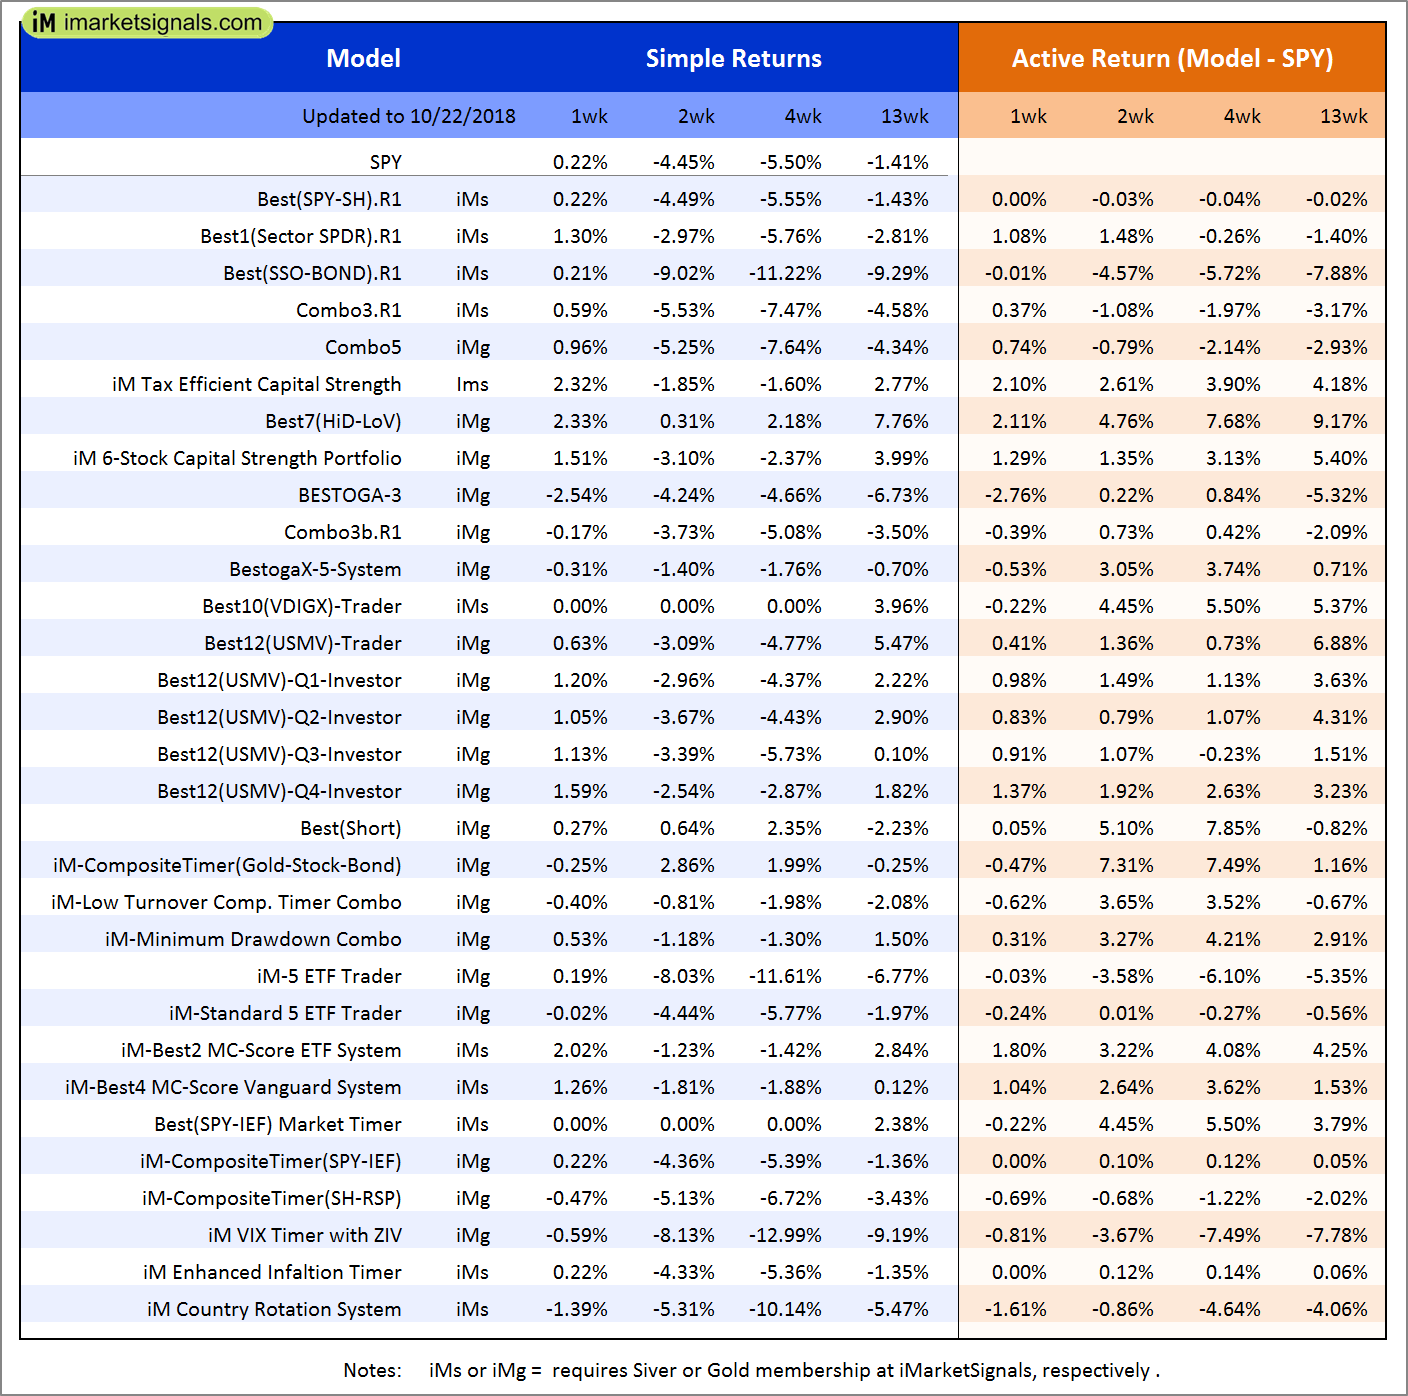
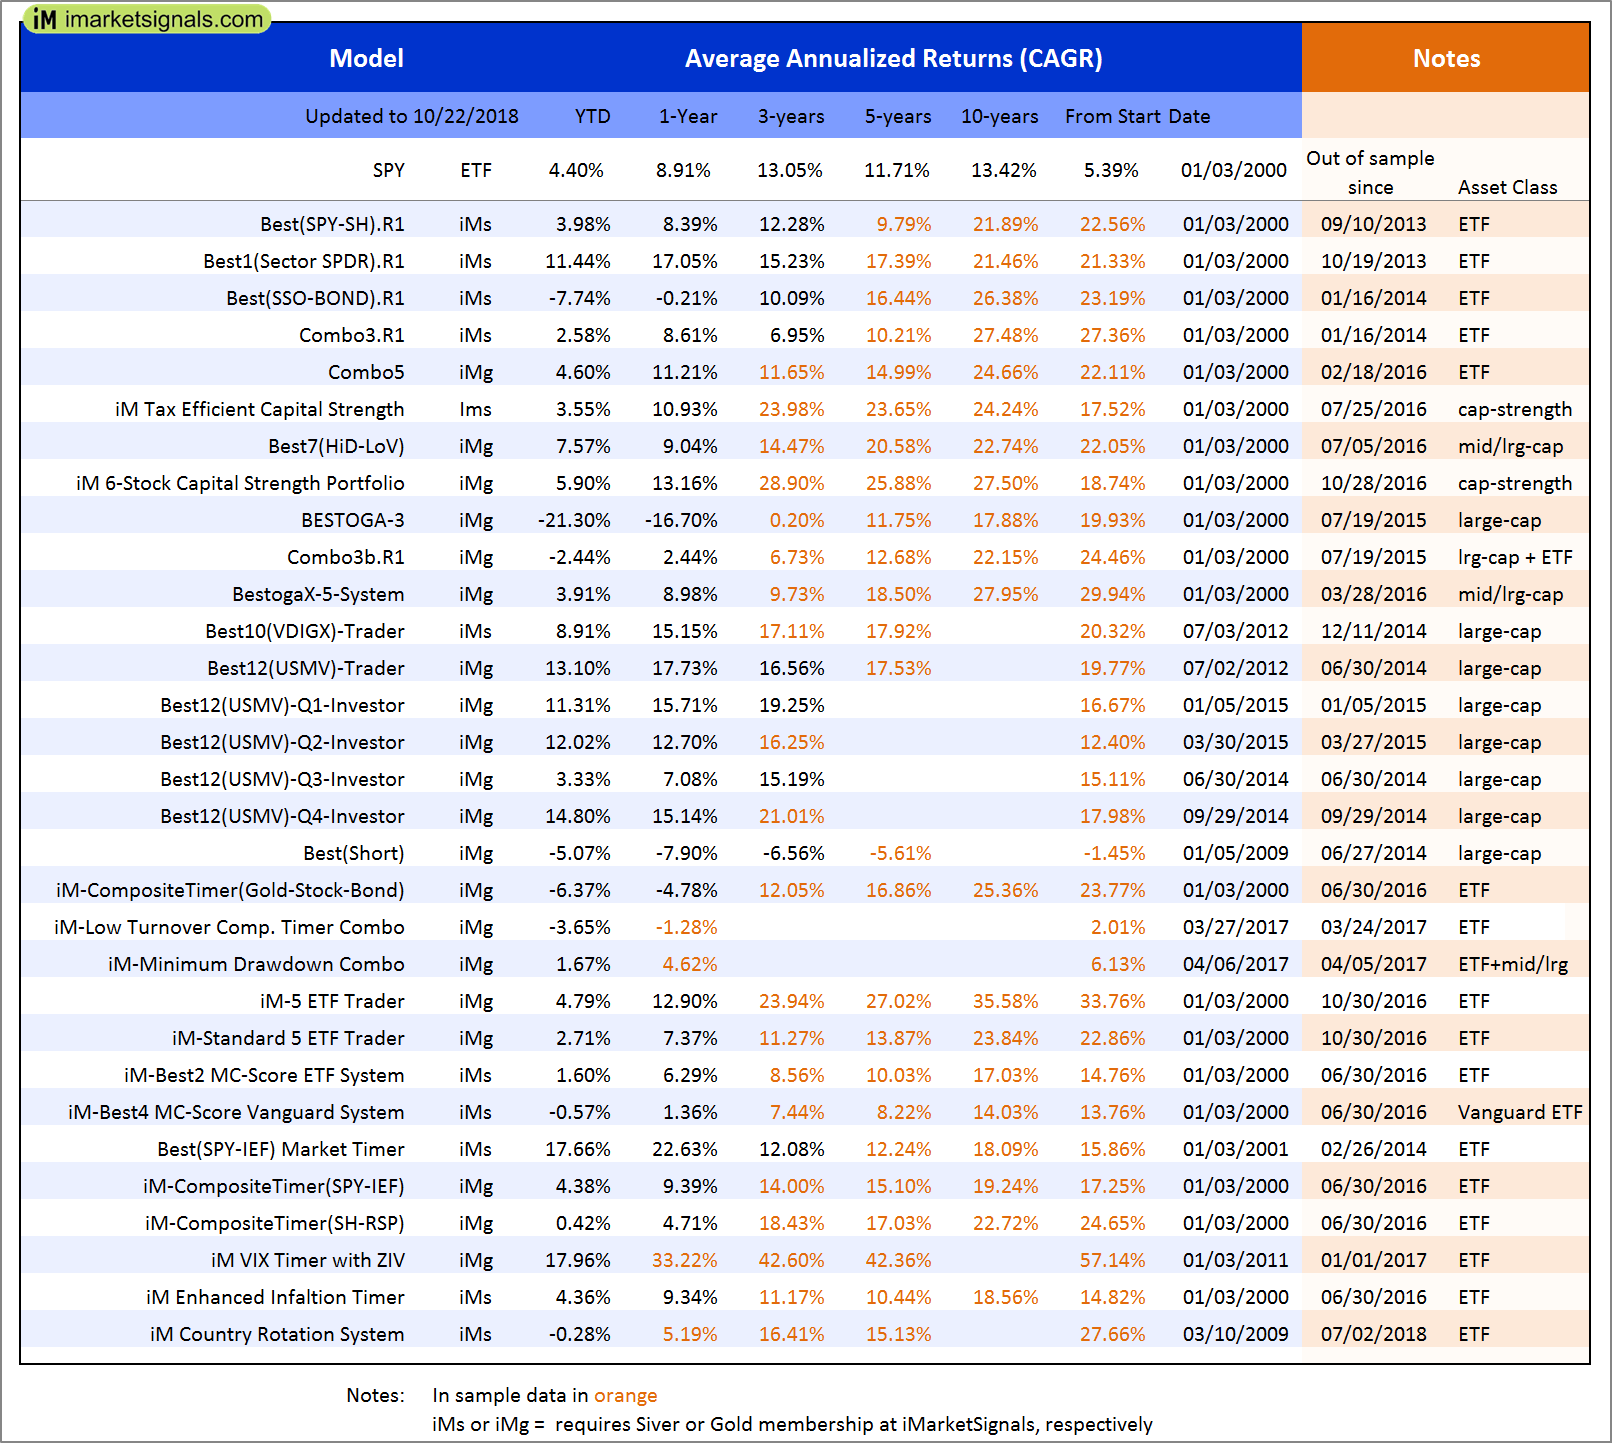
Out of sample performance summary of our models for the past 1, 2, 4 and 13 week periods. The active active return indicates how the models over- or underperformed the benchmark ETF SPY. Also the YTD, and the 1-, 3-, 5- and 10-year annualized returns are shown in the second table |
 |
iM-Best(SPY-SH).R1: The model’s out of sample performance YTD is 4.0%, and for the last 12 months is 8.9%. Over the same period the benchmark SPY performance was 4.4% and 8.9% respectively. Over the previous week the market value of Best(SPY-SH) gained 0.22% at a time when SPY gained 0.22%. A starting capital of $100,000 at inception on 1/2/2009 would have grown to $584,696 which includes -$4,925 cash and excludes $17,694 spent on fees and slippage. |
 |
iM-Combo3.R1: The model’s out of sample performance YTD is 2.5%, and for the last 12 months is 8.8%. Over the same period the benchmark SPY performance was 4.4% and 8.9% respectively. Over the previous week the market value of iM-Combo3.R1 gained 0.59% at a time when SPY gained 0.22%. A starting capital of $100,000 at inception on 2/3/2014 would have grown to $161,738 which includes -$866 cash and excludes $4,125 spent on fees and slippage. |
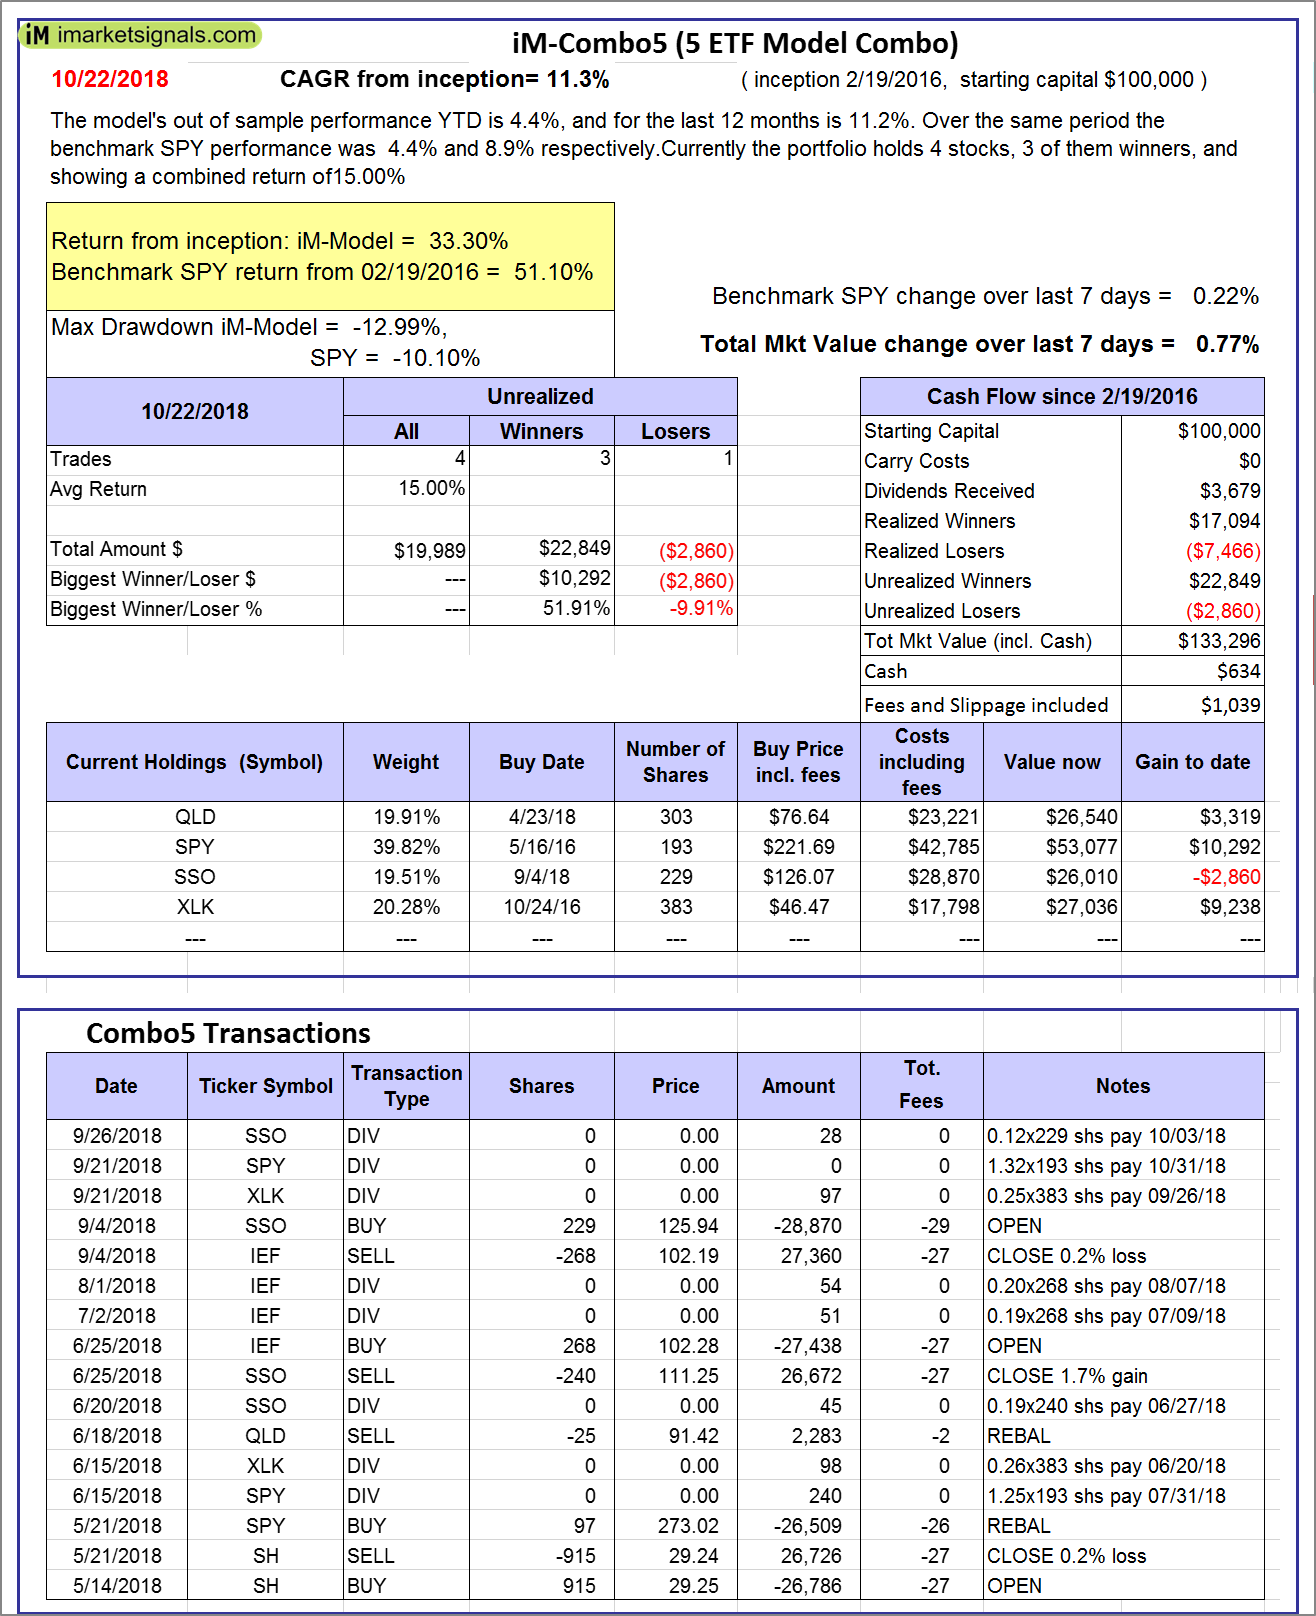 |
iM-Combo5: The model’s out of sample performance YTD is 4.4%, and for the last 12 months is 11.2%. Over the same period the benchmark SPY performance was 4.4% and 8.9% respectively. Over the previous week the market value of iM-Combo5 gained 0.77% at a time when SPY gained 0.22%. A starting capital of $100,000 at inception on 2/22/2016 would have grown to $133,296 which includes $634 cash and excludes $1,039 spent on fees and slippage. |
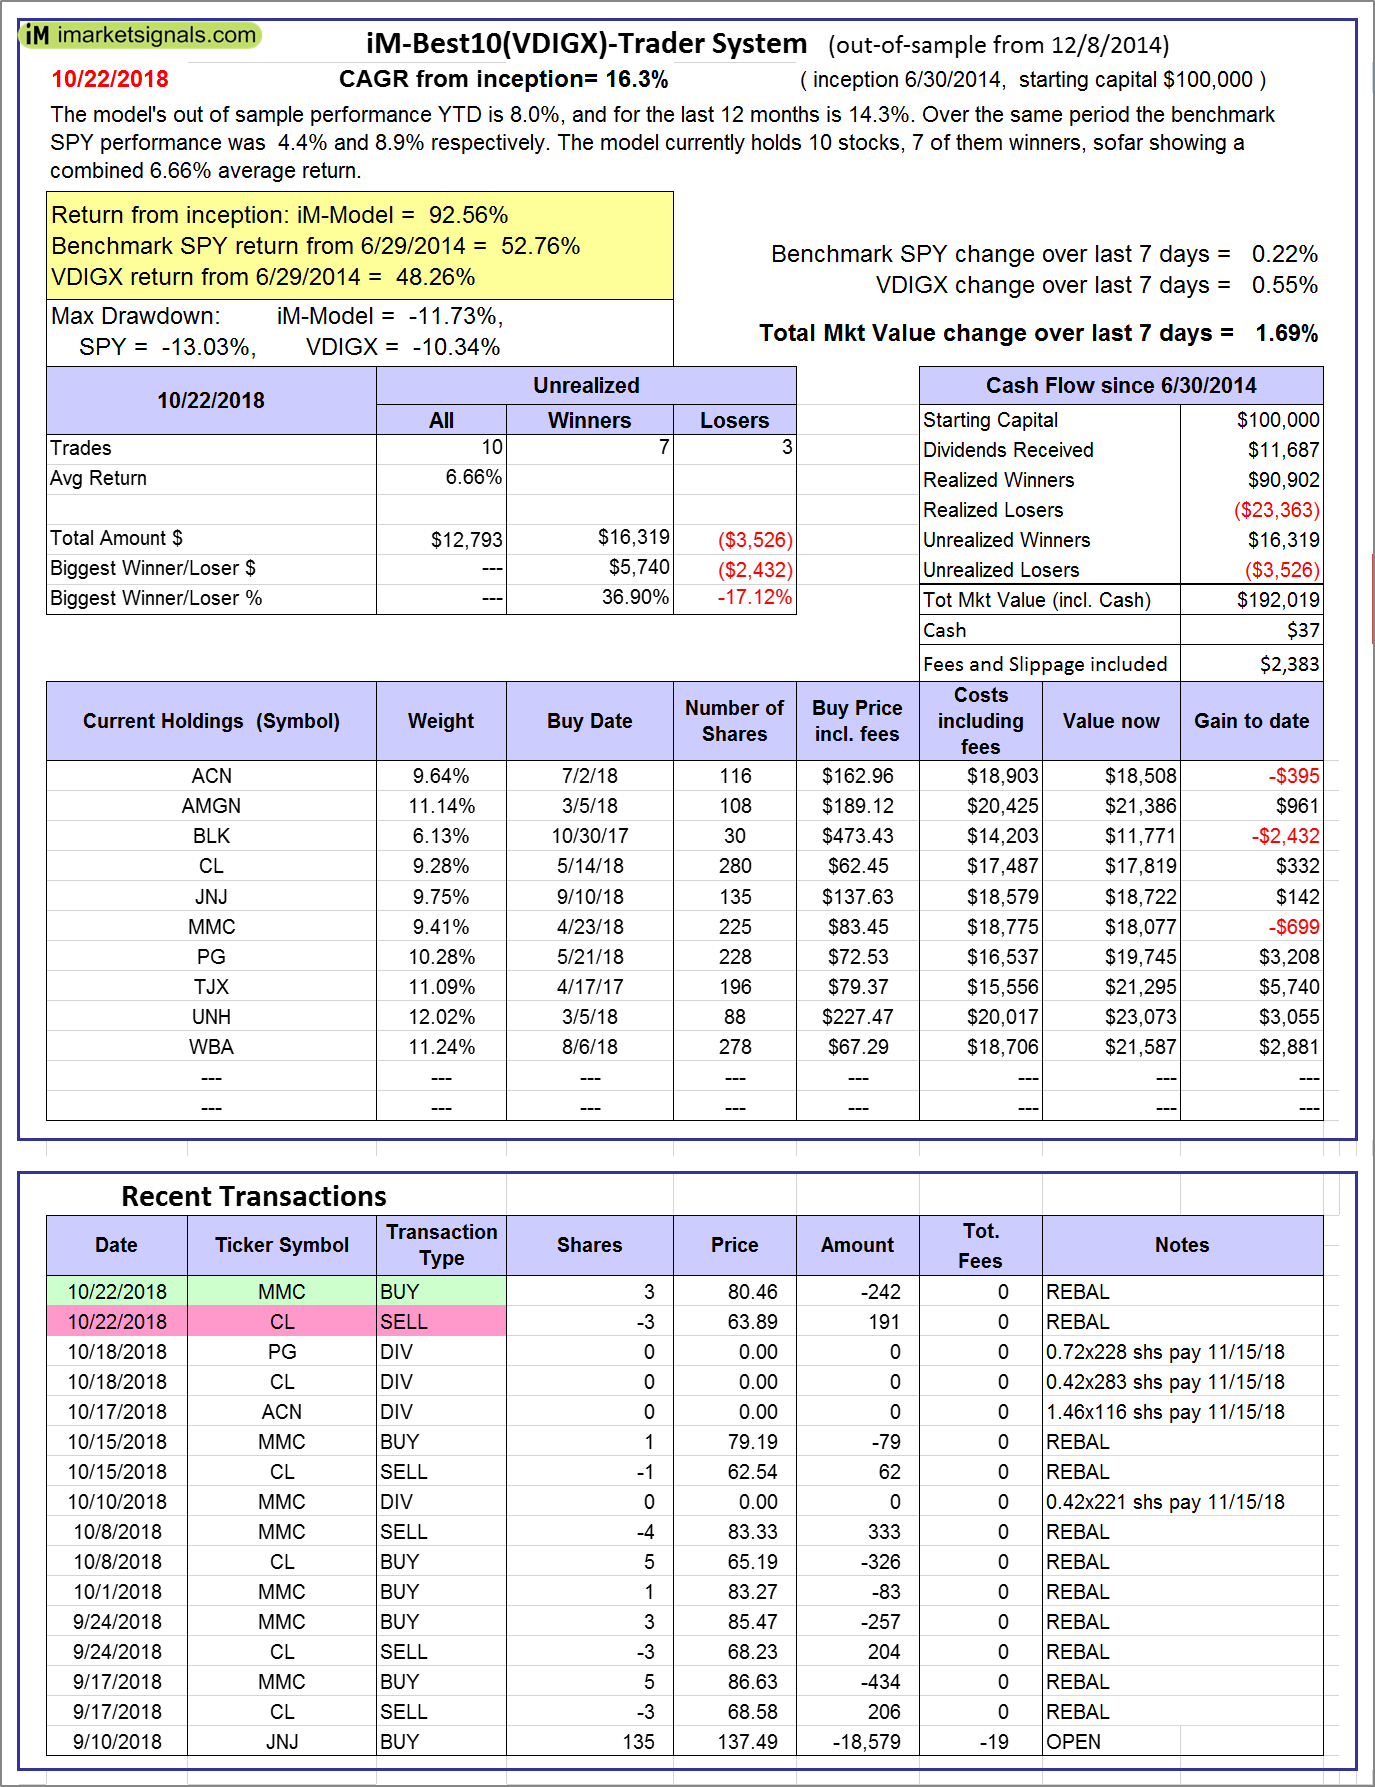 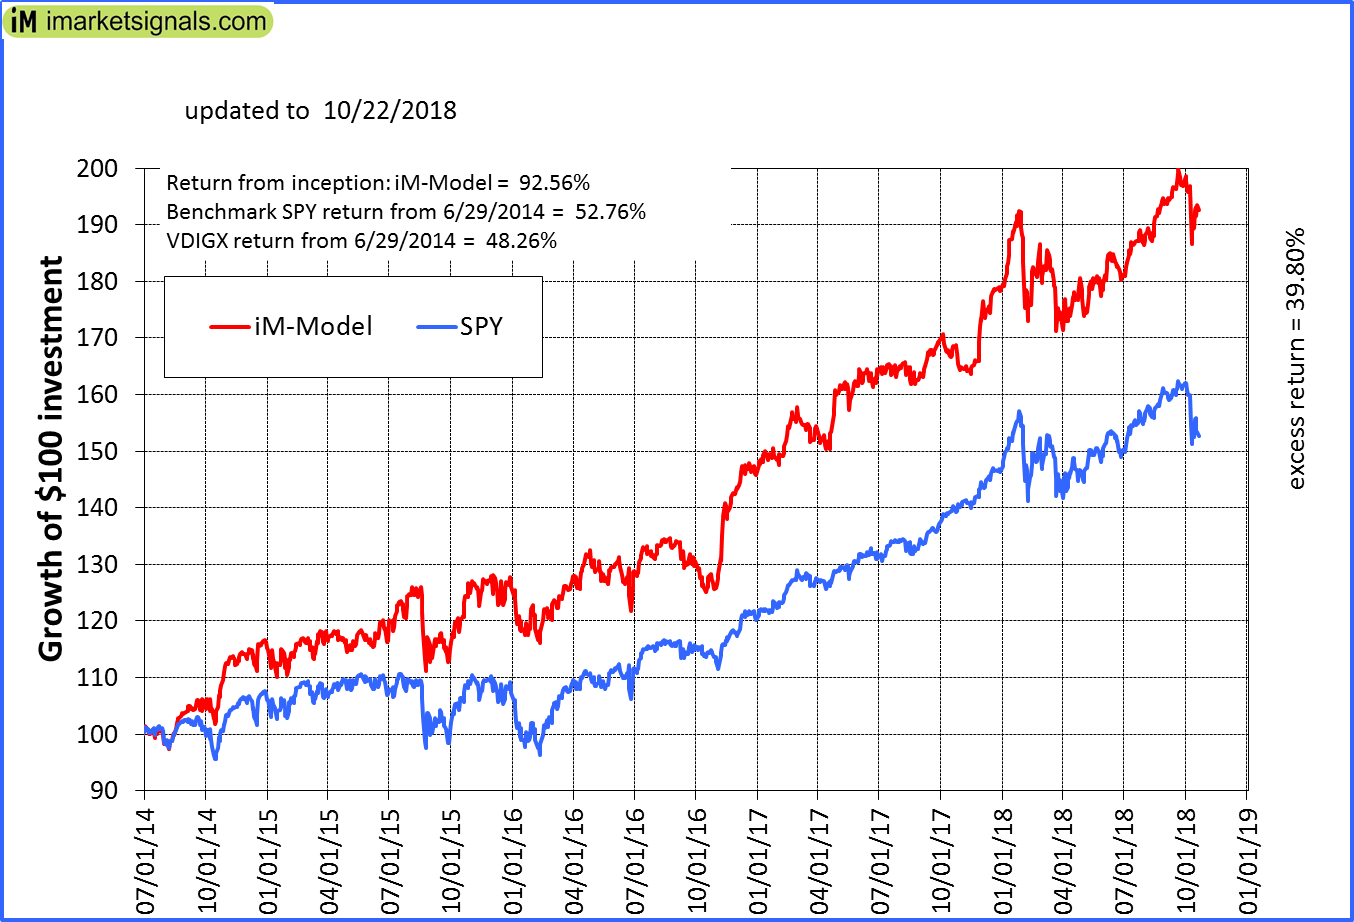 |
iM-Best10(VDIGX)-Trader: The model’s out of sample performance YTD is 8.0%, and for the last 12 months is 14.3%. Over the same period the benchmark SPY performance was 4.4% and 8.9% respectively. Since inception, on 7/1/2014, the model gained 92.56% while the benchmark SPY gained 52.76% and VDIGX gained 48.26% over the same period. Over the previous week the market value of iM-Best10(VDIGX) gained 1.69% at a time when SPY gained 0.22%. A starting capital of $100,000 at inception on 7/1/2014 would have grown to $192,019 which includes $37 cash and excludes $2,383 spent on fees and slippage. |
 |
iM-BESTOGA-3: The model’s out of sample performance YTD is -21.6%, and for the last 12 months is -16.7%. Over the same period the benchmark SPY performance was 4.4% and 8.9% respectively. Over the previous week the market value of iM-BESTOGA-3 gained -2.54% at a time when SPY gained 0.22%. A starting capital of $100,000 at inception on 2/3/2014 would have grown to $181,813 which includes $1,421 cash and excludes $3,076 spent on fees and slippage. |
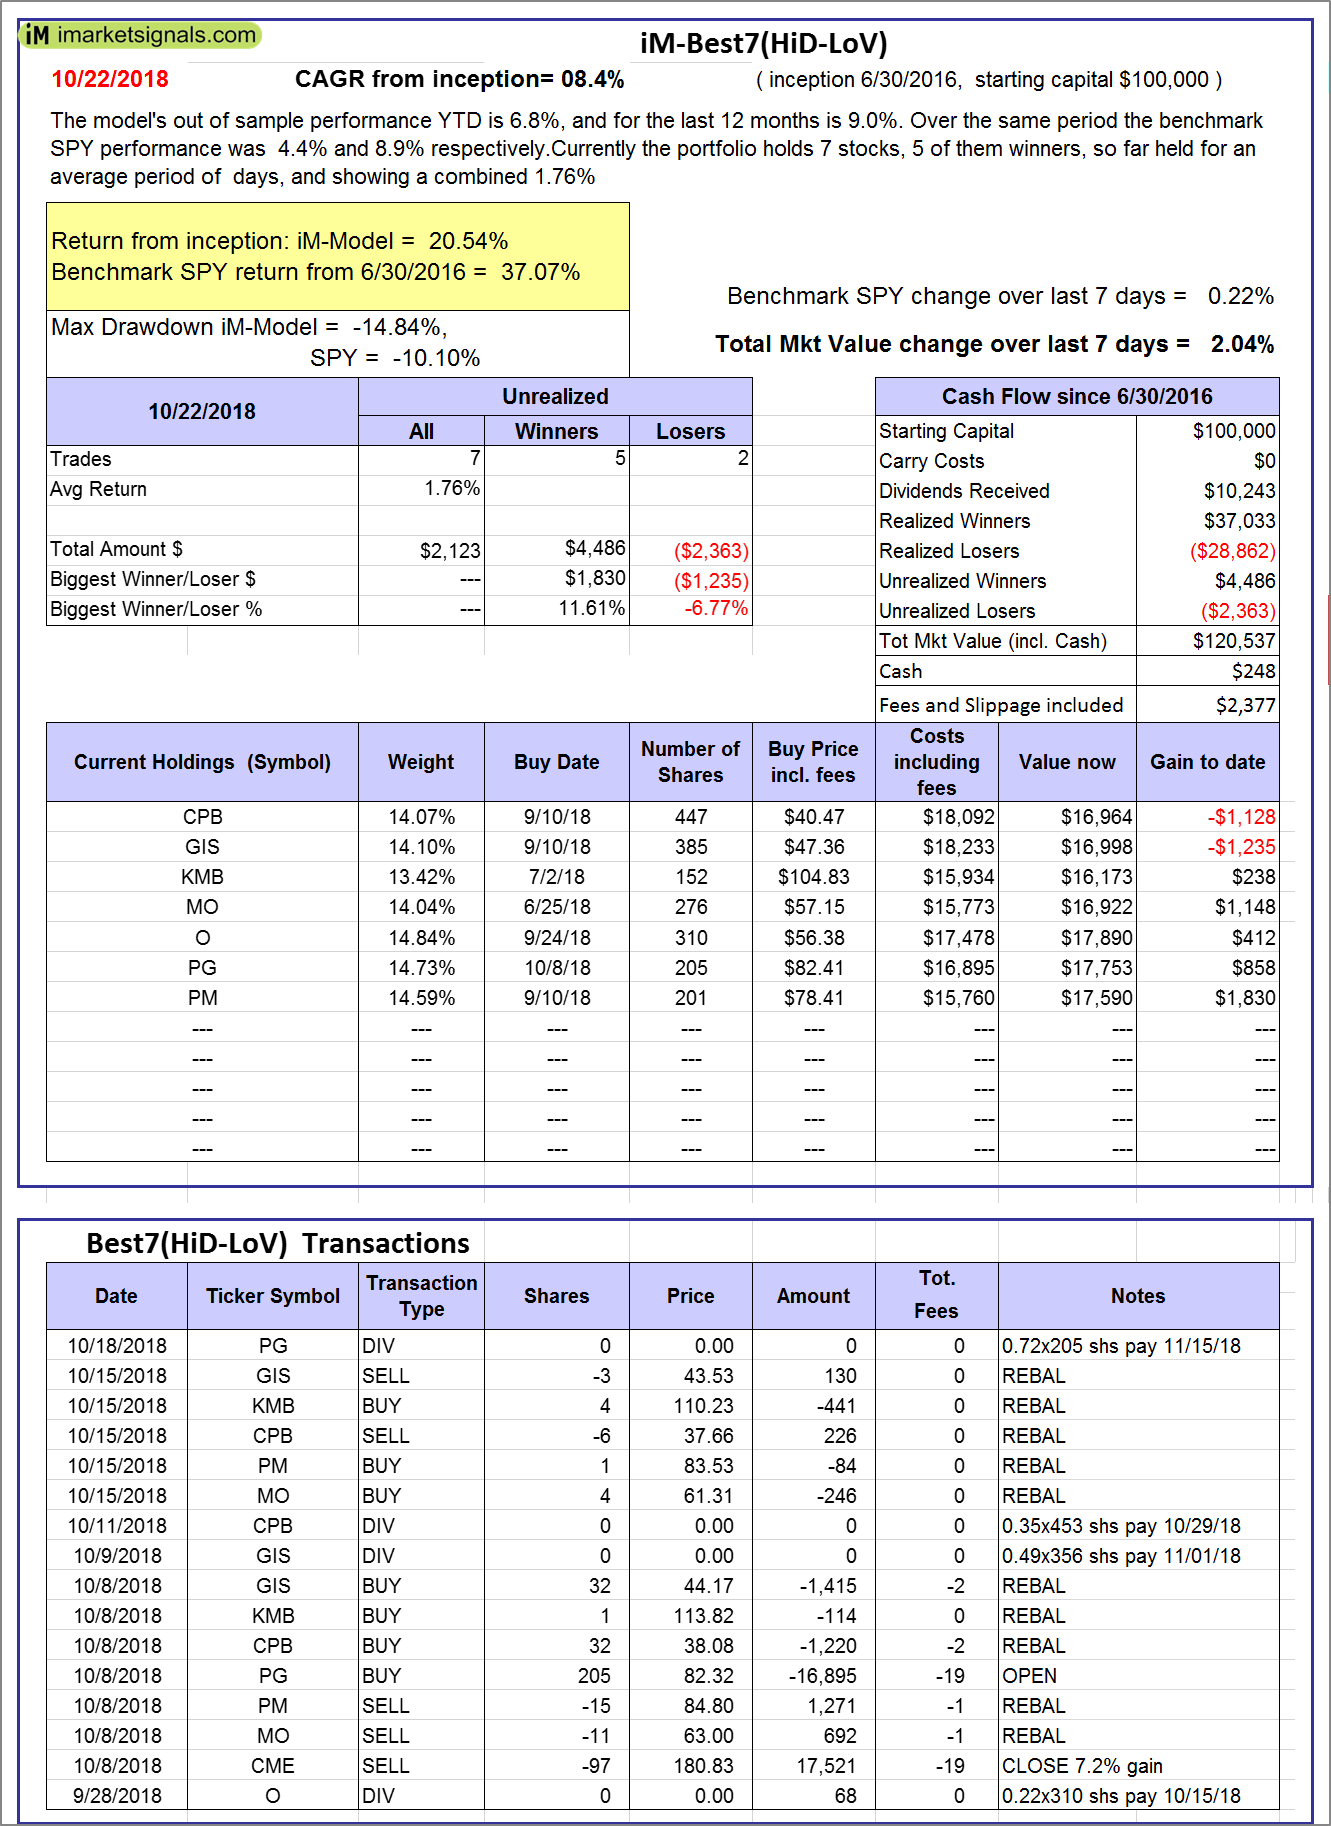 |
iM-Best7(HiD-LoV): The model’s out of sample performance YTD is 6.8%, and for the last 12 months is 9.0%. Over the same period the benchmark SPY performance was 4.4% and 8.9% respectively. Over the previous week the market value of iM-BESTOGA-3 gained 2.04% at a time when SPY gained 0.22%. A starting capital of $100,000 at inception on 6/30/2016 would have grown to $120,537 which includes $248 cash and excludes $2,377 spent on fees and slippage. |
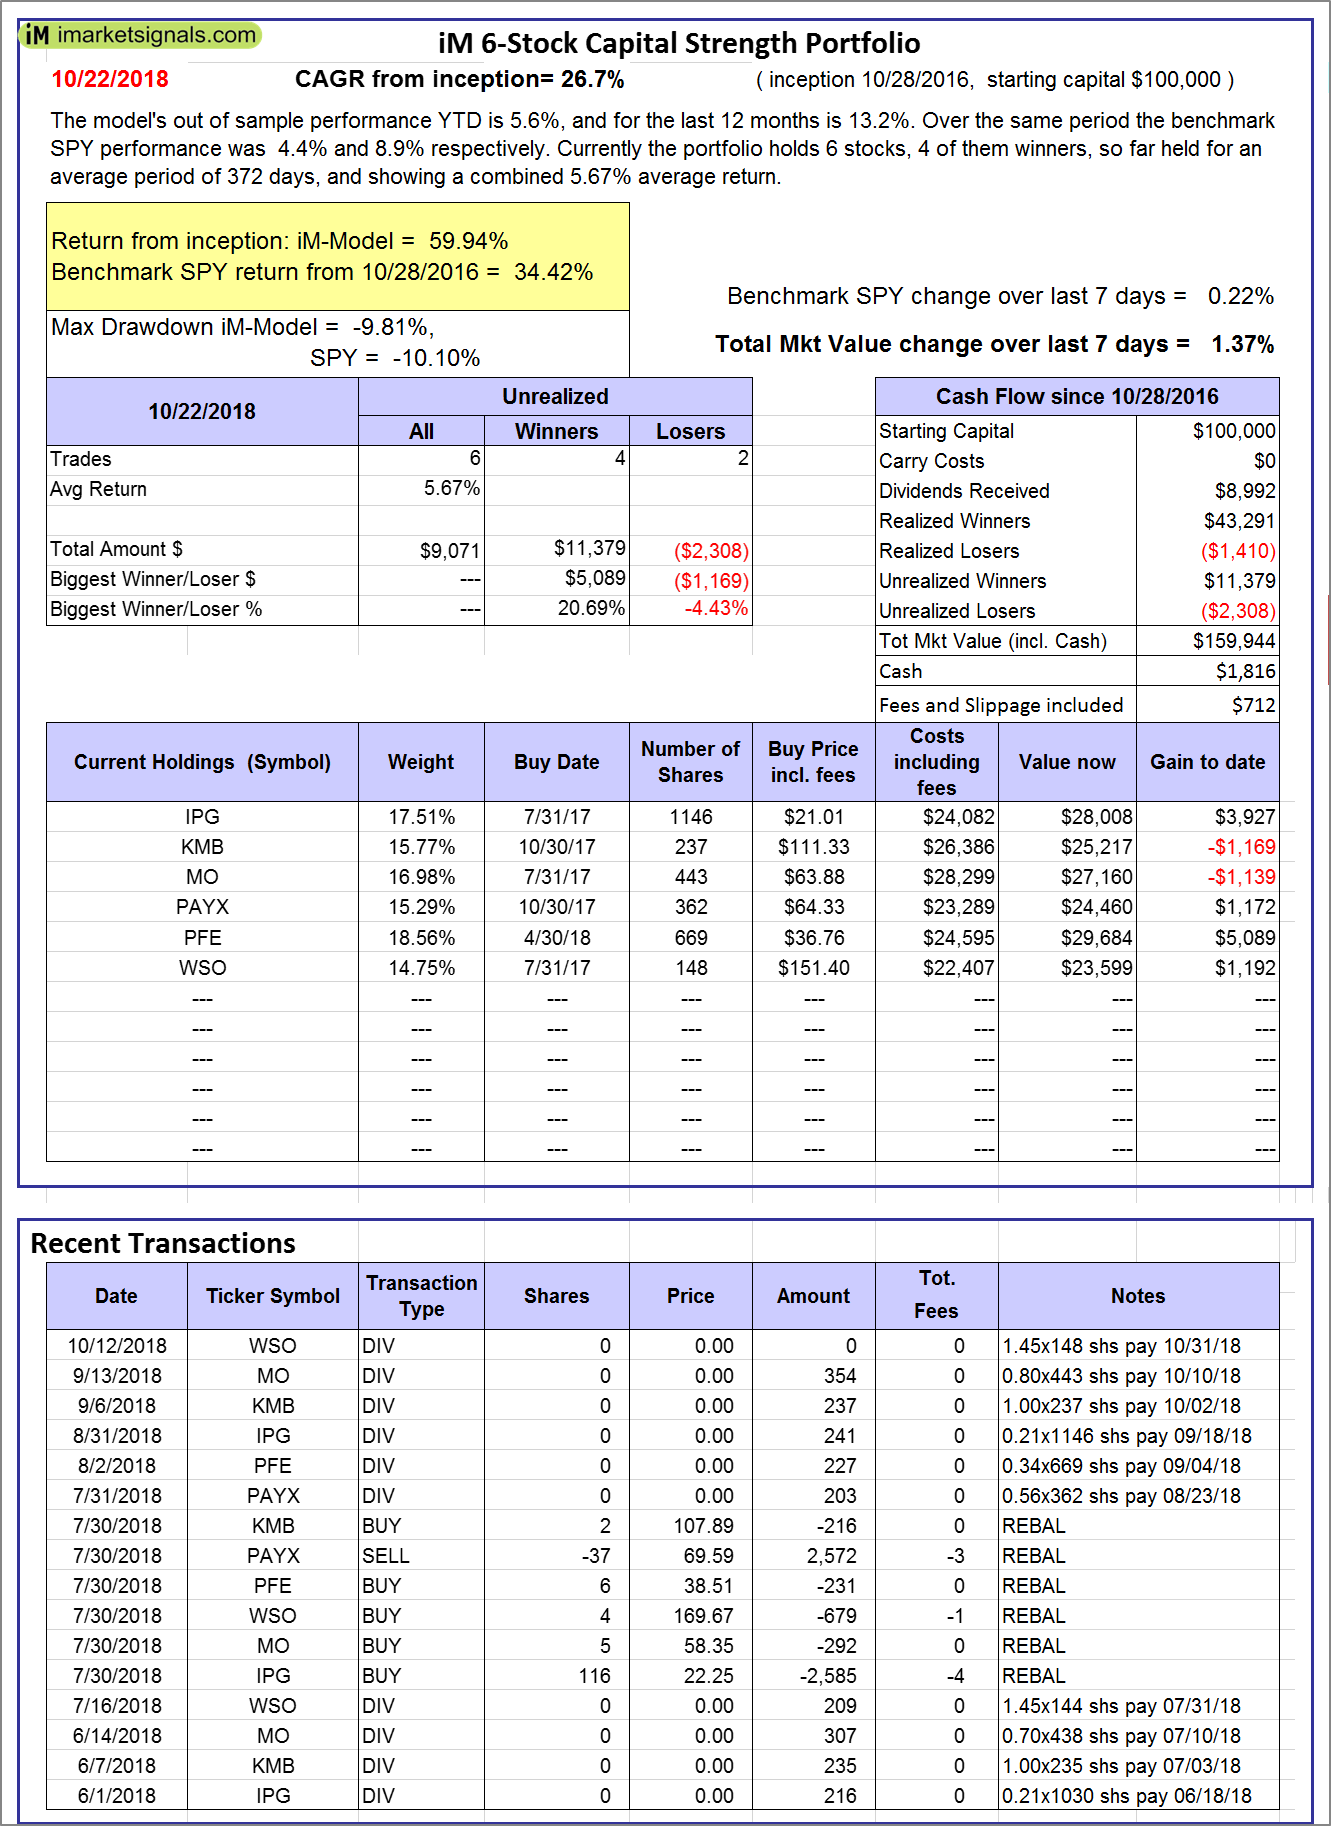 |
iM 6-Stock Capital Strength Portfolio: The model’s out of sample performance YTD is 5.6%, and for the last 12 months is 13.2%. Over the same period the benchmark SPY performance was 4.4% and 8.9% respectively. Over the previous week the market value of the iM 6-Stock Capital Strength Portfolio gained 1.37% at a time when SPY gained 0.22%. A starting capital of $100,000 at inception on 10/28/2016 would have grown to $159,944 which includes $1,816 cash and excludes $712 spent on fees and slippage. |
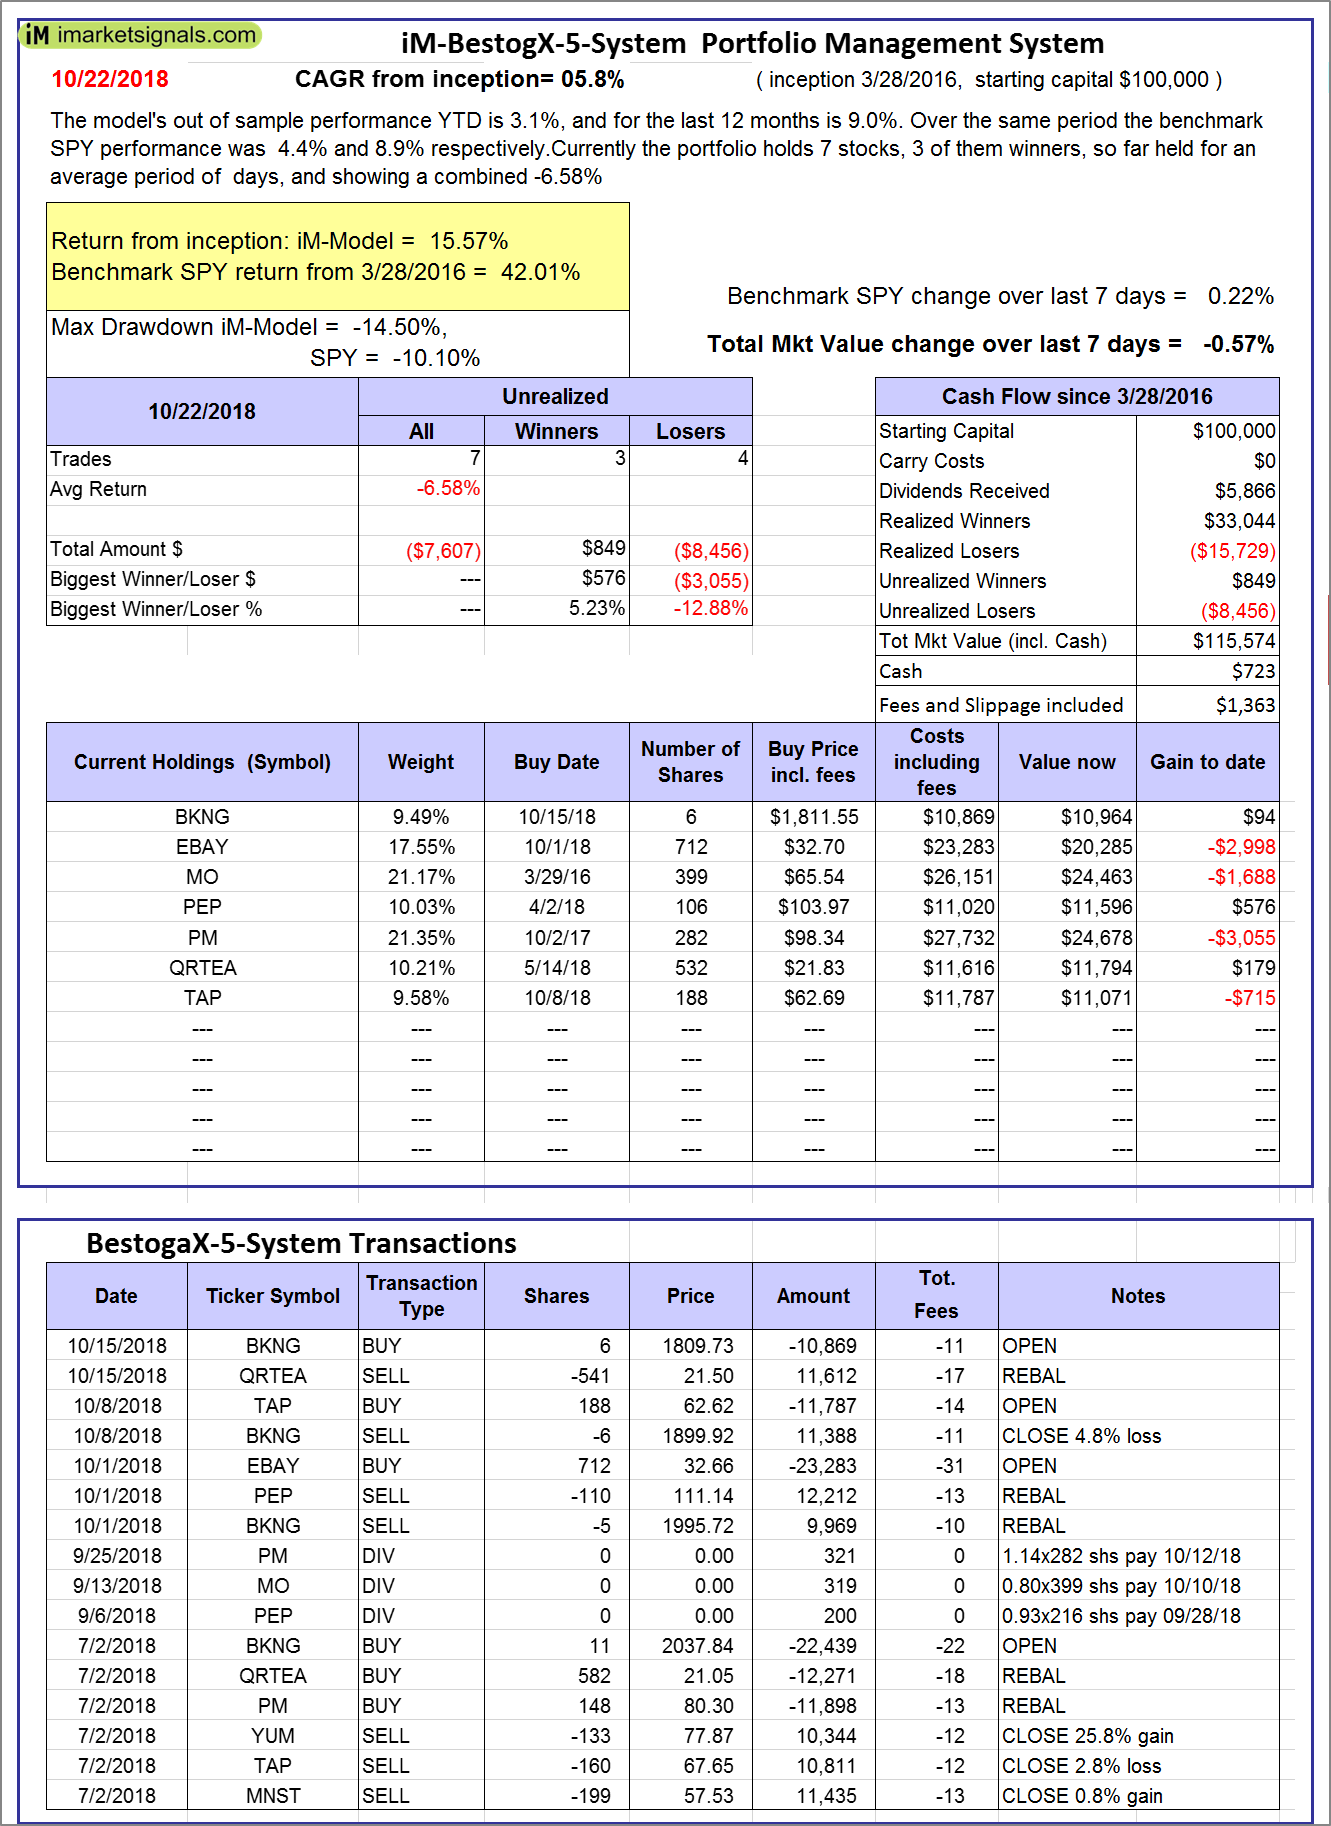 |
iM-BestogaX5-System: The model’s out of sample performance YTD is 3.1%, and for the last 12 months is 9.0%. Over the same period the benchmark SPY performance was 4.4% and 8.9% respectively. Over the previous week the market value of iM-BestogaX5-System gained -0.57% at a time when SPY gained 0.22%. A starting capital of $100,000 at inception on 3/28/2016 would have grown to $115,574 which includes $723 cash and excludes $1,363 spent on fees and slippage. |
 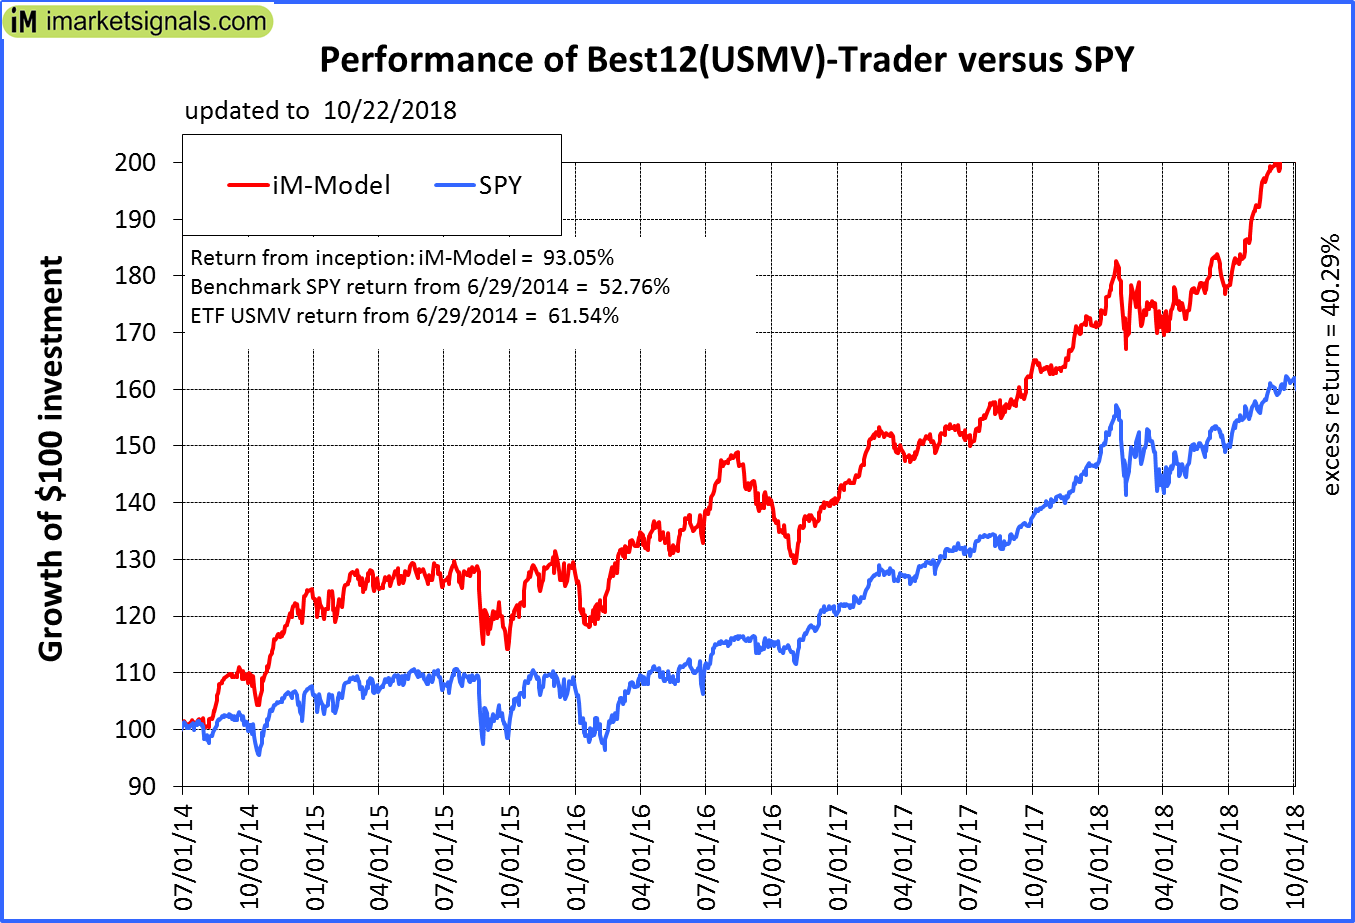 |
iM-Best12(USMV)-Trader: The model’s out of sample performance YTD is 12.9%, and for the last 12 months is 17.7%. Over the same period the benchmark SPY performance was 4.4% and 8.9% respectively. Since inception, on 6/30/2014, the model gained 93.05% while the benchmark SPY gained 52.76% and the ETF USMV gained 61.54% over the same period. Over the previous week the market value of iM-Best12(USMV)-Trader gained 0.54% at a time when SPY gained 0.22%. A starting capital of $100,000 at inception on 6/30/2014 would have grown to $192,870 which includes -$134 cash and excludes $4,644 spent on fees and slippage. |
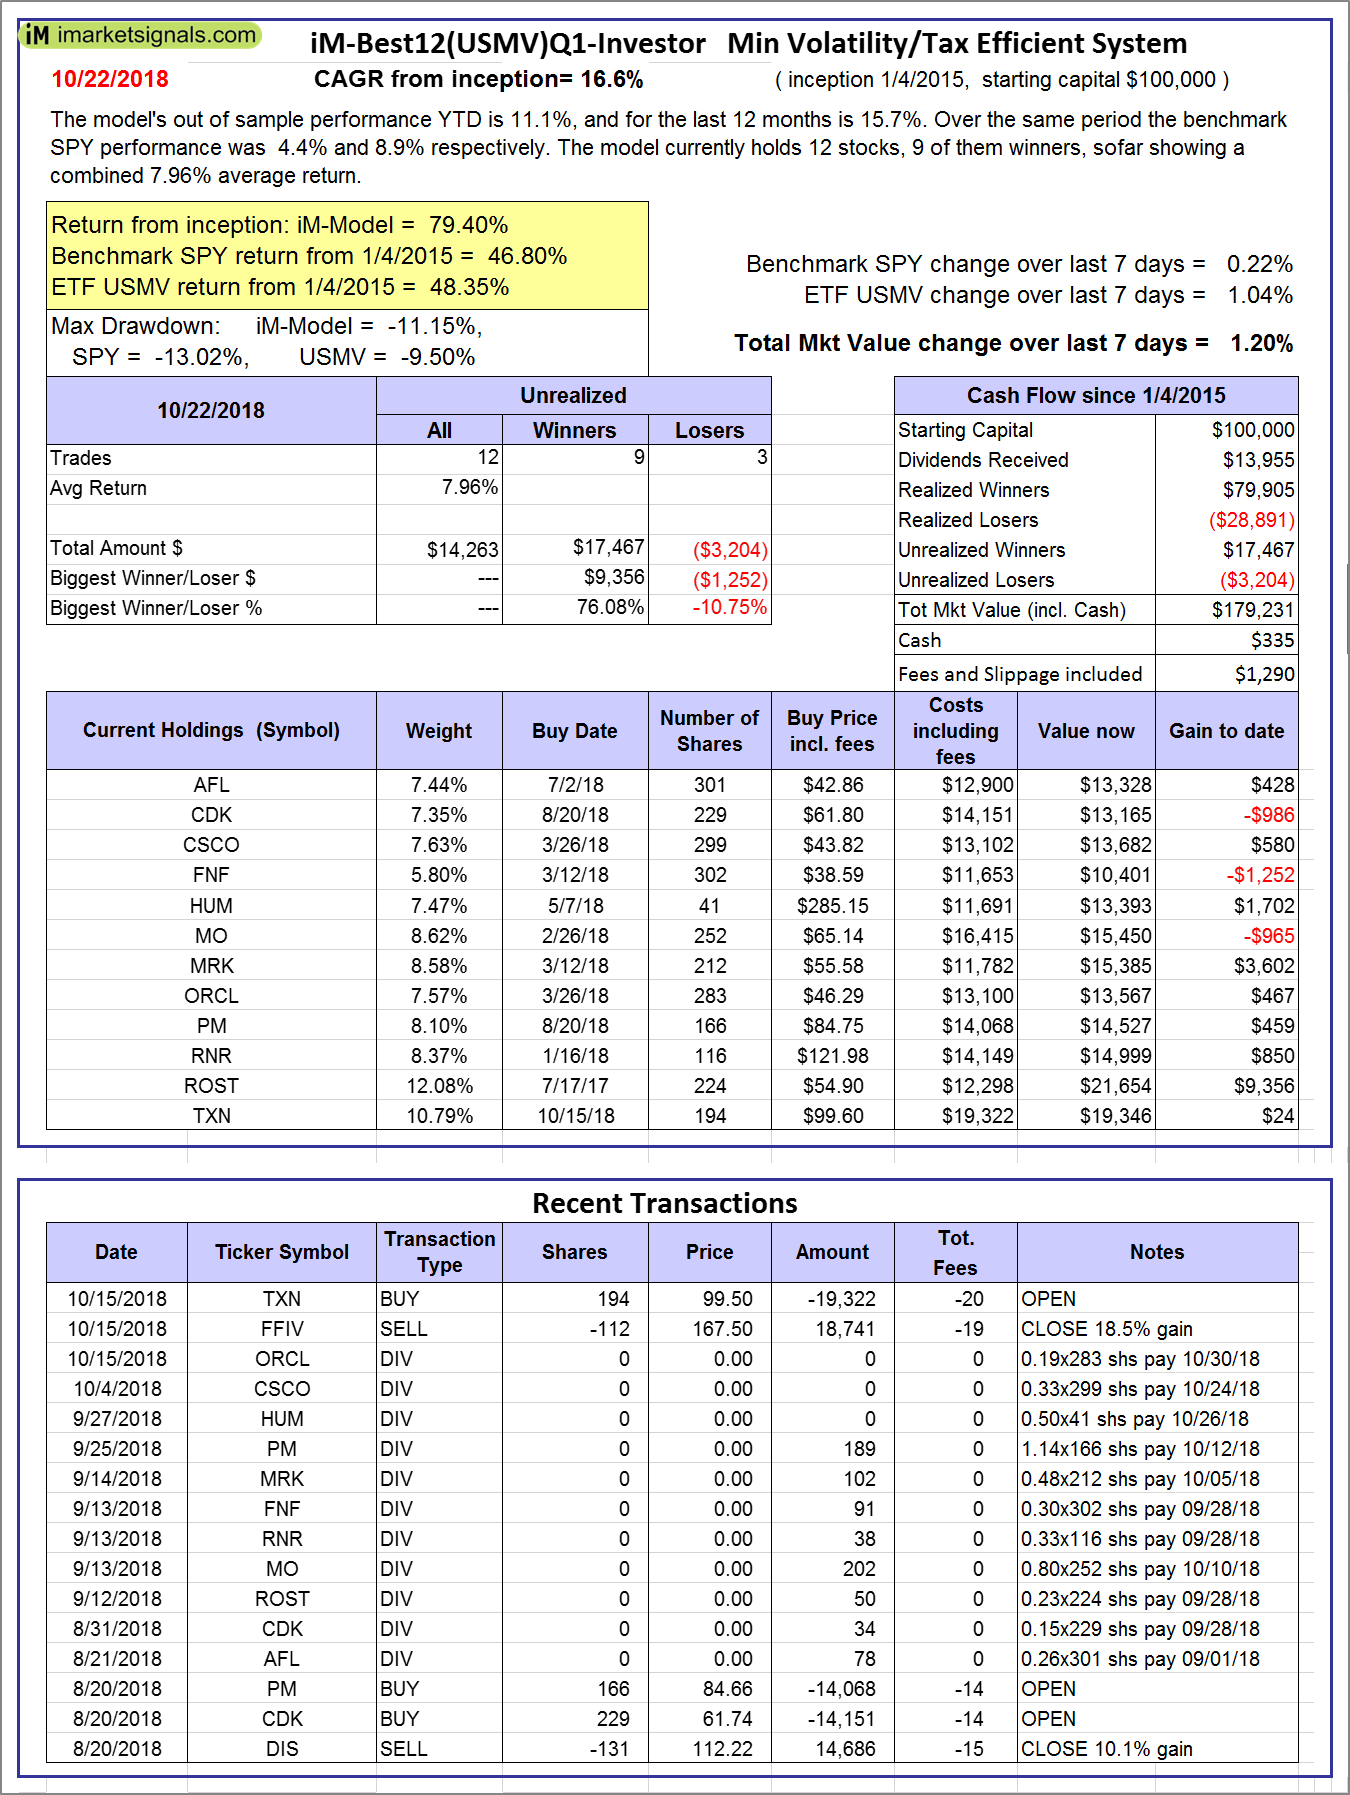 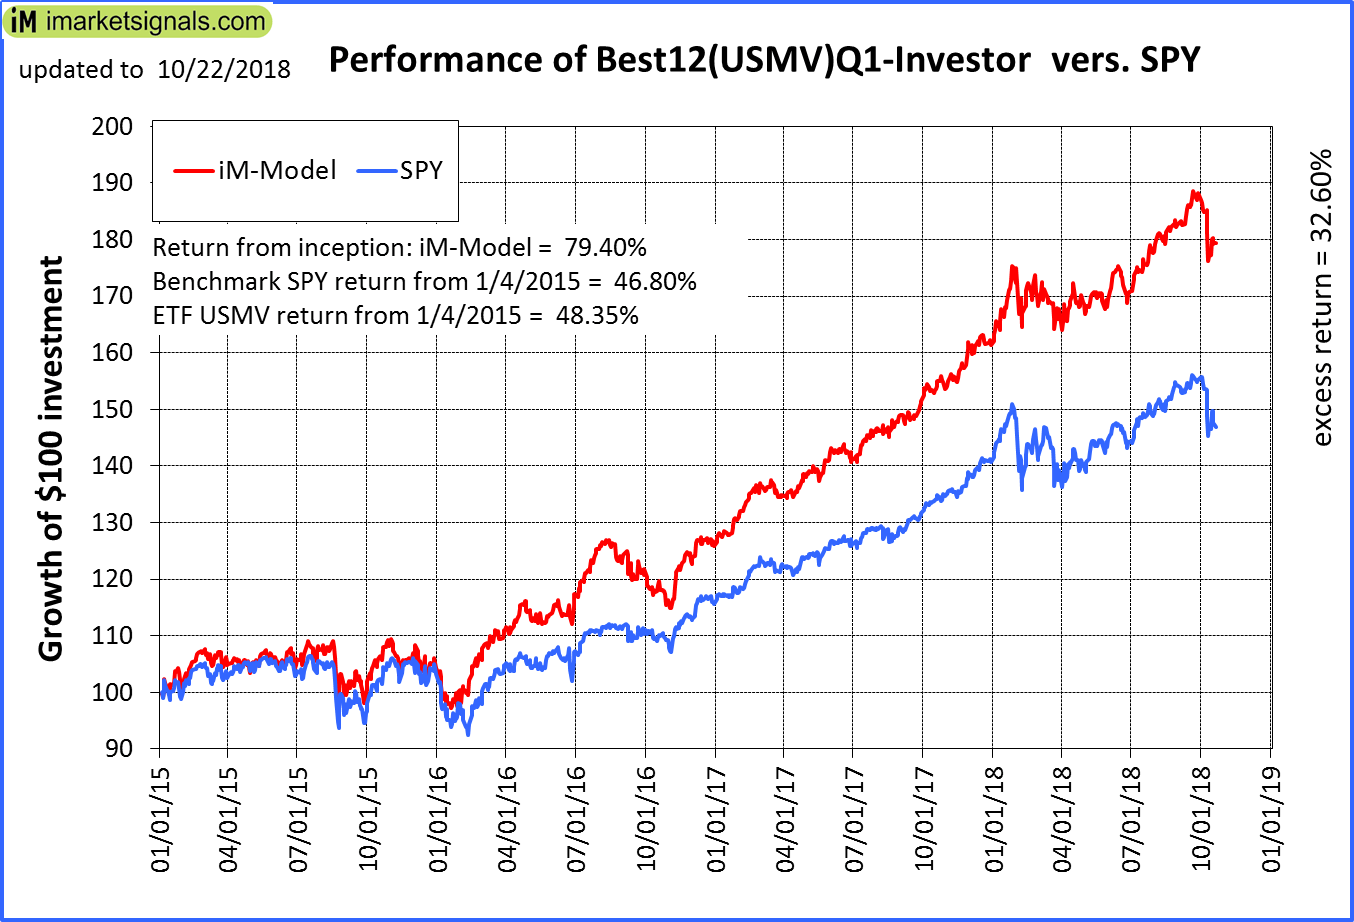 |
iM-Best12(USMV)Q1-Investor: The model’s out of sample performance YTD is 11.1%, and for the last 12 months is 15.7%. Over the same period the benchmark SPY performance was 4.4% and 8.9% respectively. Since inception, on 1/5/2015, the model gained 79.40% while the benchmark SPY gained 46.80% and the ETF USMV gained 48.35% over the same period. Over the previous week the market value of iM-Best12(USMV)Q1 gained 1.20% at a time when SPY gained 0.22%. A starting capital of $100,000 at inception on 1/5/2015 would have grown to $179,231 which includes $335 cash and excludes $1,290 spent on fees and slippage. |
 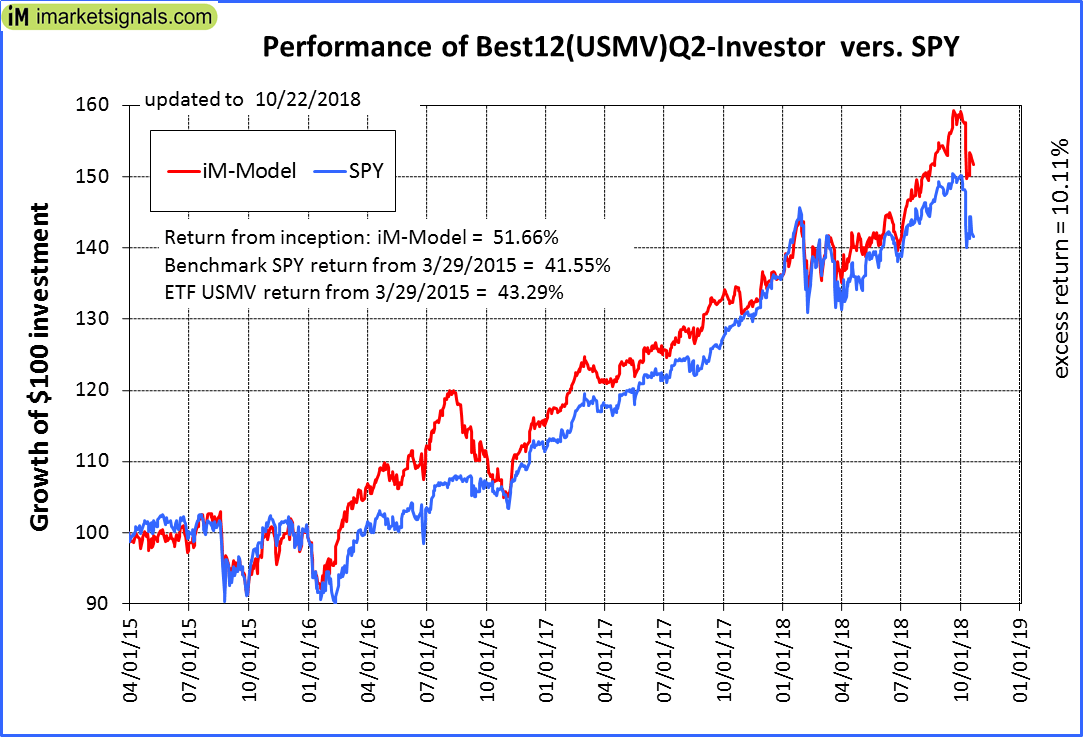 |
iM-Best12(USMV)Q2-Investor: The model’s out of sample performance YTD is 11.8%, and for the last 12 months is 12.7%. Over the same period the benchmark SPY performance was 4.4% and 8.9% respectively. Since inception, on 3/30/2015, the model gained 51.66% while the benchmark SPY gained 41.55% and the ETF USMV gained 43.29% over the same period. Over the previous week the market value of iM-Best12(USMV)Q2 gained 1.05% at a time when SPY gained 0.22%. A starting capital of $100,000 at inception on 3/30/2015 would have grown to $151,520 which includes $230 cash and excludes $1,125 spent on fees and slippage. |
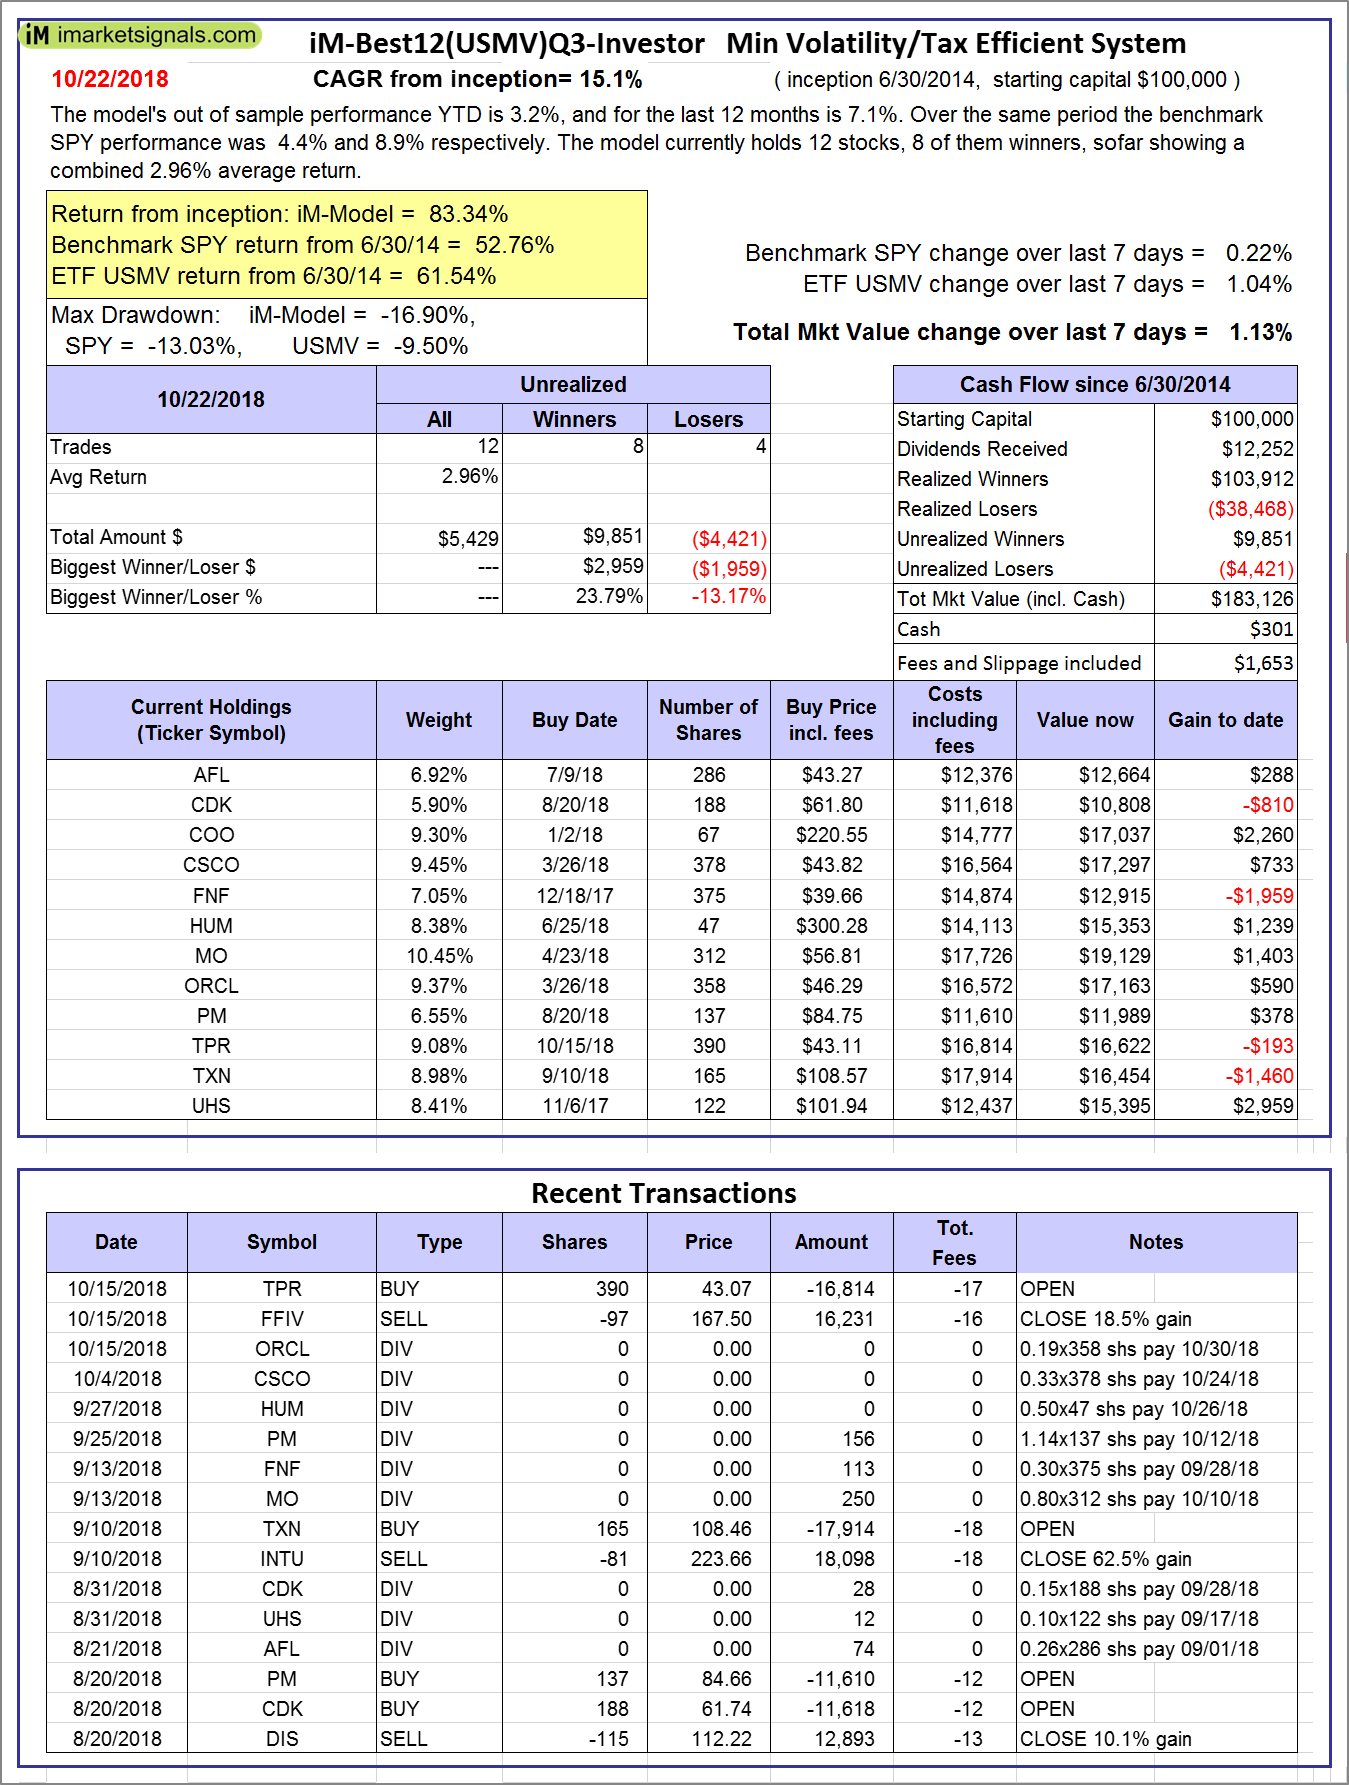 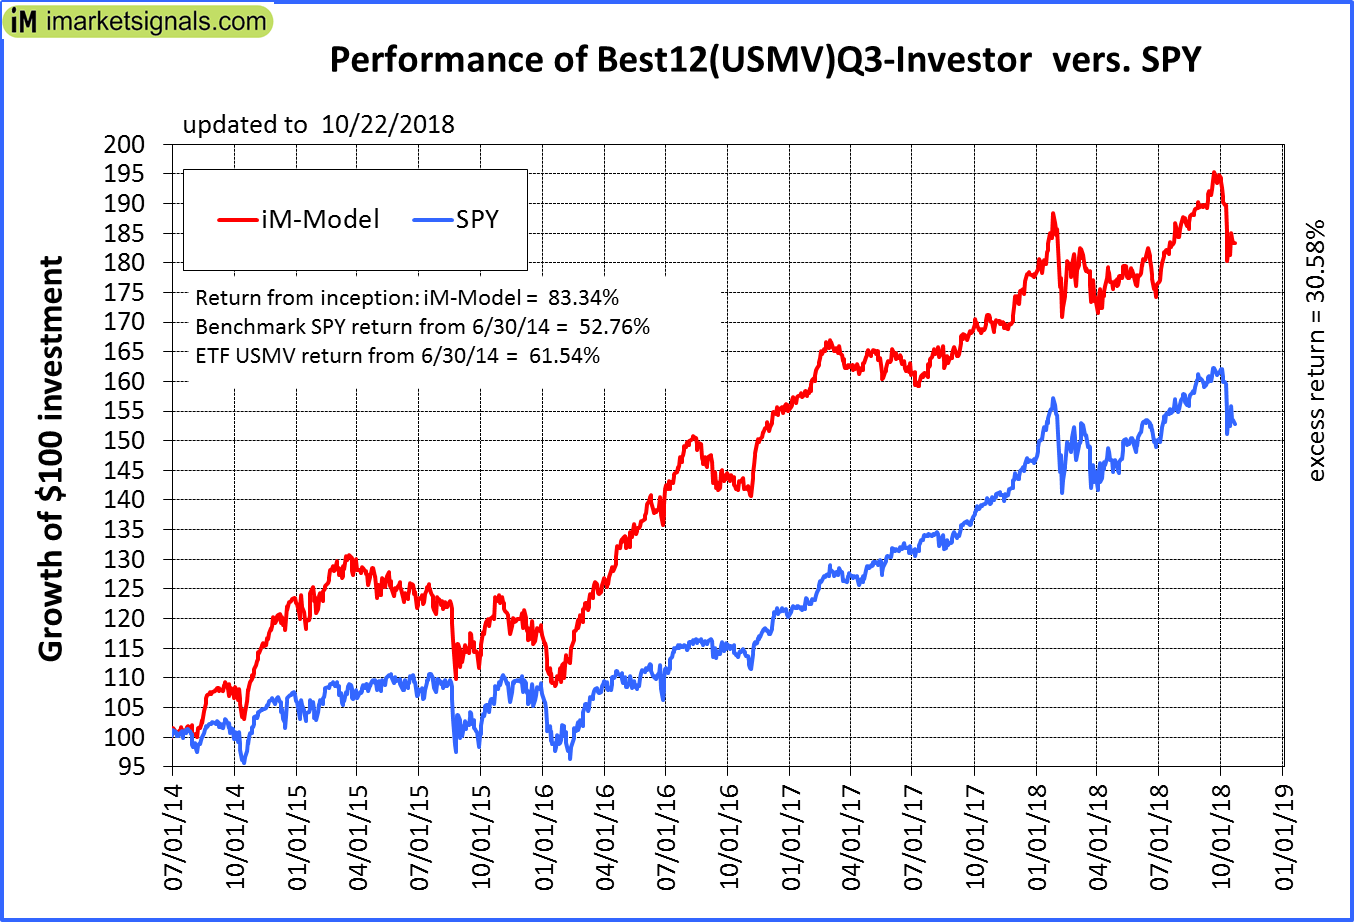 |
iM-Best12(USMV)Q3-Investor: The model’s out of sample performance YTD is 3.2%, and for the last 12 months is 7.1%. Over the same period the benchmark SPY performance was 4.4% and 8.9% respectively. Since inception, on 7/1/2014, the model gained 83.34% while the benchmark SPY gained 52.76% and the ETF USMV gained 61.54% over the same period. Over the previous week the market value of iM-Best12(USMV)Q3 gained 1.13% at a time when SPY gained 0.22%. A starting capital of $100,000 at inception on 7/1/2014 would have grown to $183,126 which includes $301 cash and excludes $1,653 spent on fees and slippage. |
 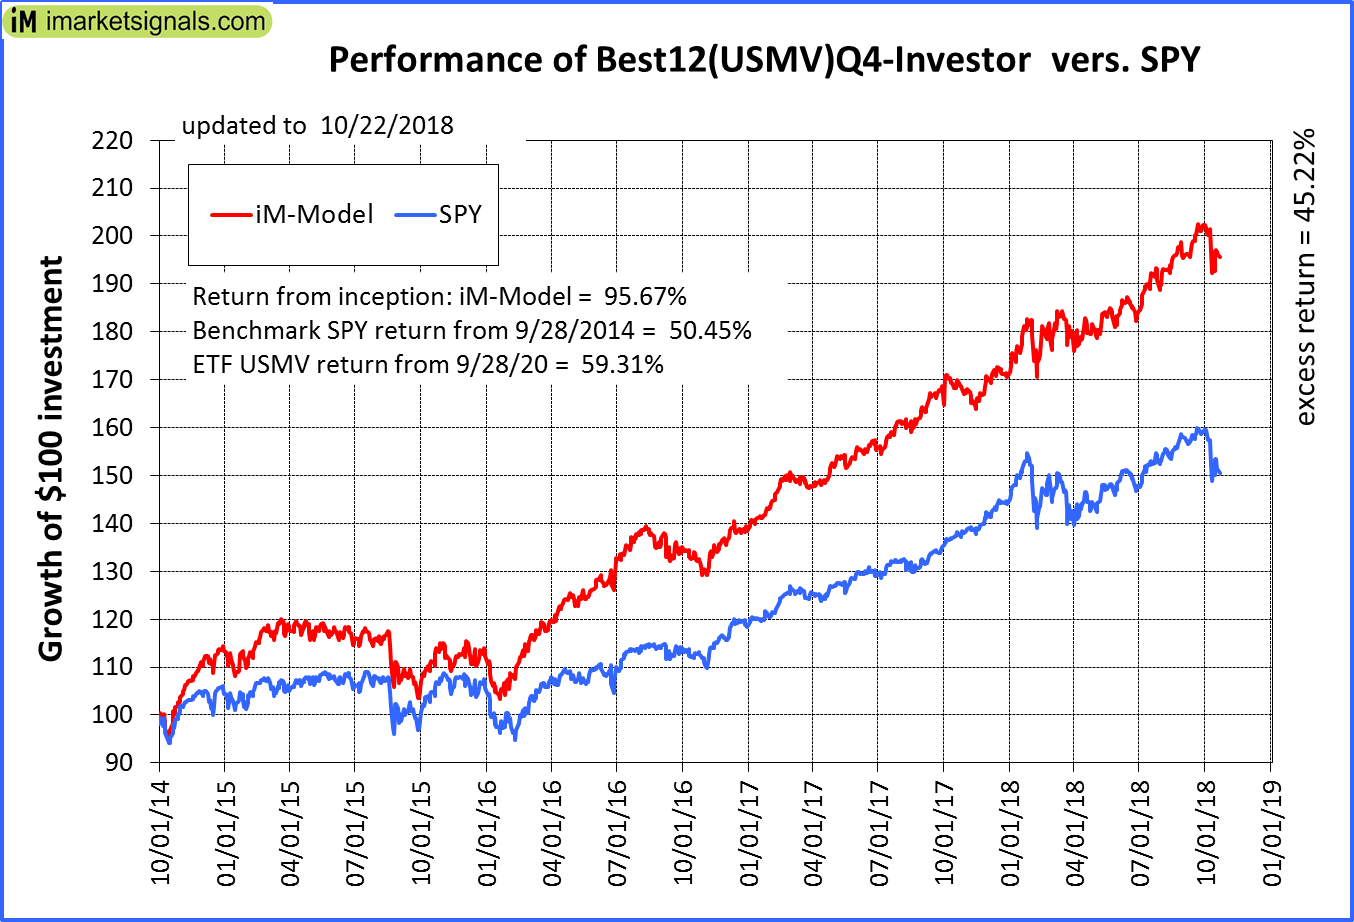 |
iM-Best12(USMV)Q4-Investor: Since inception, on 9/29/2014, the model gained 95.67% while the benchmark SPY gained 50.45% and the ETF USMV gained 59.31% over the same period. Over the previous week the market value of iM-Best12(USMV)Q4 gained 1.55% at a time when SPY gained 0.22%. A starting capital of $100,000 at inception on 9/29/2014 would have grown to $195,599 which includes $780 cash and excludes $1,435 spent on fees and slippage. |
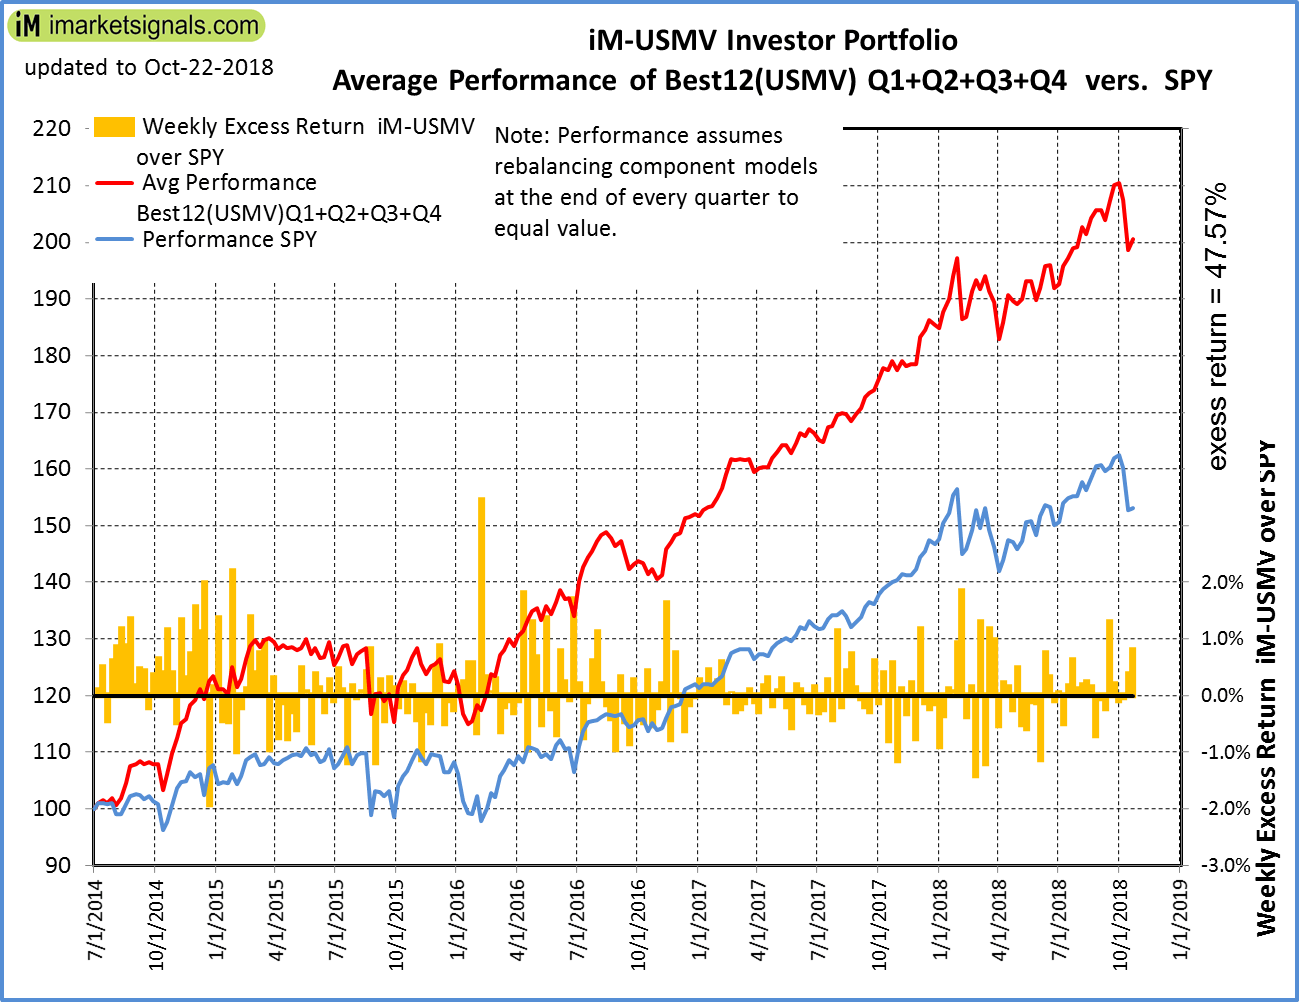 |
Average Performance of iM-Best12(USMV)Q1+Q2+Q3+Q4-Investor resulted in an excess return of 47.57% over SPY. (see iM-USMV Investor Portfolio) |
 |
iM-Best(Short): The model’s out of sample performance YTD is -5.1%, and for the last 12 months is -8.2%. Over the same period the benchmark SPY performance was 4.4% and 8.9% respectively. Over the previous week the market value of iM-Best(Short) gained 0.27% at a time when SPY gained 0.22%. Over the period 1/2/2009 to 10/22/2018 the starting capital of $100,000 would have grown to $86,602 which includes $86,602 cash and excludes $24,729 spent on fees and slippage. |
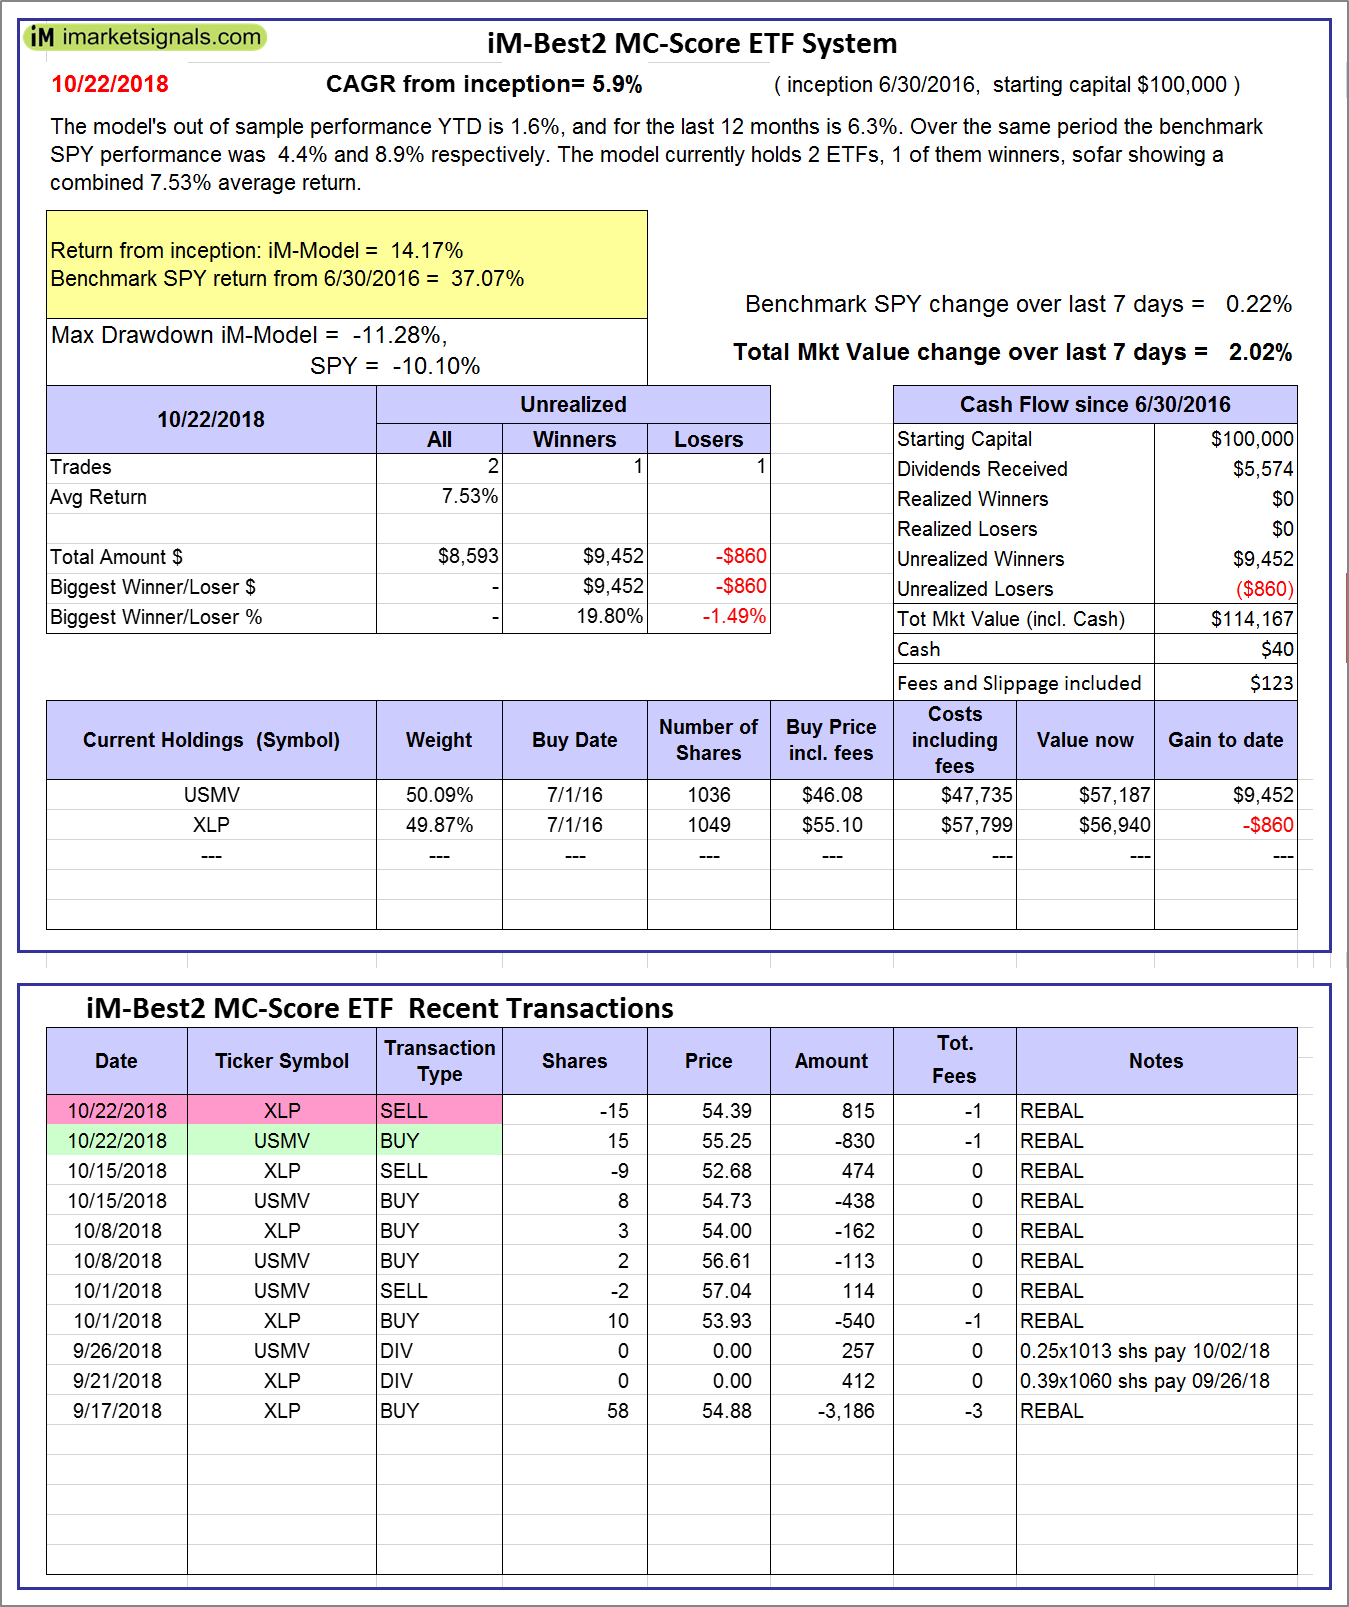 |
iM-Best2 MC-Score ETF System: The model’s out of sample performance YTD is 1.6%, and for the last 12 months is 6.3%. Over the same period the benchmark SPY performance was 4.4% and 8.9% respectively. Over the previous week the market value of the iM-Best2 MC-Score ETF System gained 2.02% at a time when SPY gained 0.22%. A starting capital of $100,000 at inception on 6/30/2016 would have grown to $114,167 which includes $40 cash and excludes $123 spent on fees and slippage. |
 |
iM-Best4 MC-Score Vanguard System: The model’s out of sample performance YTD is -0.6%, and for the last 12 months is 1.4%. Over the same period the benchmark SPY performance was 4.4% and 8.9% respectively. Over the previous week the market value of the iM-Best4 MC-Score Vanguard System gained 1.26% at a time when SPY gained 0.22%. A starting capital of $100,000 at inception on 6/30/2016 would have grown to $110,216 which includes $5,697 cash and excludes $00 spent on fees and slippage. |
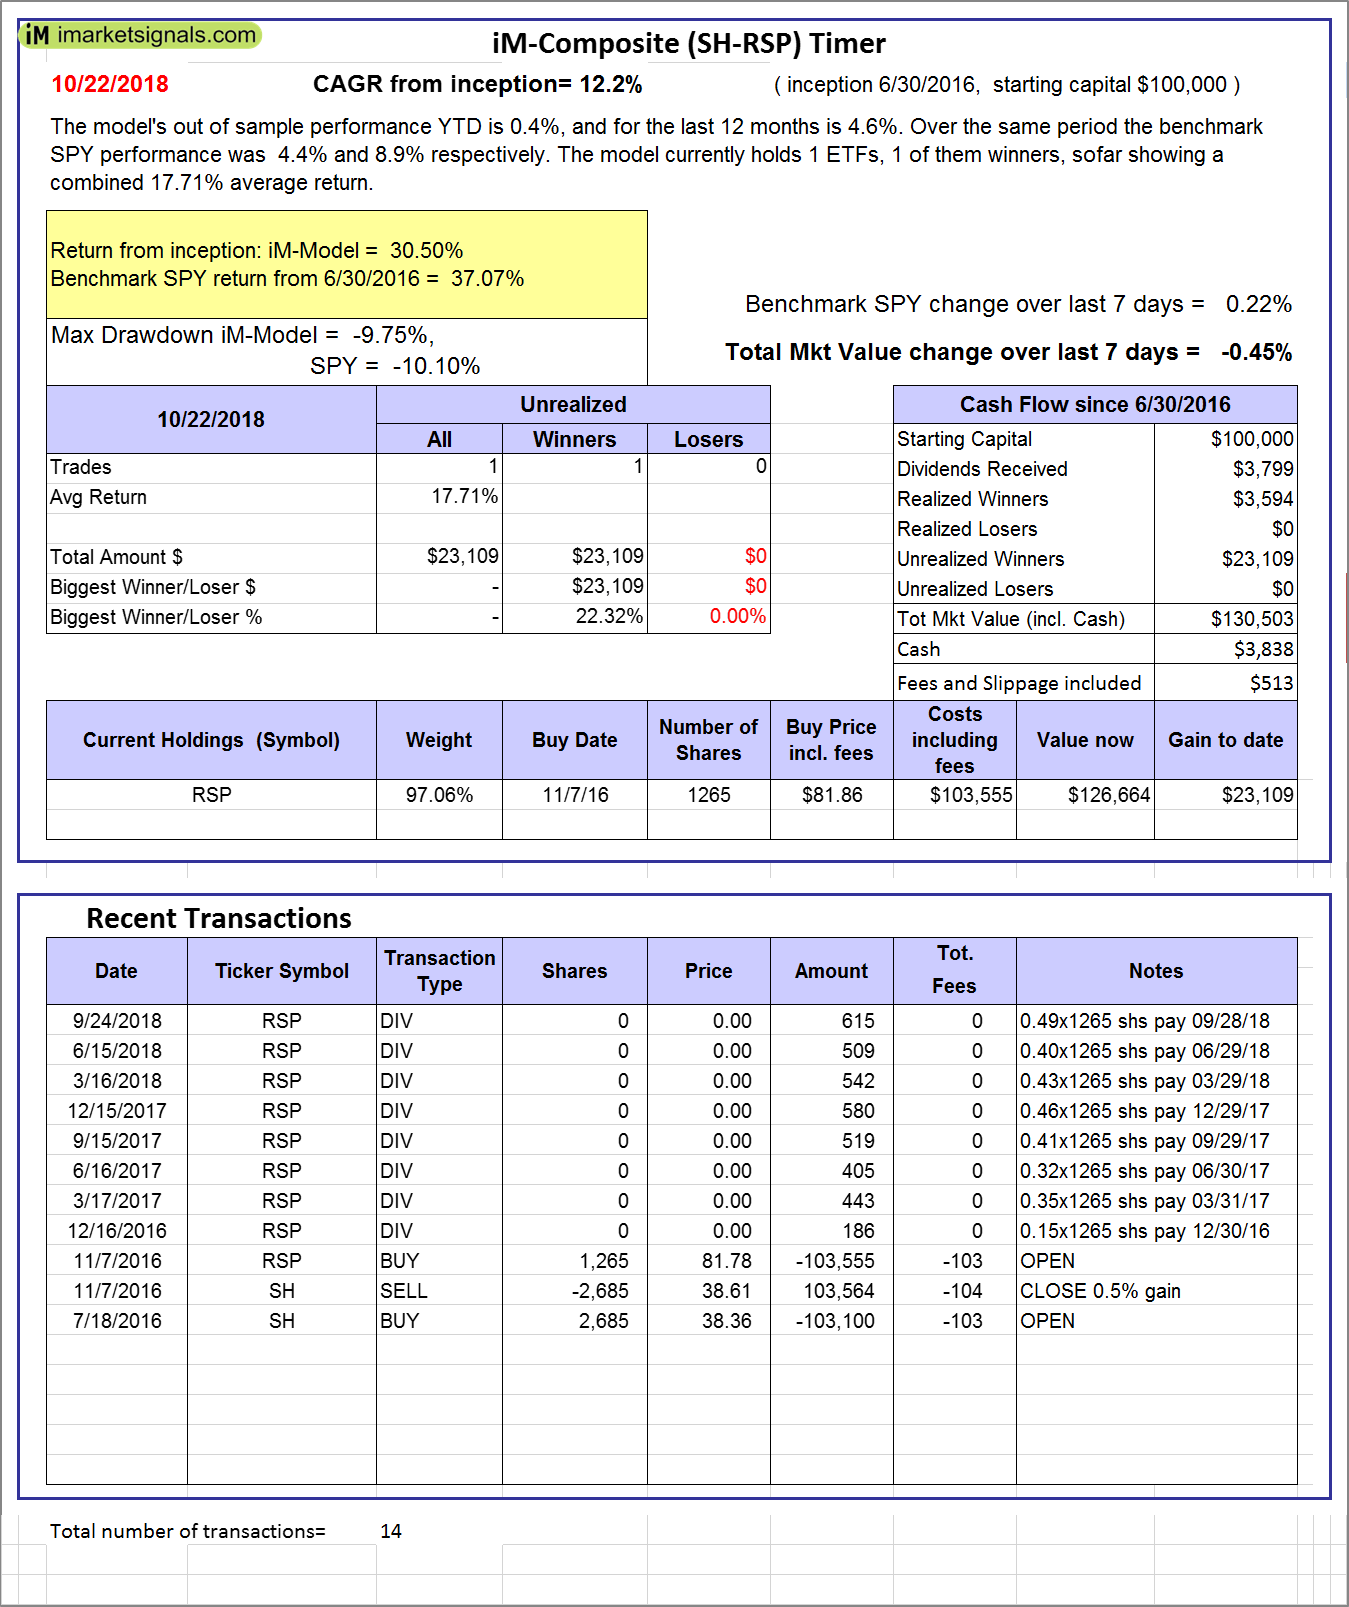 |
iM-Composite (SH-RSP) Timer: The model’s out of sample performance YTD is 0.4%, and for the last 12 months is 4.6%. Over the same period the benchmark SPY performance was 4.4% and 8.9% respectively. Over the previous week the market value of the iM-Composite (SH-RSP) Timer gained -0.45% at a time when SPY gained 0.22%. A starting capital of $100,000 at inception on 6/30/2016 would have grown to $130,503 which includes $3,838 cash and excludes $513 spent on fees and slippage. |
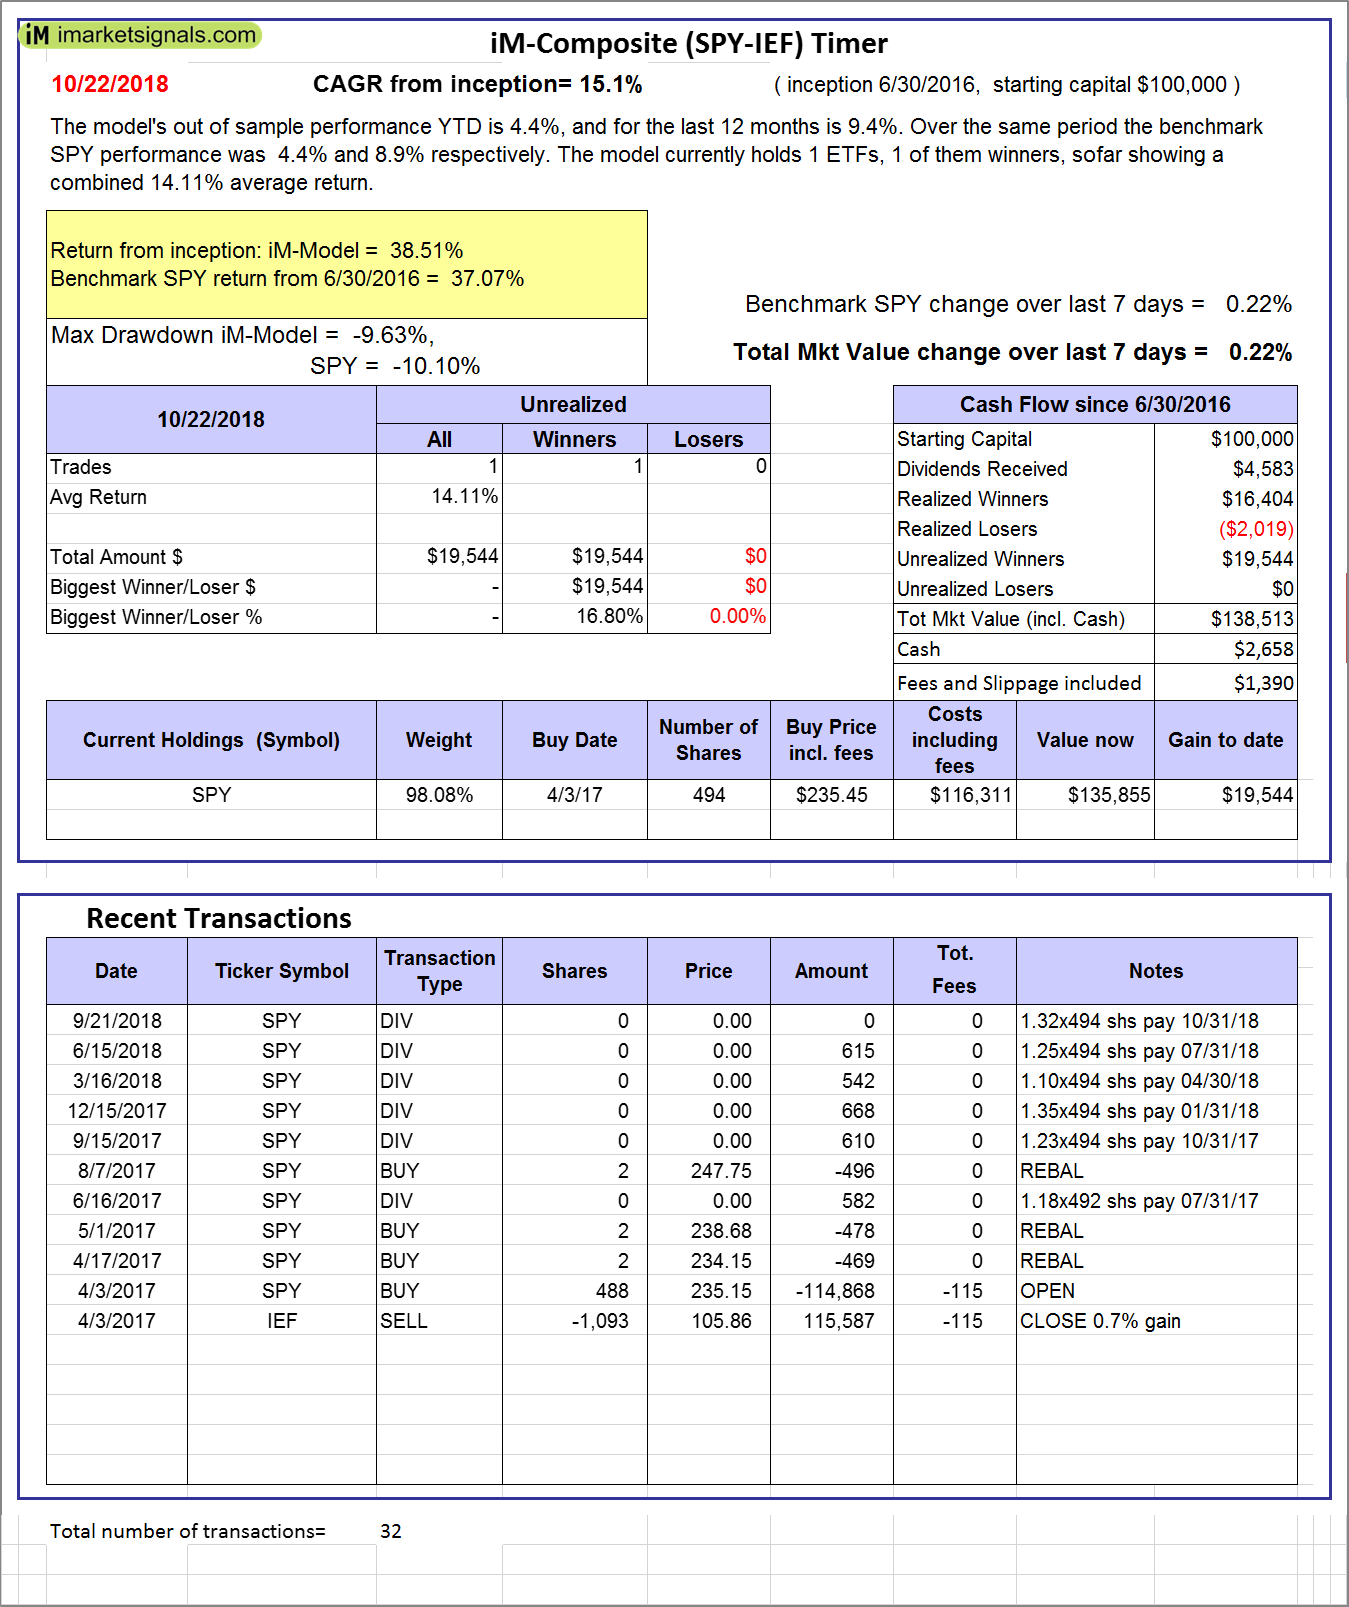 |
iM-Composite (SPY-IEF) Timer: The model’s out of sample performance YTD is 4.4%, and for the last 12 months is 9.4%. Over the same period the benchmark SPY performance was 4.4% and 8.9% respectively. Over the previous week the market value of the iM-Composite (SPY-IEF) Timer gained 0.22% at a time when SPY gained 0.22%. A starting capital of $100,000 at inception on 6/30/2016 would have grown to $138,513 which includes $2,658 cash and excludes $1,390 spent on fees and slippage. |
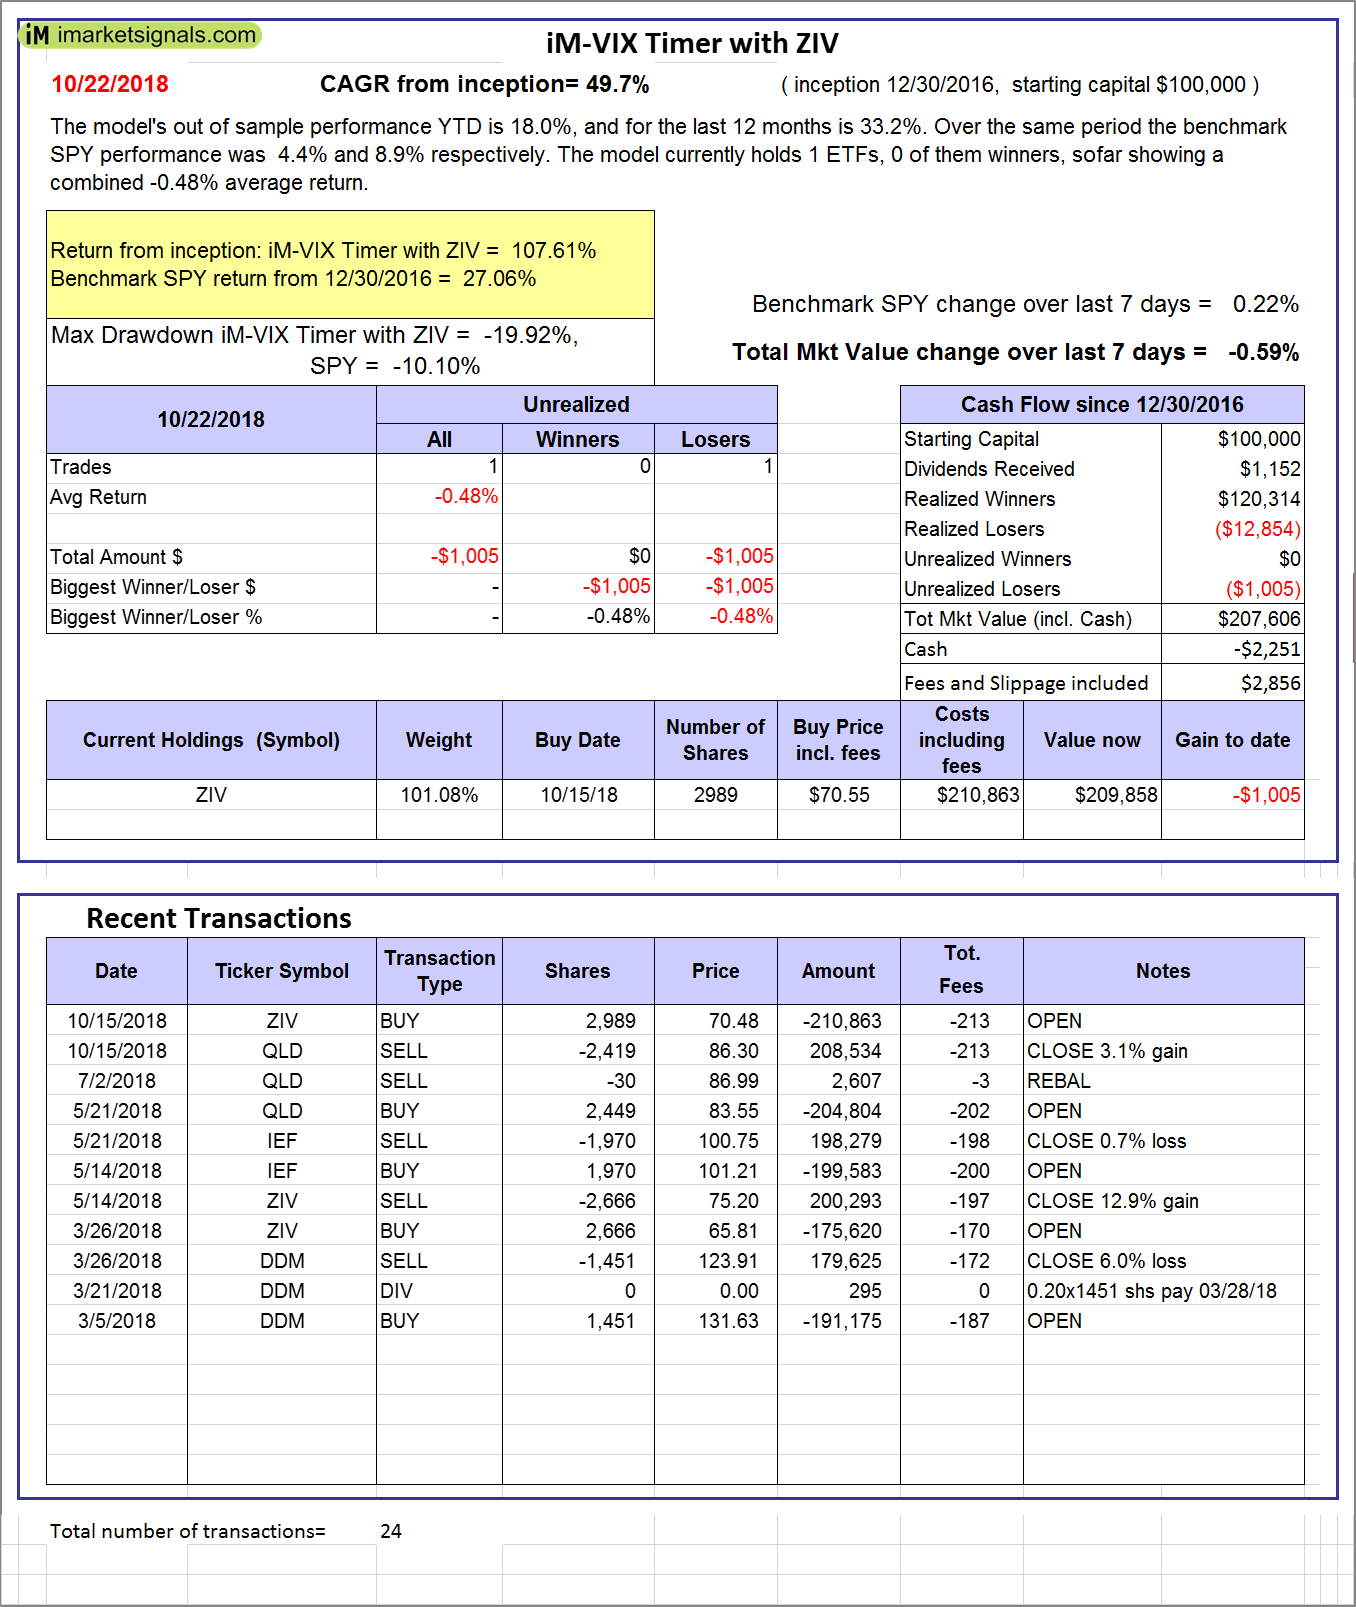 |
iM-VIX Timer with ZIV: The model’s out of sample performance YTD is 18.0%, and for the last 12 months is 33.2%. Over the same period the benchmark SPY performance was 4.4% and 8.9% respectively. Over the previous week the market value of the iM-VIX Timer with ZIV gained -0.59% at a time when SPY gained 0.22%. A starting capital of $100,000 at inception on 6/30/2016 would have grown to $207,606 which includes -$2,251 cash and excludes $2,856 spent on fees and slippage. |
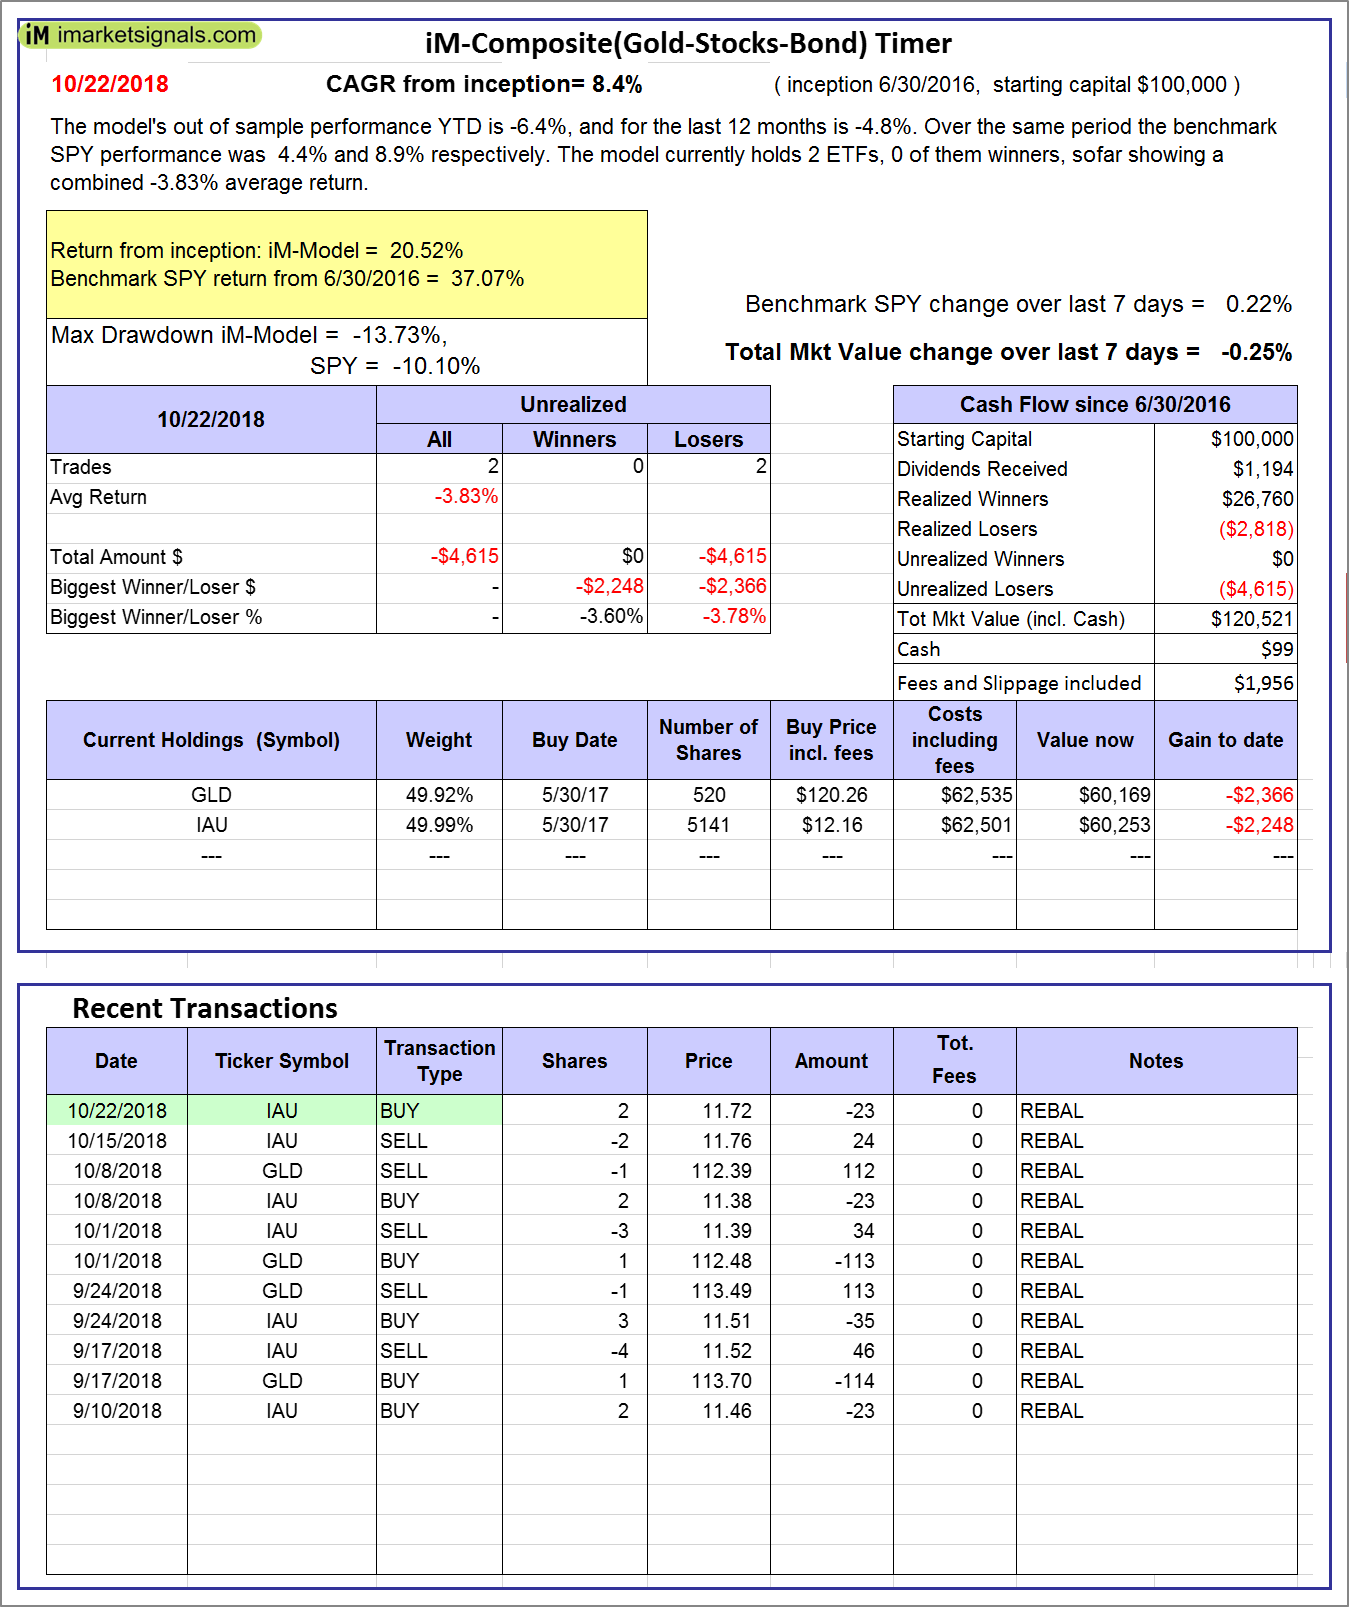 |
iM-Composite(Gold-Stocks-Bond) Timer: The model’s out of sample performance YTD is -6.4%, and for the last 12 months is -4.8%. Over the same period the benchmark SPY performance was 4.4% and 8.9% respectively. Over the previous week the market value of the iM-Composite(Gold-Stocks-Bond) Timer gained -0.25% at a time when SPY gained 0.22%. A starting capital of $100,000 at inception on 6/30/2016 would have grown to $120,521 which includes $99 cash and excludes $1,956 spent on fees and slippage. |
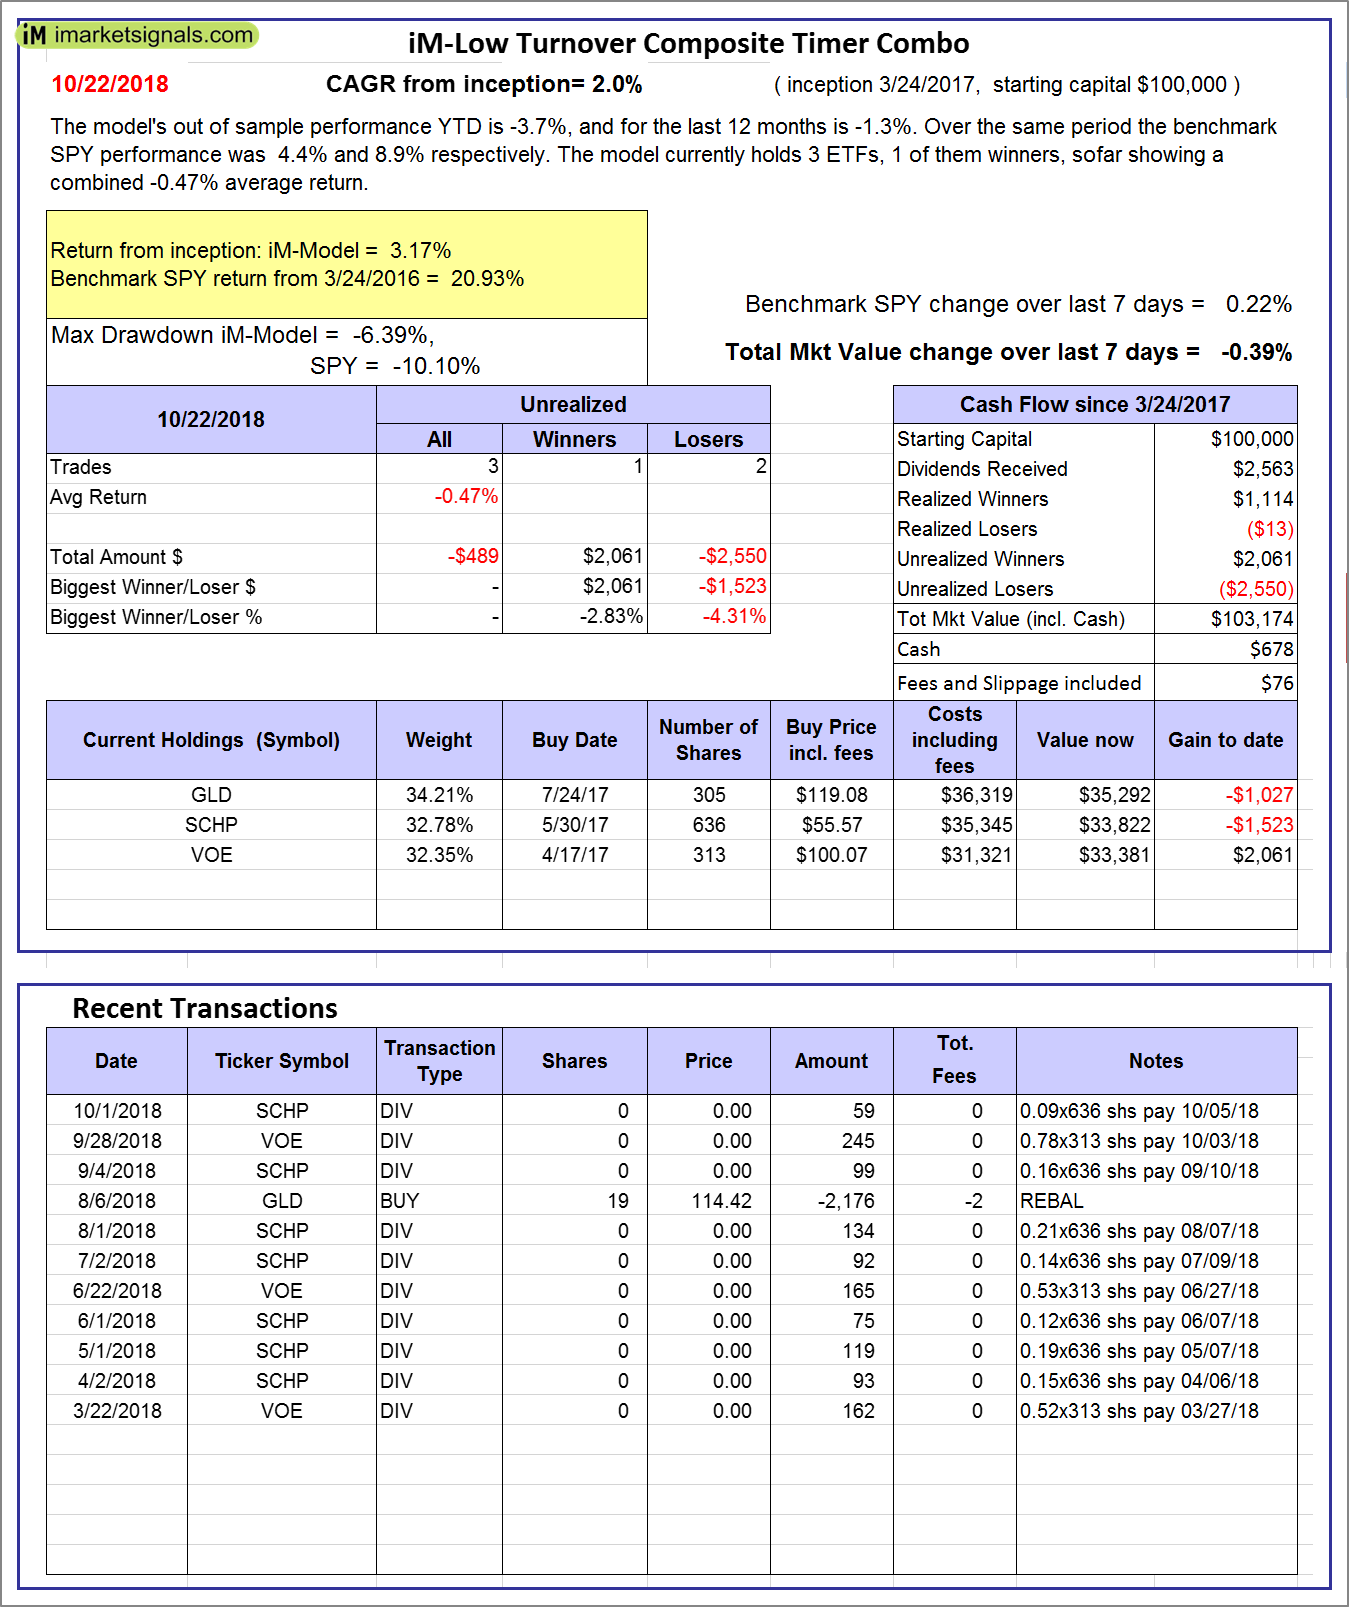 |
iM-Low Turnover Composite Timer Combo: The model’s out of sample performance YTD is -3.7%, and for the last 12 months is -1.3%. Over the same period the benchmark SPY performance was 4.4% and 8.9% respectively. Over the previous week the market value of the iM-Low Turnover Composite Timer Combo gained -0.39% at a time when SPY gained 0.22%. A starting capital of $100,000 at inception on 3/24/27 would have grown to $103,174 which includes $678 cash and excludes $76 spent on fees and slippage. |
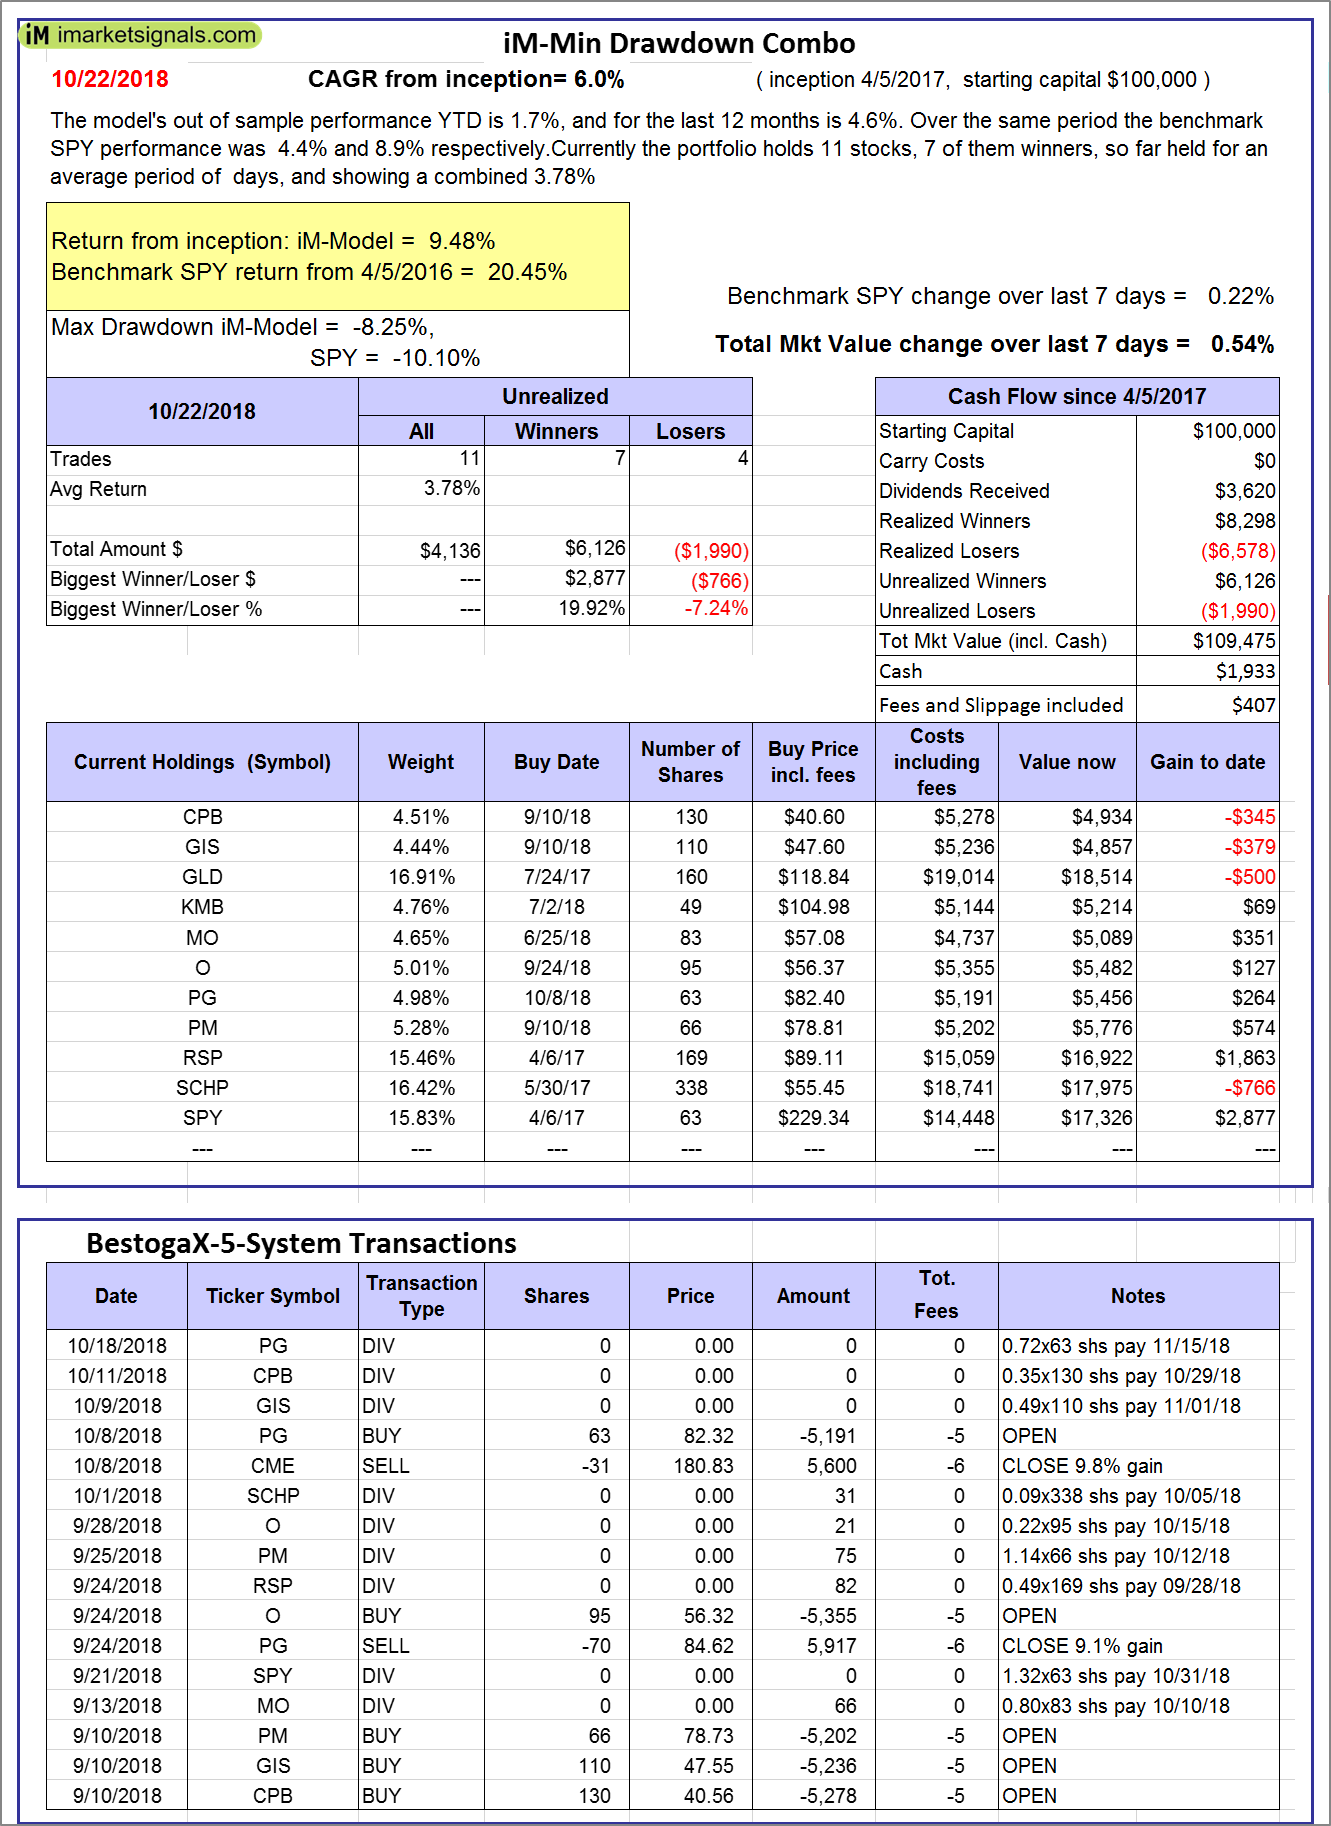 |
iM-Min Drawdown Combo: The model’s out of sample performance YTD is 1.7%, and for the last 12 months is 4.6%. Over the same period the benchmark SPY performance was 4.4% and 8.9% respectively. Over the previous week the market value of the iM-Min Drawdown Combo gained 0.54% at a time when SPY gained 0.22%. A starting capital of $100,000 at inception on 4/5/2017 would have grown to $109,475 which includes $1,933 cash and excludes $407 spent on fees and slippage. |
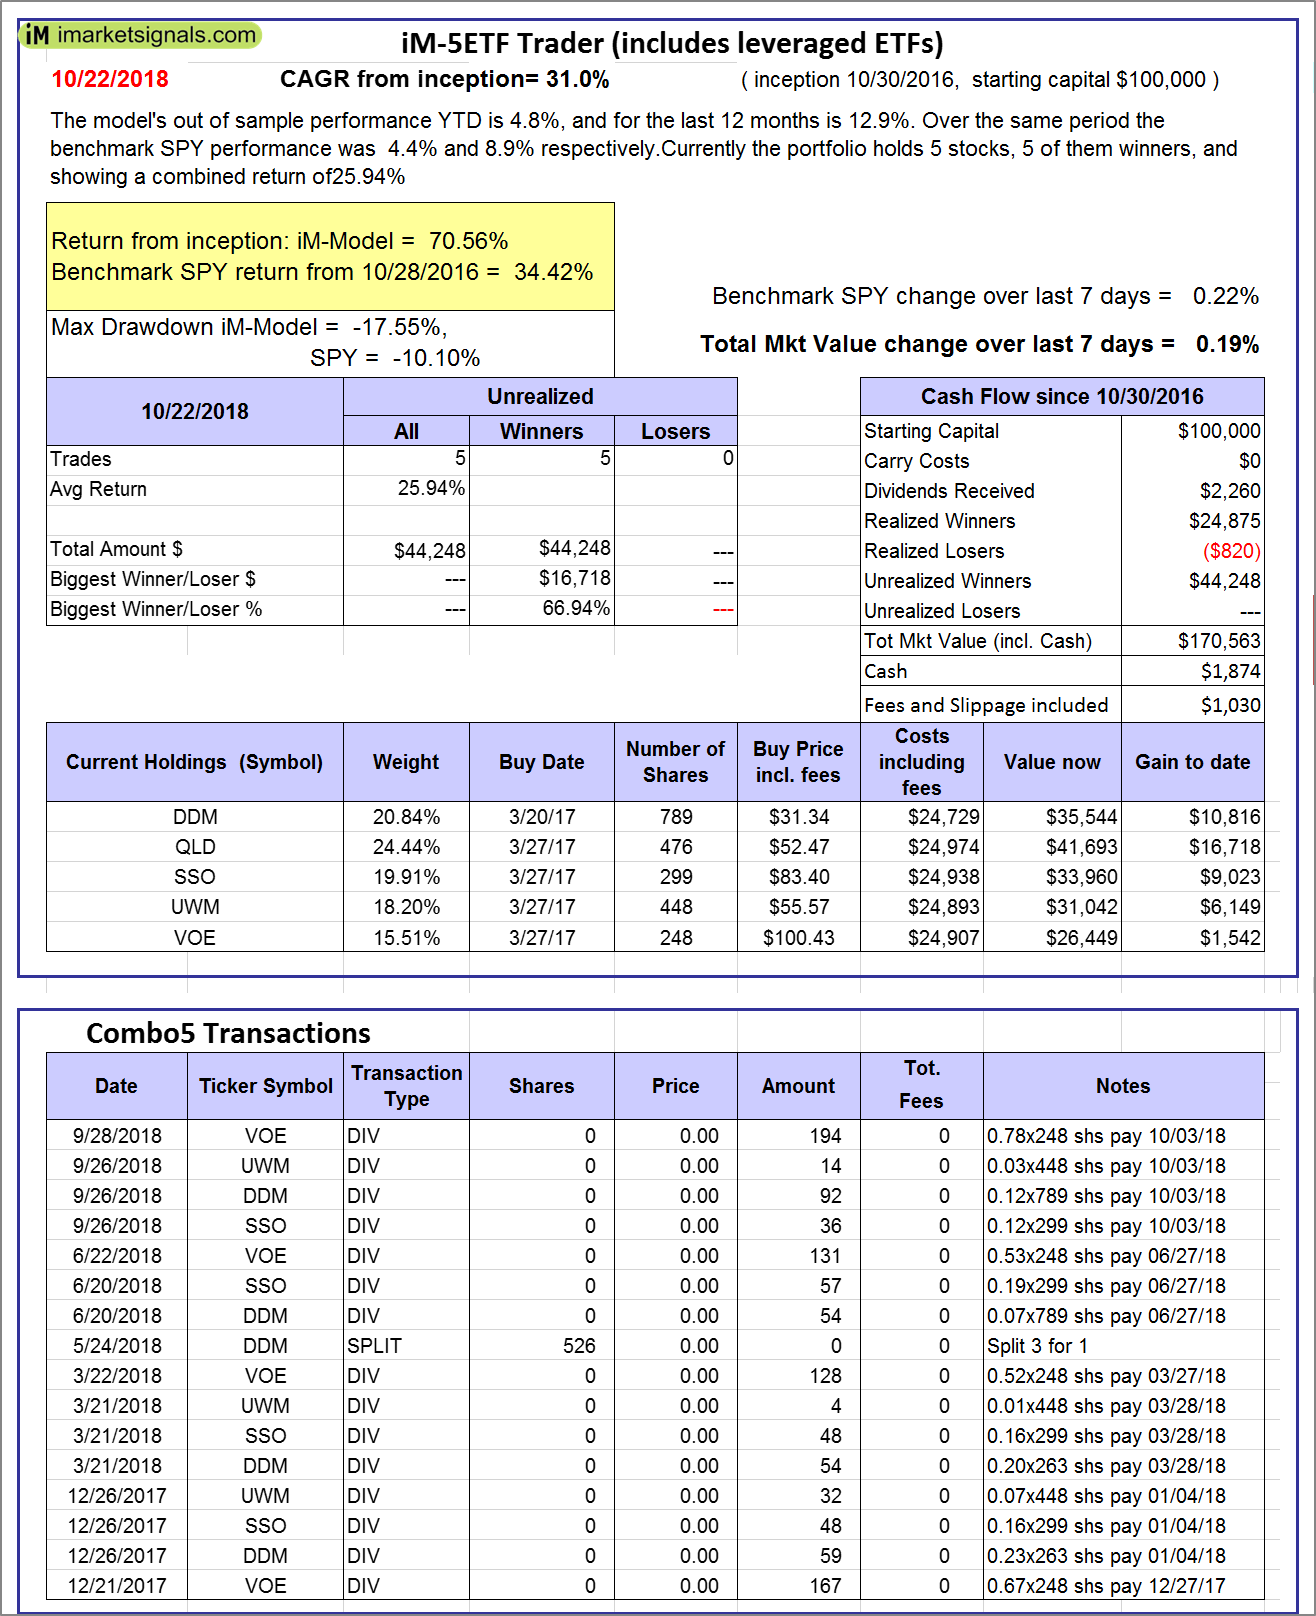 |
iM-5ETF Trader (includes leveraged ETFs): The model’s out of sample performance YTD is 4.8%, and for the last 12 months is 12.9%. Over the same period the benchmark SPY performance was 4.4% and 8.9% respectively. Over the previous week the market value of the iM-5ETF Trader (includes leveraged ETFs) gained 0.19% at a time when SPY gained 0.22%. A starting capital of $100,000 at inception on 10/30/2016 would have grown to $170,563 which includes $1,874 cash and excludes $1,030 spent on fees and slippage. |
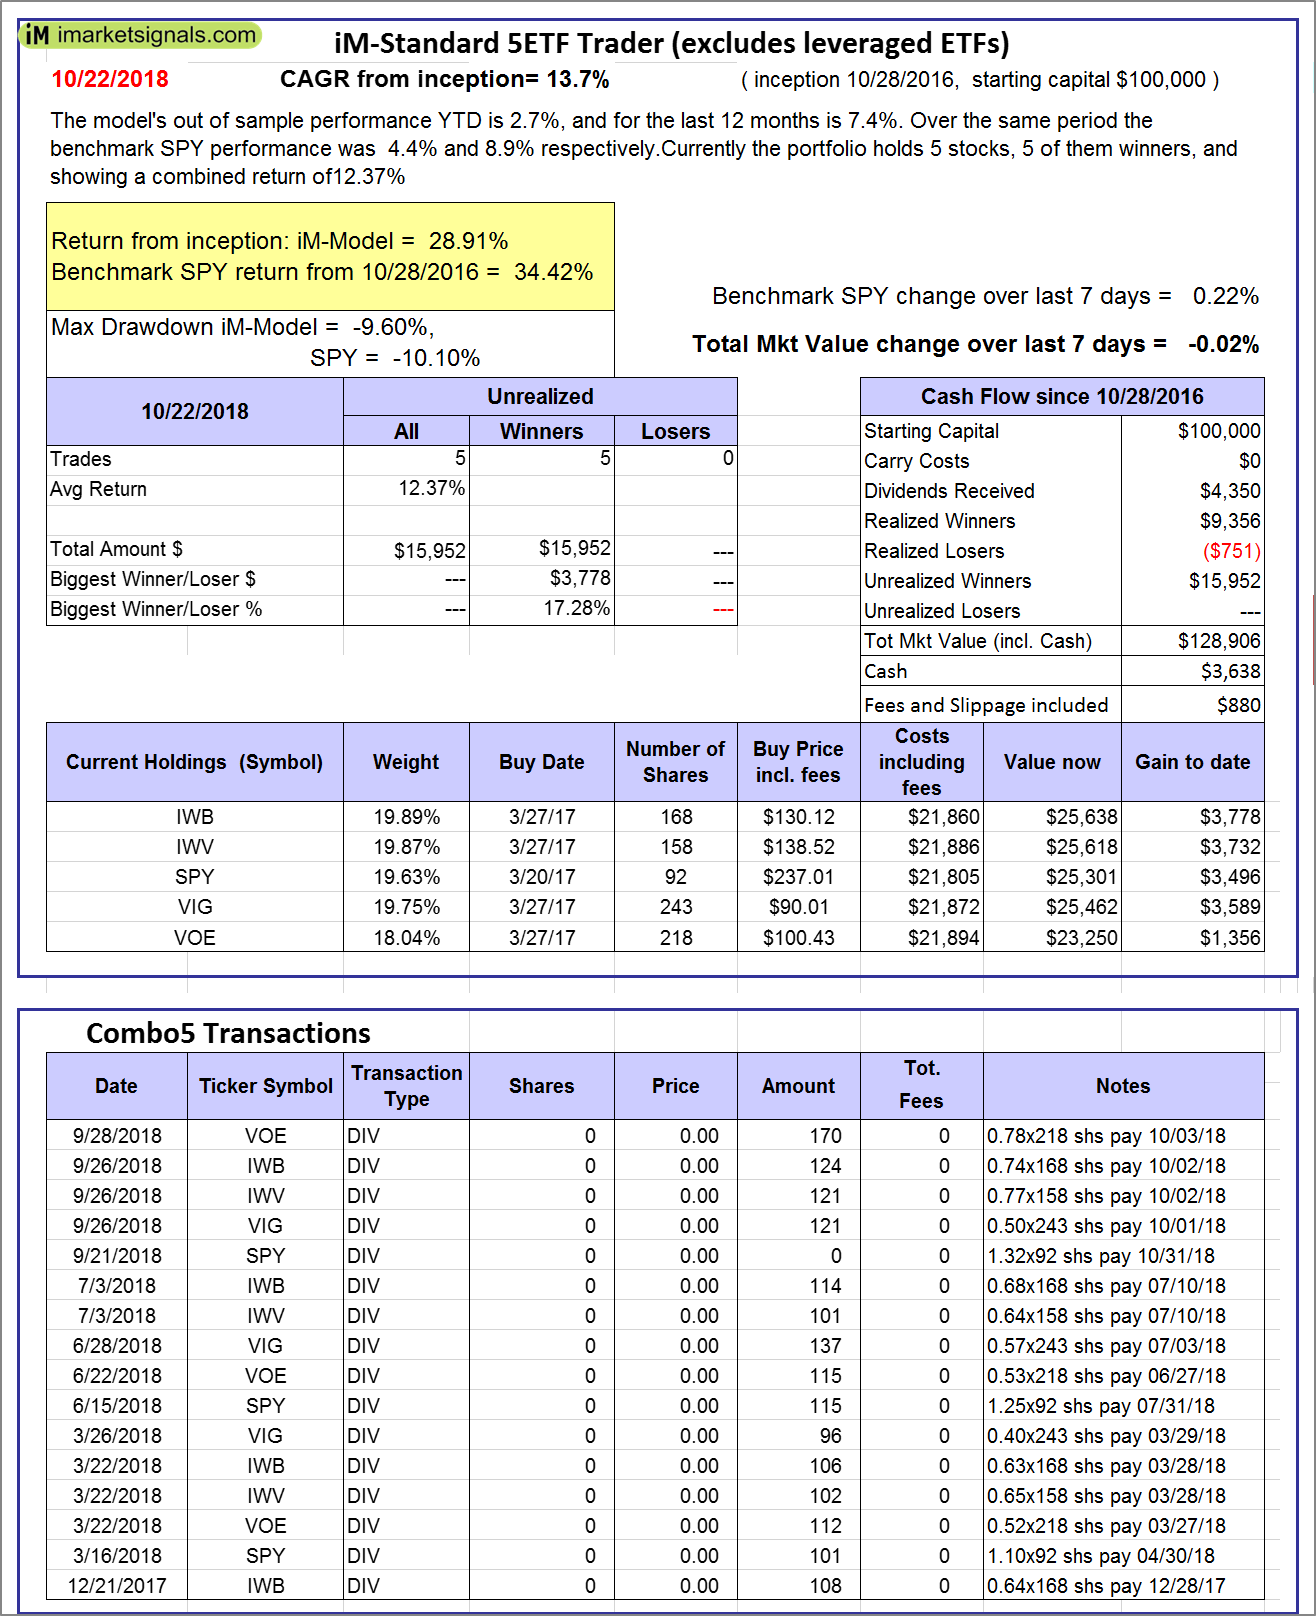 |
iM-Standard 5ETF Trader (excludes leveraged ETFs): The model’s out of sample performance YTD is 2.7%, and for the last 12 months is 7.4%. Over the same period the benchmark SPY performance was 4.4% and 8.9% respectively. Over the previous week the market value of the iM-Standard 5ETF Trader (excludes leveraged ETFs) gained -0.02% at a time when SPY gained 0.22%. A starting capital of $100,000 at inception on 10/30/2016 would have grown to $128,906 which includes $3,638 cash and excludes $880 spent on fees and slippage. |
iM-Best Reports – 10/22/2018
Posted in pmp SPY-SH
Leave a Reply
You must be logged in to post a comment.