
  |
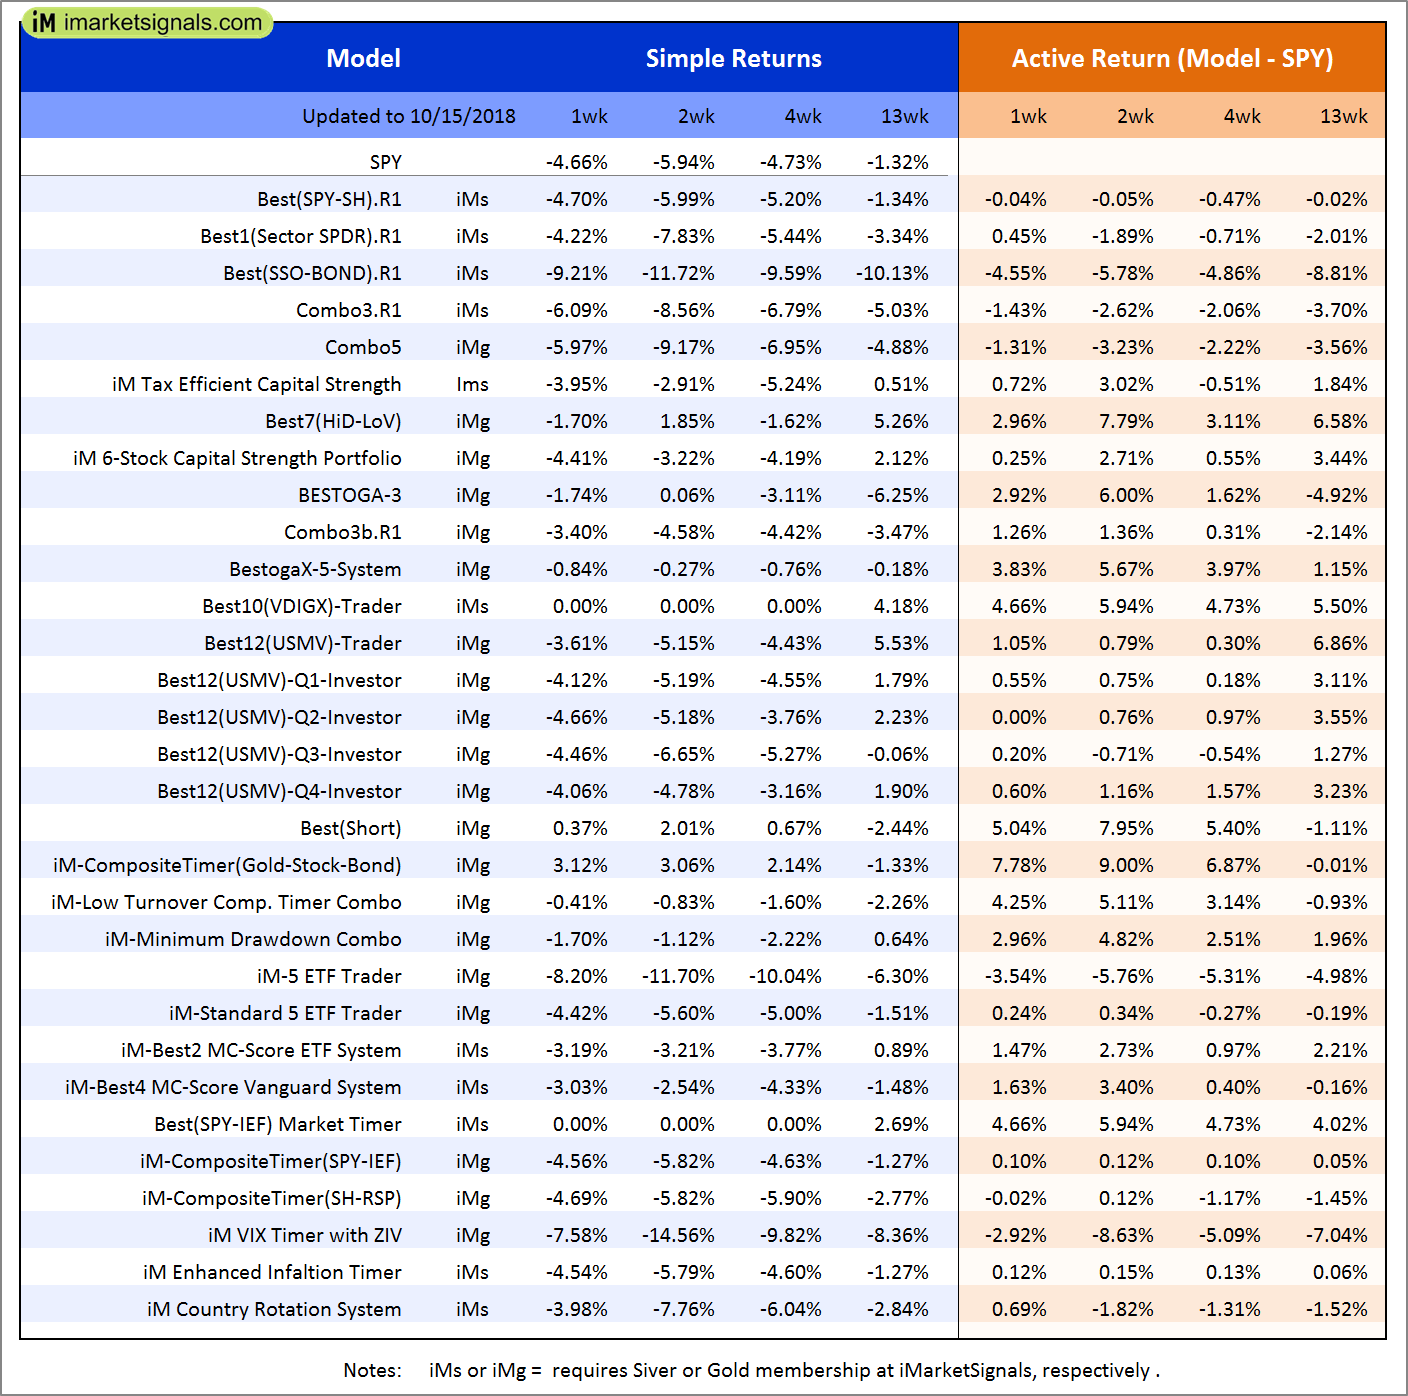
Out of sample performance summary of our models for the past 1, 2, 4 and 13 week periods. The active active return indicates how the models over- or underperformed the benchmark ETF SPY. Also the YTD, and the 1-, 3-, 5- and 10-year annualized returns are shown in the second table |
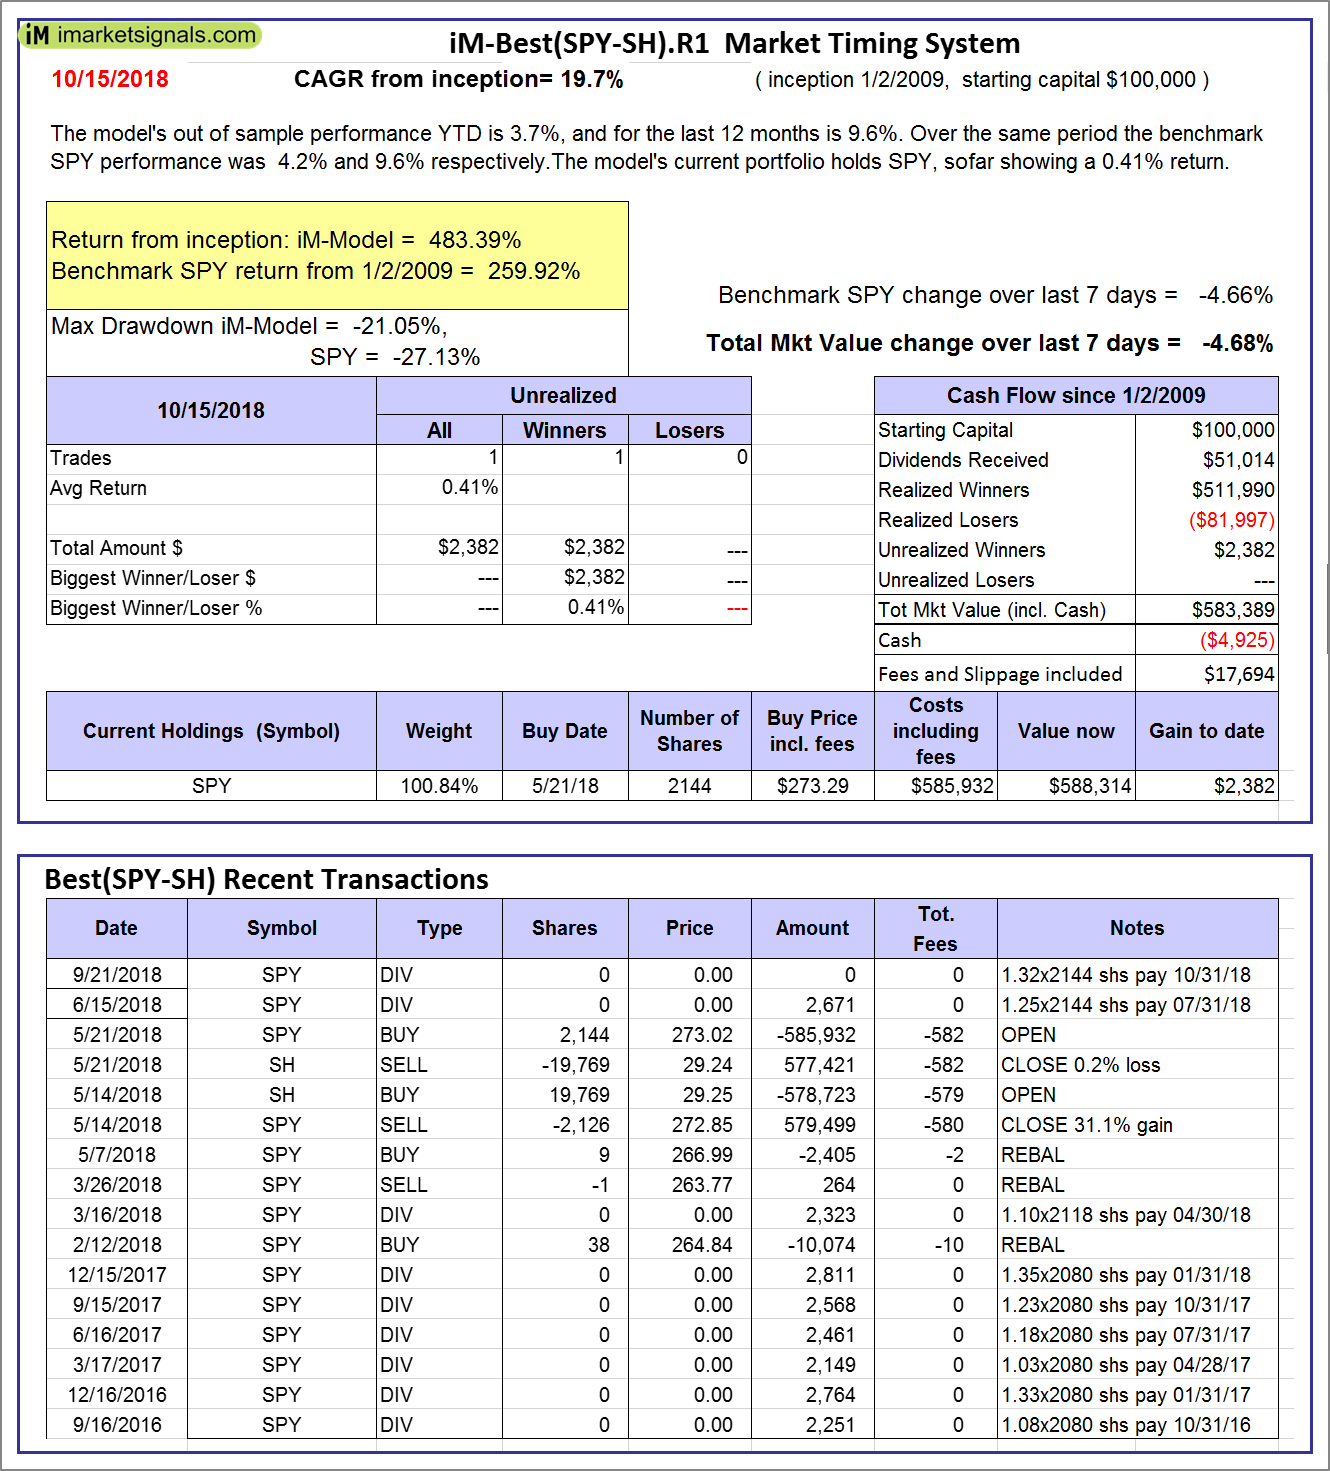 |
iM-Best(SPY-SH).R1: The model’s out of sample performance YTD is 3.7%, and for the last 12 months is 9.6%. Over the same period the benchmark SPY performance was 4.2% and 9.6% respectively. Over the previous week the market value of Best(SPY-SH) gained -4.68% at a time when SPY gained -4.66%. A starting capital of $100,000 at inception on 1/2/2009 would have grown to $583,389 which includes -$4,925 cash and excludes $17,694 spent on fees and slippage. |
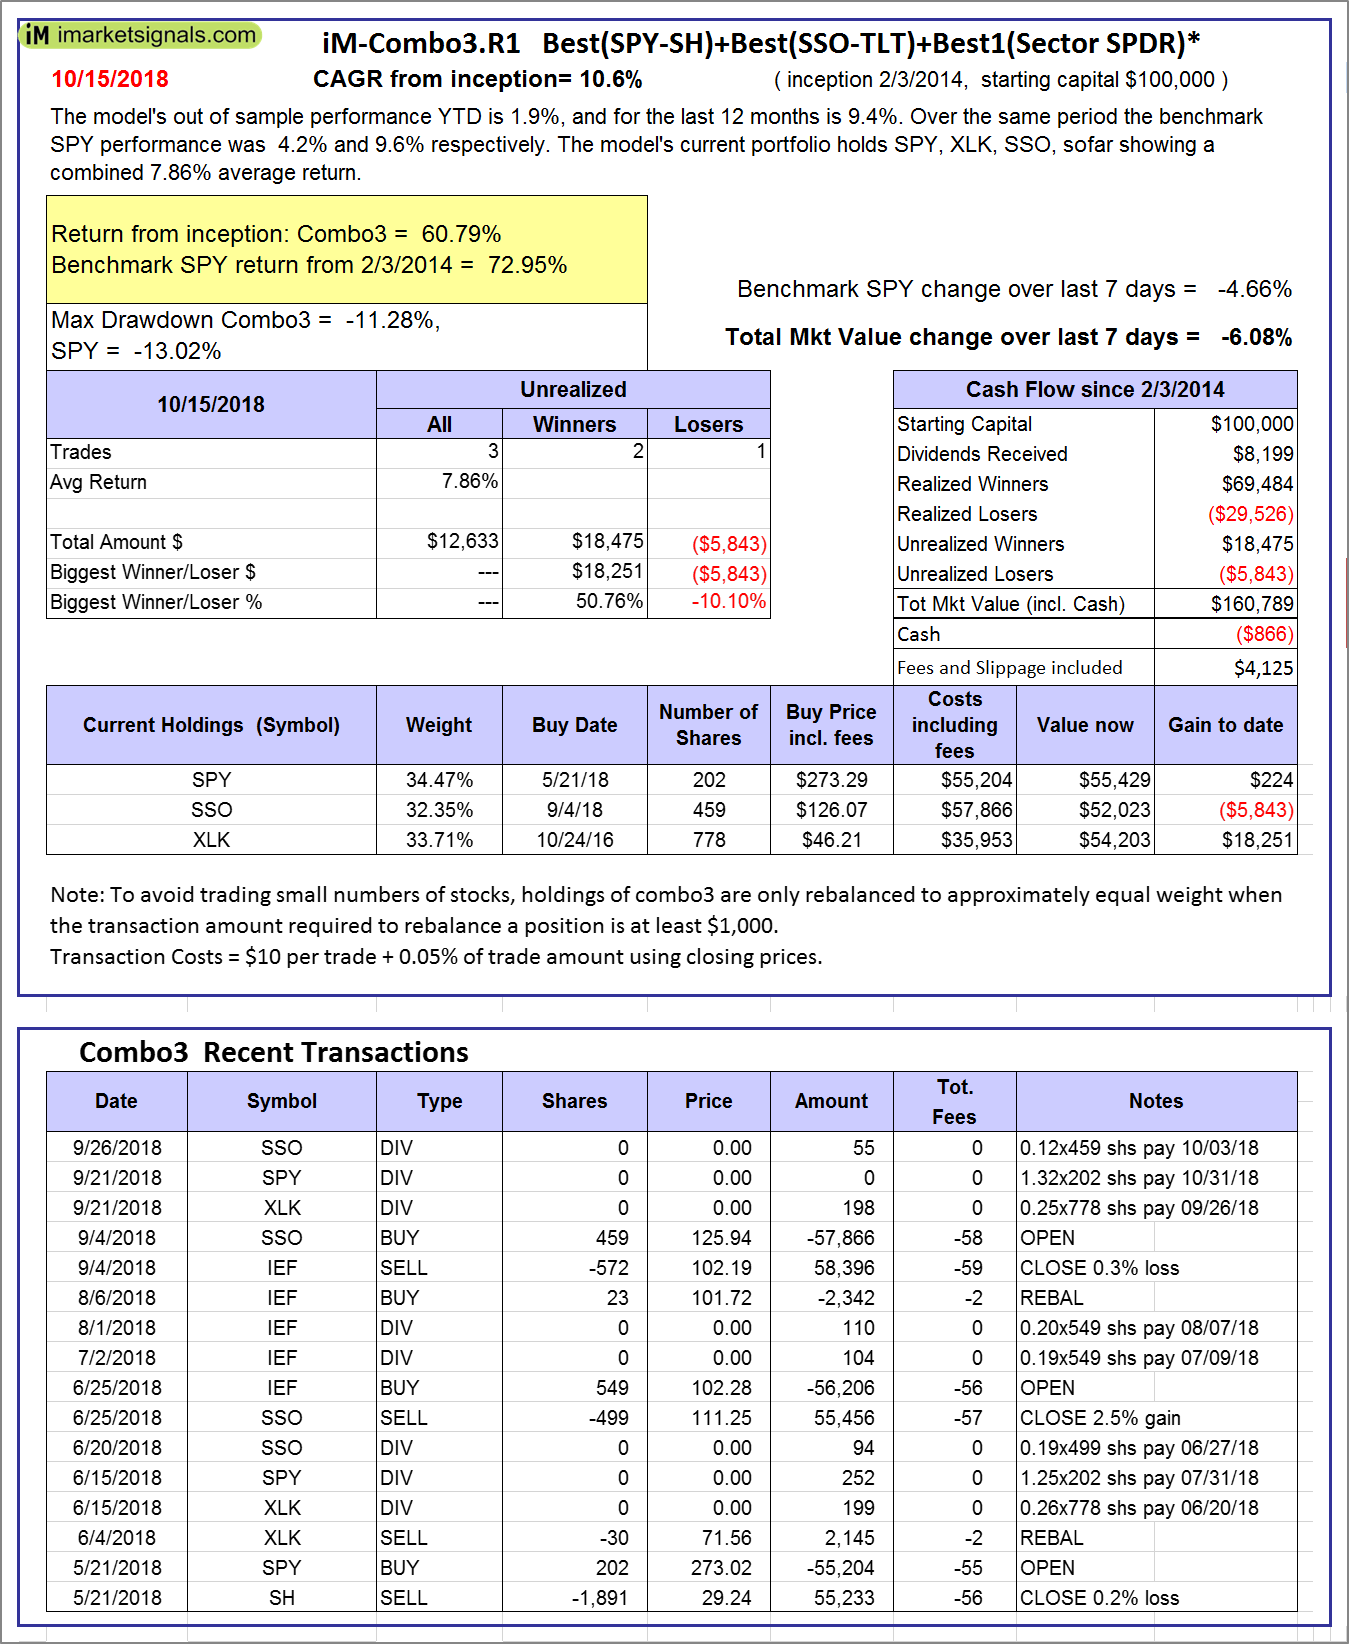 |
iM-Combo3.R1: The model’s out of sample performance YTD is 1.9%, and for the last 12 months is 9.4%. Over the same period the benchmark SPY performance was 4.2% and 9.6% respectively. Over the previous week the market value of iM-Combo3.R1 gained -6.08% at a time when SPY gained -4.66%. A starting capital of $100,000 at inception on 2/3/2014 would have grown to $160,789 which includes -$866 cash and excludes $4,125 spent on fees and slippage. |
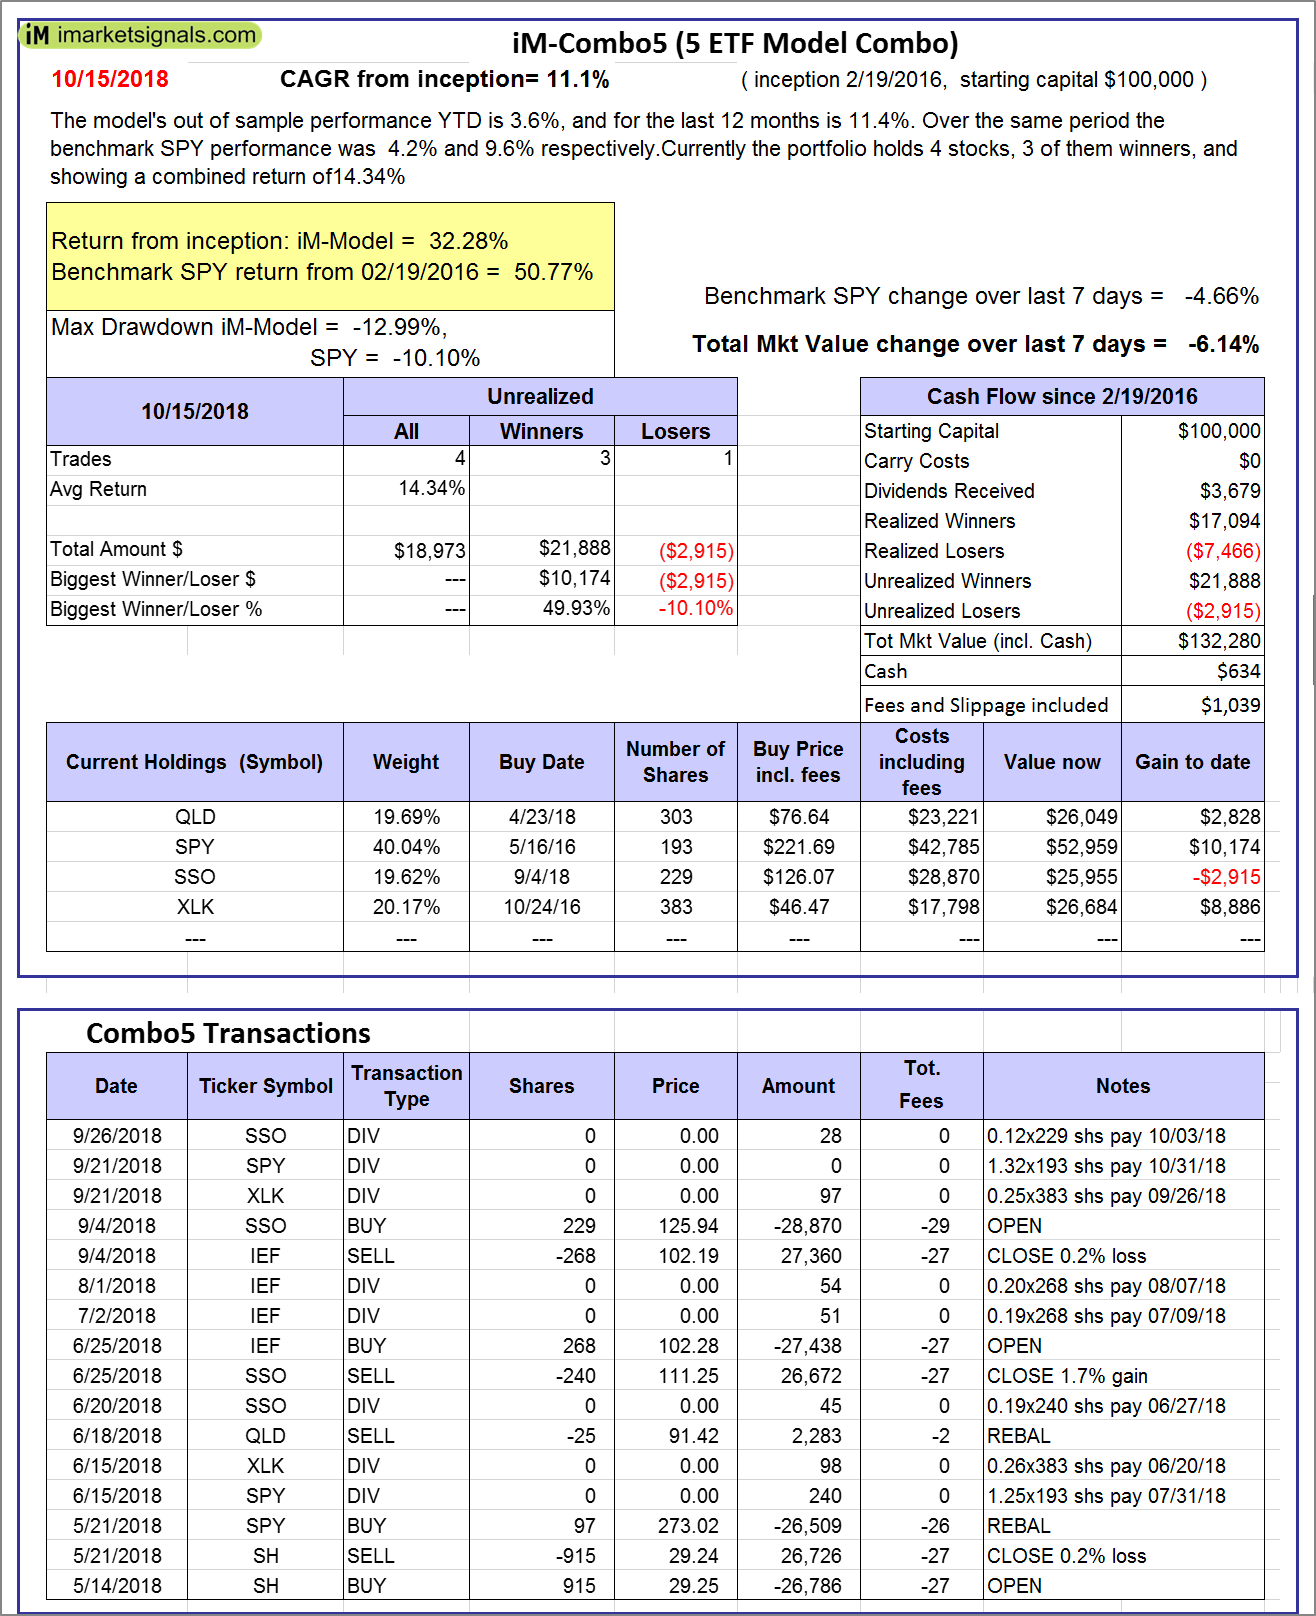 |
iM-Combo5: The model’s out of sample performance YTD is 3.6%, and for the last 12 months is 11.4%. Over the same period the benchmark SPY performance was 4.2% and 9.6% respectively. Over the previous week the market value of iM-Combo5 gained -6.14% at a time when SPY gained -4.66%. A starting capital of $100,000 at inception on 2/22/2016 would have grown to $132,280 which includes $634 cash and excludes $1,039 spent on fees and slippage. |
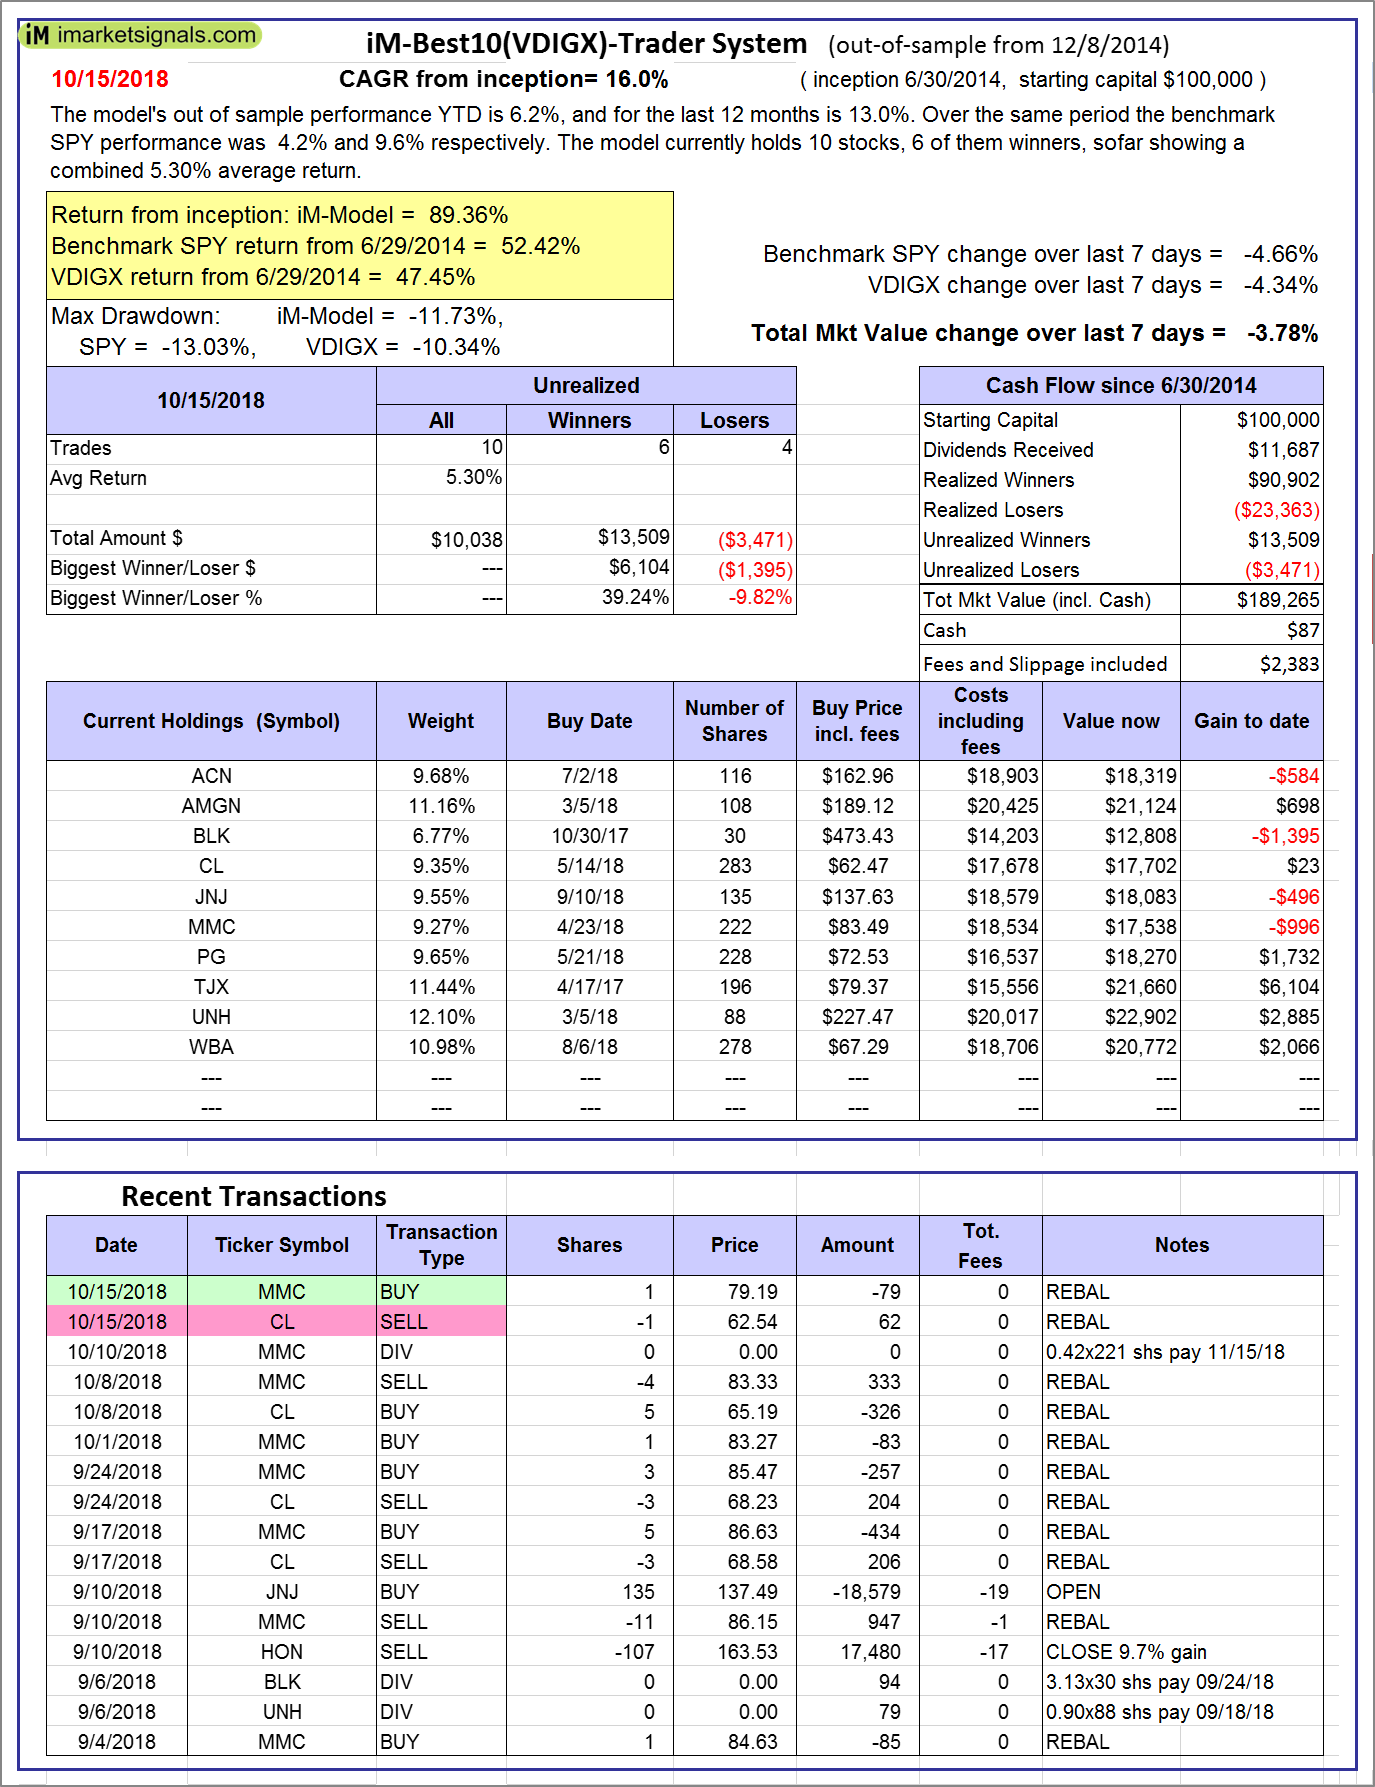 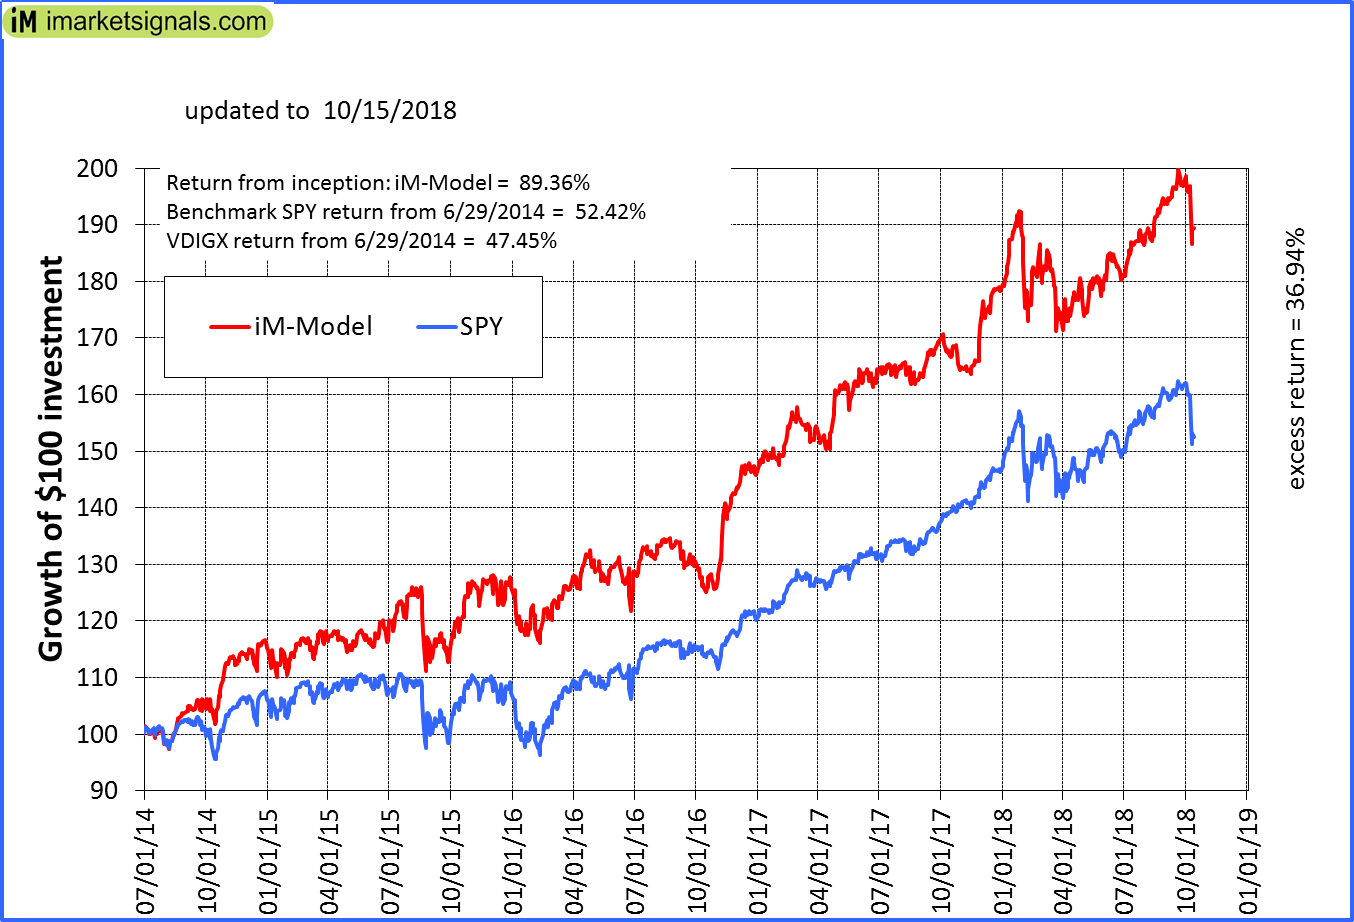 |
iM-Best10(VDIGX)-Trader: The model’s out of sample performance YTD is 6.2%, and for the last 12 months is 13.0%. Over the same period the benchmark SPY performance was 4.2% and 9.6% respectively. Since inception, on 7/1/2014, the model gained 89.36% while the benchmark SPY gained 52.42% and VDIGX gained 47.45% over the same period. Over the previous week the market value of iM-Best10(VDIGX) gained -3.78% at a time when SPY gained -4.66%. A starting capital of $100,000 at inception on 7/1/2014 would have grown to $189,265 which includes $87 cash and excludes $2,383 spent on fees and slippage. |
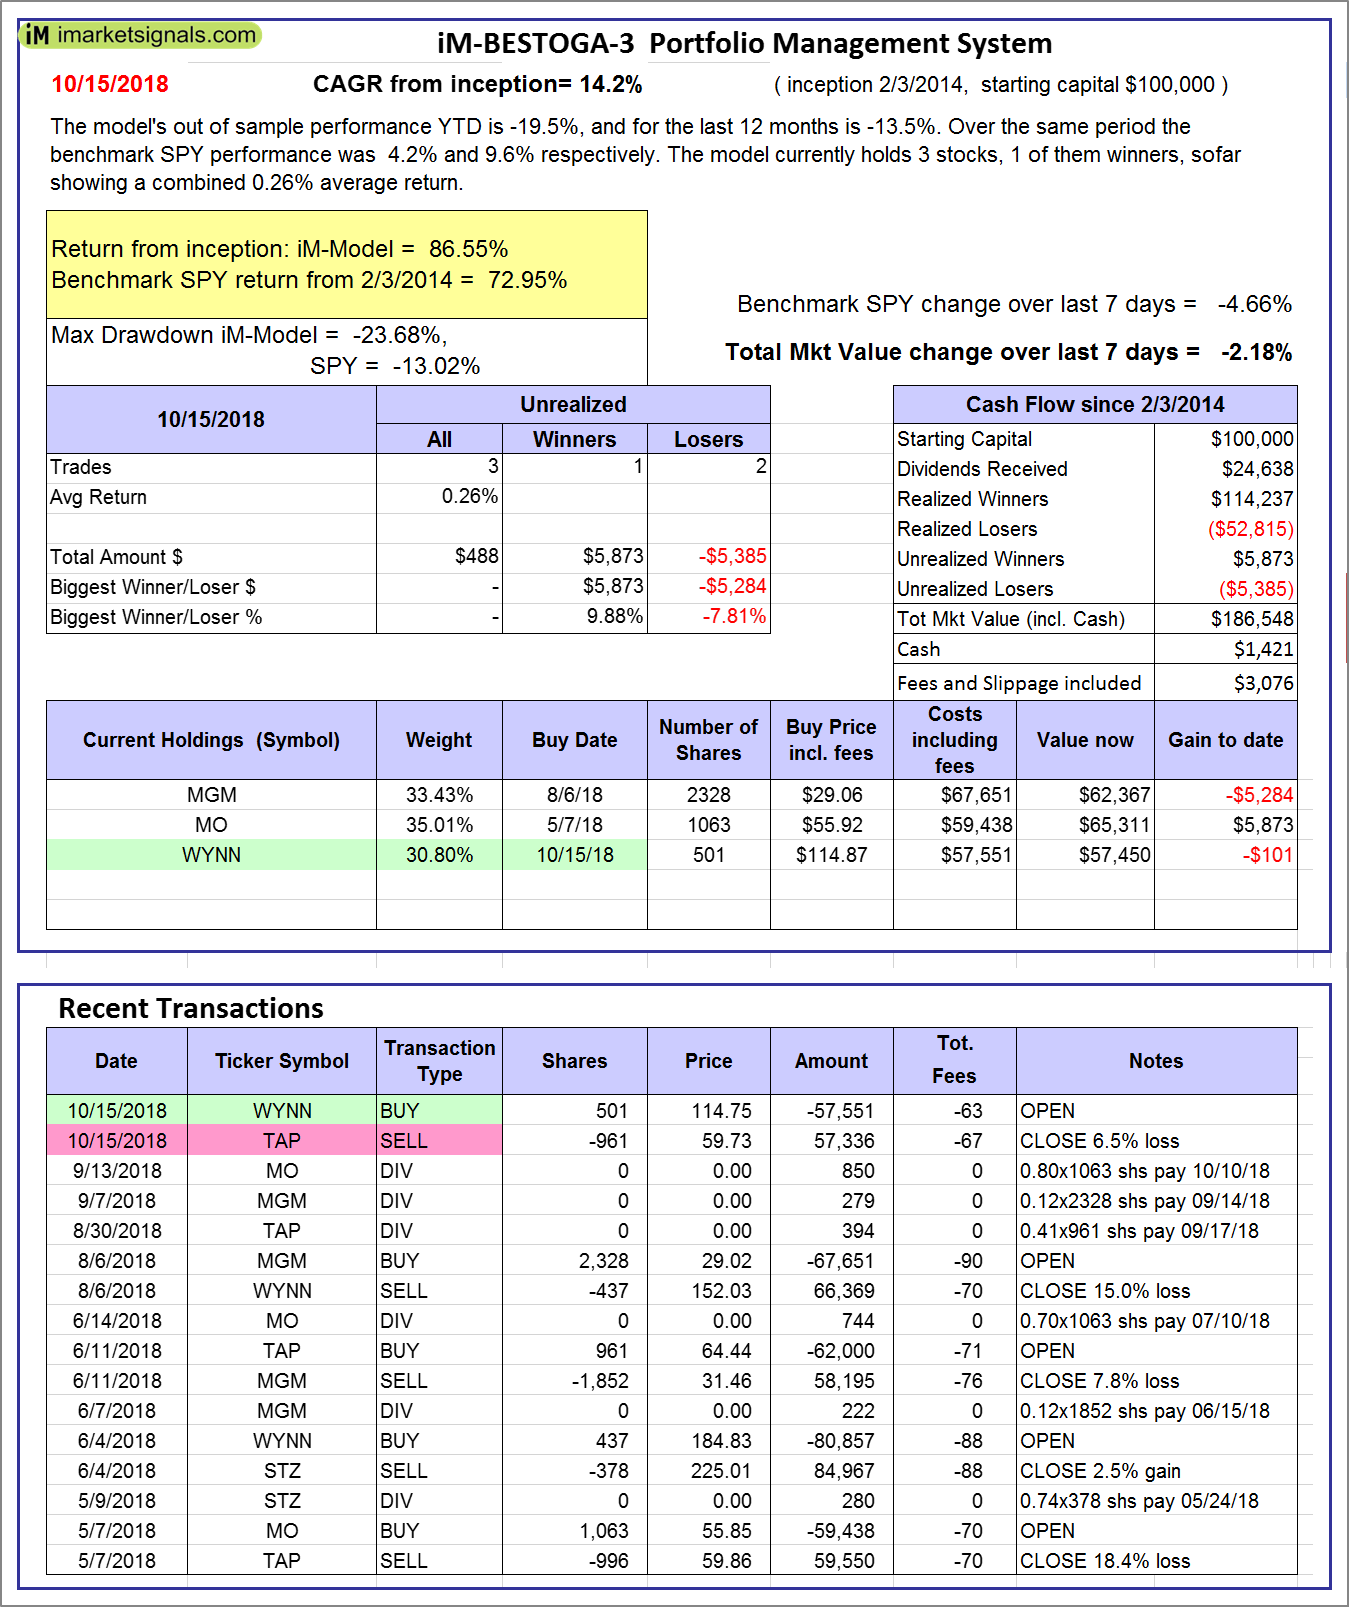 |
iM-BESTOGA-3: The model’s out of sample performance YTD is -19.5%, and for the last 12 months is -13.5%. Over the same period the benchmark SPY performance was 4.2% and 9.6% respectively. Over the previous week the market value of iM-BESTOGA-3 gained -2.18% at a time when SPY gained -4.66%. A starting capital of $100,000 at inception on 2/3/2014 would have grown to $186,548 which includes $1,421 cash and excludes $3,076 spent on fees and slippage. |
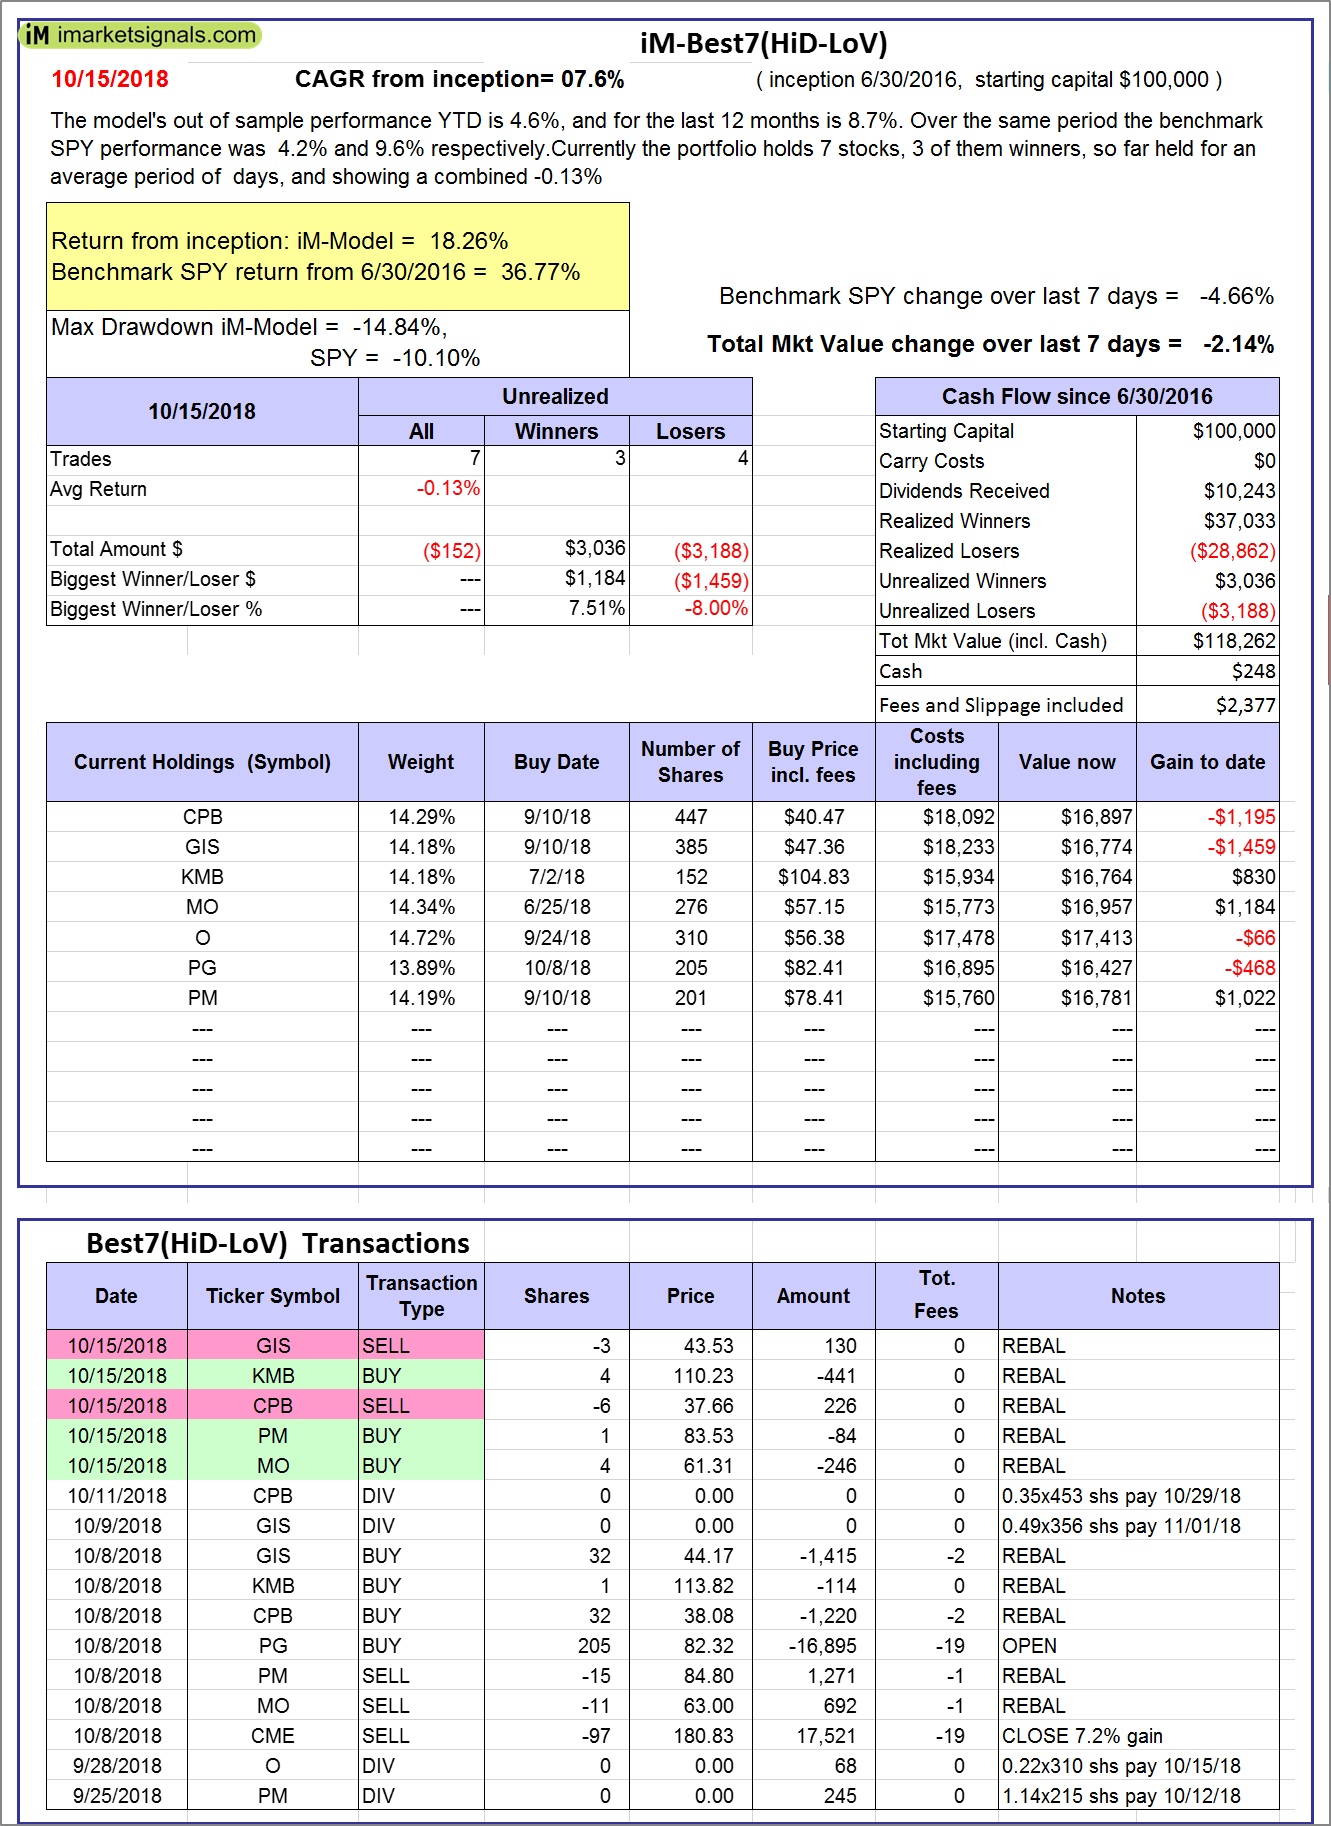 |
iM-Best7(HiD-LoV): The model’s out of sample performance YTD is 4.6%, and for the last 12 months is 8.7%. Over the same period the benchmark SPY performance was 4.2% and 9.6% respectively. Over the previous week the market value of iM-BESTOGA-3 gained -2.14% at a time when SPY gained -4.66%. A starting capital of $100,000 at inception on 6/30/2016 would have grown to $118,262 which includes $248 cash and excludes $2,377 spent on fees and slippage. |
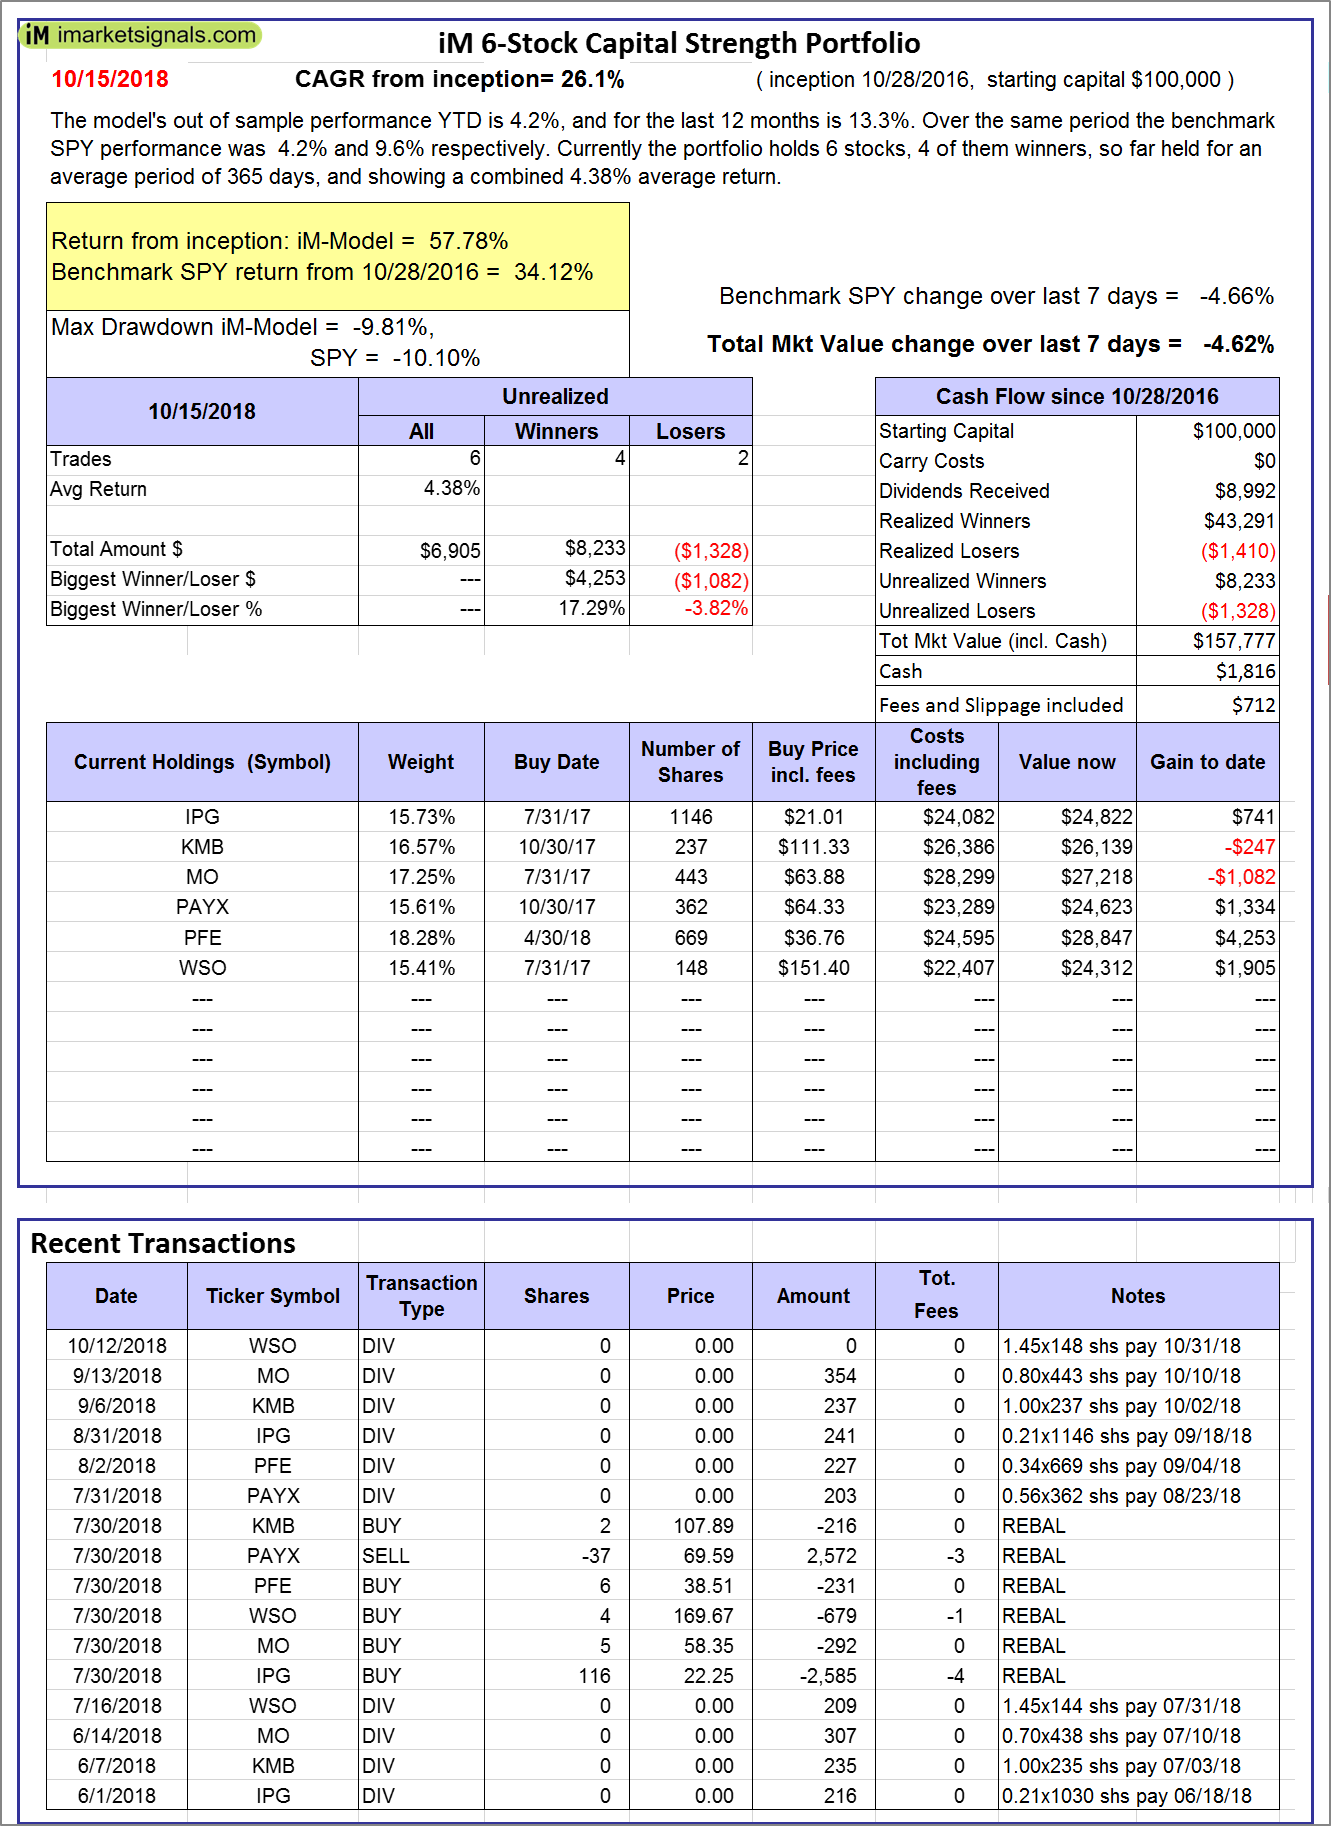 |
iM 6-Stock Capital Strength Portfolio: The model’s out of sample performance YTD is 4.2%, and for the last 12 months is 13.3%. Over the same period the benchmark SPY performance was 4.2% and 9.6% respectively. Over the previous week the market value of the iM 6-Stock Capital Strength Portfolio gained -4.62% at a time when SPY gained -4.66%. A starting capital of $100,000 at inception on 10/28/2016 would have grown to $157,777 which includes $1,816 cash and excludes $712 spent on fees and slippage. |
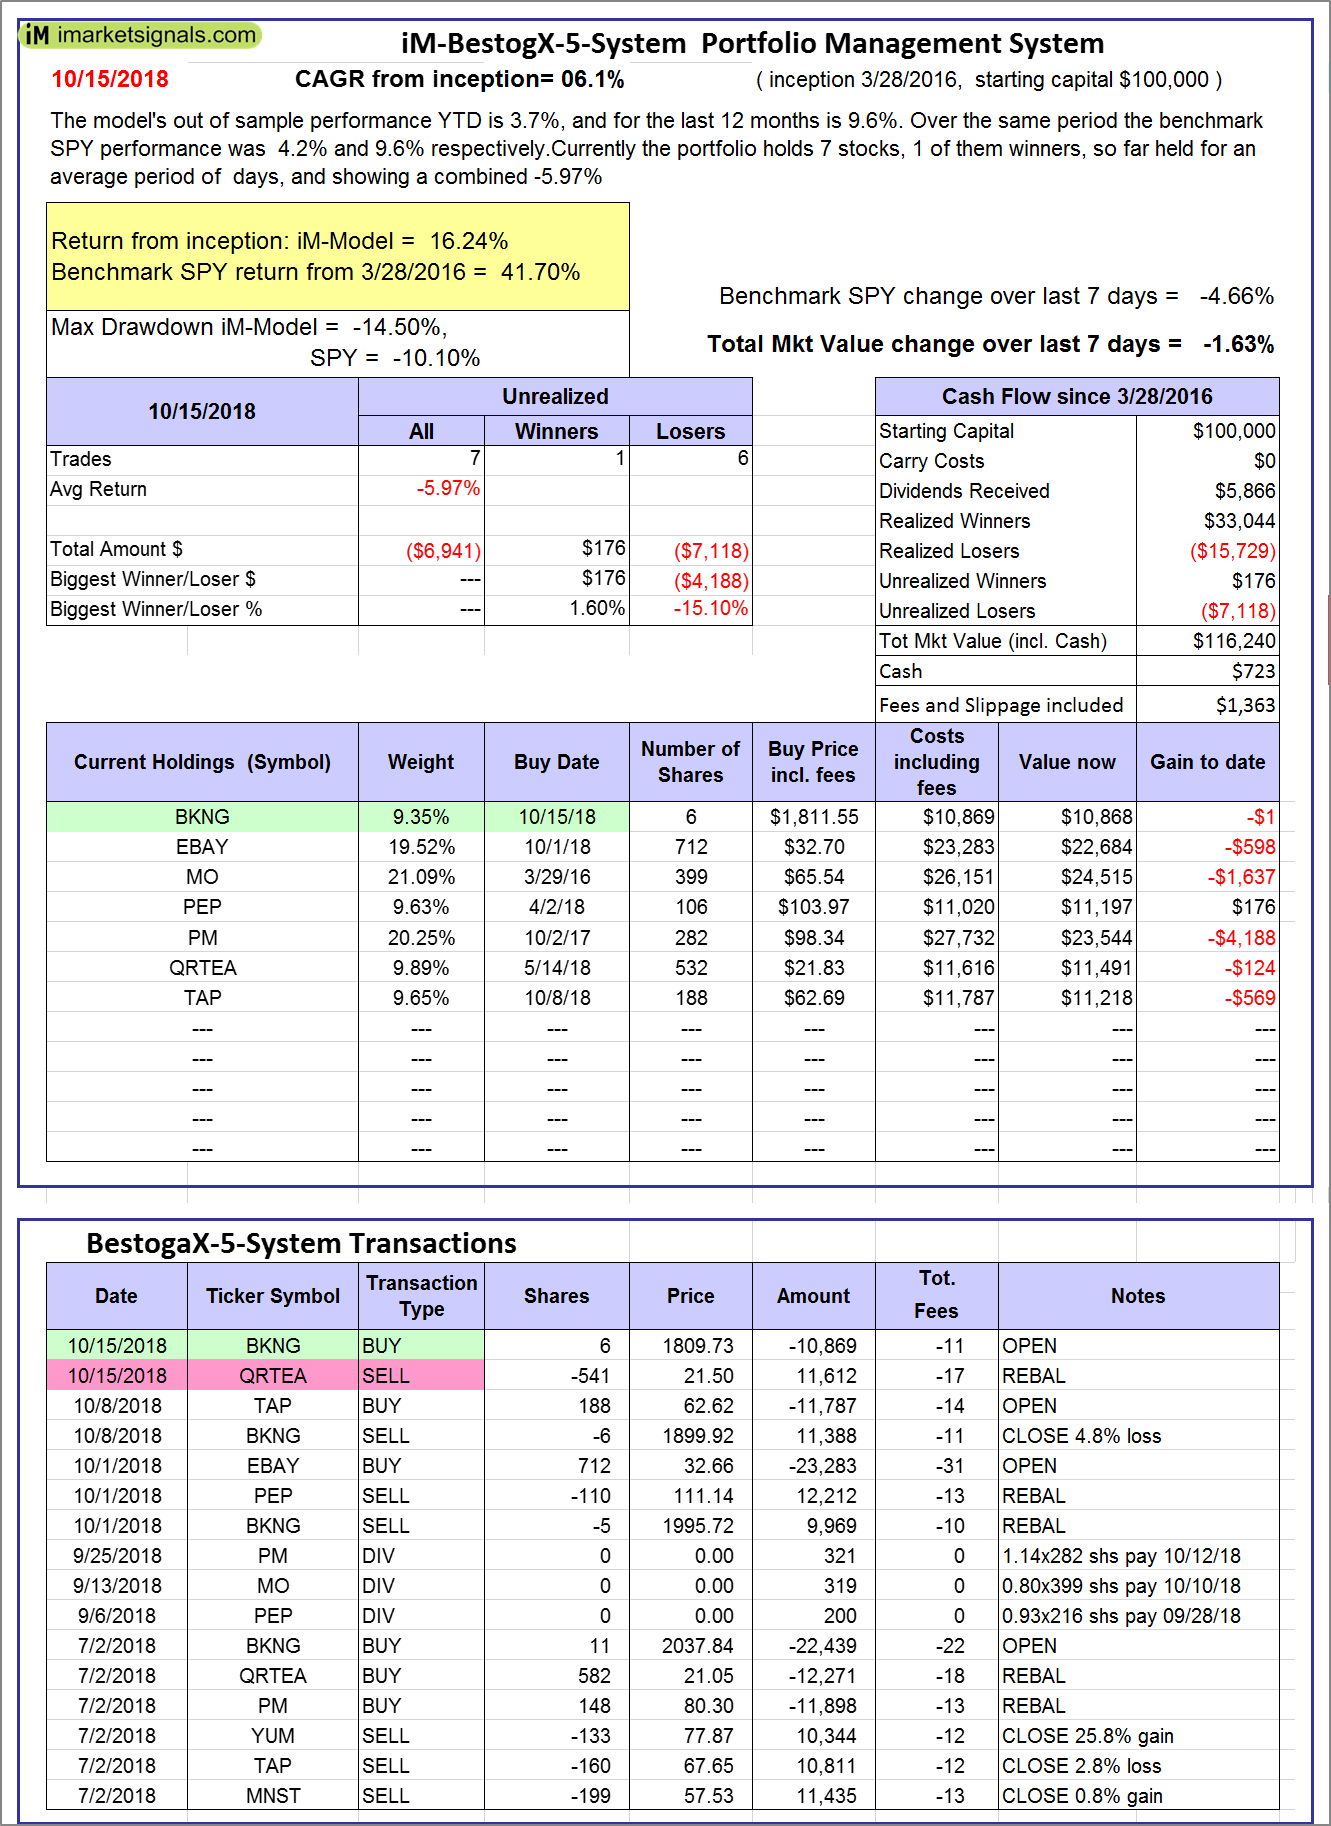 |
iM-BestogaX5-System: The model’s out of sample performance YTD is 3.7%, and for the last 12 months is 9.6%. Over the same period the benchmark SPY performance was 4.2% and 9.6% respectively. Over the previous week the market value of iM-BestogaX5-System gained -1.63% at a time when SPY gained -4.66%. A starting capital of $100,000 at inception on 3/28/2016 would have grown to $116,240 which includes $723 cash and excludes $1,363 spent on fees and slippage. |
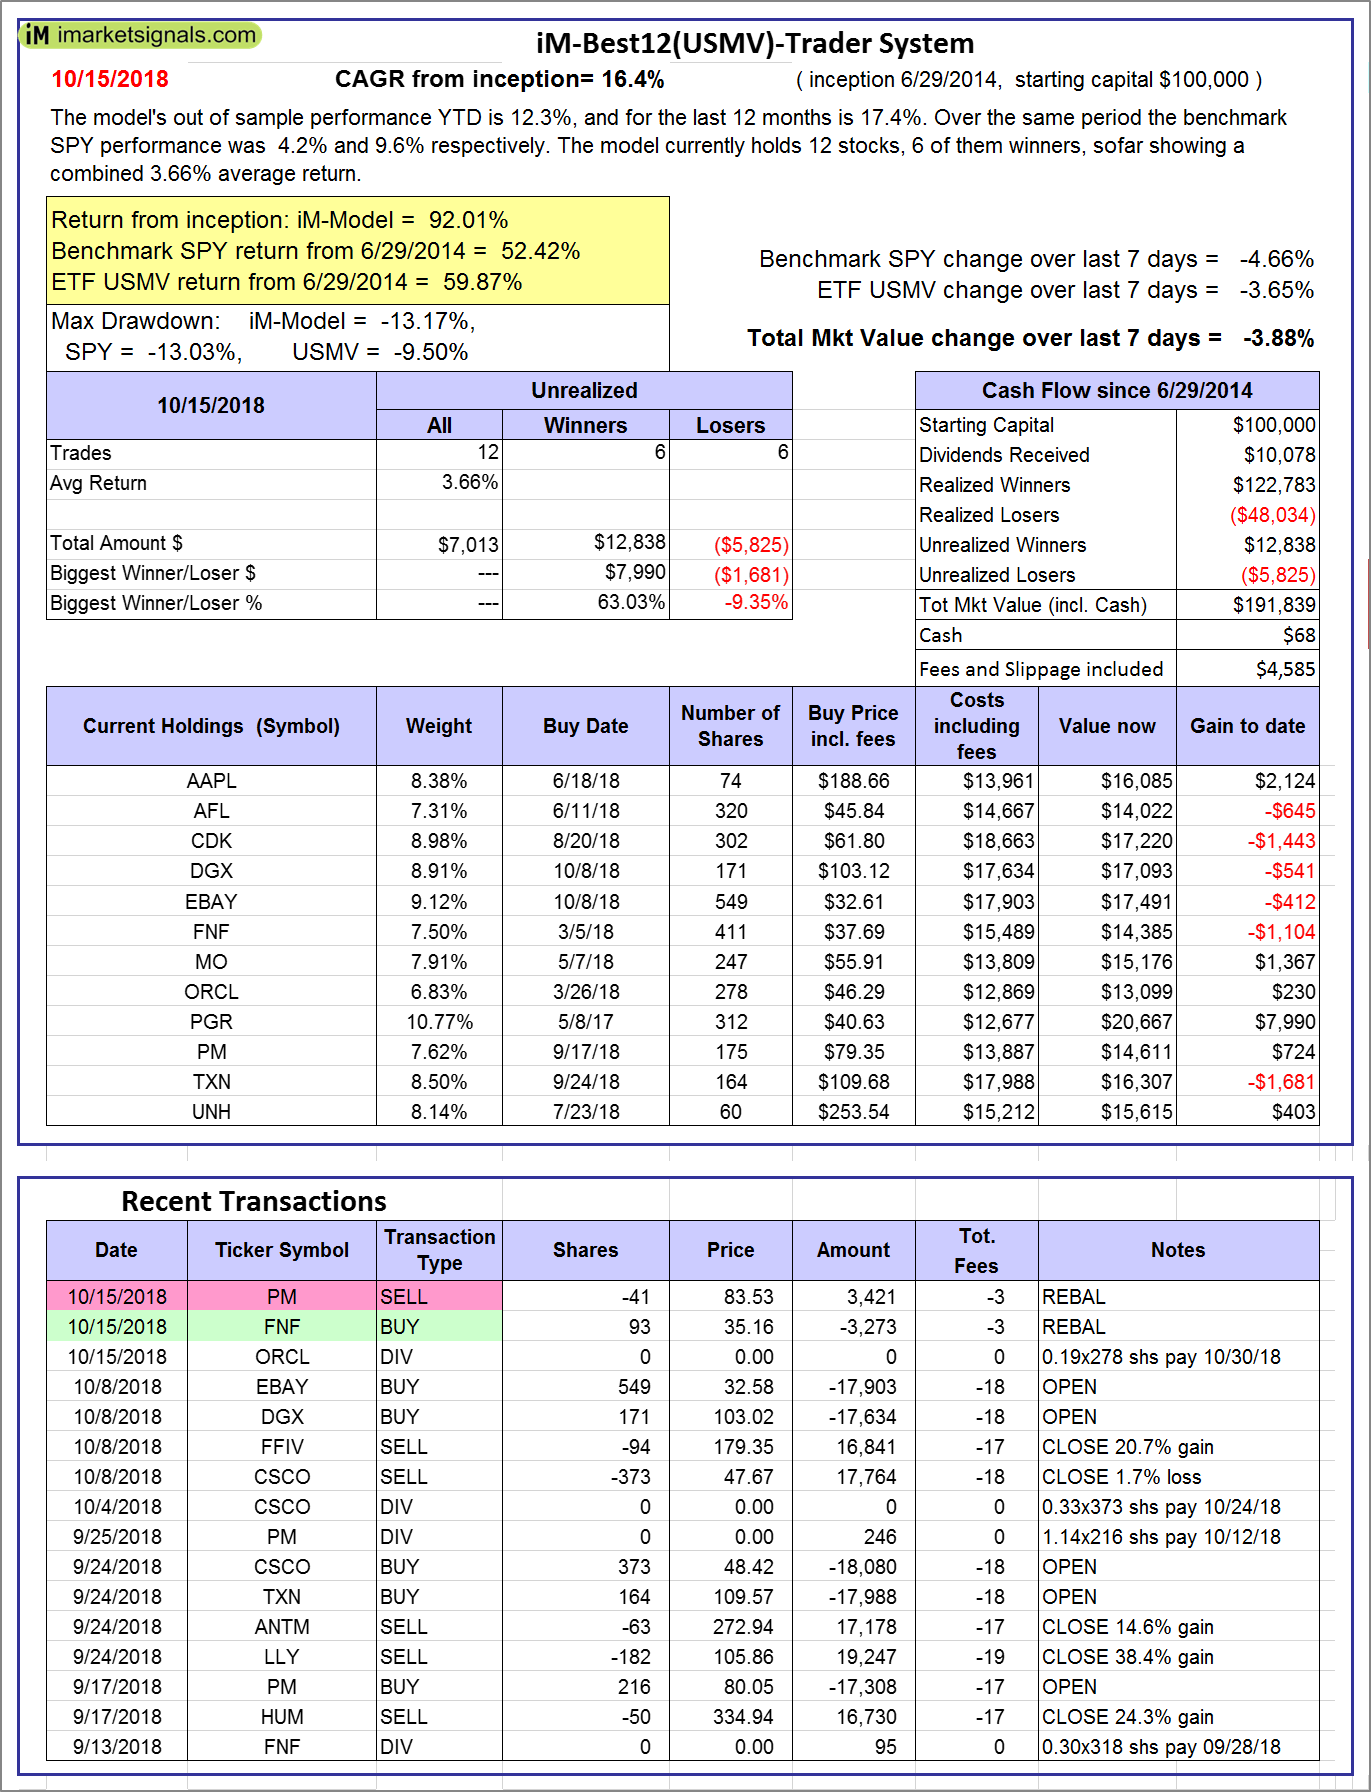  |
iM-Best12(USMV)-Trader: The model’s out of sample performance YTD is 12.3%, and for the last 12 months is 17.4%. Over the same period the benchmark SPY performance was 4.2% and 9.6% respectively. Since inception, on 6/30/2014, the model gained 92.01% while the benchmark SPY gained 52.42% and the ETF USMV gained 59.87% over the same period. Over the previous week the market value of iM-Best12(USMV)-Trader gained -3.88% at a time when SPY gained -4.66%. A starting capital of $100,000 at inception on 6/30/2014 would have grown to $191,839 which includes $68 cash and excludes $4,585 spent on fees and slippage. |
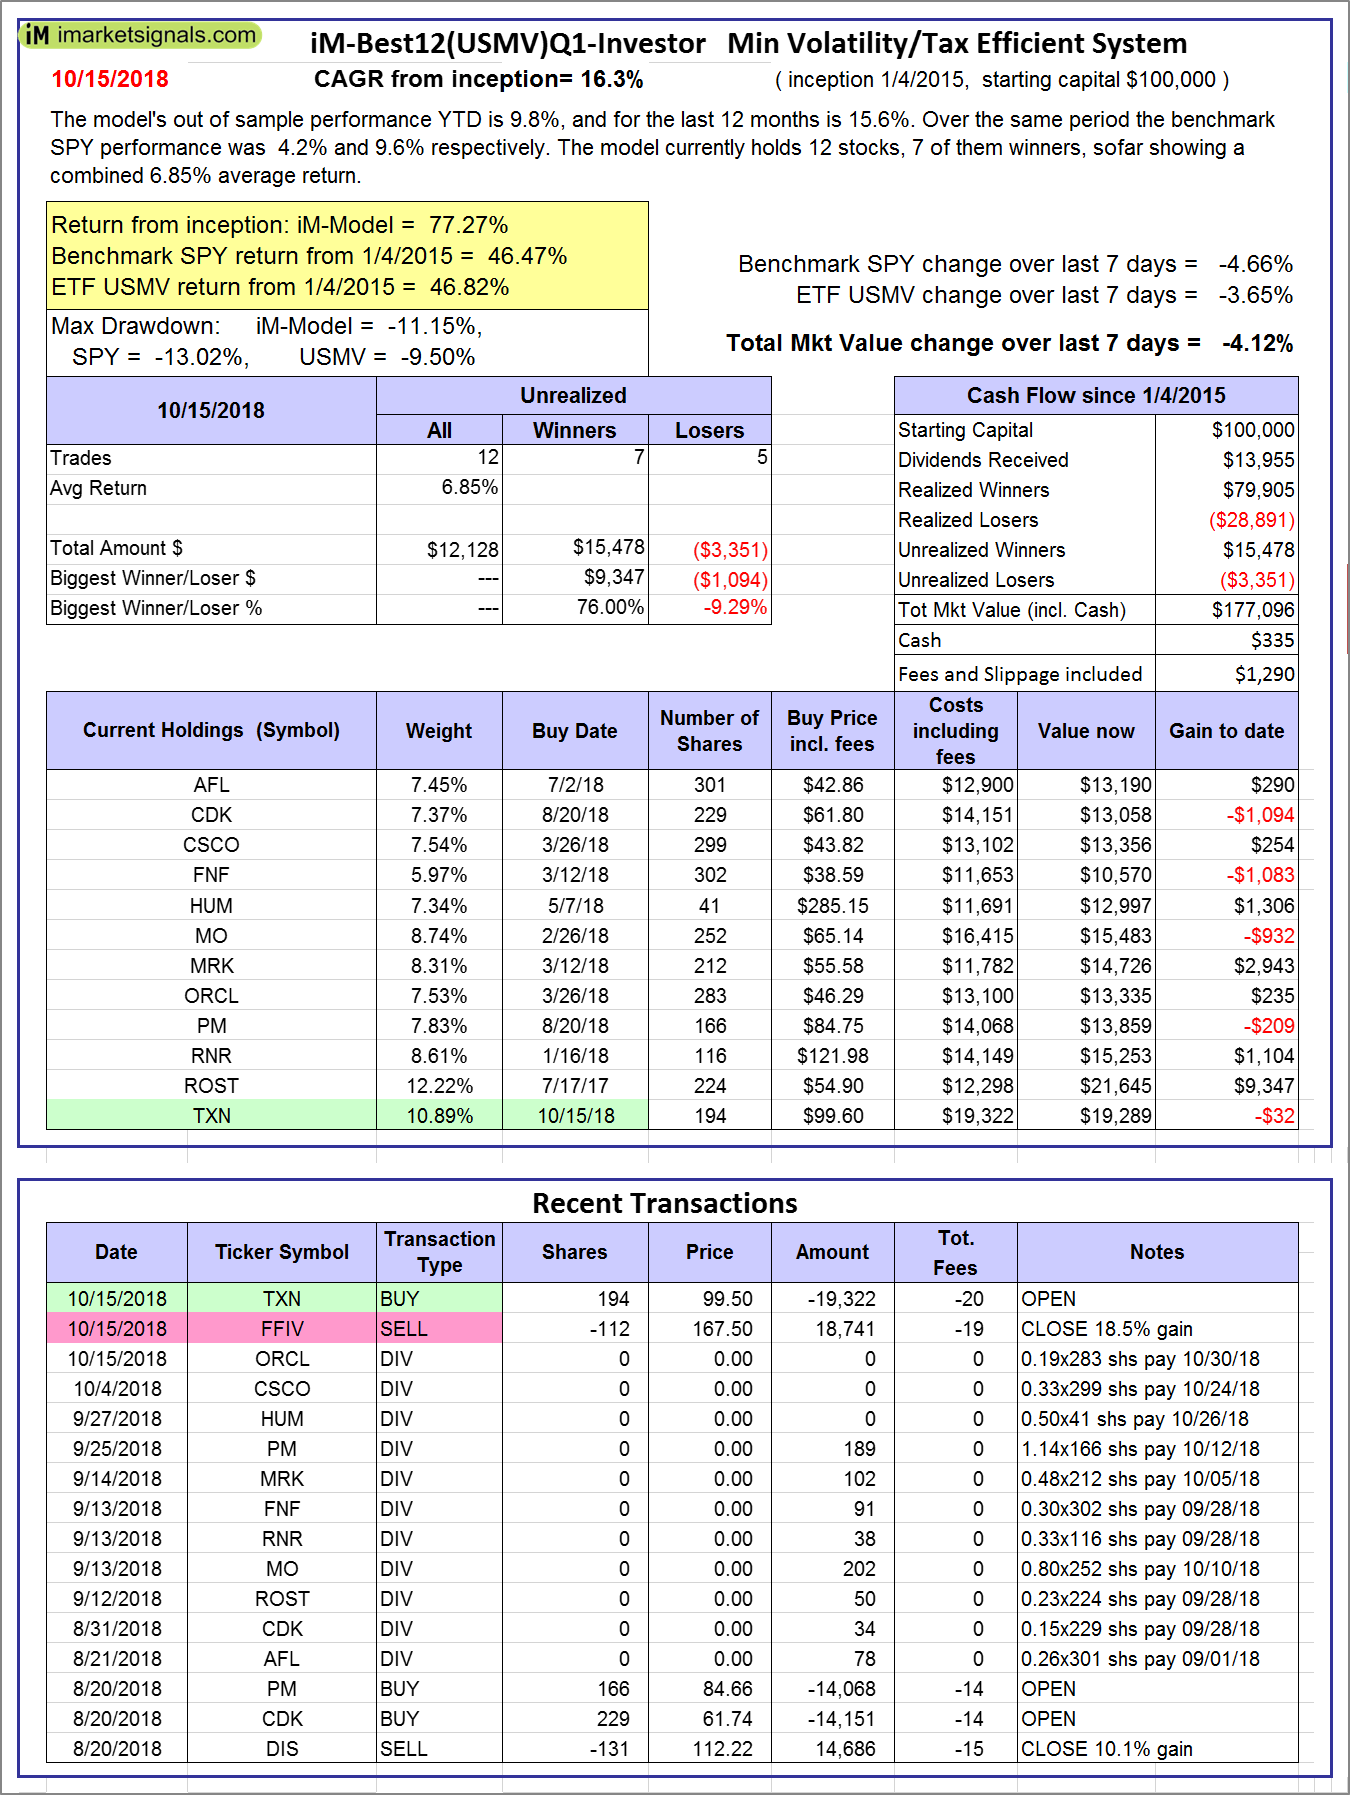  |
iM-Best12(USMV)Q1-Investor: The model’s out of sample performance YTD is 9.8%, and for the last 12 months is 15.6%. Over the same period the benchmark SPY performance was 4.2% and 9.6% respectively. Since inception, on 1/5/2015, the model gained 77.27% while the benchmark SPY gained 46.47% and the ETF USMV gained 46.82% over the same period. Over the previous week the market value of iM-Best12(USMV)Q1 gained -4.12% at a time when SPY gained -4.66%. A starting capital of $100,000 at inception on 1/5/2015 would have grown to $177,096 which includes $335 cash and excludes $1,290 spent on fees and slippage. |
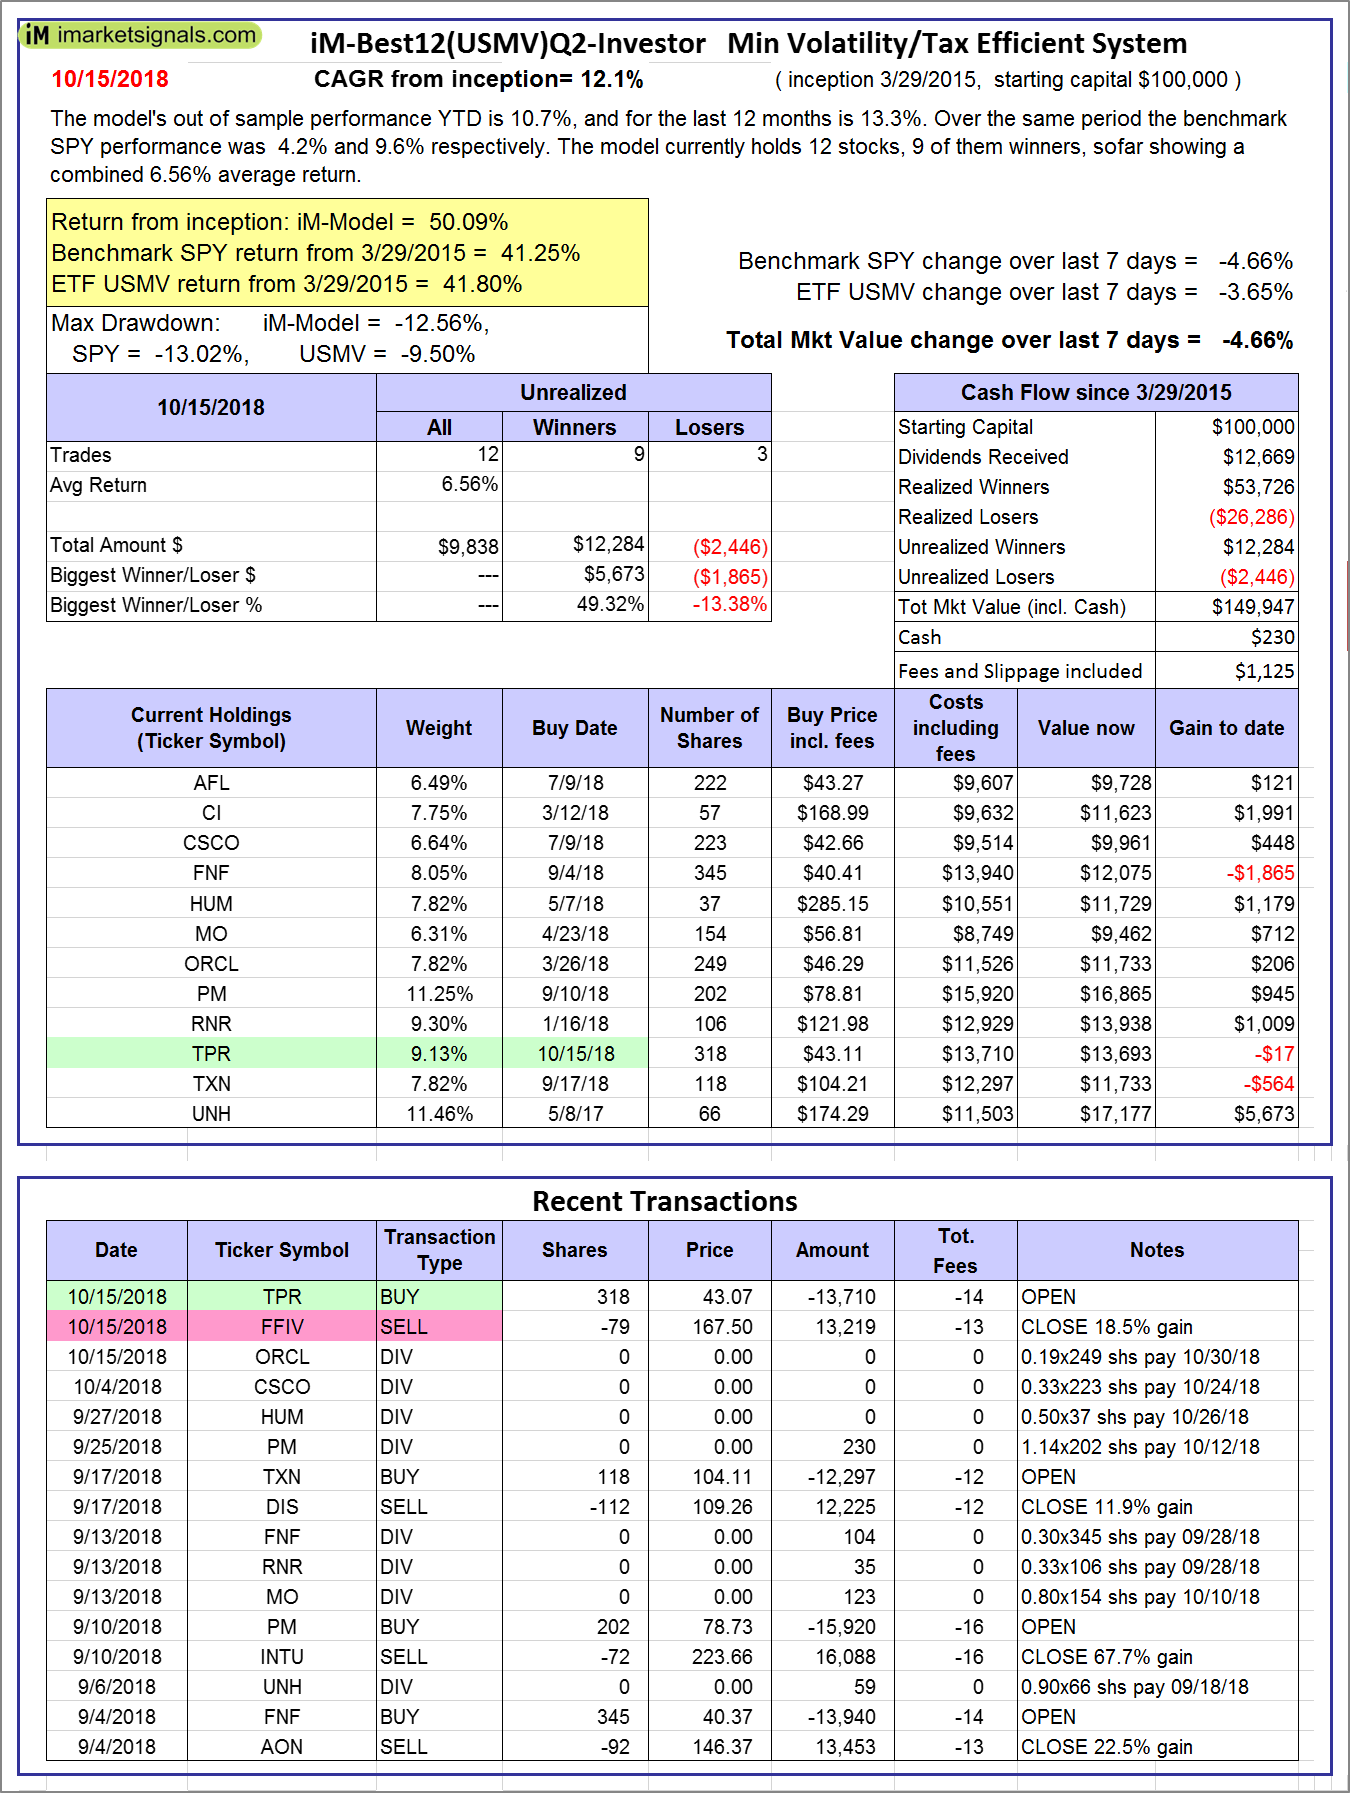 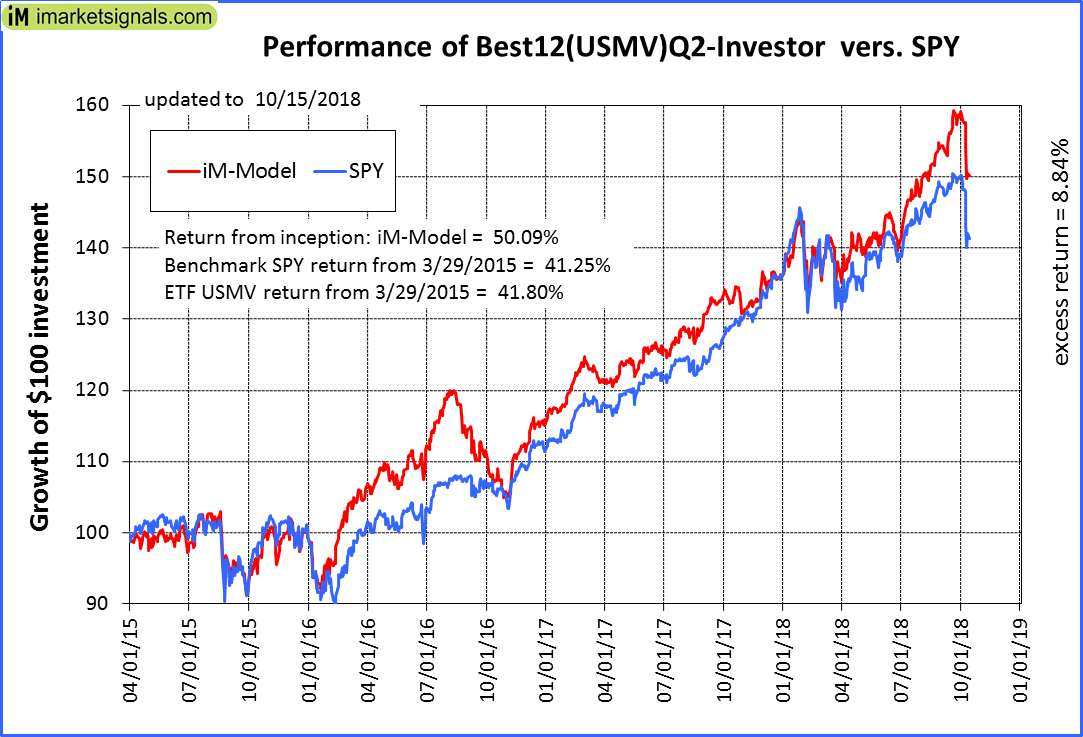 |
iM-Best12(USMV)Q2-Investor: The model’s out of sample performance YTD is 10.7%, and for the last 12 months is 13.3%. Over the same period the benchmark SPY performance was 4.2% and 9.6% respectively. Since inception, on 3/30/2015, the model gained 50.09% while the benchmark SPY gained 41.25% and the ETF USMV gained 41.80% over the same period. Over the previous week the market value of iM-Best12(USMV)Q2 gained -4.66% at a time when SPY gained -4.66%. A starting capital of $100,000 at inception on 3/30/2015 would have grown to $149,947 which includes $230 cash and excludes $1,125 spent on fees and slippage. |
 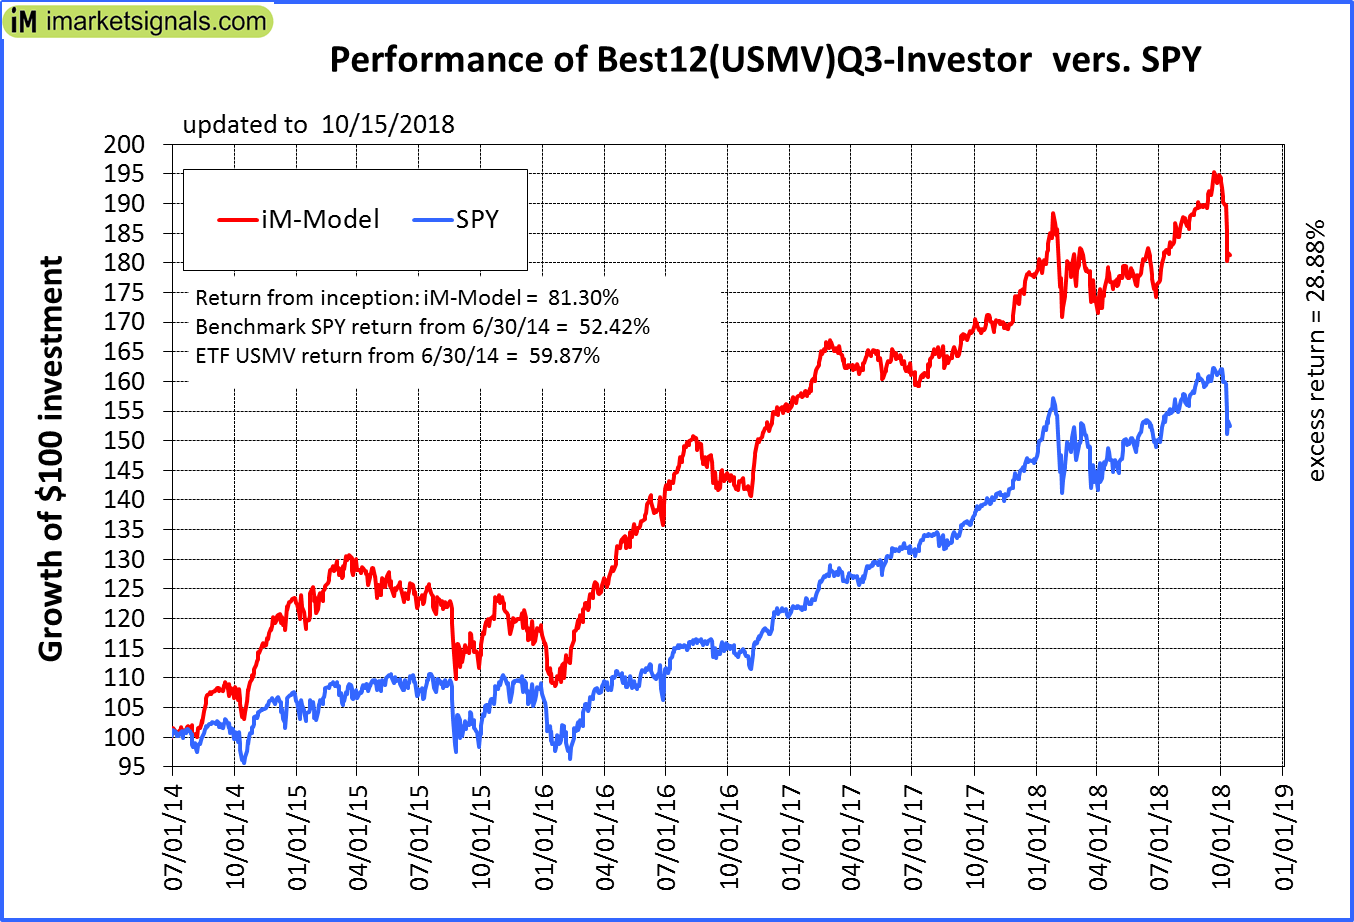 |
iM-Best12(USMV)Q3-Investor: The model’s out of sample performance YTD is 2.0%, and for the last 12 months is 7.4%. Over the same period the benchmark SPY performance was 4.2% and 9.6% respectively. Since inception, on 7/1/2014, the model gained 81.30% while the benchmark SPY gained 52.42% and the ETF USMV gained 59.87% over the same period. Over the previous week the market value of iM-Best12(USMV)Q3 gained -4.46% at a time when SPY gained -4.66%. A starting capital of $100,000 at inception on 7/1/2014 would have grown to $181,085 which includes $301 cash and excludes $1,653 spent on fees and slippage. |
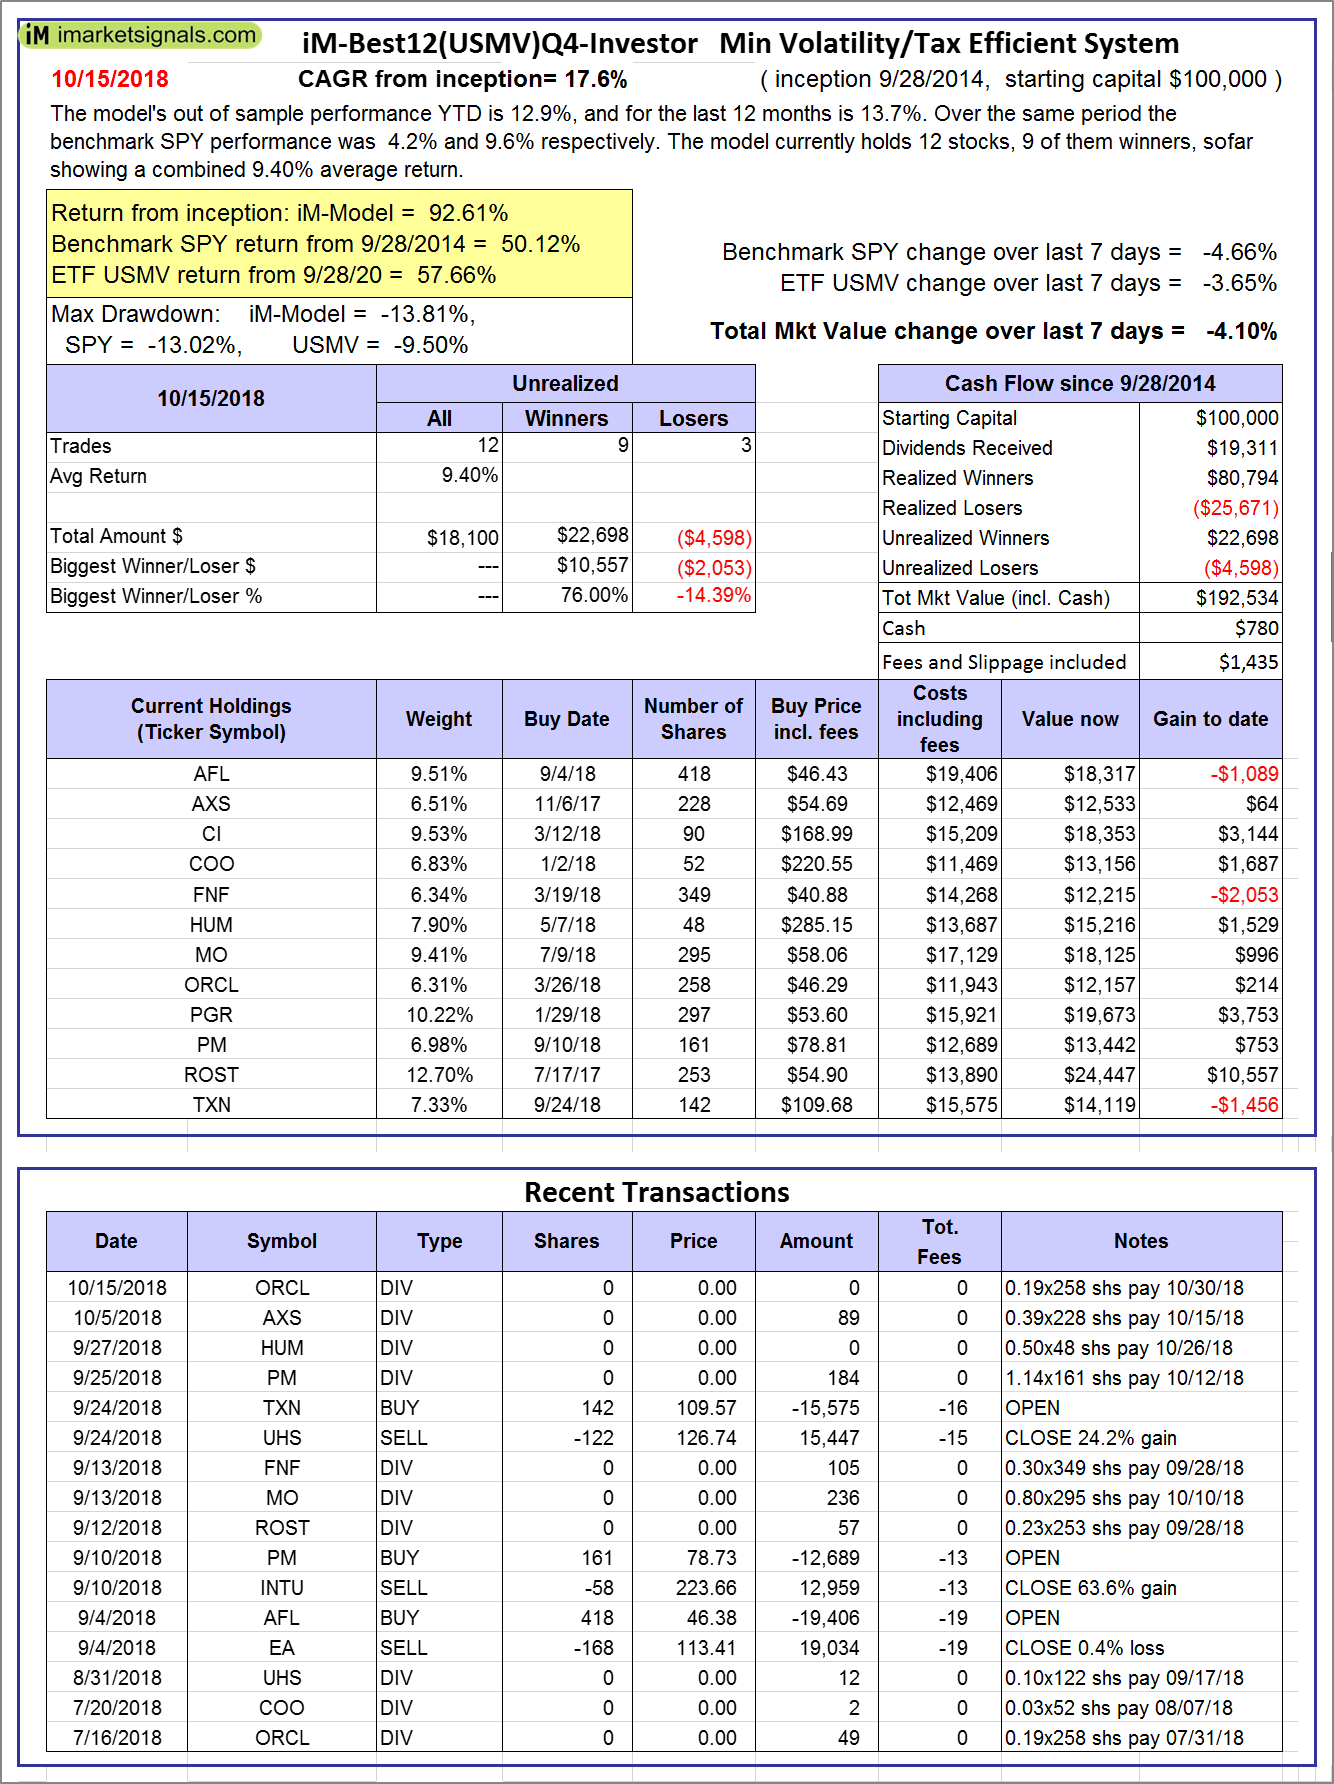  |
iM-Best12(USMV)Q4-Investor: Since inception, on 9/29/2014, the model gained 92.61% while the benchmark SPY gained 50.12% and the ETF USMV gained 57.66% over the same period. Over the previous week the market value of iM-Best12(USMV)Q4 gained -4.10% at a time when SPY gained -4.66%. A starting capital of $100,000 at inception on 9/29/2014 would have grown to $192,534 which includes $780 cash and excludes $1,435 spent on fees and slippage. |
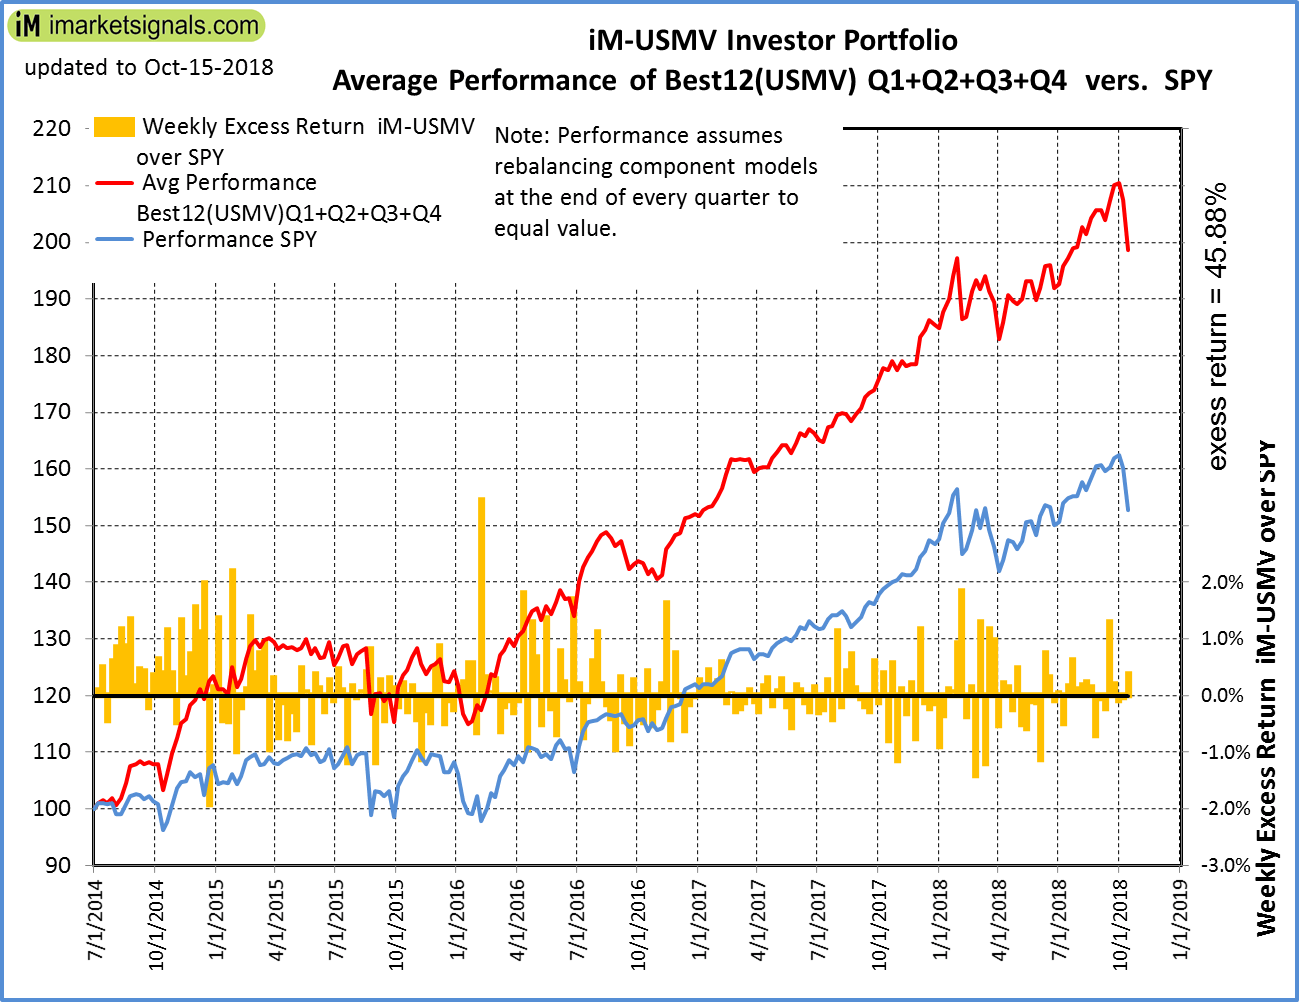 |
Average Performance of iM-Best12(USMV)Q1+Q2+Q3+Q4-Investor resulted in an excess return of 45.88% over SPY. (see iM-USMV Investor Portfolio) |
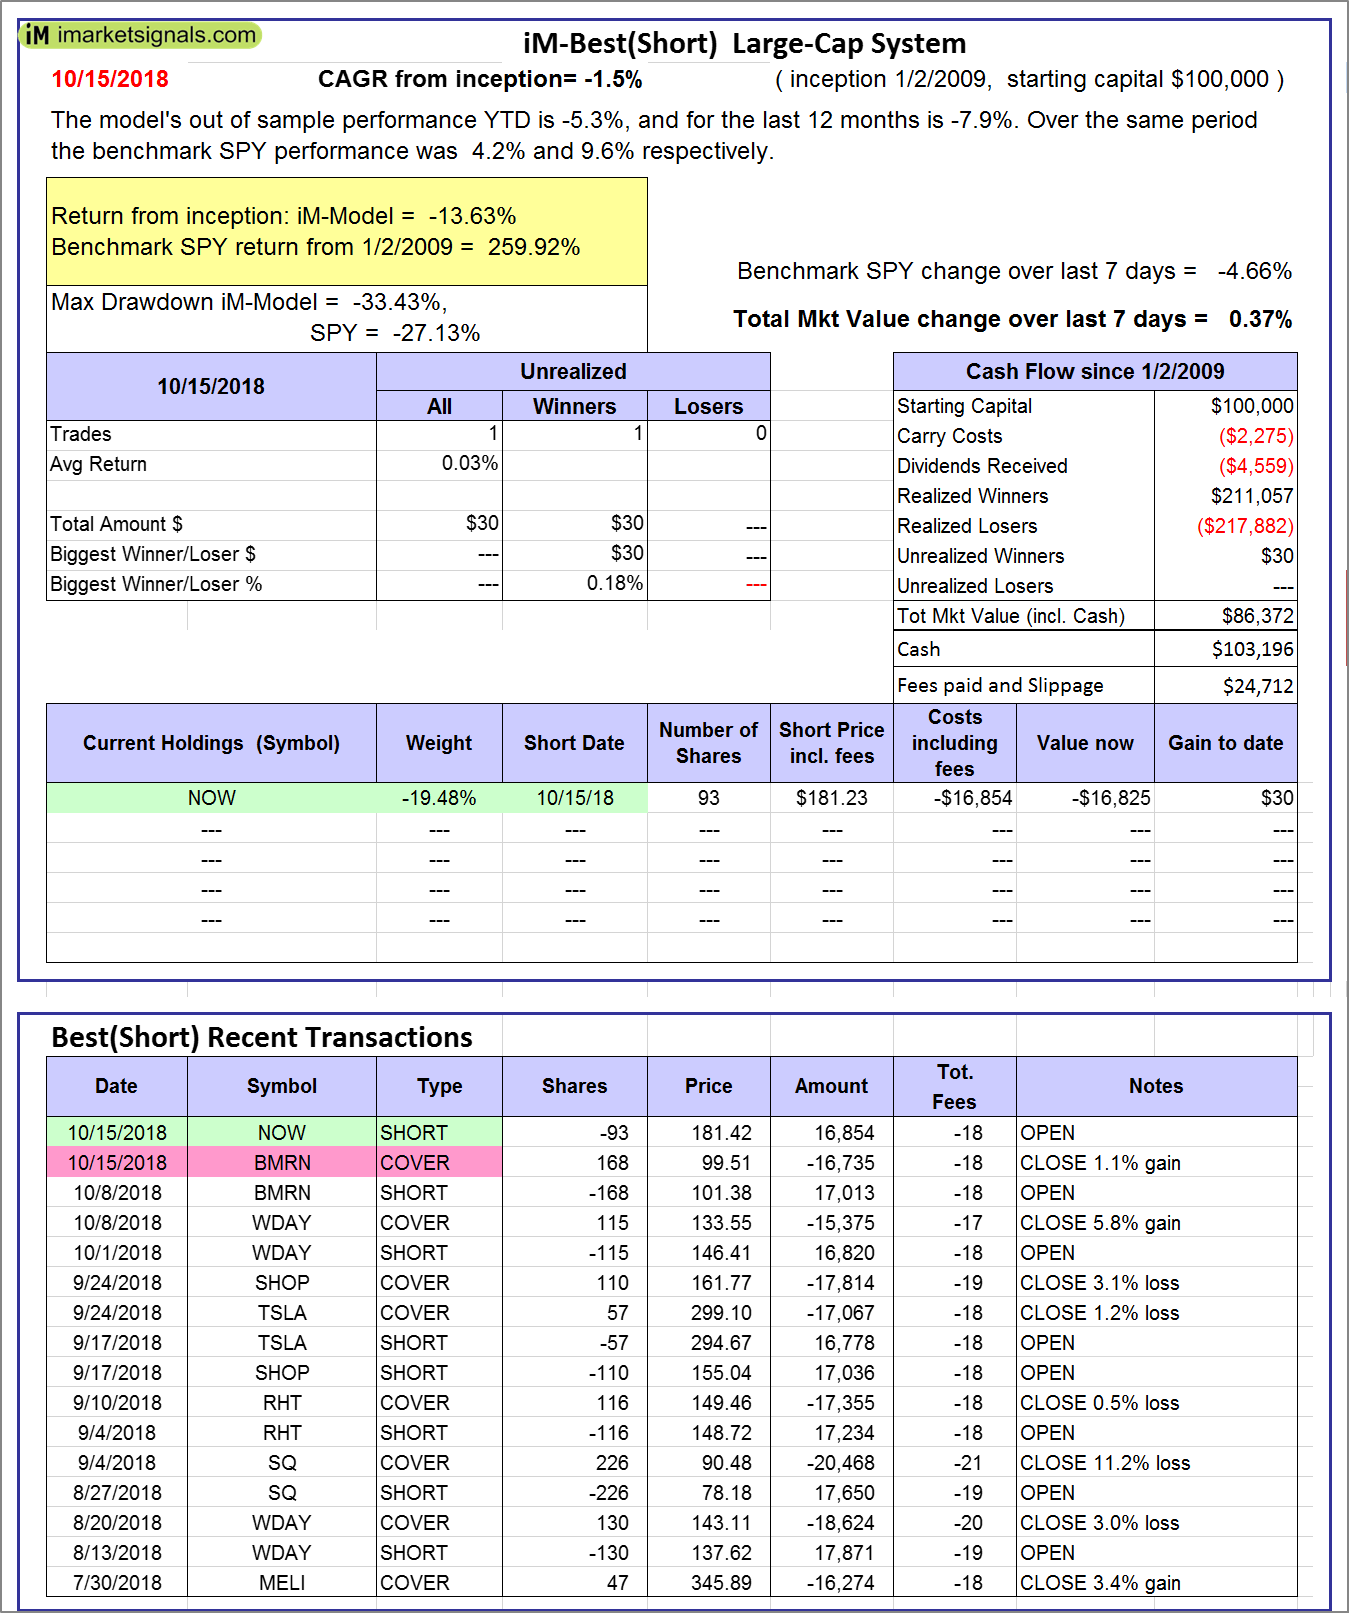 |
iM-Best(Short): The model’s out of sample performance YTD is -5.3%, and for the last 12 months is -7.9%. Over the same period the benchmark SPY performance was 4.2% and 9.6% respectively. Over the previous week the market value of iM-Best(Short) gained 0.37% at a time when SPY gained -4.66%. Over the period 1/2/2009 to 10/15/2018 the starting capital of $100,000 would have grown to $86,372 which includes $103,196 cash and excludes $24,712 spent on fees and slippage. |
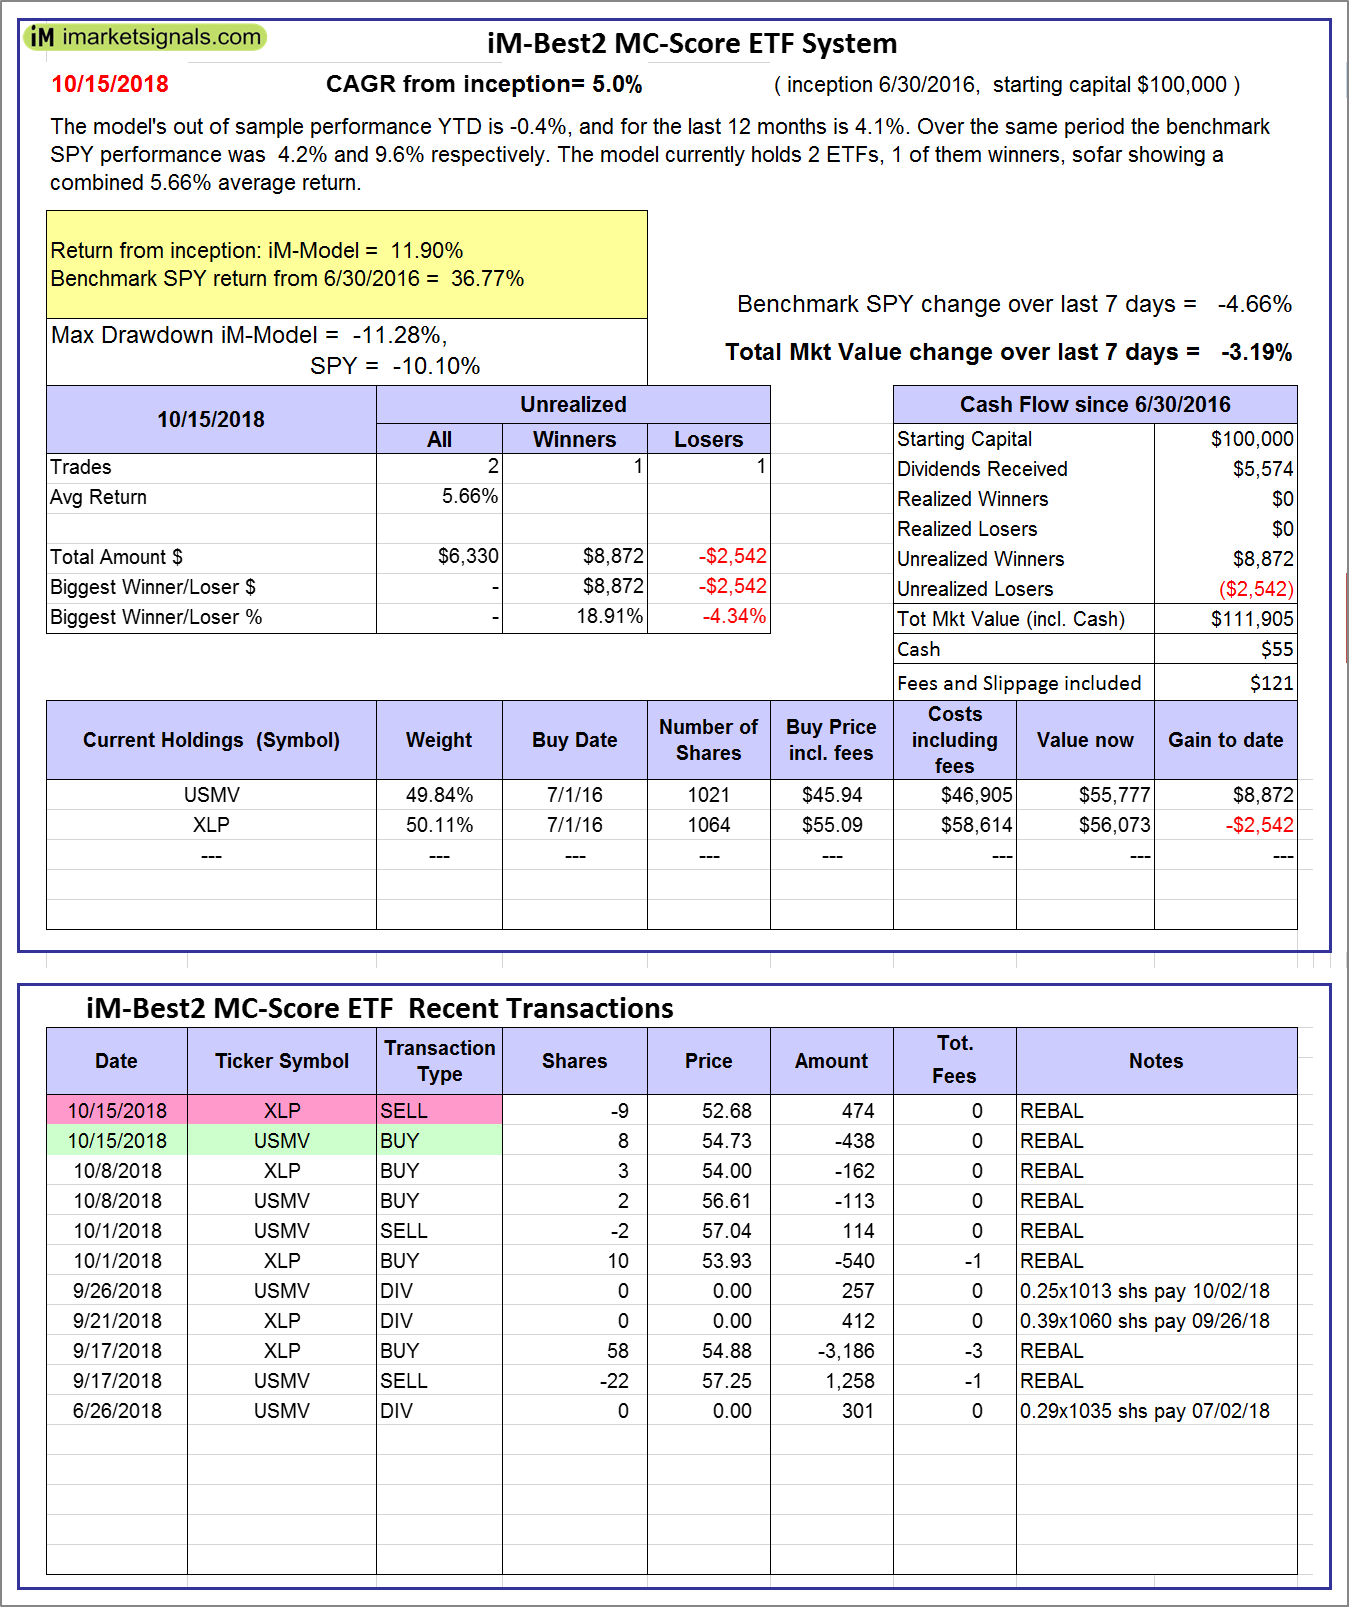 |
iM-Best2 MC-Score ETF System: The model’s out of sample performance YTD is -0.4%, and for the last 12 months is 4.1%. Over the same period the benchmark SPY performance was 4.2% and 9.6% respectively. Over the previous week the market value of the iM-Best2 MC-Score ETF System gained -3.19% at a time when SPY gained -4.66%. A starting capital of $100,000 at inception on 6/30/2016 would have grown to $111,905 which includes $55 cash and excludes $121 spent on fees and slippage. |
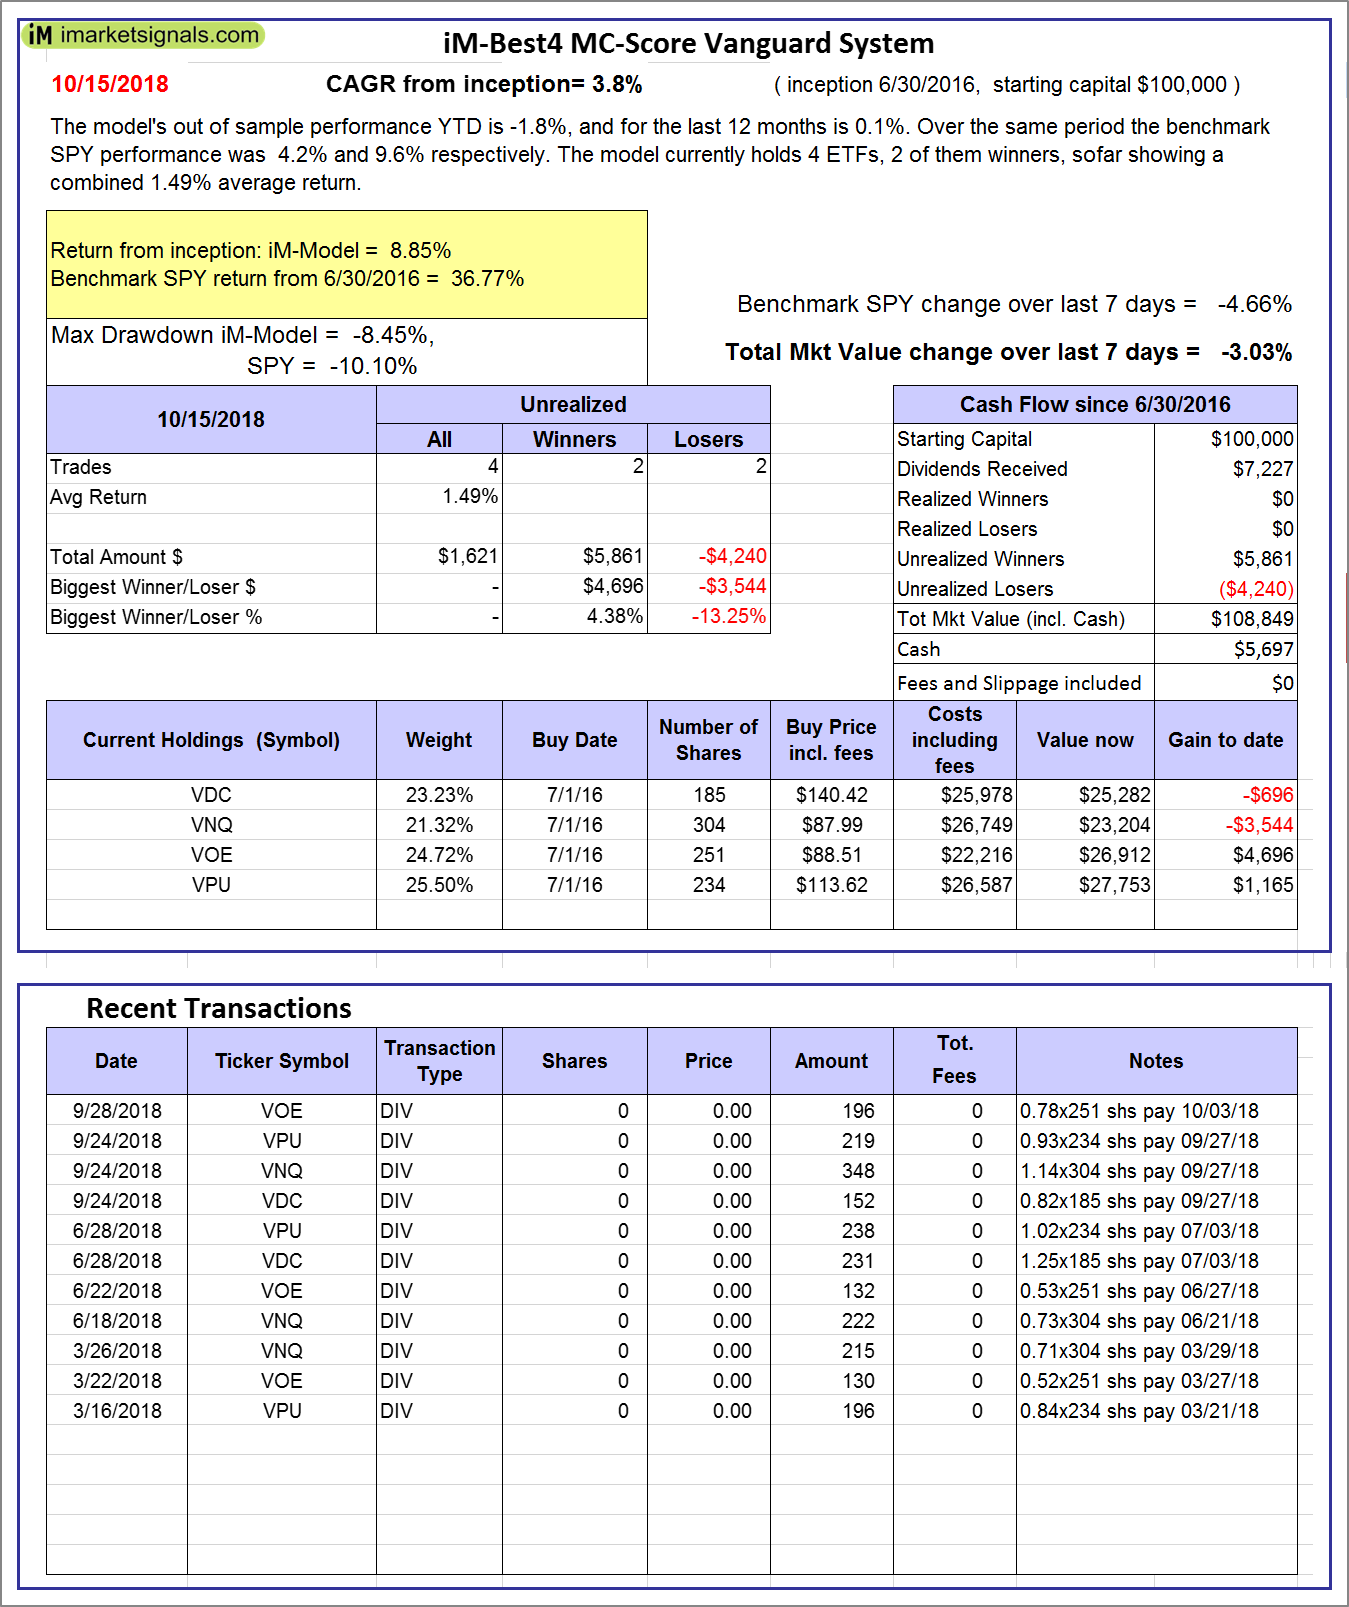 |
iM-Best4 MC-Score Vanguard System: The model’s out of sample performance YTD is -1.8%, and for the last 12 months is 0.1%. Over the same period the benchmark SPY performance was 4.2% and 9.6% respectively. Over the previous week the market value of the iM-Best4 MC-Score Vanguard System gained -3.03% at a time when SPY gained -4.66%. A starting capital of $100,000 at inception on 6/30/2016 would have grown to $108,849 which includes $5,697 cash and excludes $00 spent on fees and slippage. |
 |
iM-Composite (SH-RSP) Timer: The model’s out of sample performance YTD is 0.9%, and for the last 12 months is 6.0%. Over the same period the benchmark SPY performance was 4.2% and 9.6% respectively. Over the previous week the market value of the iM-Composite (SH-RSP) Timer gained -4.55% at a time when SPY gained -4.66%. A starting capital of $100,000 at inception on 6/30/2016 would have grown to $131,097 which includes $3,838 cash and excludes $513 spent on fees and slippage. |
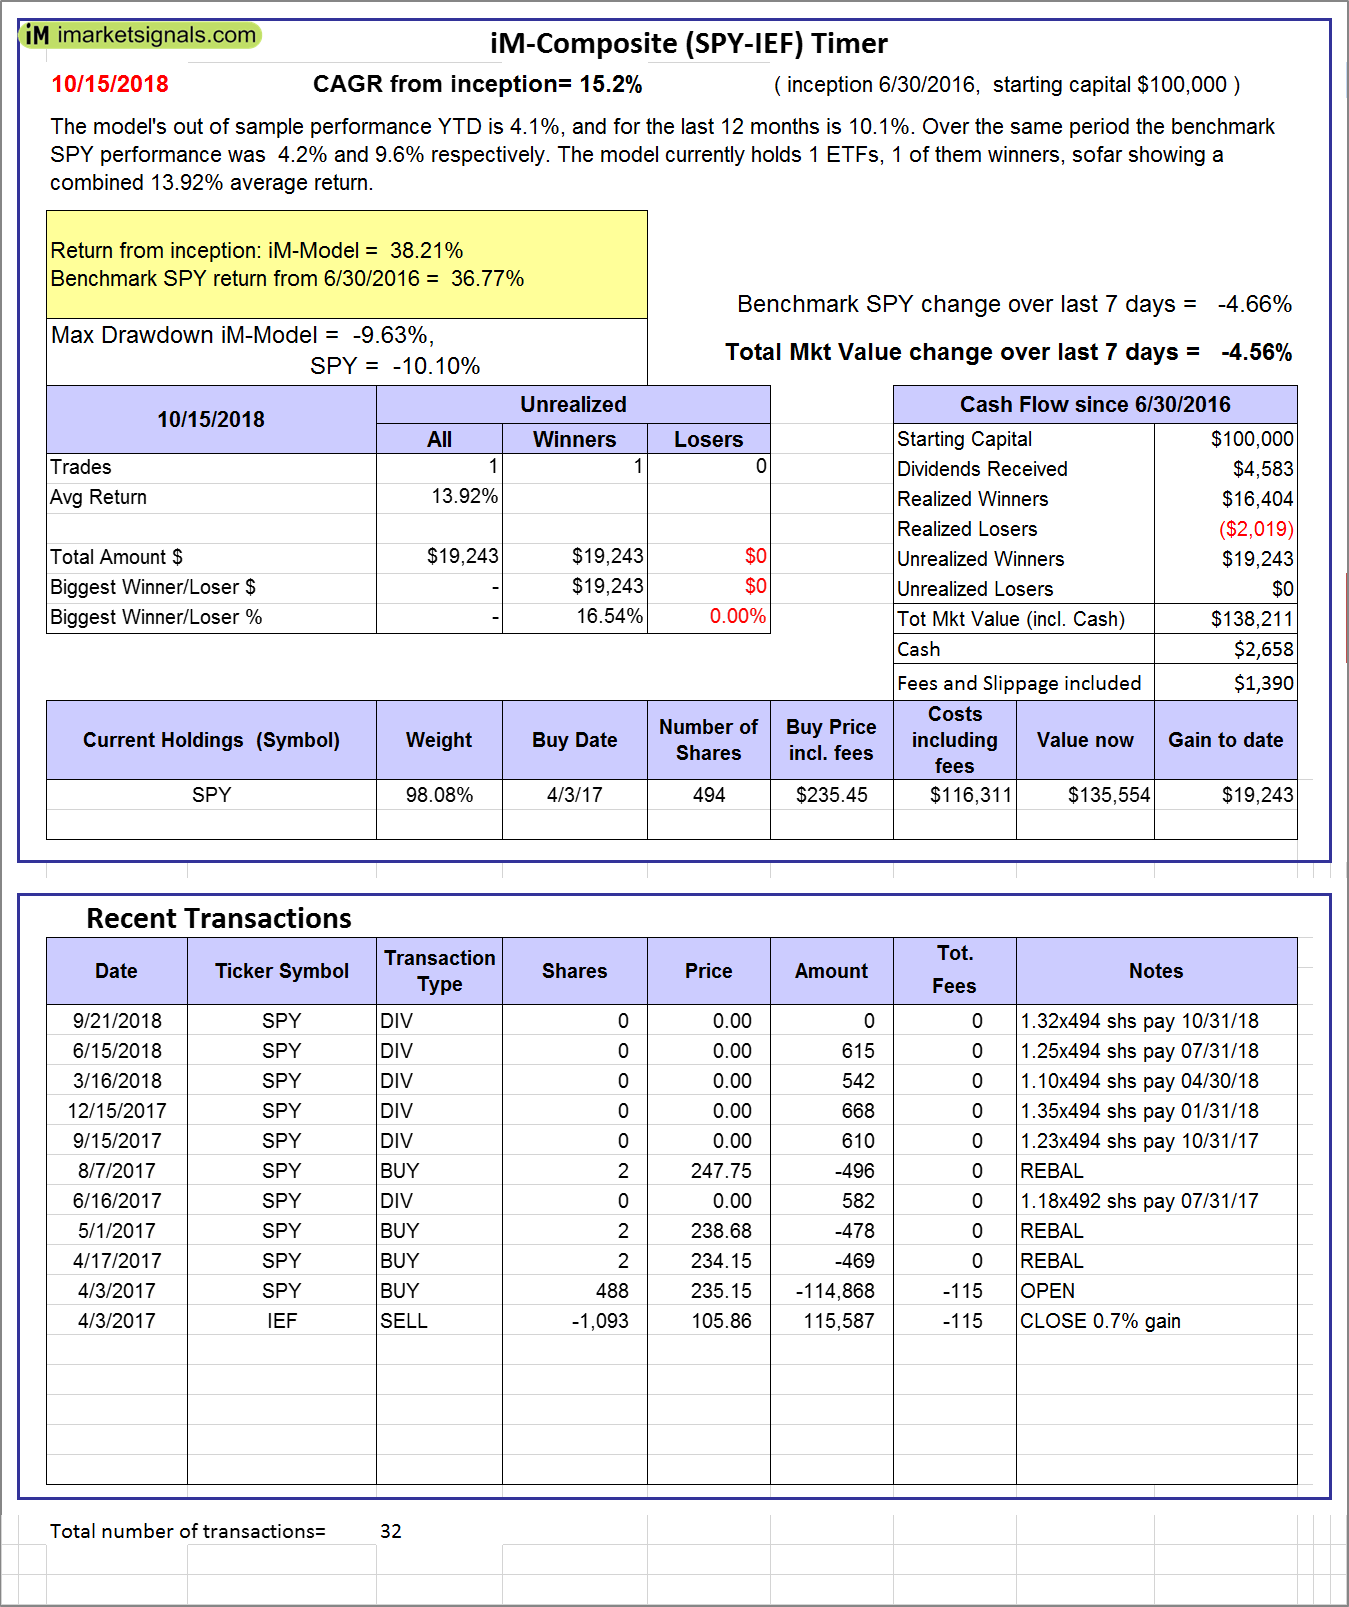 |
iM-Composite (SPY-IEF) Timer: The model’s out of sample performance YTD is 4.1%, and for the last 12 months is 10.1%. Over the same period the benchmark SPY performance was 4.2% and 9.6% respectively. Over the previous week the market value of the iM-Composite (SPY-IEF) Timer gained -4.56% at a time when SPY gained -4.66%. A starting capital of $100,000 at inception on 6/30/2016 would have grown to $138,211 which includes $2,658 cash and excludes $1,390 spent on fees and slippage. |
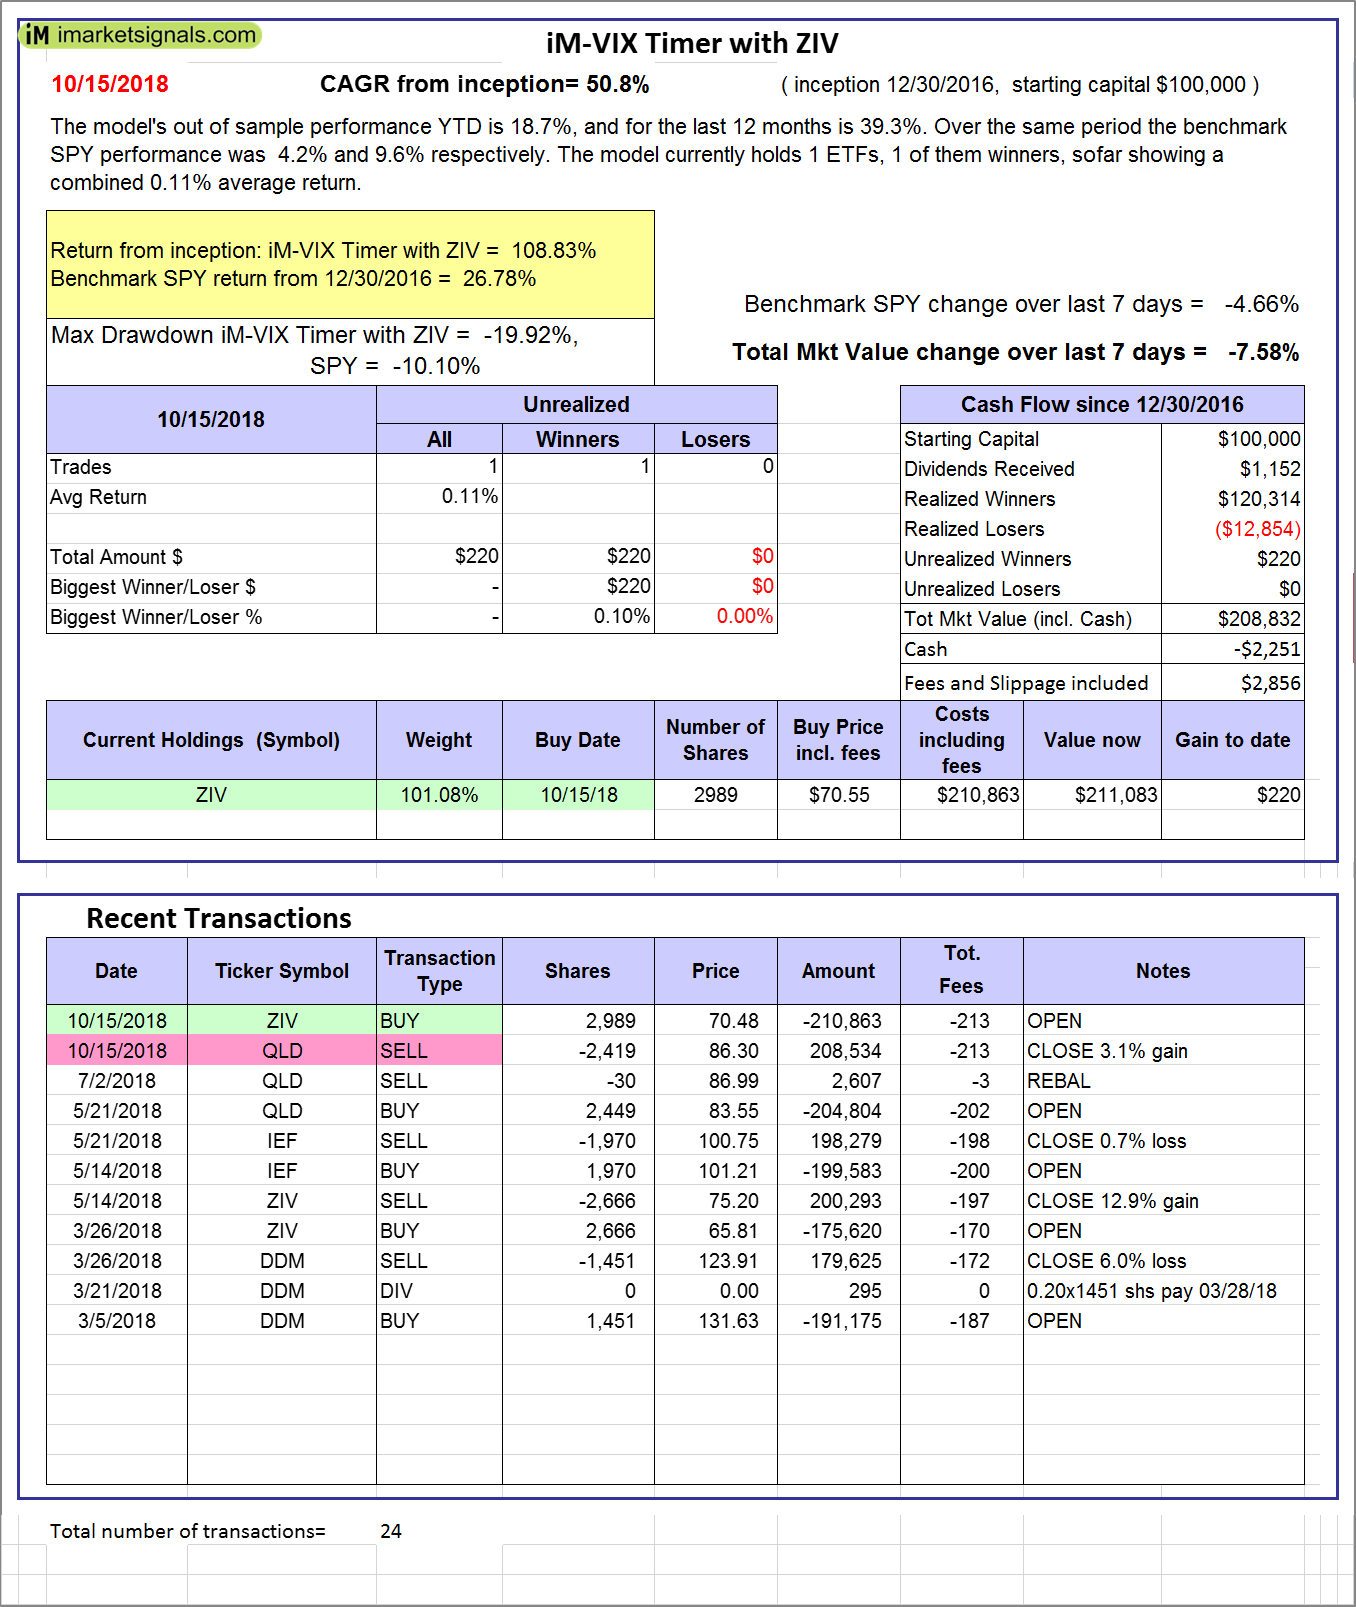 |
iM-VIX Timer with ZIV: The model’s out of sample performance YTD is 18.7%, and for the last 12 months is 39.3%. Over the same period the benchmark SPY performance was 4.2% and 9.6% respectively. Over the previous week the market value of the iM-VIX Timer with ZIV gained -7.58% at a time when SPY gained -4.66%. A starting capital of $100,000 at inception on 6/30/2016 would have grown to $208,832 which includes -$2,251 cash and excludes $2,856 spent on fees and slippage. |
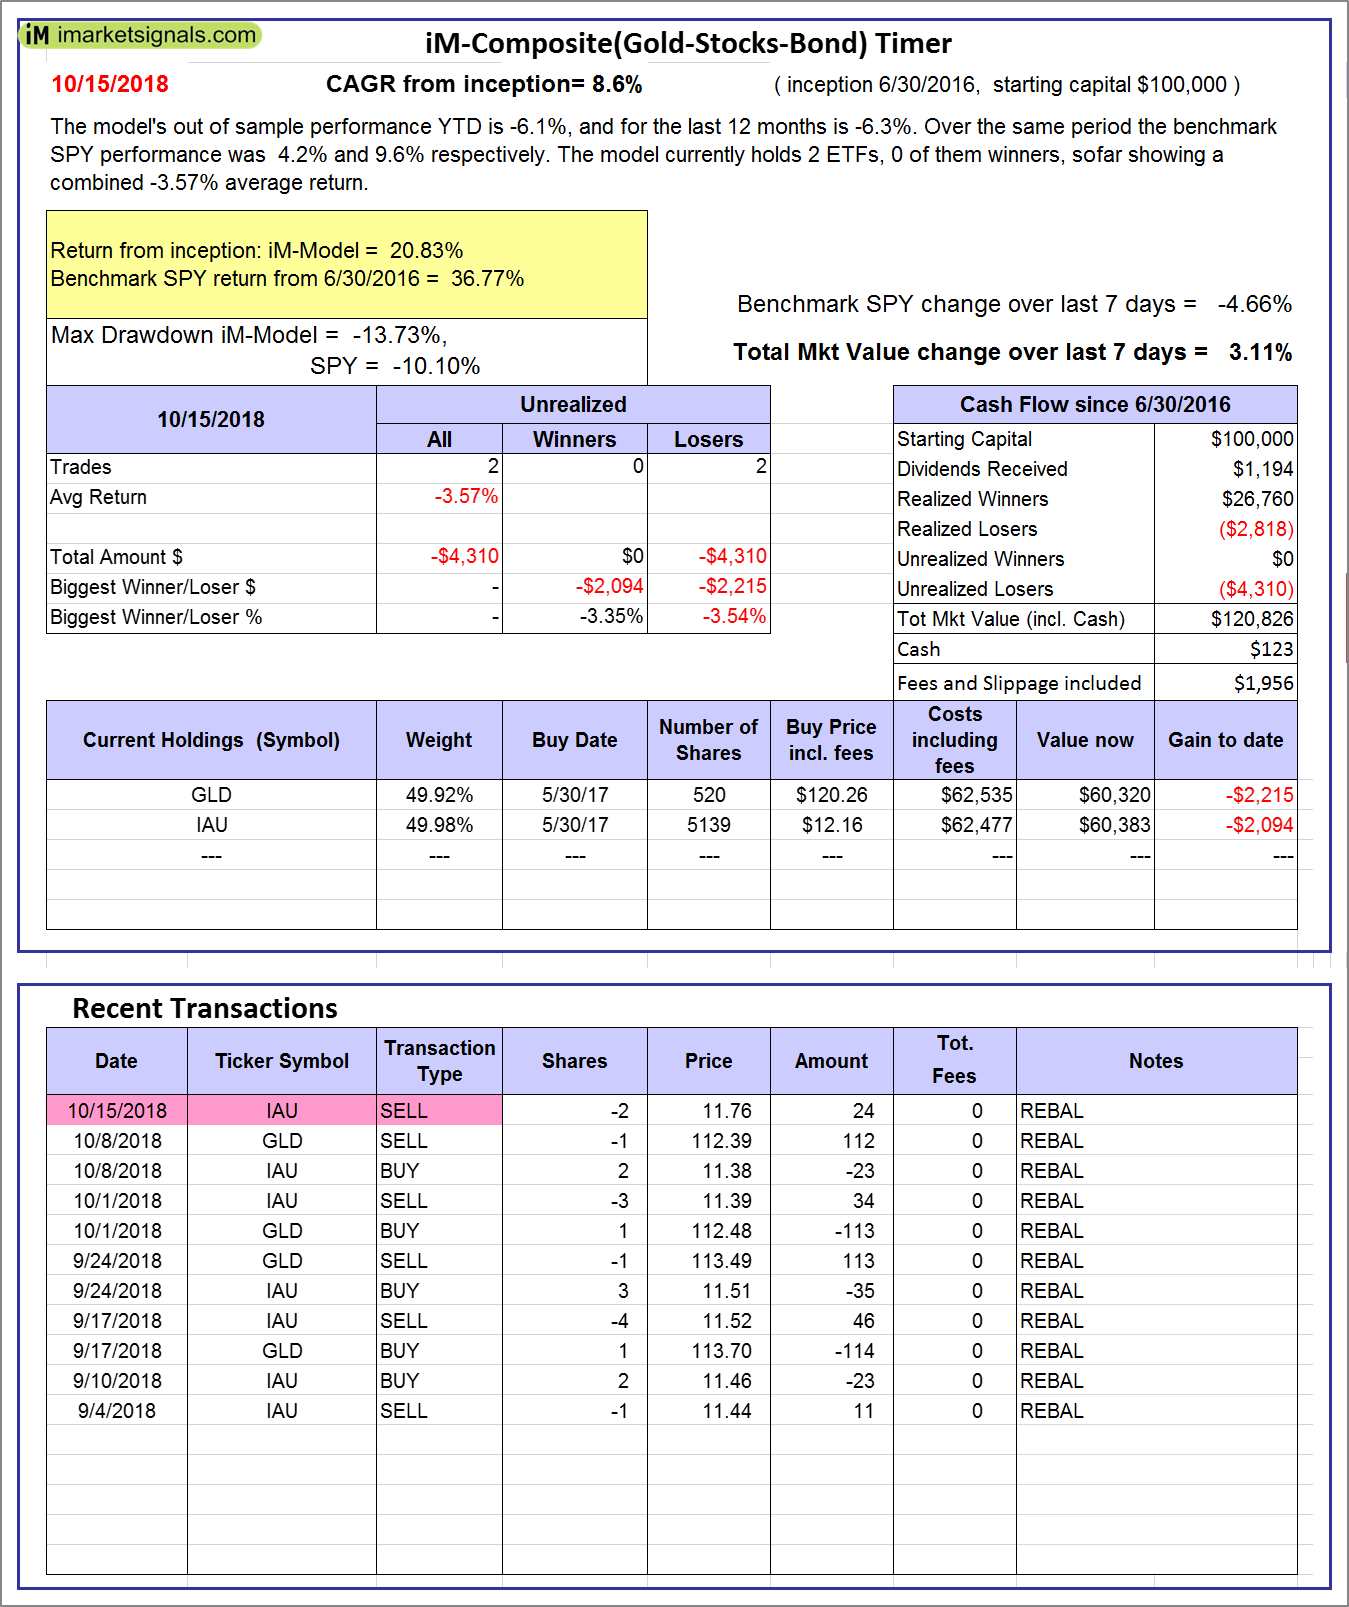 |
iM-Composite(Gold-Stocks-Bond) Timer: The model’s out of sample performance YTD is -6.1%, and for the last 12 months is -6.3%. Over the same period the benchmark SPY performance was 4.2% and 9.6% respectively. Over the previous week the market value of the iM-Composite(Gold-Stocks-Bond) Timer gained 3.11% at a time when SPY gained -4.66%. A starting capital of $100,000 at inception on 6/30/2016 would have grown to $120,826 which includes $123 cash and excludes $1,956 spent on fees and slippage. |
 |
iM-Low Turnover Composite Timer Combo: The model’s out of sample performance YTD is -3.3%, and for the last 12 months is -1.4%. Over the same period the benchmark SPY performance was 4.2% and 9.6% respectively. Over the previous week the market value of the iM-Low Turnover Composite Timer Combo gained -0.41% at a time when SPY gained -4.66%. A starting capital of $100,000 at inception on 3/24/27 would have grown to $103,581 which includes $678 cash and excludes $76 spent on fees and slippage. |
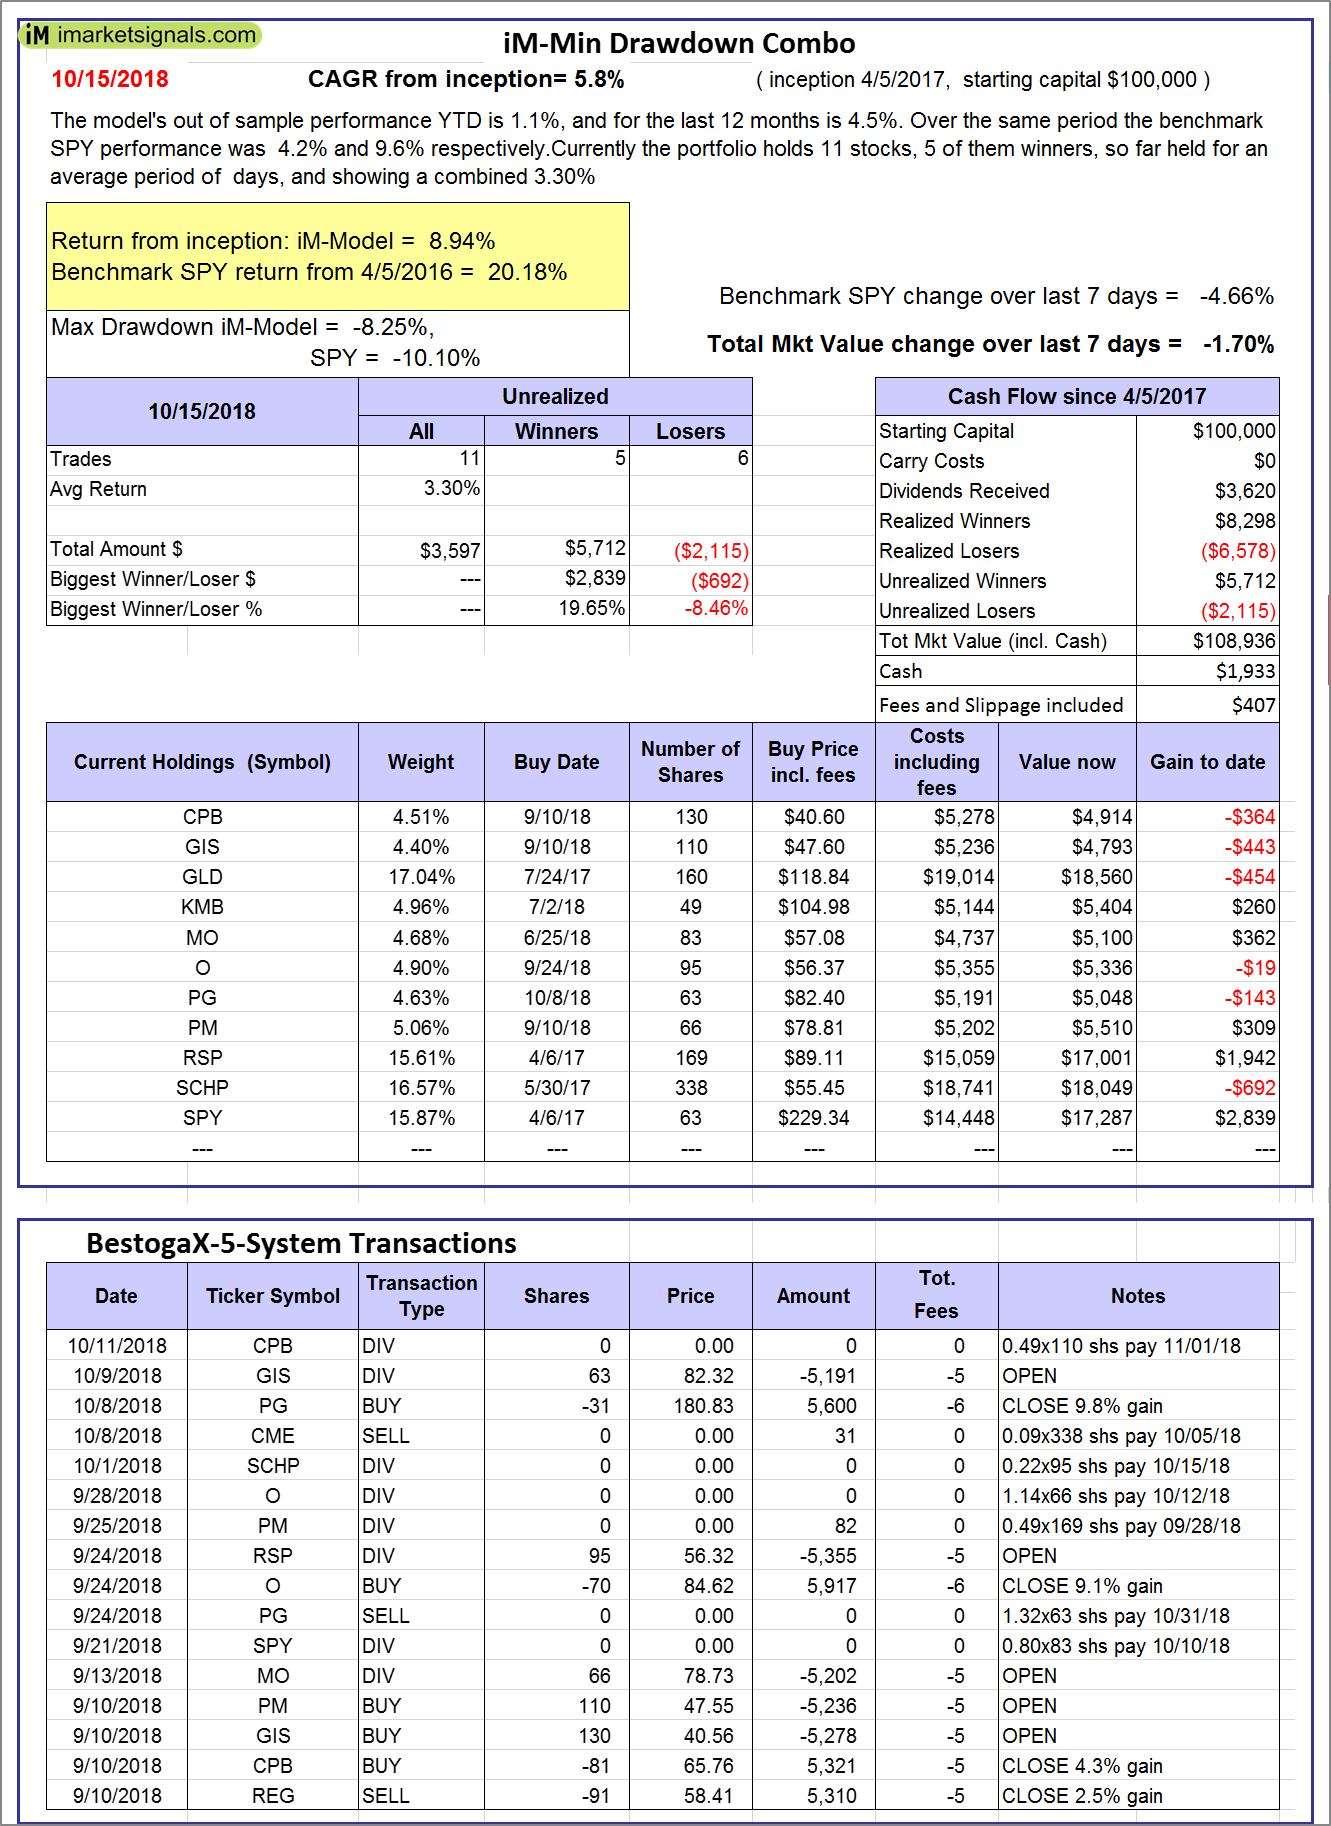 |
iM-Min Drawdown Combo: The model’s out of sample performance YTD is 1.1%, and for the last 12 months is 4.5%. Over the same period the benchmark SPY performance was 4.2% and 9.6% respectively. Over the previous week the market value of the iM-Min Drawdown Combo gained -1.70% at a time when SPY gained -4.66%. A starting capital of $100,000 at inception on 4/5/2017 would have grown to $108,936 which includes $1,933 cash and excludes $407 spent on fees and slippage. |
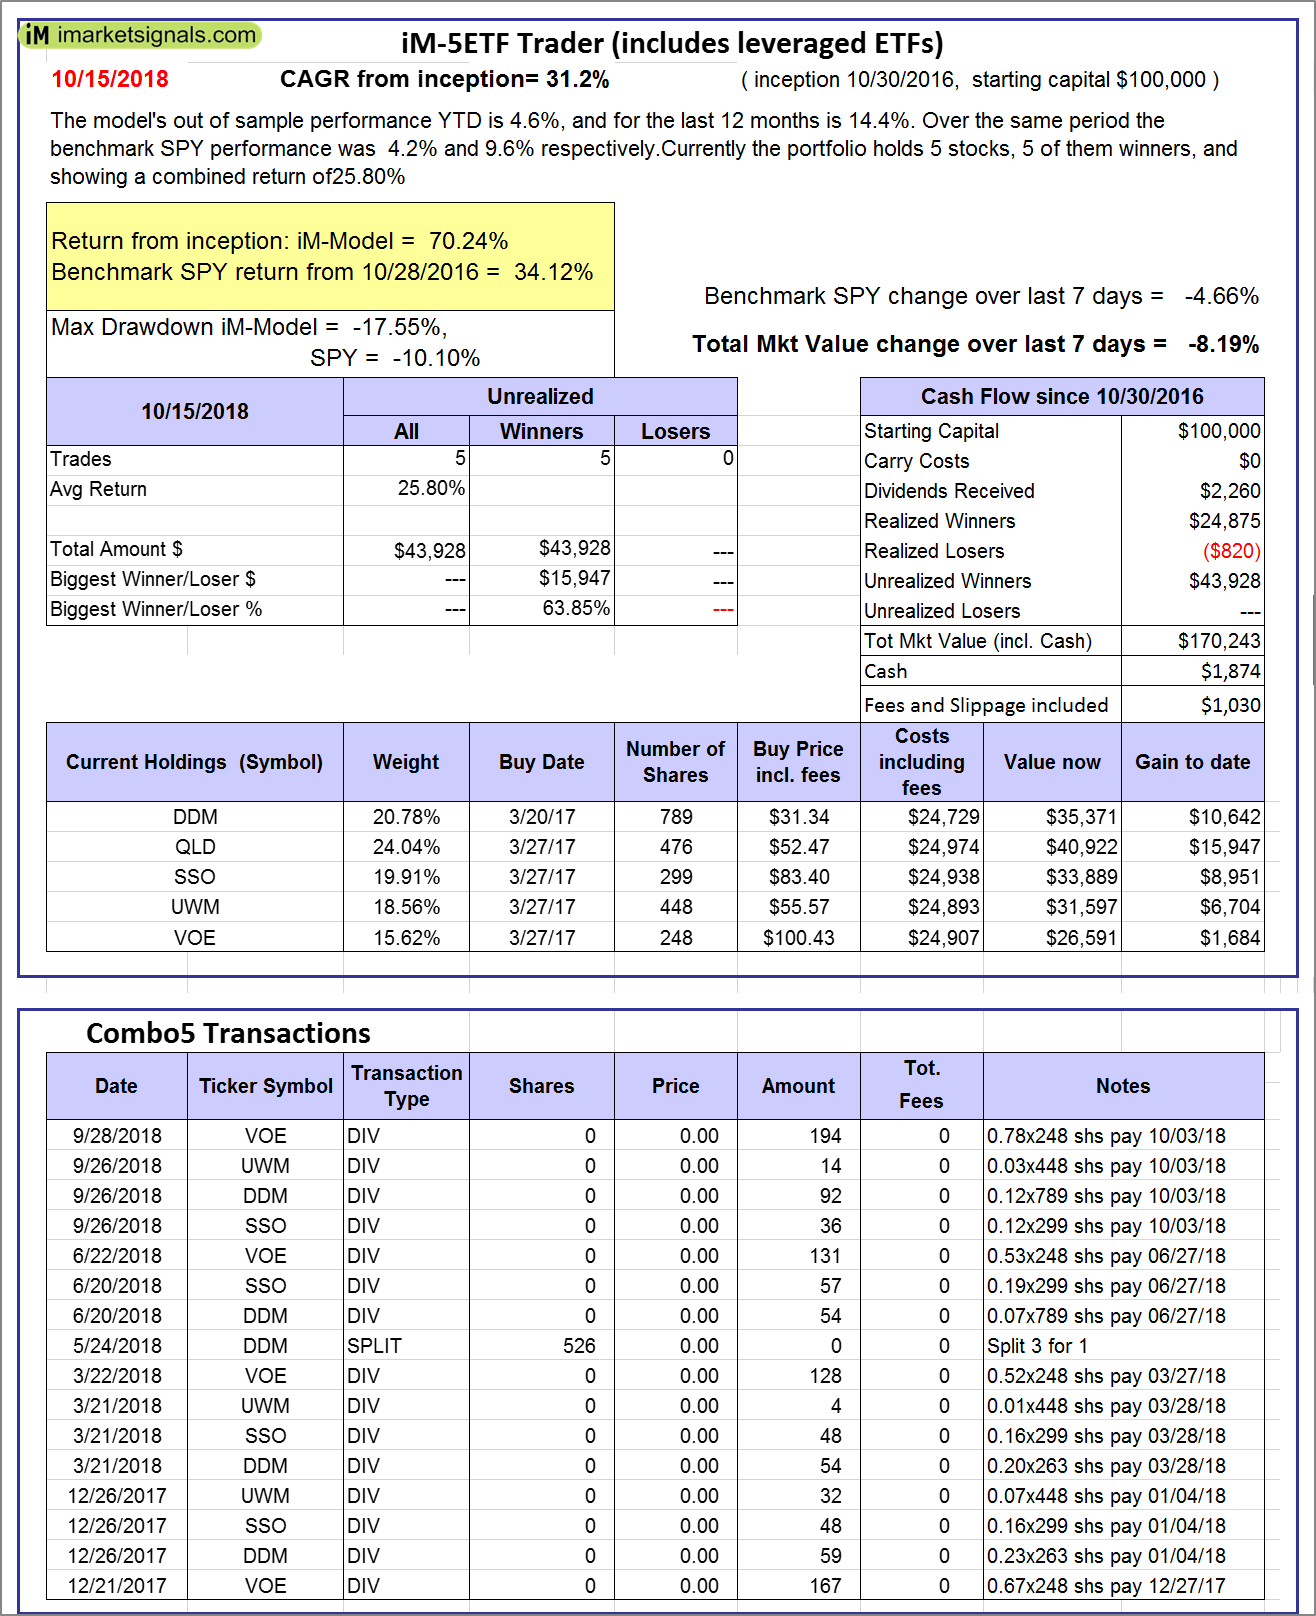 |
iM-5ETF Trader (includes leveraged ETFs): The model’s out of sample performance YTD is 4.6%, and for the last 12 months is 14.4%. Over the same period the benchmark SPY performance was 4.2% and 9.6% respectively. Over the previous week the market value of the iM-5ETF Trader (includes leveraged ETFs) gained -8.19% at a time when SPY gained -4.66%. A starting capital of $100,000 at inception on 10/30/2016 would have grown to $170,243 which includes $1,874 cash and excludes $1,030 spent on fees and slippage. |
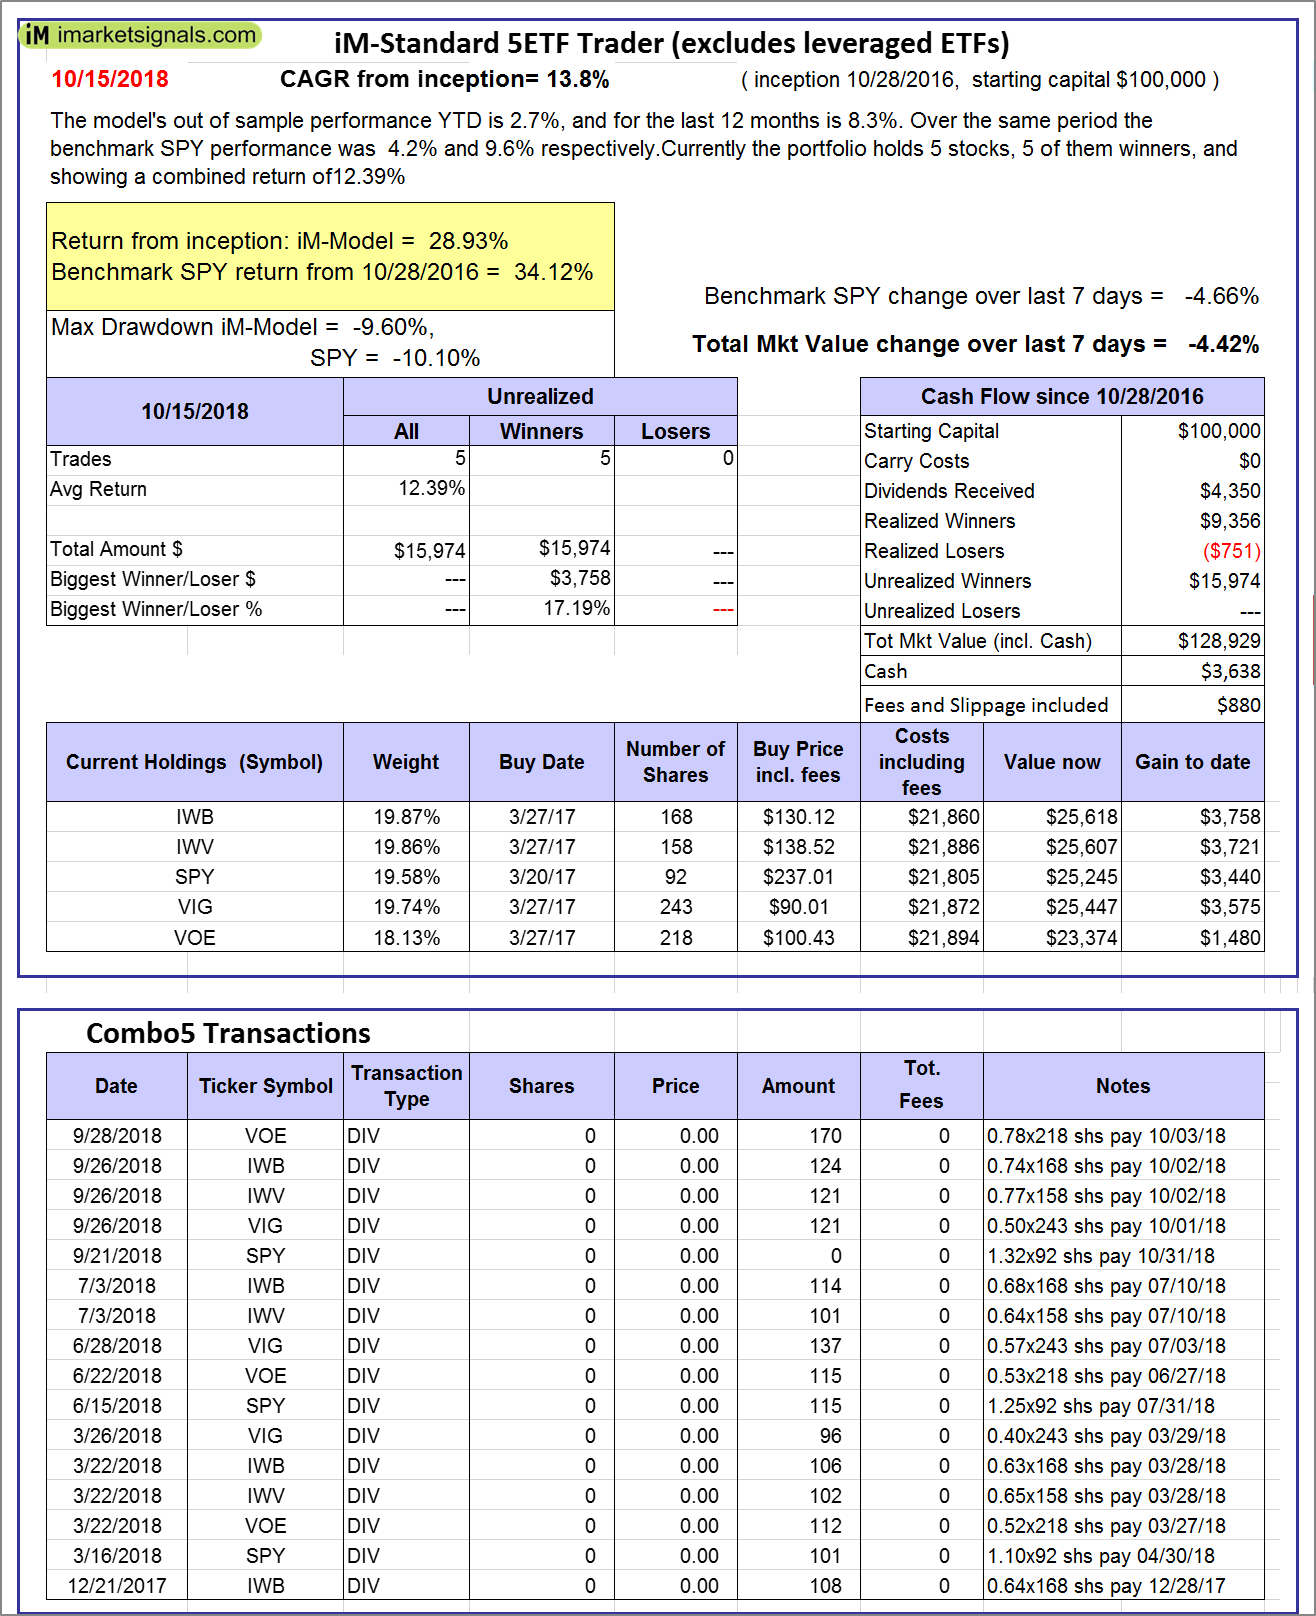 |
iM-Standard 5ETF Trader (excludes leveraged ETFs): The model’s out of sample performance YTD is 2.7%, and for the last 12 months is 8.3%. Over the same period the benchmark SPY performance was 4.2% and 9.6% respectively. Over the previous week the market value of the iM-Standard 5ETF Trader (excludes leveraged ETFs) gained -4.42% at a time when SPY gained -4.66%. A starting capital of $100,000 at inception on 10/30/2016 would have grown to $128,929 which includes $3,638 cash and excludes $880 spent on fees and slippage. |
iM-Best Reports – 10/15/2018
Posted in pmp SPY-SH
Leave a Reply
You must be logged in to post a comment.