
  |
Out of sample performance summary of our models for the past 1, 2, 4 and 13 week periods. The active active return indicates how the models over- or underperformed the benchmark ETF SPY. Also the YTD, and the 1-, 3-, 5- and 10-year annualized returns are shown in the second table |
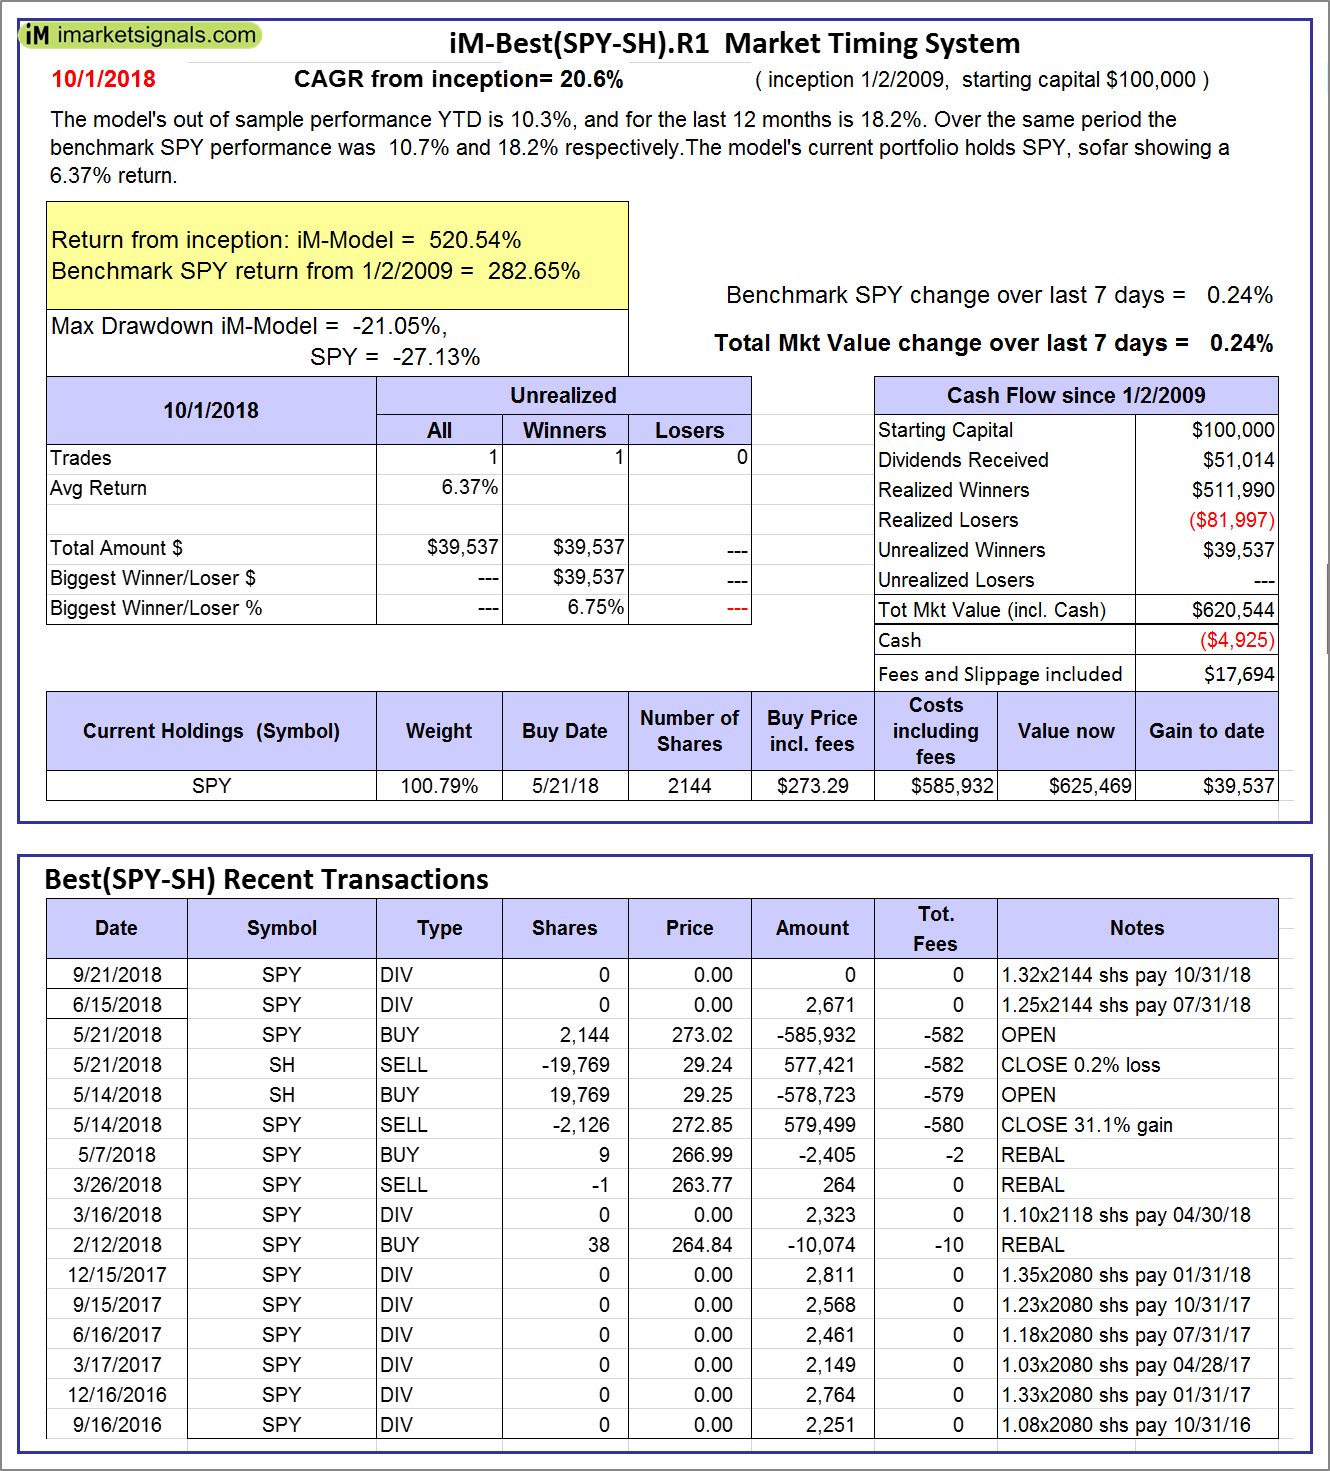 |
iM-Best(SPY-SH).R1: The model’s out of sample performance YTD is 10.3%, and for the last 12 months is 18.2%. Over the same period the benchmark SPY performance was 10.7% and 18.2% respectively. Over the previous week the market value of Best(SPY-SH) gained 0.24% at a time when SPY gained 0.24%. A starting capital of $100,000 at inception on 1/2/2009 would have grown to $620,544 which includes -$4,925 cash and excludes $17,694 spent on fees and slippage. |
 |
iM-Combo3.R1: The model’s out of sample performance YTD is 11.5%, and for the last 12 months is 22.4%. Over the same period the benchmark SPY performance was 10.7% and 18.2% respectively. Over the previous week the market value of iM-Combo3.R1 gained 0.51% at a time when SPY gained 0.24%. A starting capital of $100,000 at inception on 2/3/2014 would have grown to $175,836 which includes -$921 cash and excludes $4,125 spent on fees and slippage. |
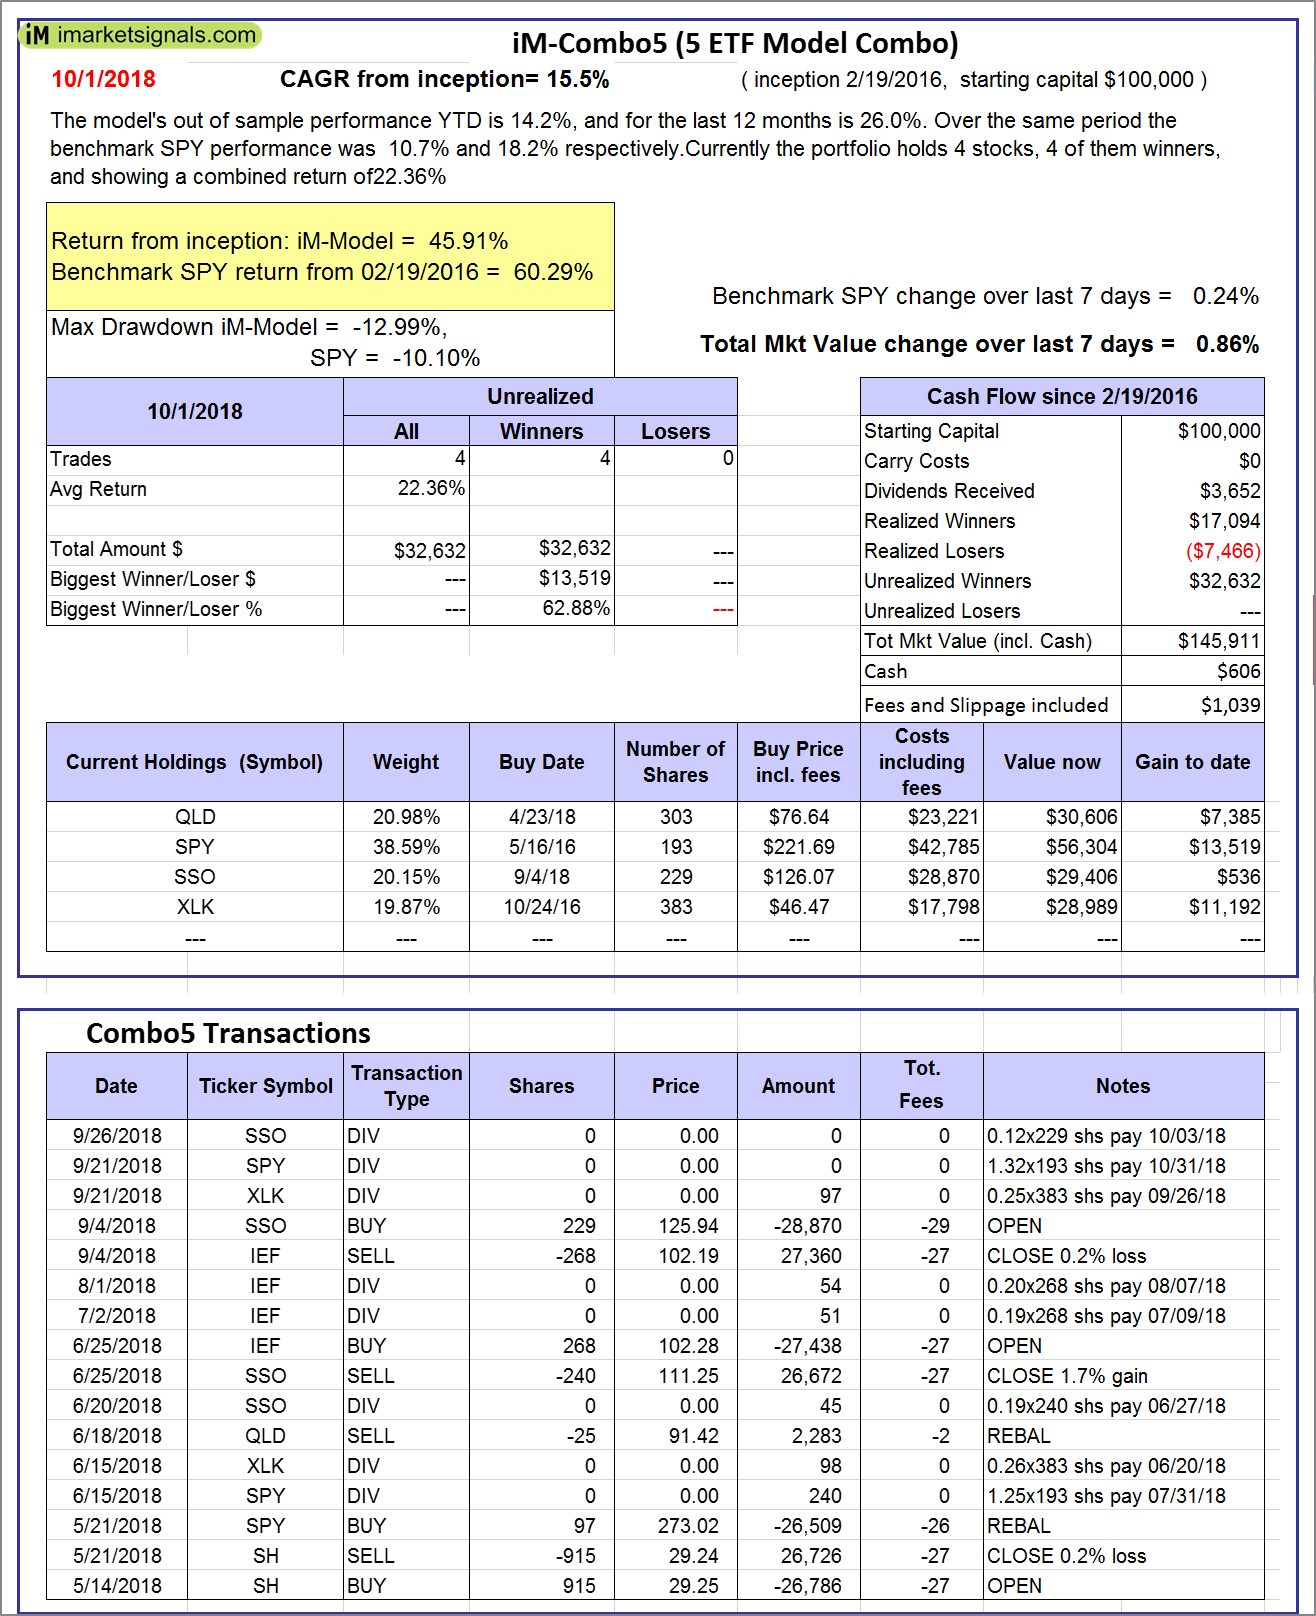 |
iM-Combo5: The model’s out of sample performance YTD is 14.2%, and for the last 12 months is 26.0%. Over the same period the benchmark SPY performance was 10.7% and 18.2% respectively. Over the previous week the market value of iM-Combo5 gained 0.86% at a time when SPY gained 0.24%. A starting capital of $100,000 at inception on 2/22/2016 would have grown to $145,911 which includes $606 cash and excludes $1,039 spent on fees and slippage. |
 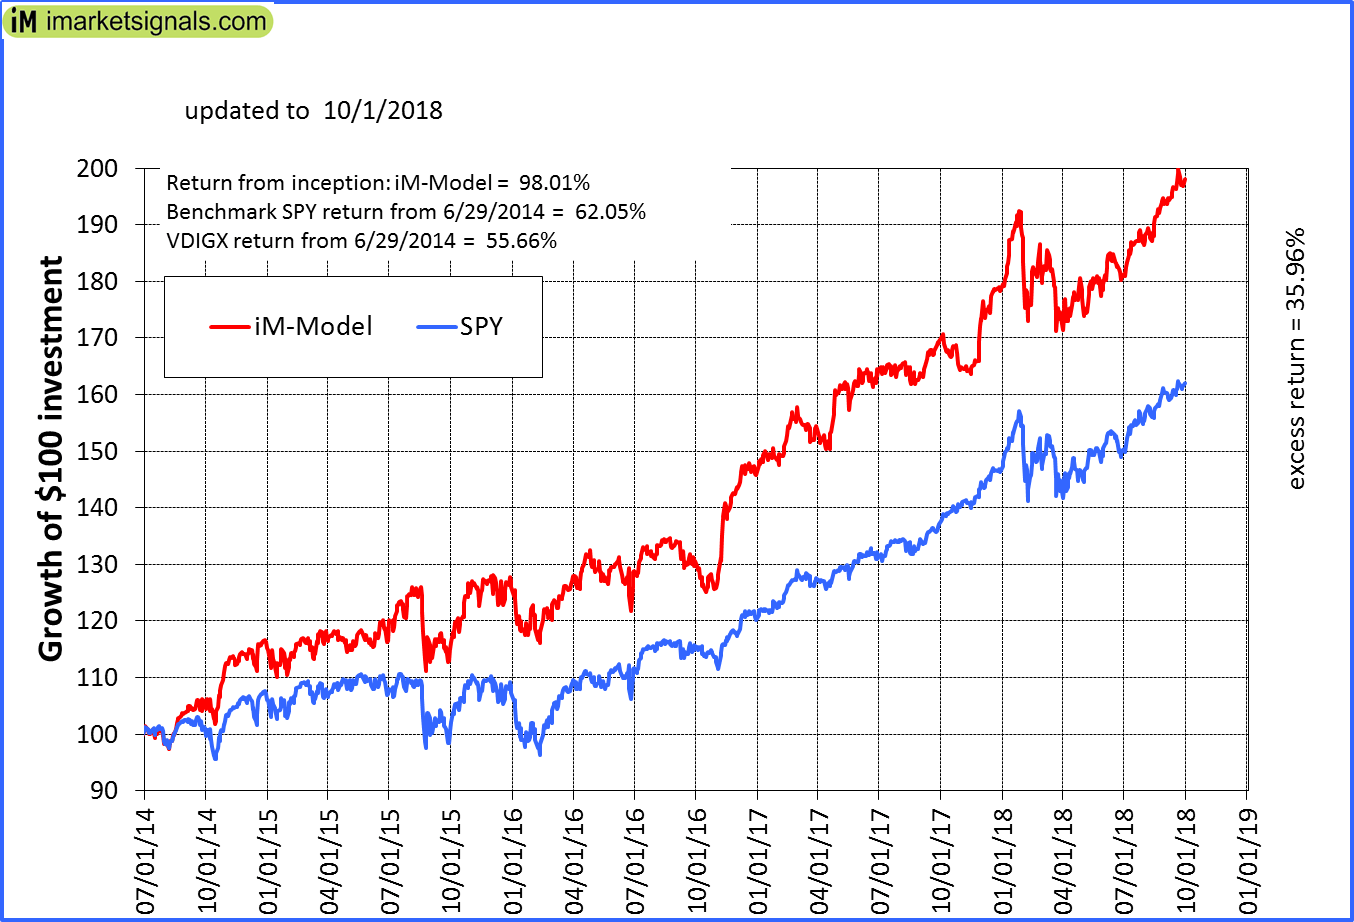 |
iM-Best10(VDIGX)-Trader: The model’s out of sample performance YTD is 11.1%, and for the last 12 months is 16.9%. Over the same period the benchmark SPY performance was 10.7% and 18.2% respectively. Since inception, on 7/1/2014, the model gained 98.01% while the benchmark SPY gained 62.05% and VDIGX gained 55.66% over the same period. Over the previous week the market value of iM-Best10(VDIGX) gained -0.20% at a time when SPY gained 0.24%. A starting capital of $100,000 at inception on 7/1/2014 would have grown to $198,014 which includes $98 cash and excludes $2,382 spent on fees and slippage. |
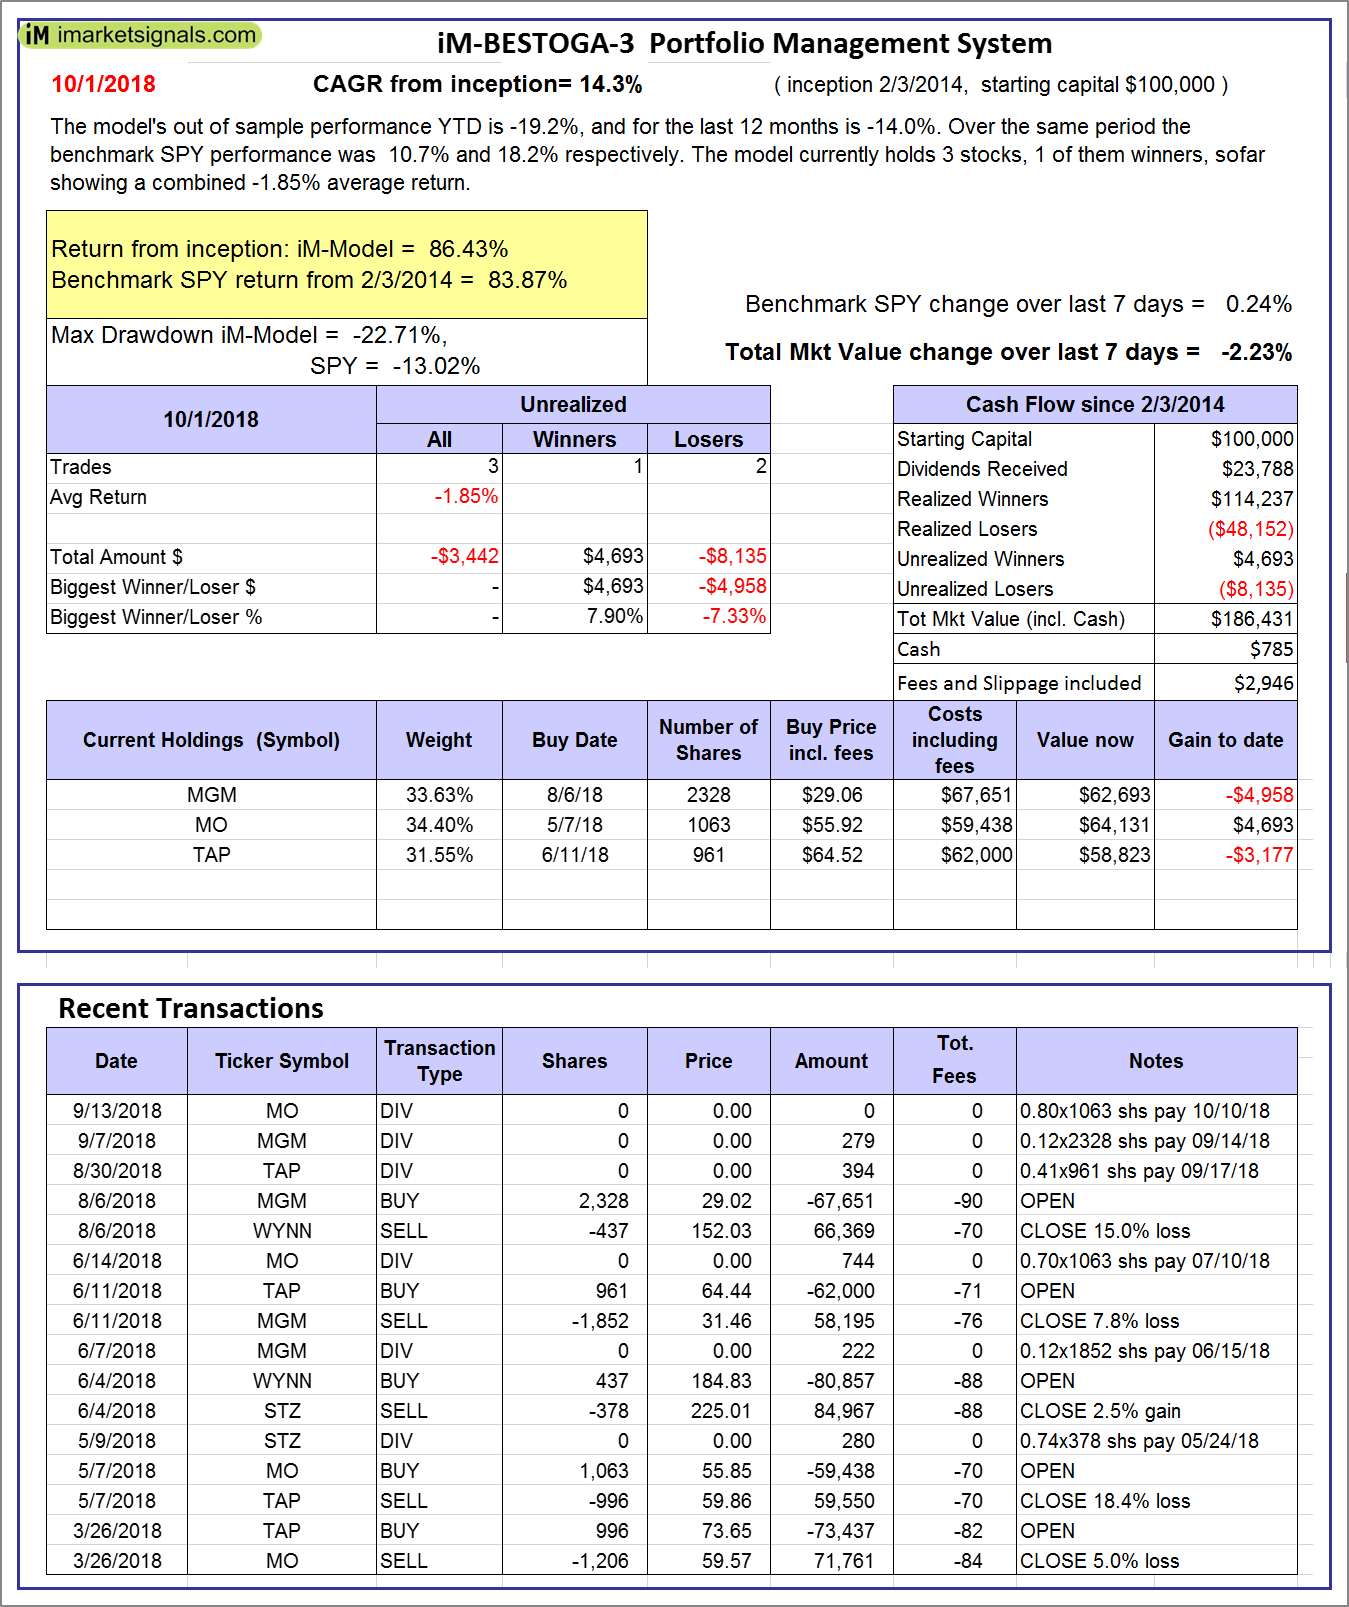 |
iM-BESTOGA-3: The model’s out of sample performance YTD is -19.2%, and for the last 12 months is -14.0%. Over the same period the benchmark SPY performance was 10.7% and 18.2% respectively. Over the previous week the market value of iM-BESTOGA-3 gained -2.23% at a time when SPY gained 0.24%. A starting capital of $100,000 at inception on 2/3/2014 would have grown to $186,431 which includes $785 cash and excludes $2,946 spent on fees and slippage. |
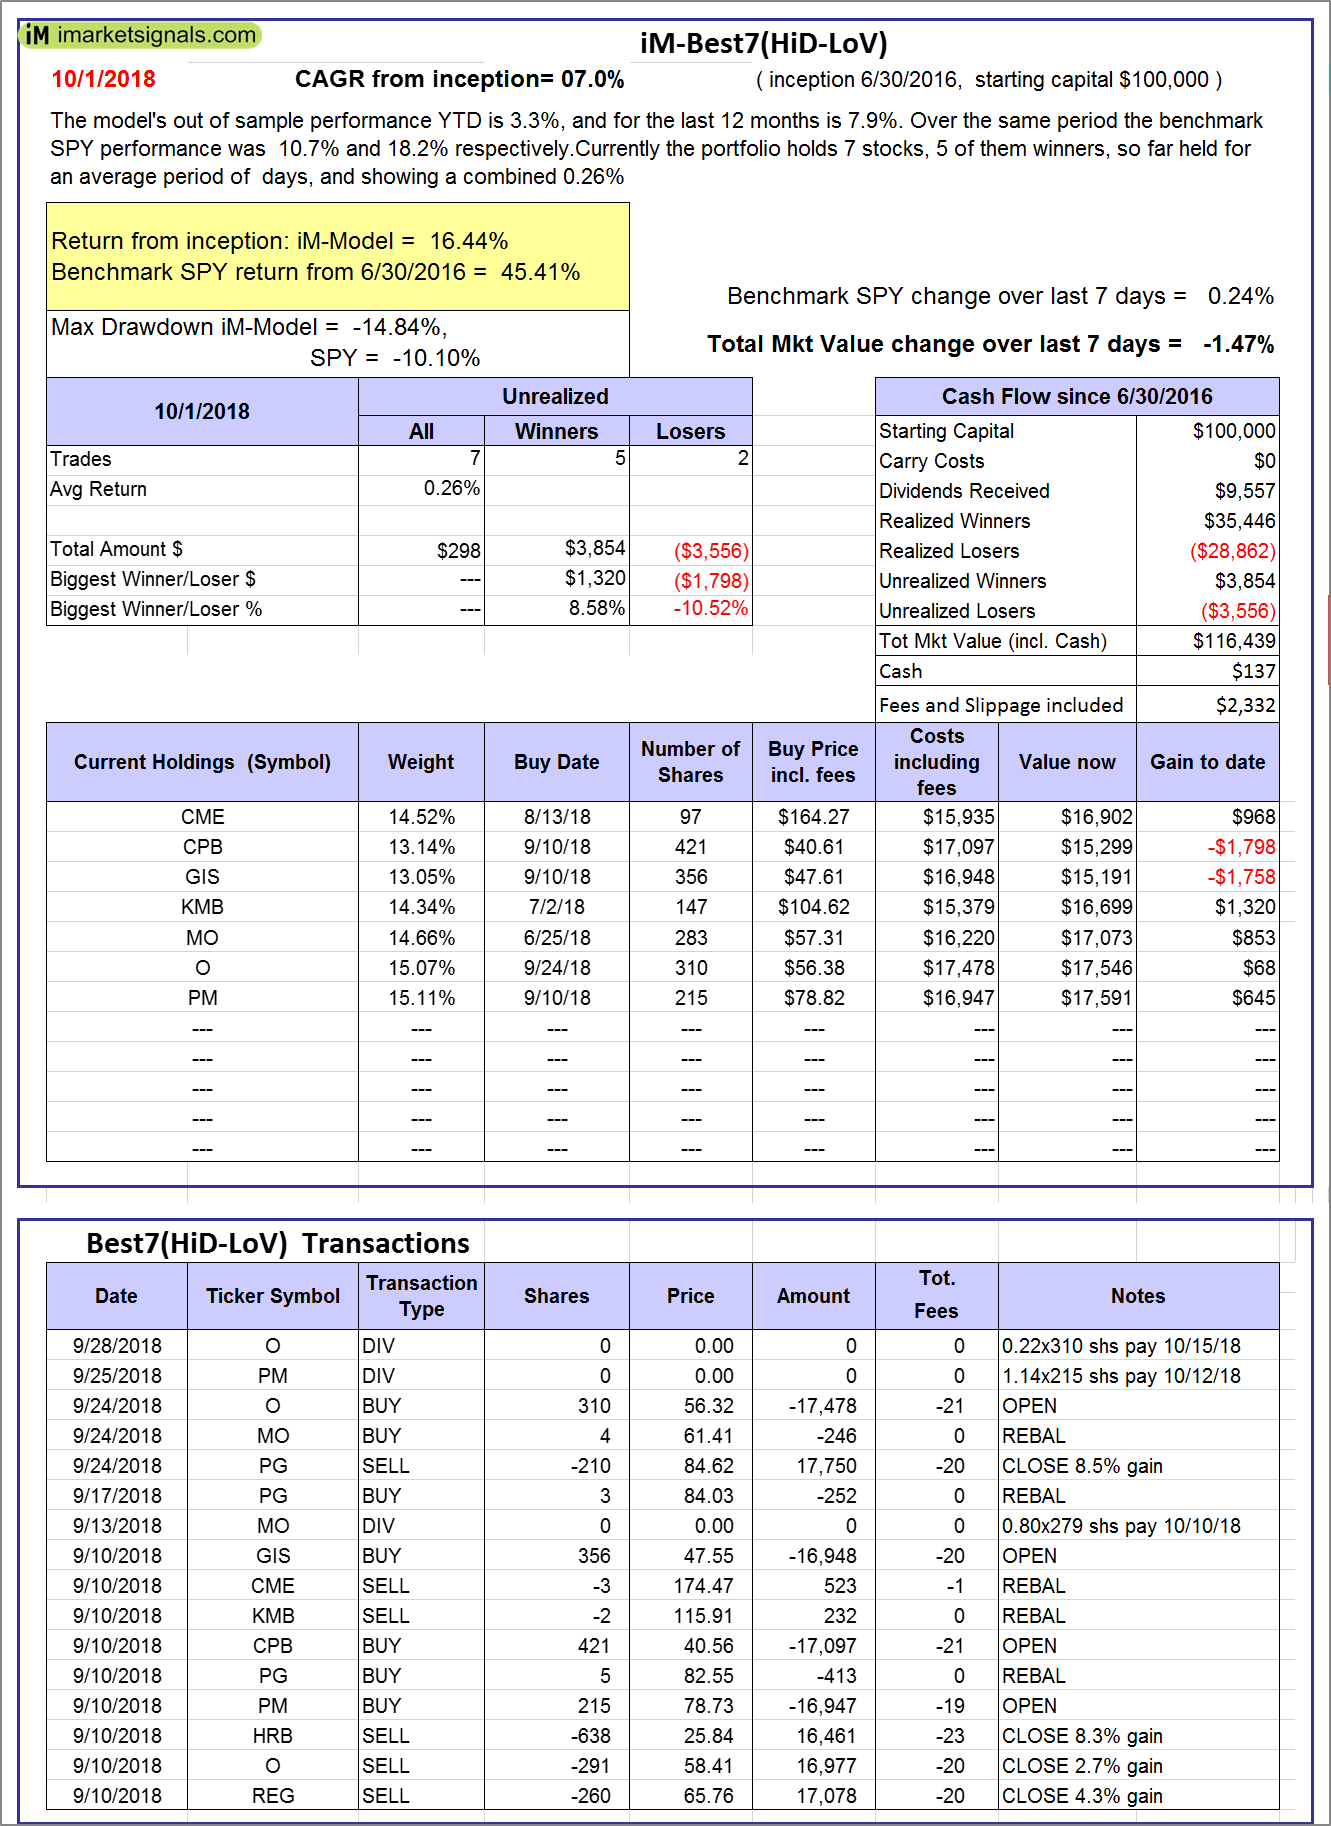 |
iM-Best7(HiD-LoV): The model’s out of sample performance YTD is 3.3%, and for the last 12 months is 7.9%. Over the same period the benchmark SPY performance was 10.7% and 18.2% respectively. Over the previous week the market value of iM-BESTOGA-3 gained -1.47% at a time when SPY gained 0.24%. A starting capital of $100,000 at inception on 6/30/2016 would have grown to $116,439 which includes $137 cash and excludes $2,332 spent on fees and slippage. |
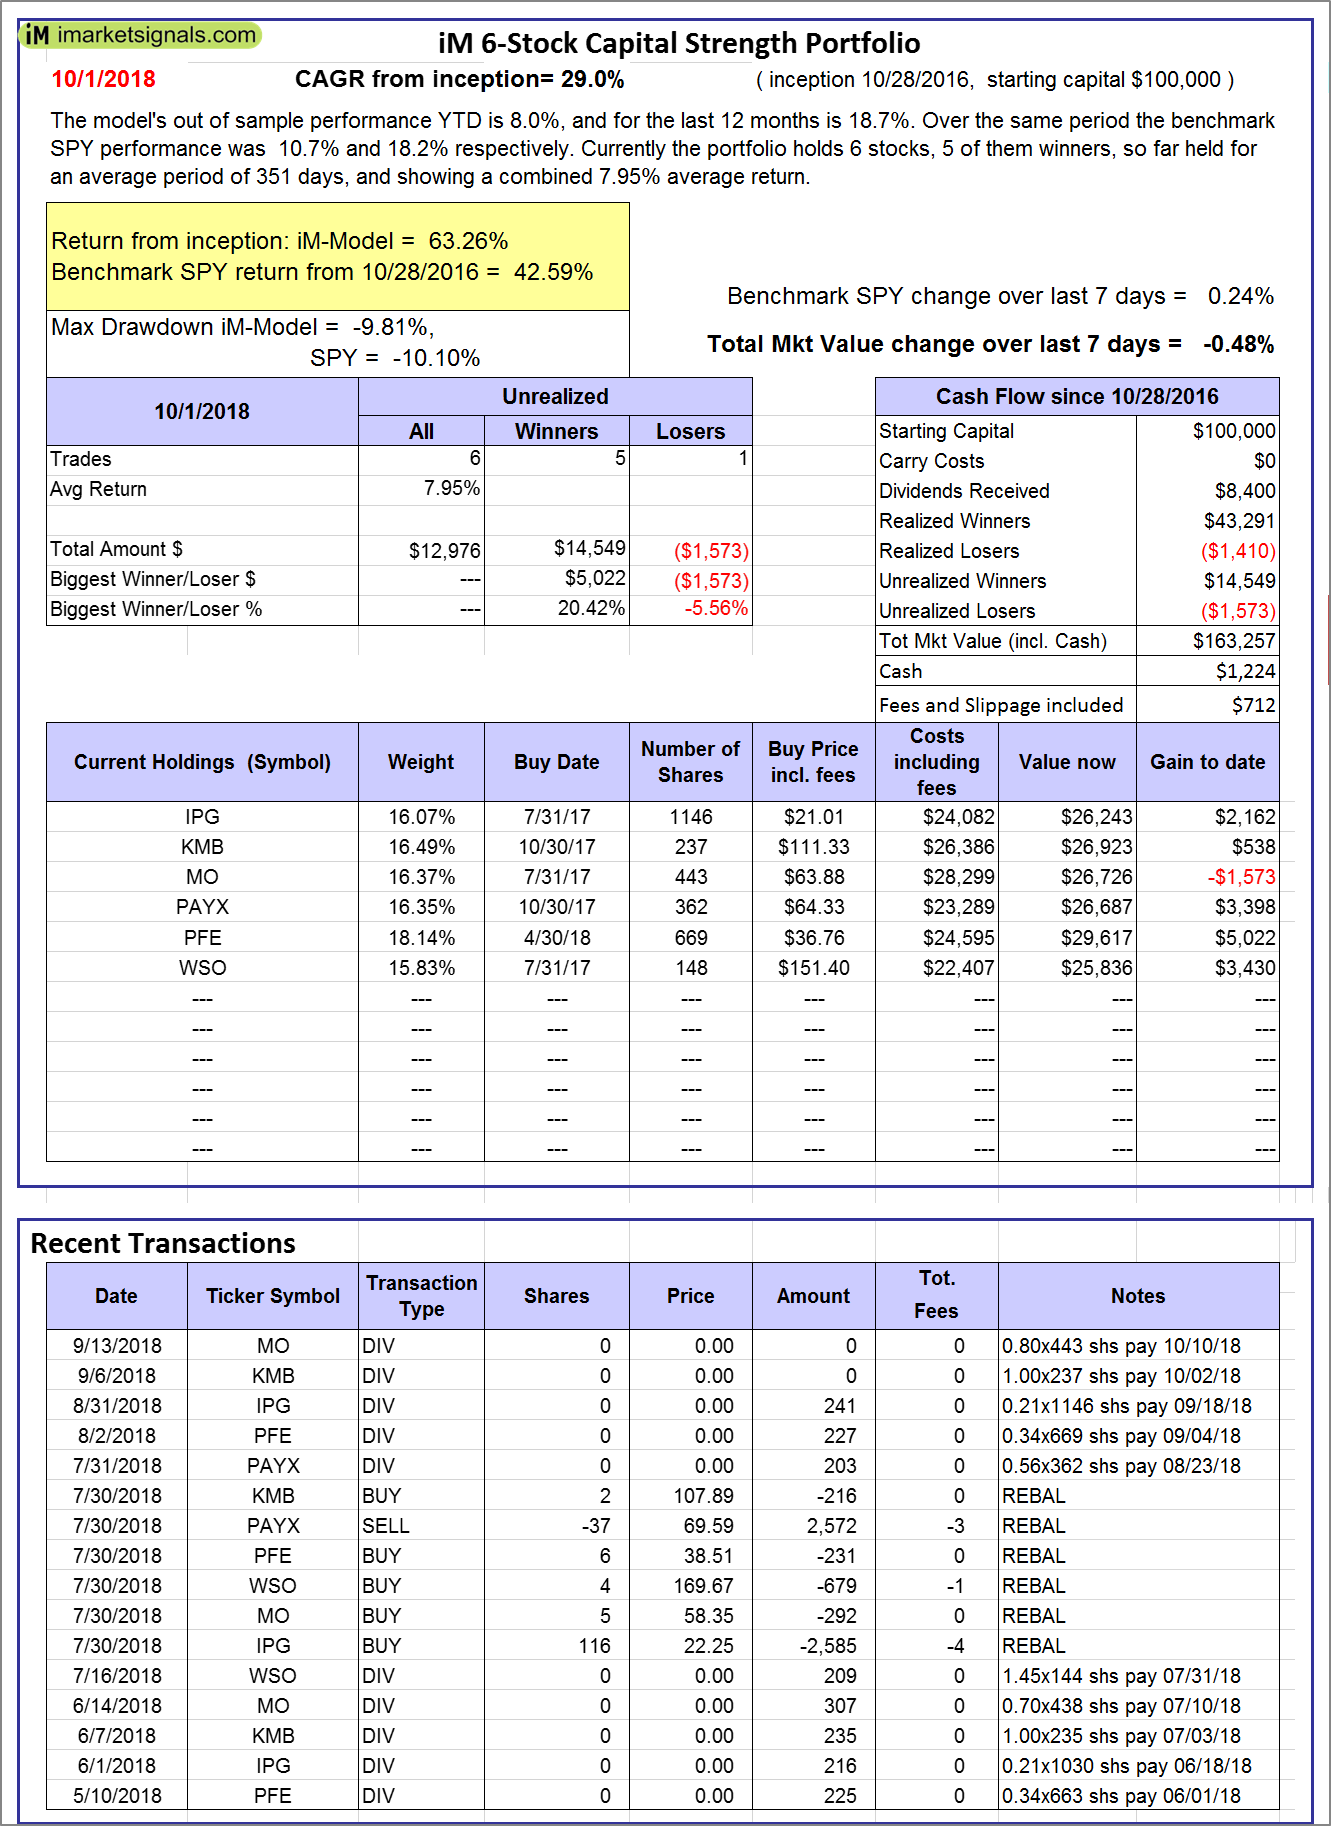 |
iM 6-Stock Capital Strength Portfolio: The model’s out of sample performance YTD is 8.0%, and for the last 12 months is 18.7%. Over the same period the benchmark SPY performance was 10.7% and 18.2% respectively. Over the previous week the market value of the iM 6-Stock Capital Strength Portfolio gained -0.48% at a time when SPY gained 0.24%. A starting capital of $100,000 at inception on 10/28/2016 would have grown to $163,257 which includes $1,224 cash and excludes $712 spent on fees and slippage. |
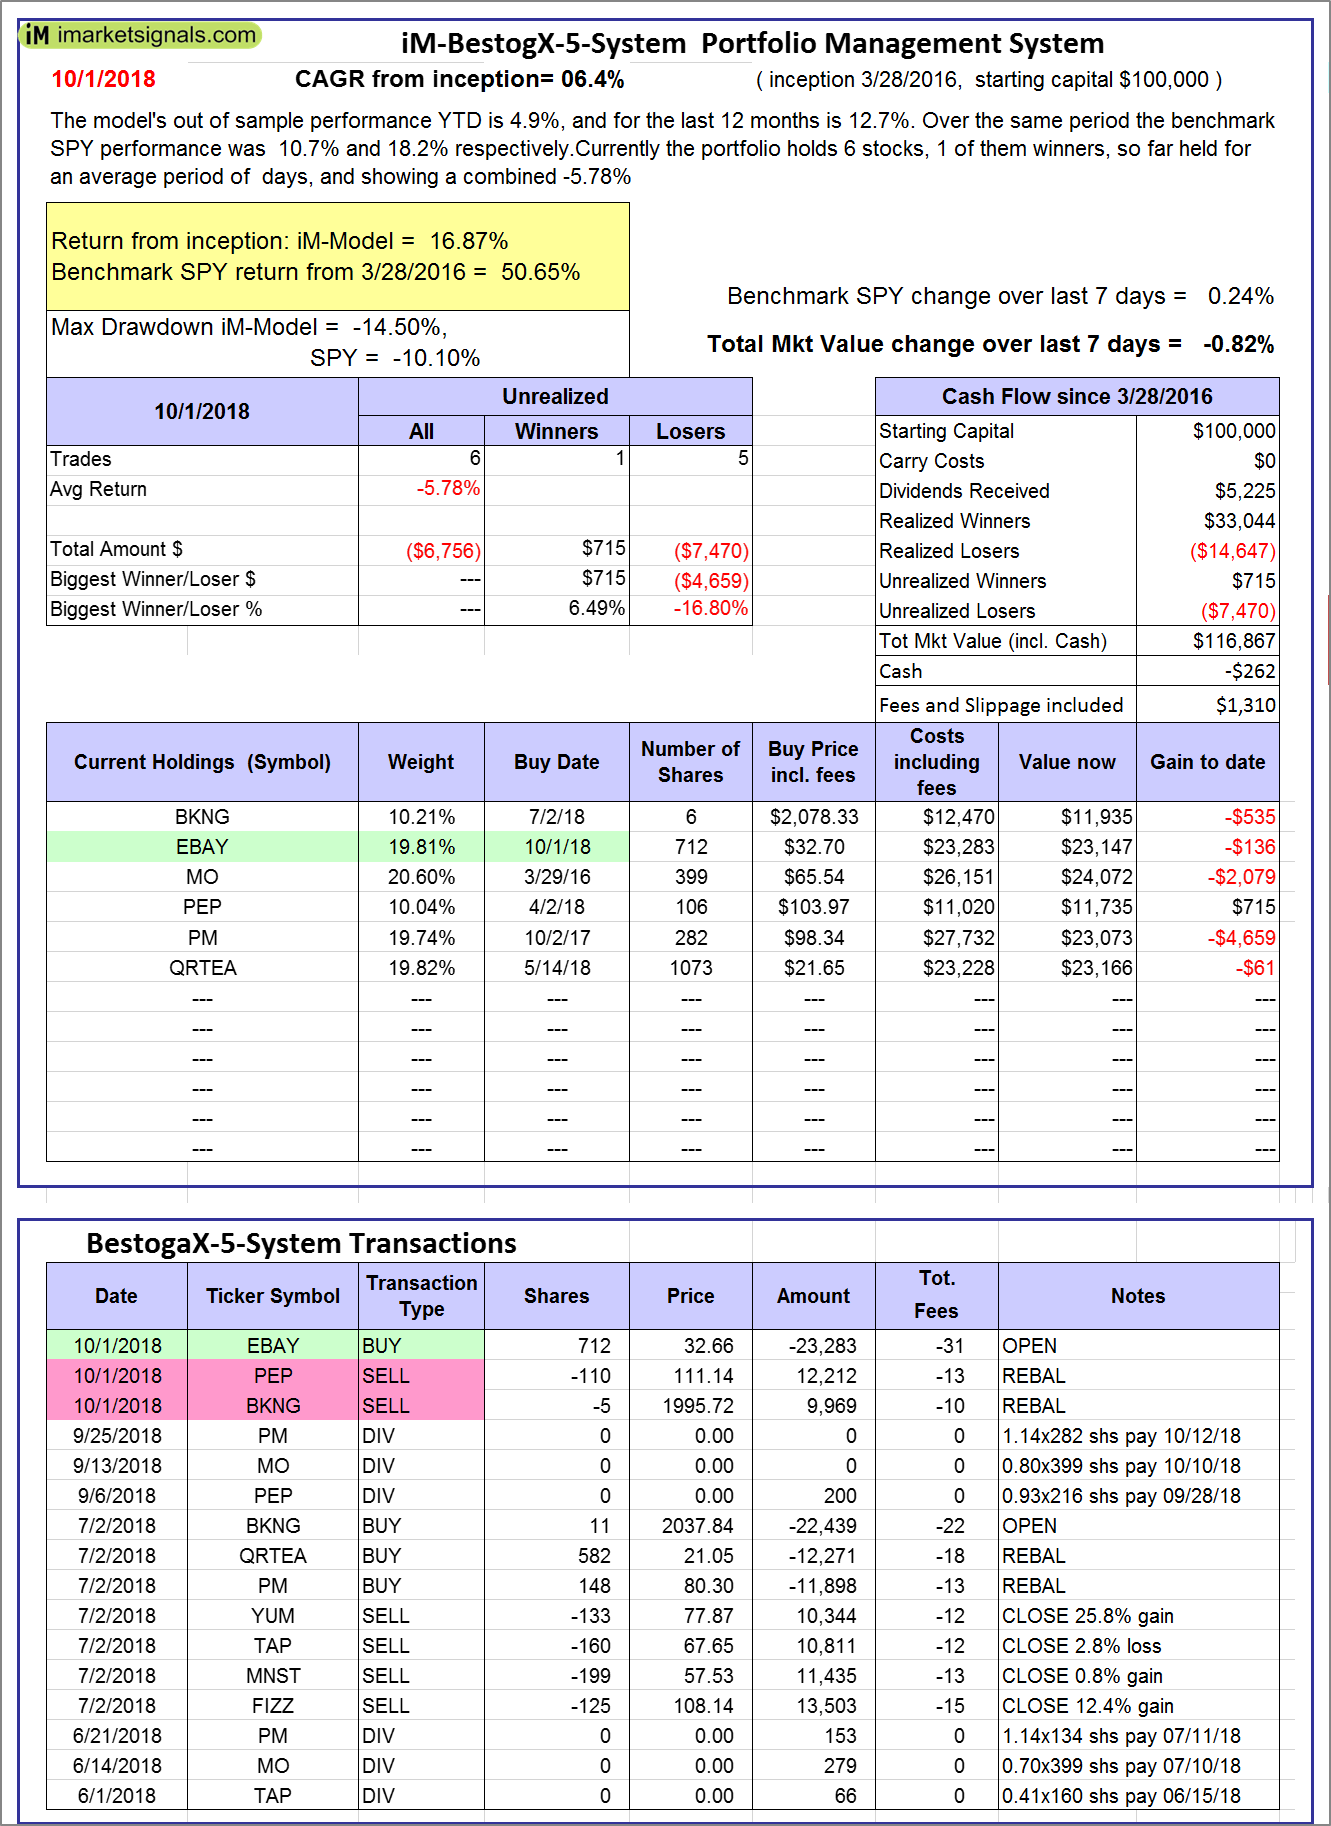 |
iM-BestogaX5-System: The model’s out of sample performance YTD is 4.9%, and for the last 12 months is 12.7%. Over the same period the benchmark SPY performance was 10.7% and 18.2% respectively. Over the previous week the market value of iM-BestogaX5-System gained -0.82% at a time when SPY gained 0.24%. A starting capital of $100,000 at inception on 3/28/2016 would have grown to $116,867 which includes -$262 cash and excludes $1,310 spent on fees and slippage. |
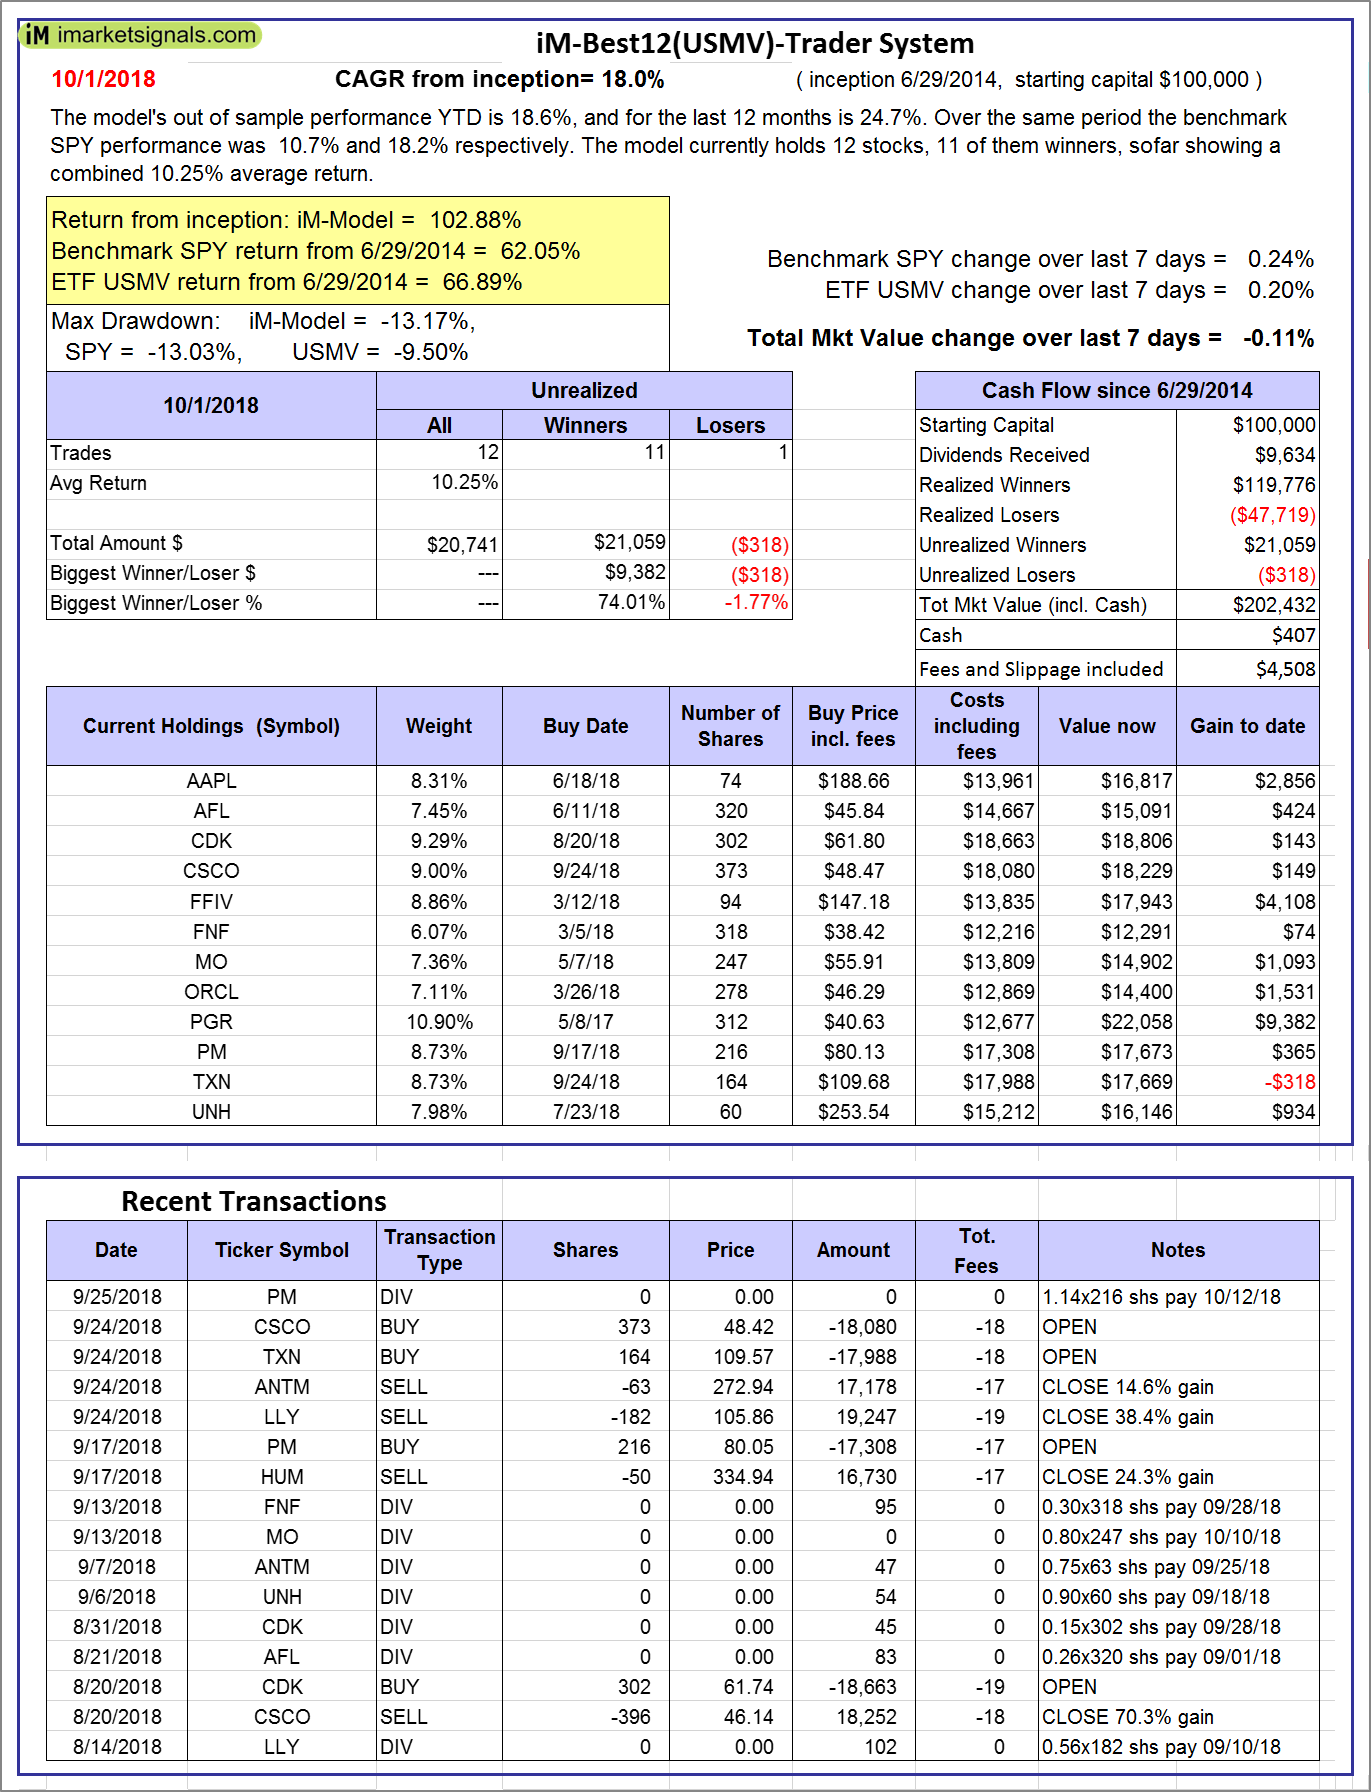 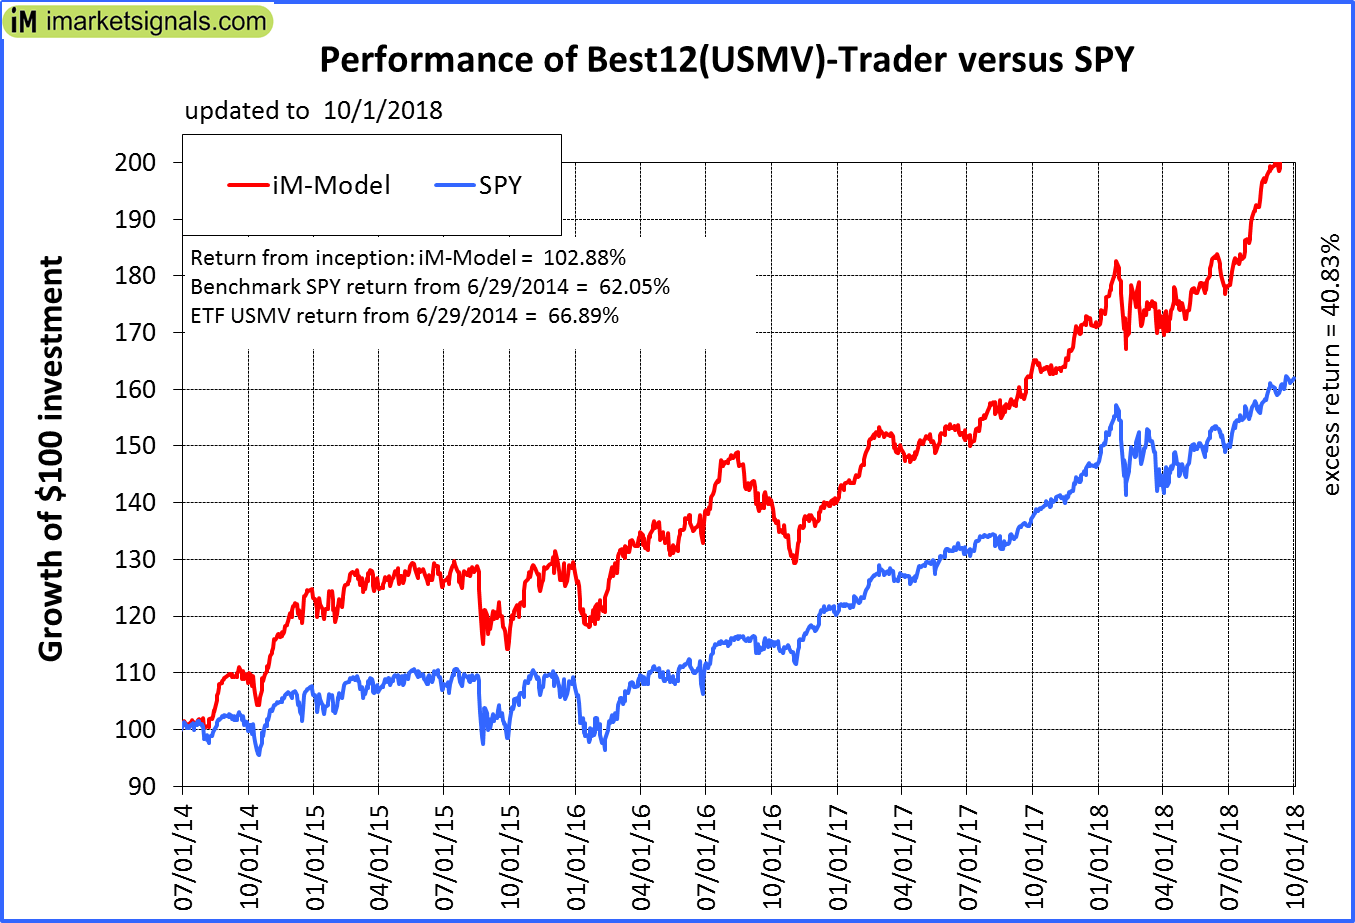 |
iM-Best12(USMV)-Trader: The model’s out of sample performance YTD is 18.6%, and for the last 12 months is 24.7%. Over the same period the benchmark SPY performance was 10.7% and 18.2% respectively. Since inception, on 6/30/2014, the model gained 102.88% while the benchmark SPY gained 62.05% and the ETF USMV gained 66.89% over the same period. Over the previous week the market value of iM-Best12(USMV)-Trader gained -0.11% at a time when SPY gained 0.24%. A starting capital of $100,000 at inception on 6/30/2014 would have grown to $202,432 which includes $407 cash and excludes $4,508 spent on fees and slippage. |
 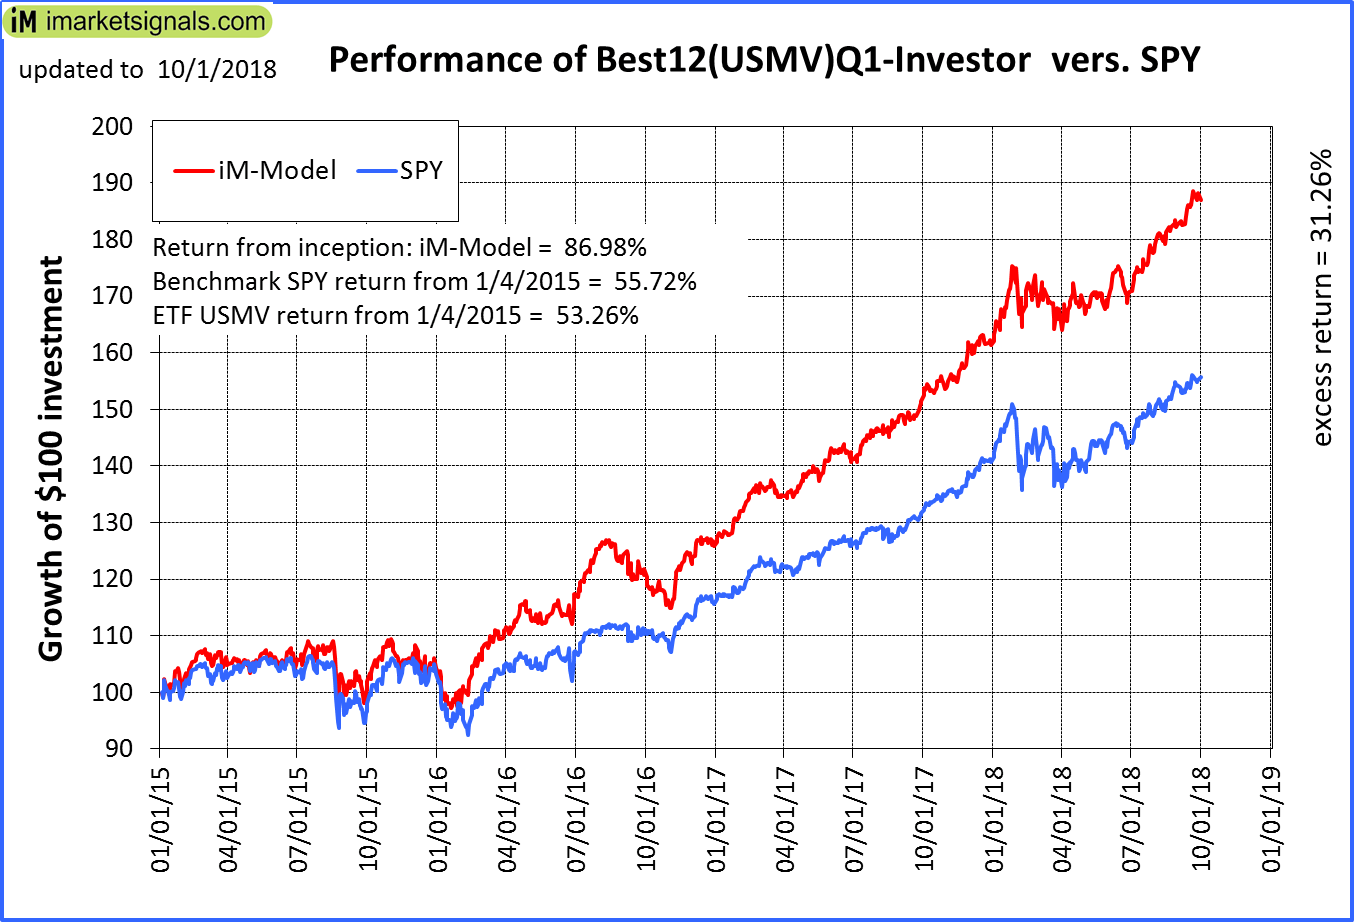 |
iM-Best12(USMV)Q1-Investor: The model’s out of sample performance YTD is 15.8%, and for the last 12 months is 23.4%. Over the same period the benchmark SPY performance was 10.7% and 18.2% respectively. Since inception, on 1/5/2015, the model gained 86.98% while the benchmark SPY gained 55.72% and the ETF USMV gained 53.26% over the same period. Over the previous week the market value of iM-Best12(USMV)Q1 gained -0.33% at a time when SPY gained 0.24%. A starting capital of $100,000 at inception on 1/5/2015 would have grown to $186,469 which includes $423 cash and excludes $1,252 spent on fees and slippage. |
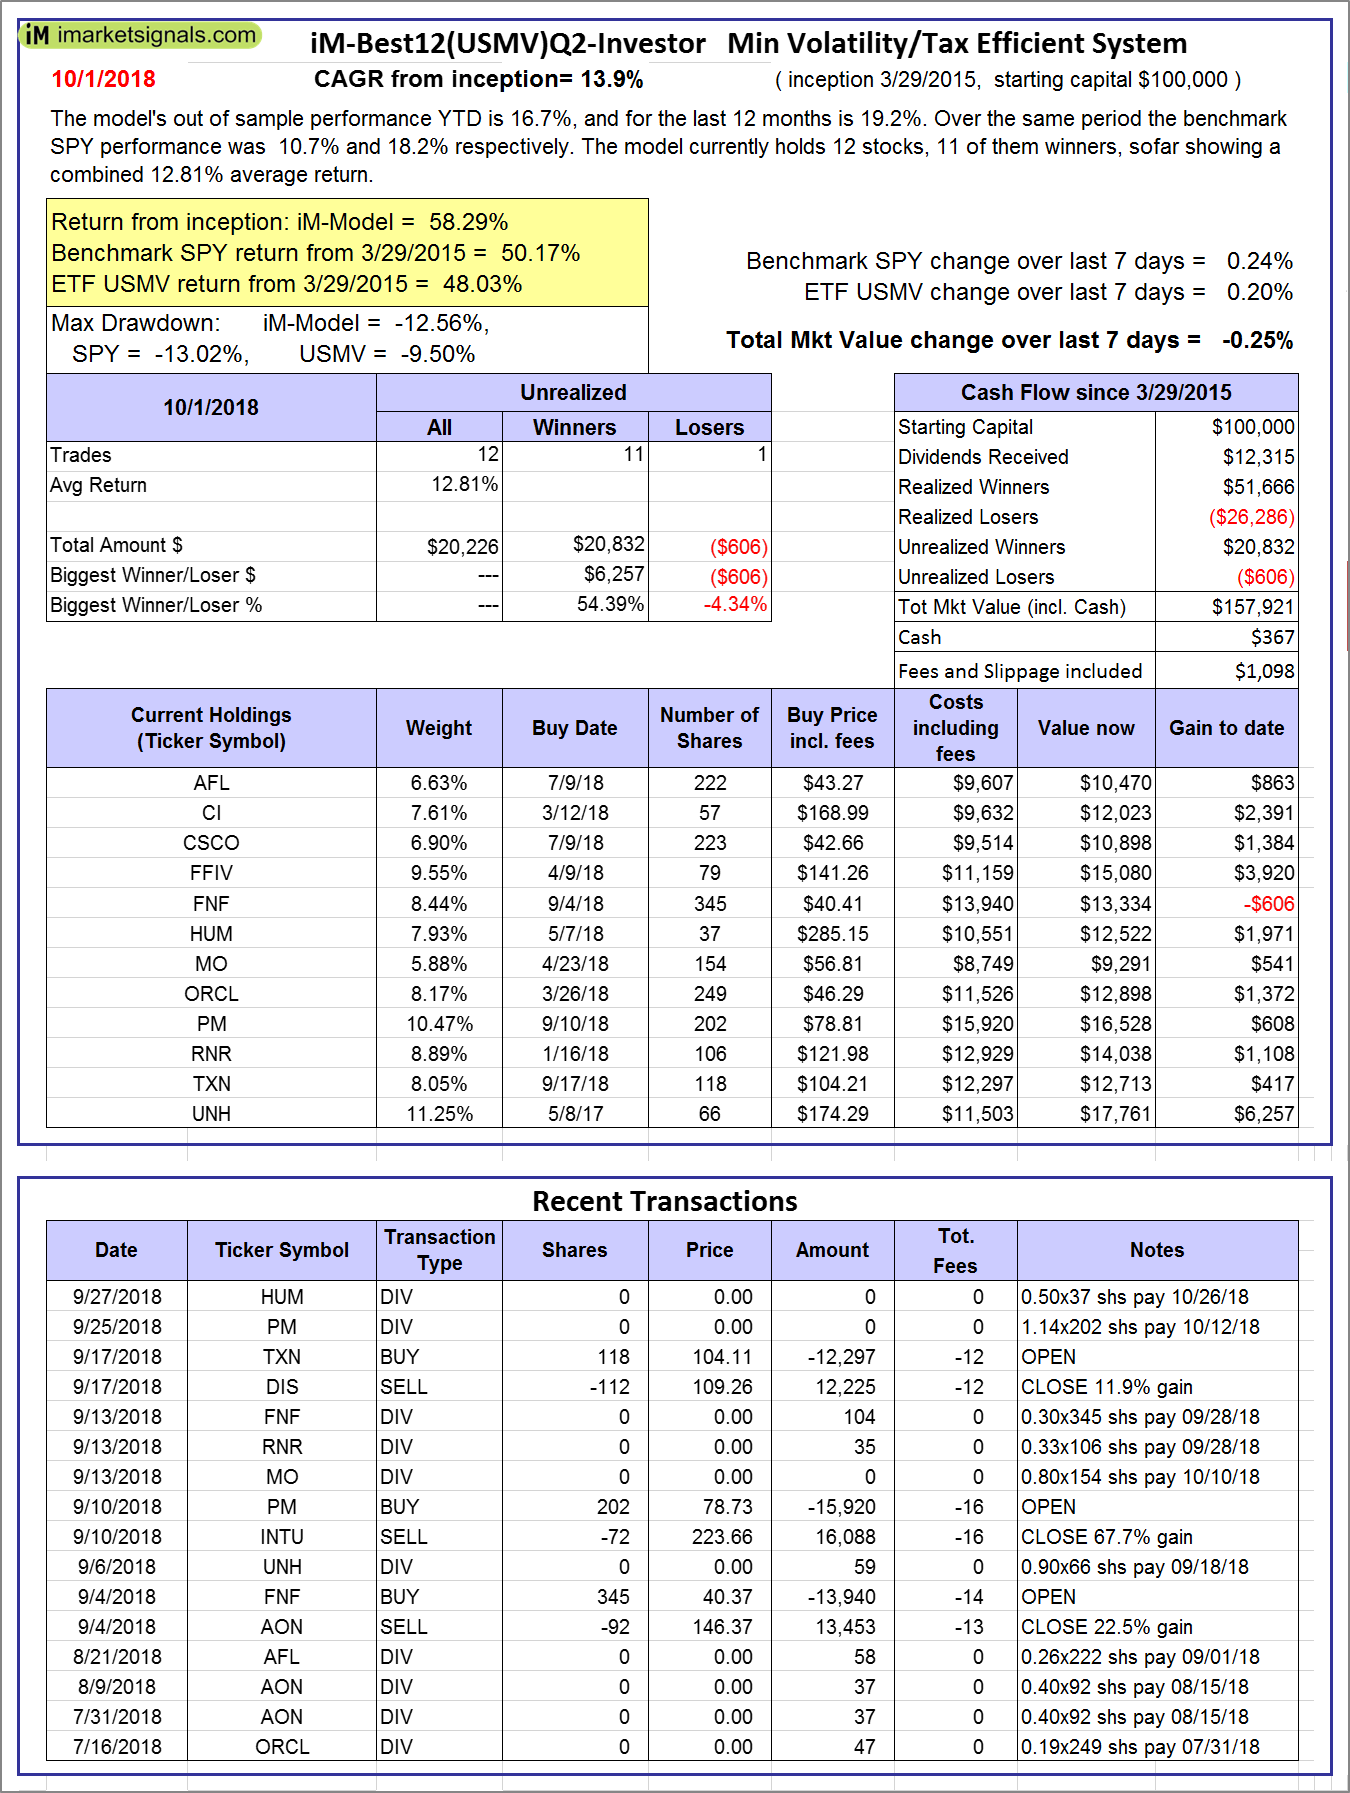 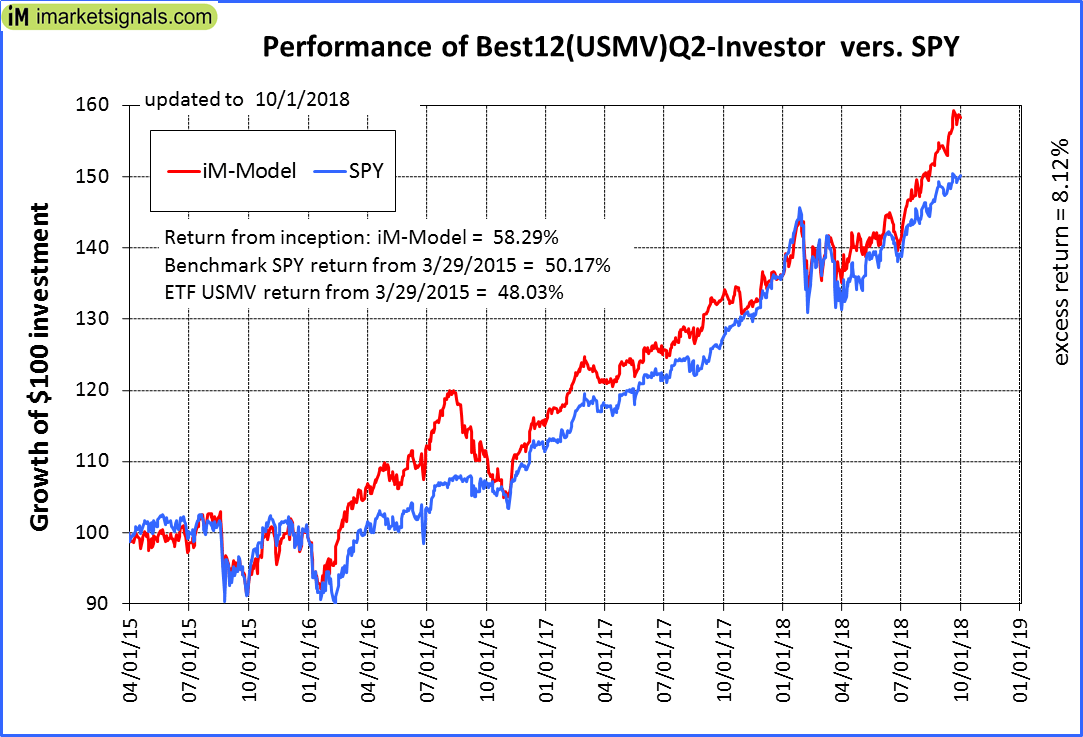 |
iM-Best12(USMV)Q2-Investor: The model’s out of sample performance YTD is 16.7%, and for the last 12 months is 19.2%. Over the same period the benchmark SPY performance was 10.7% and 18.2% respectively. Since inception, on 3/30/2015, the model gained 58.29% while the benchmark SPY gained 50.17% and the ETF USMV gained 48.03% over the same period. Over the previous week the market value of iM-Best12(USMV)Q2 gained -0.25% at a time when SPY gained 0.24%. A starting capital of $100,000 at inception on 3/30/2015 would have grown to $157,921 which includes $367 cash and excludes $1,098 spent on fees and slippage. |
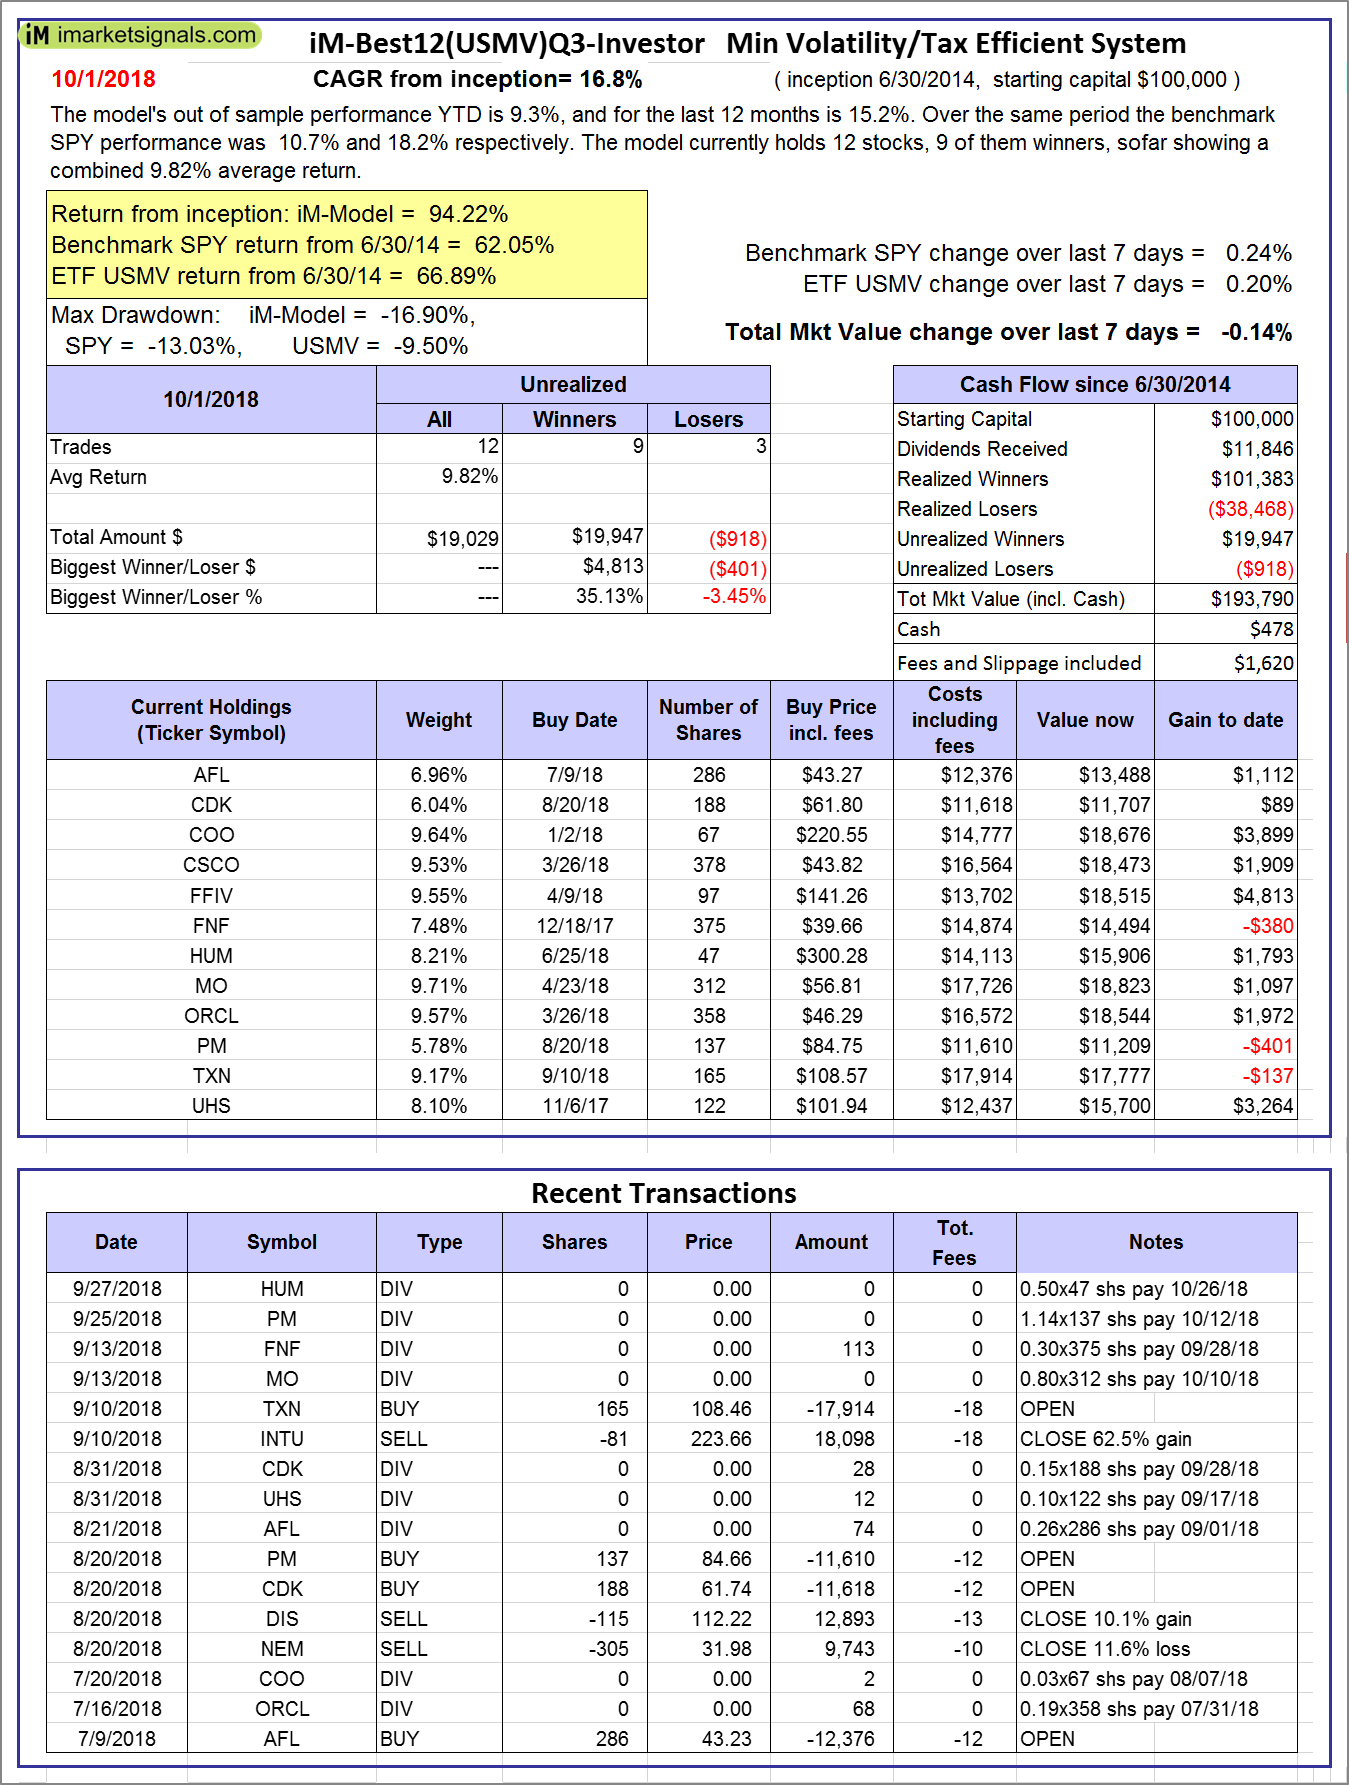 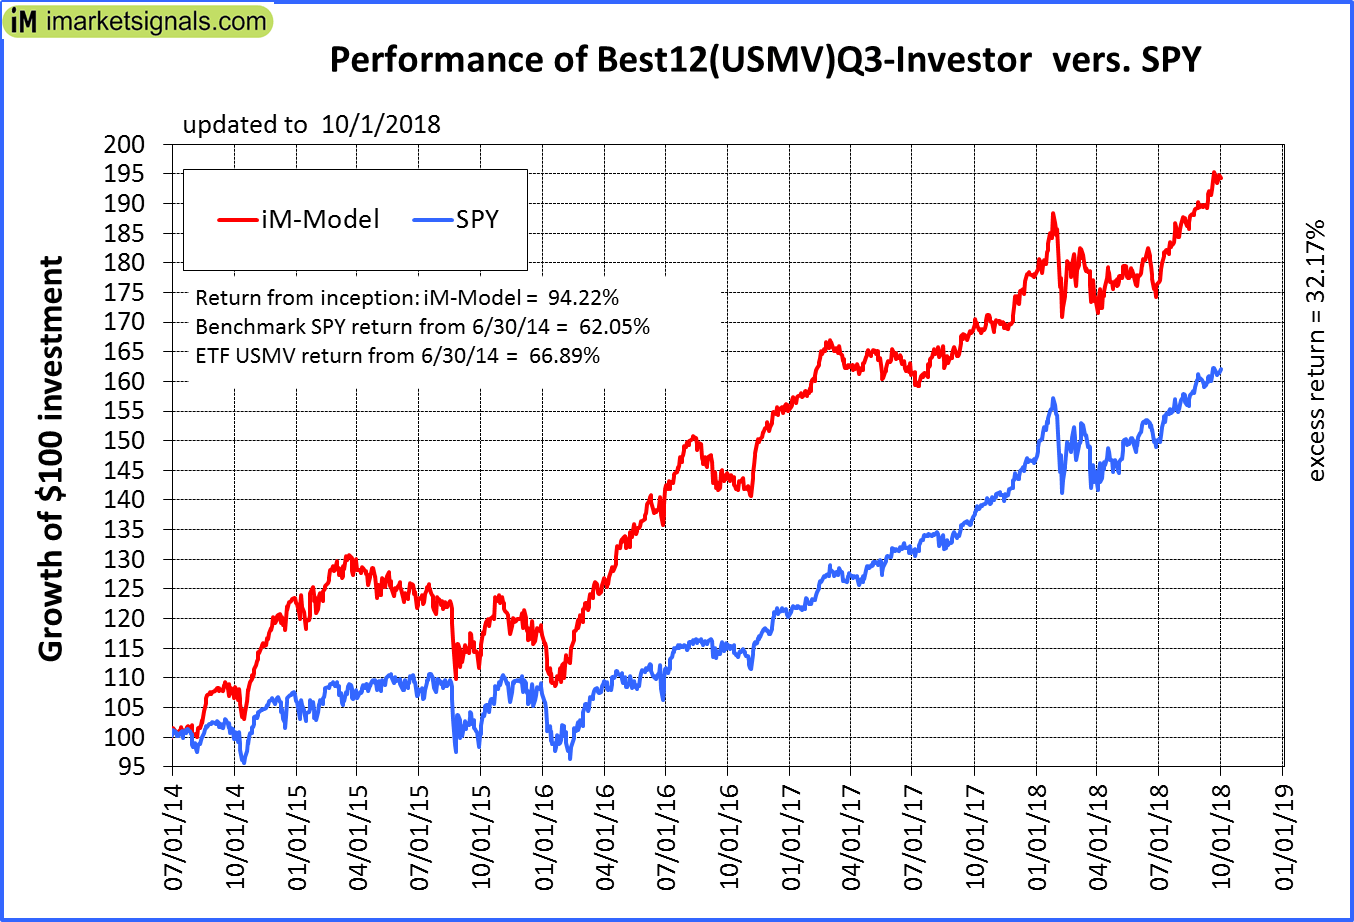 |
iM-Best12(USMV)Q3-Investor: The model’s out of sample performance YTD is 9.3%, and for the last 12 months is 15.2%. Over the same period the benchmark SPY performance was 10.7% and 18.2% respectively. Since inception, on 7/1/2014, the model gained 94.22% while the benchmark SPY gained 62.05% and the ETF USMV gained 66.89% over the same period. Over the previous week the market value of iM-Best12(USMV)Q3 gained -0.14% at a time when SPY gained 0.24%. A starting capital of $100,000 at inception on 7/1/2014 would have grown to $193,790 which includes $478 cash and excludes $1,620 spent on fees and slippage. |
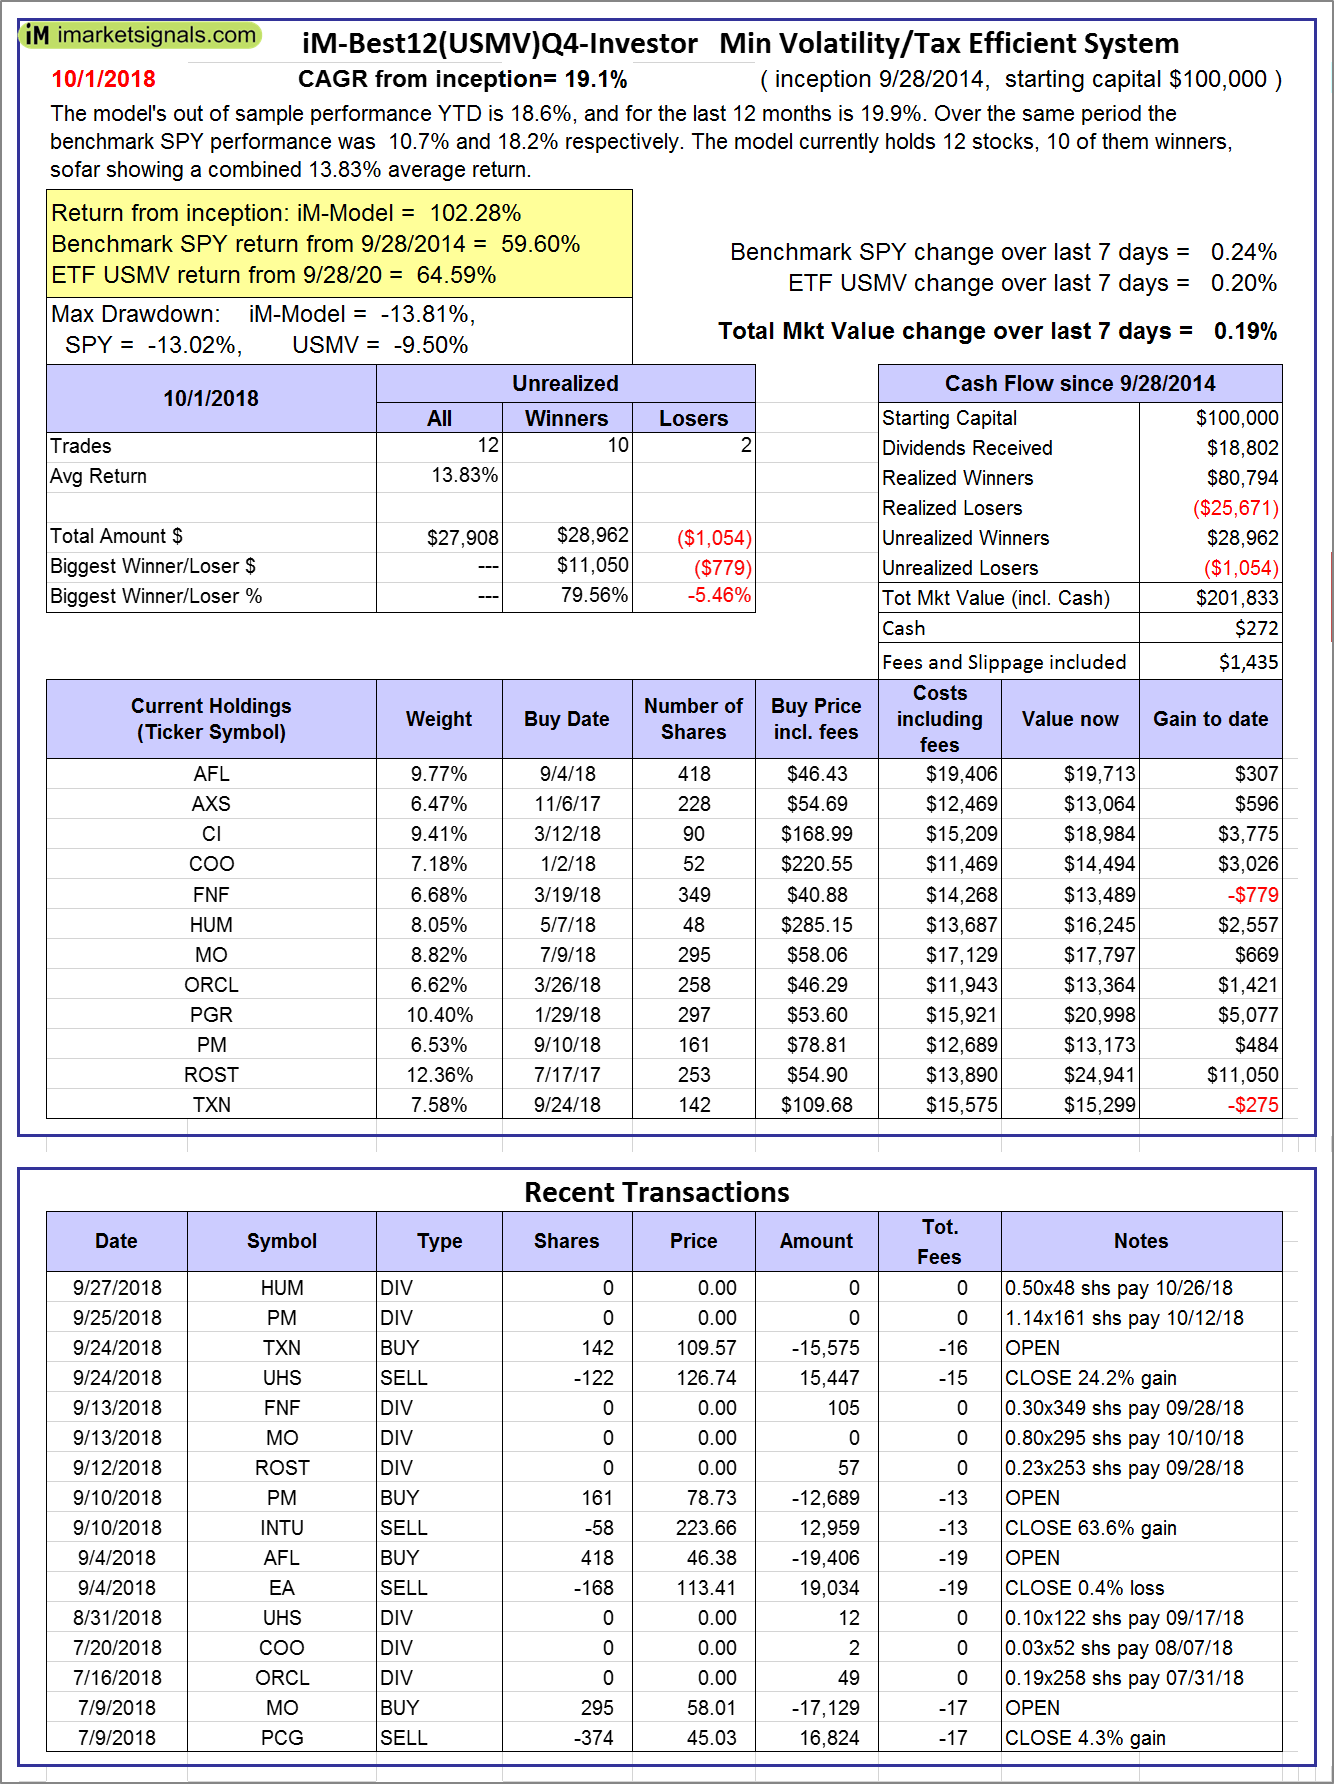  |
iM-Best12(USMV)Q4-Investor: Since inception, on 9/29/2014, the model gained 102.28% while the benchmark SPY gained 59.60% and the ETF USMV gained 64.59% over the same period. Over the previous week the market value of iM-Best12(USMV)Q4 gained 0.19% at a time when SPY gained 0.24%. A starting capital of $100,000 at inception on 9/29/2014 would have grown to $201,833 which includes $272 cash and excludes $1,435 spent on fees and slippage. |
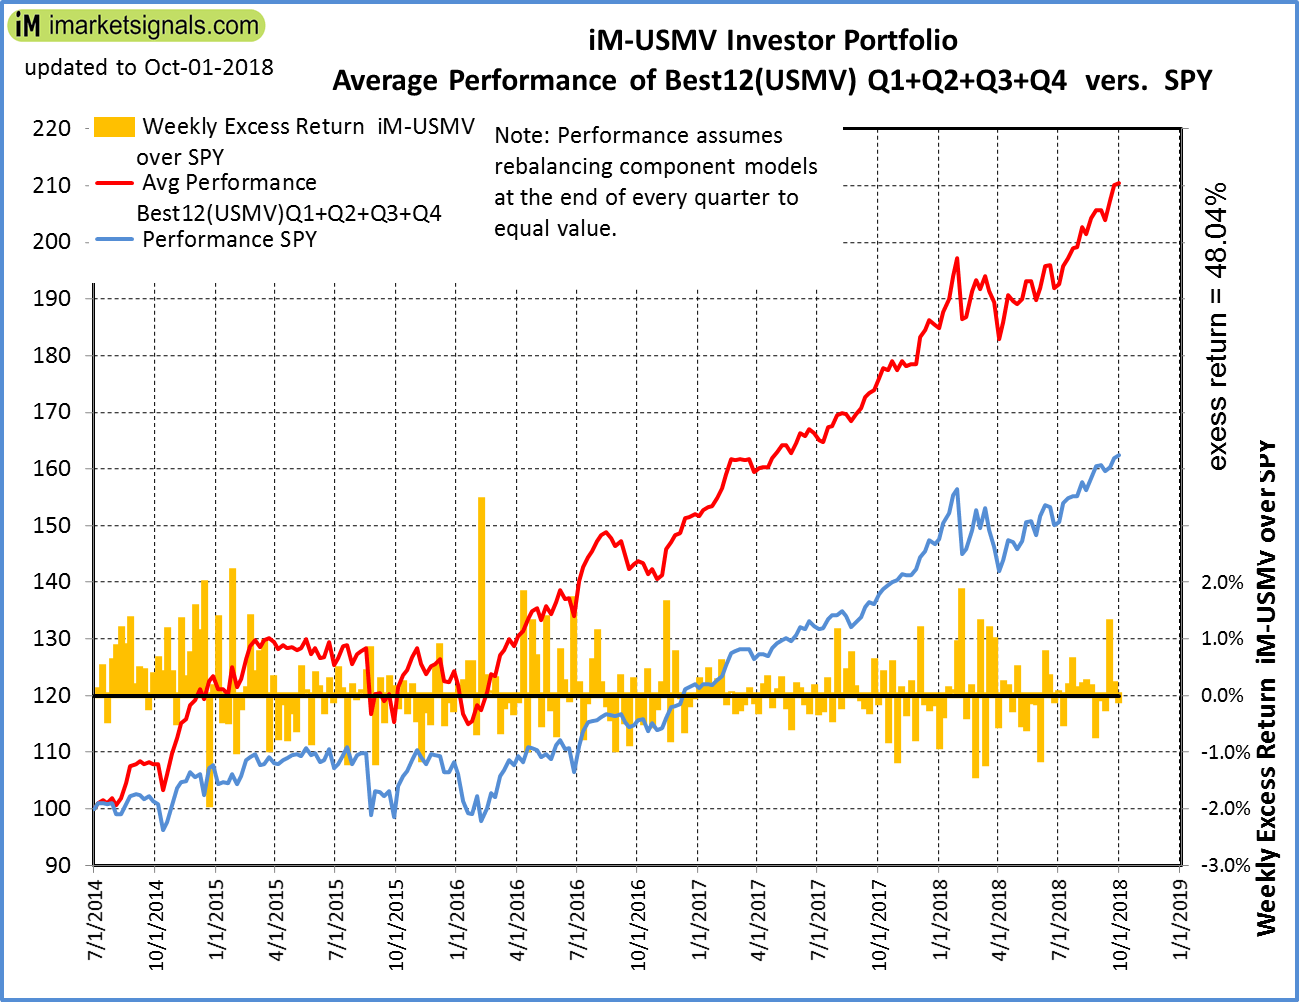 |
Average Performance of iM-Best12(USMV)Q1+Q2+Q3+Q4-Investor resulted in an excess return of 48.04% over SPY. (see iM-USMV Investor Portfolio) |
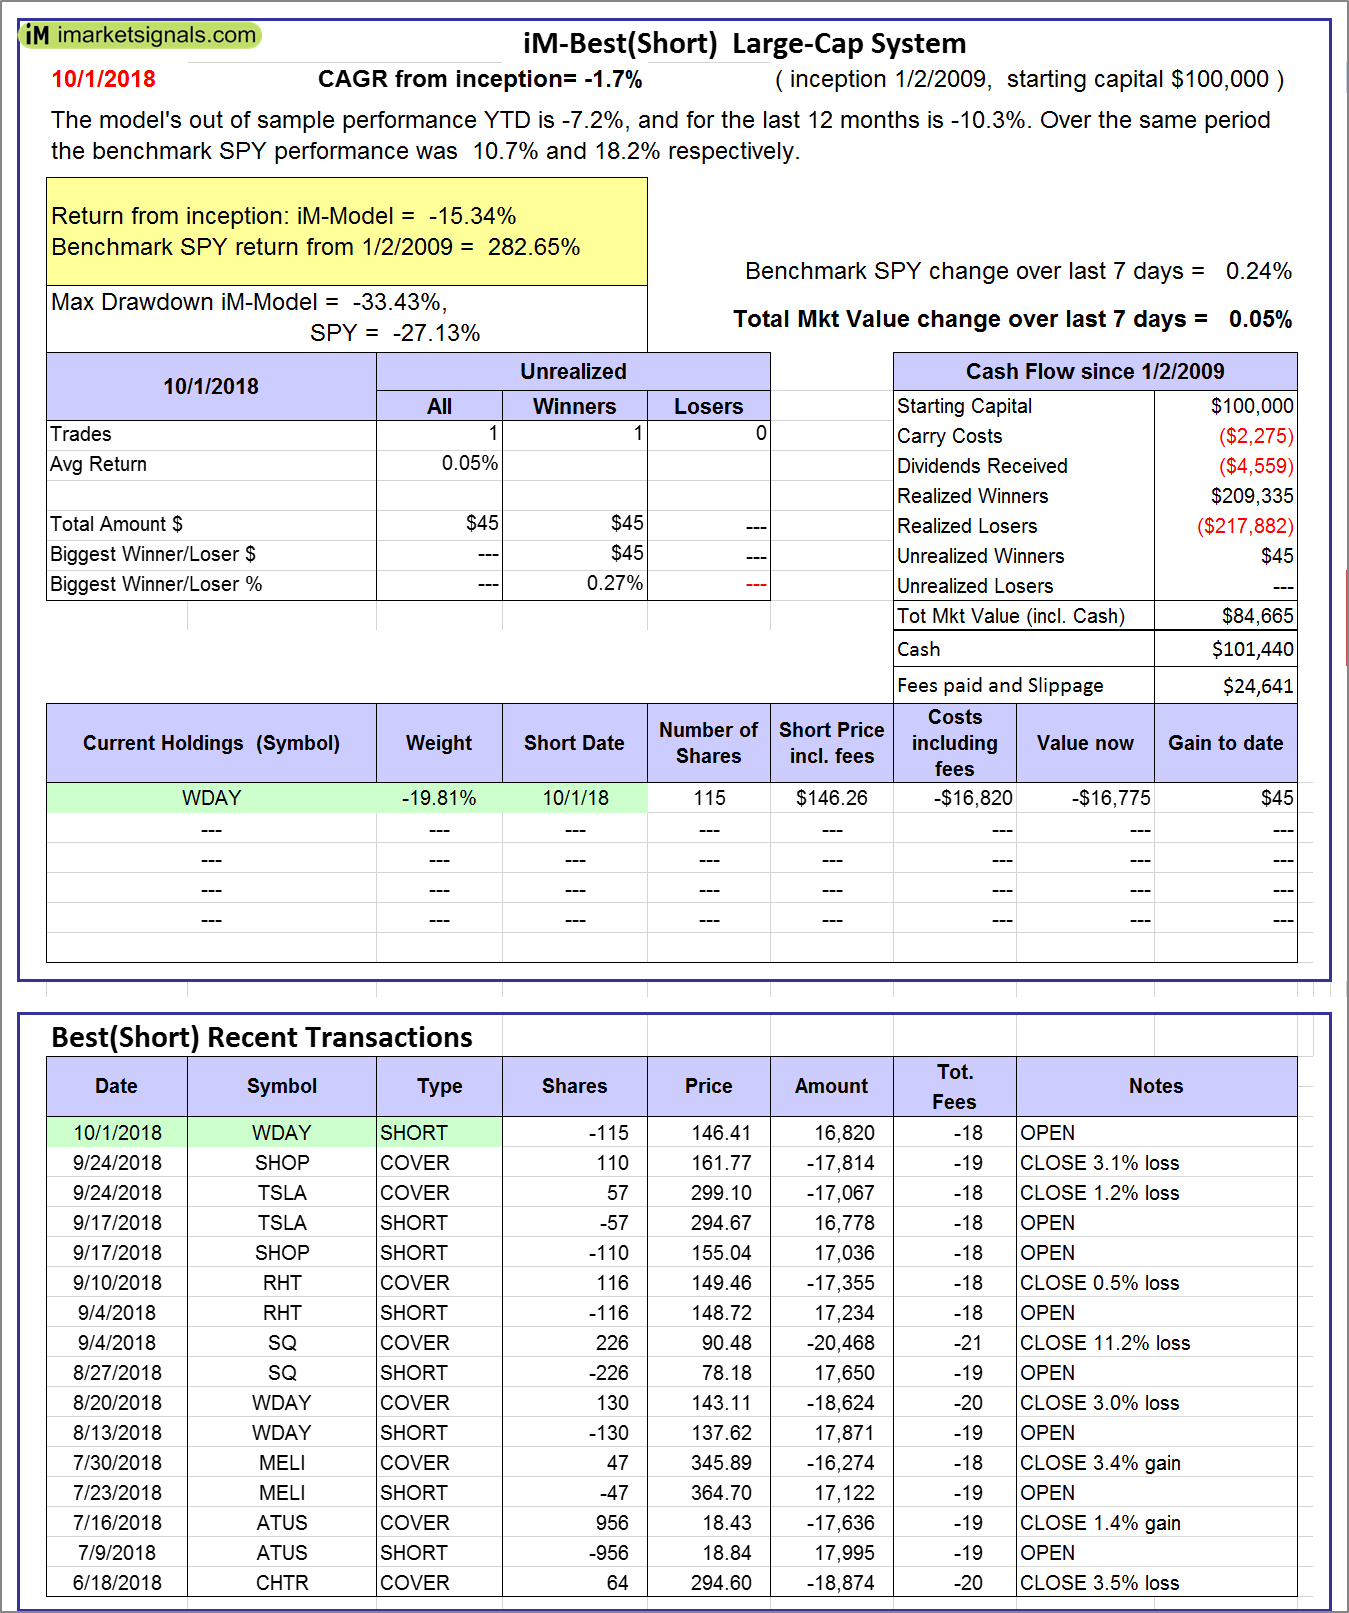 |
iM-Best(Short): The model’s out of sample performance YTD is -7.2%, and for the last 12 months is -10.3%. Over the same period the benchmark SPY performance was 10.7% and 18.2% respectively. Over the previous week the market value of iM-Best(Short) gained 0.05% at a time when SPY gained 0.24%. Over the period 1/2/2009 to 10/1/2018 the starting capital of $100,000 would have grown to $84,665 which includes $101,440 cash and excludes $24,641 spent on fees and slippage. |
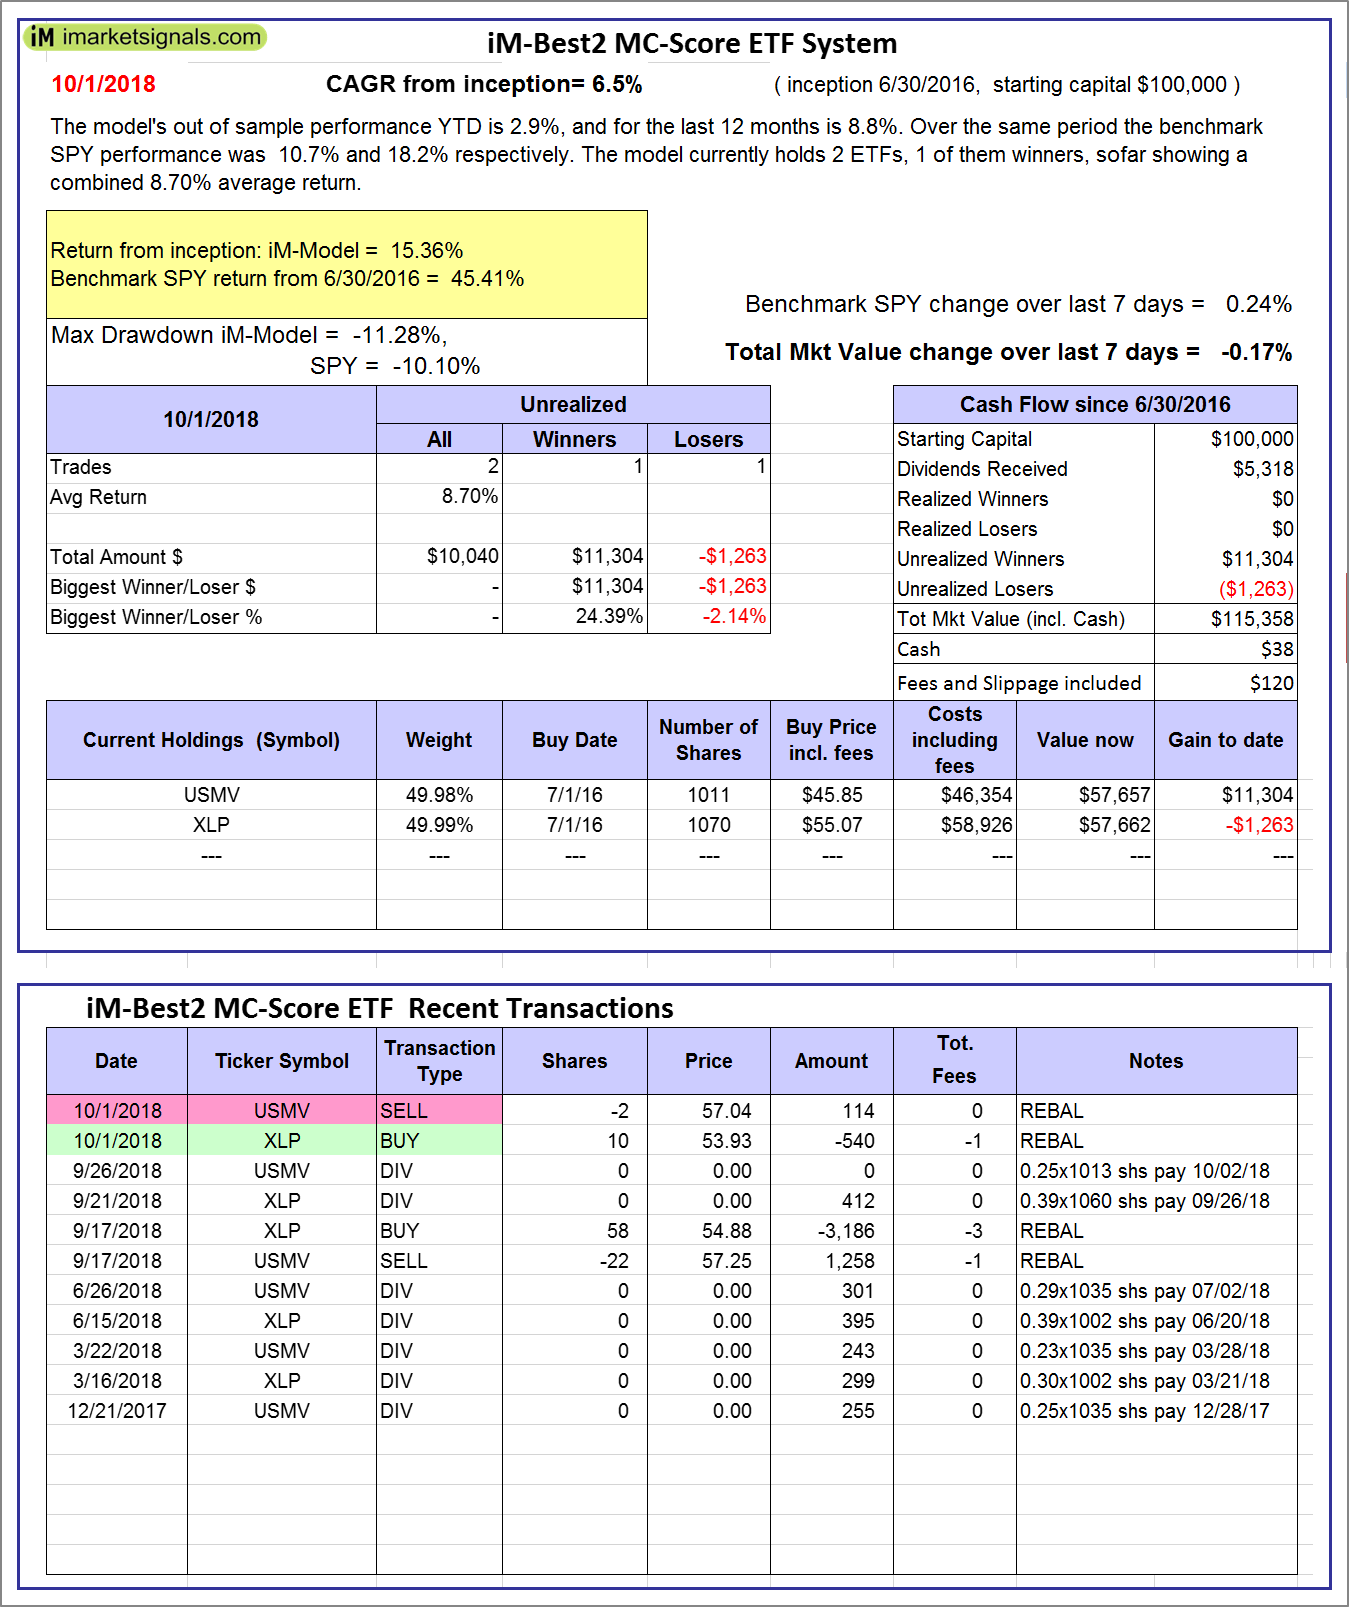 |
iM-Best2 MC-Score ETF System: The model’s out of sample performance YTD is 2.9%, and for the last 12 months is 8.8%. Over the same period the benchmark SPY performance was 10.7% and 18.2% respectively. Over the previous week the market value of the iM-Best2 MC-Score ETF System gained -0.17% at a time when SPY gained 0.24%. A starting capital of $100,000 at inception on 6/30/2016 would have grown to $115,358 which includes $38 cash and excludes $120 spent on fees and slippage. |
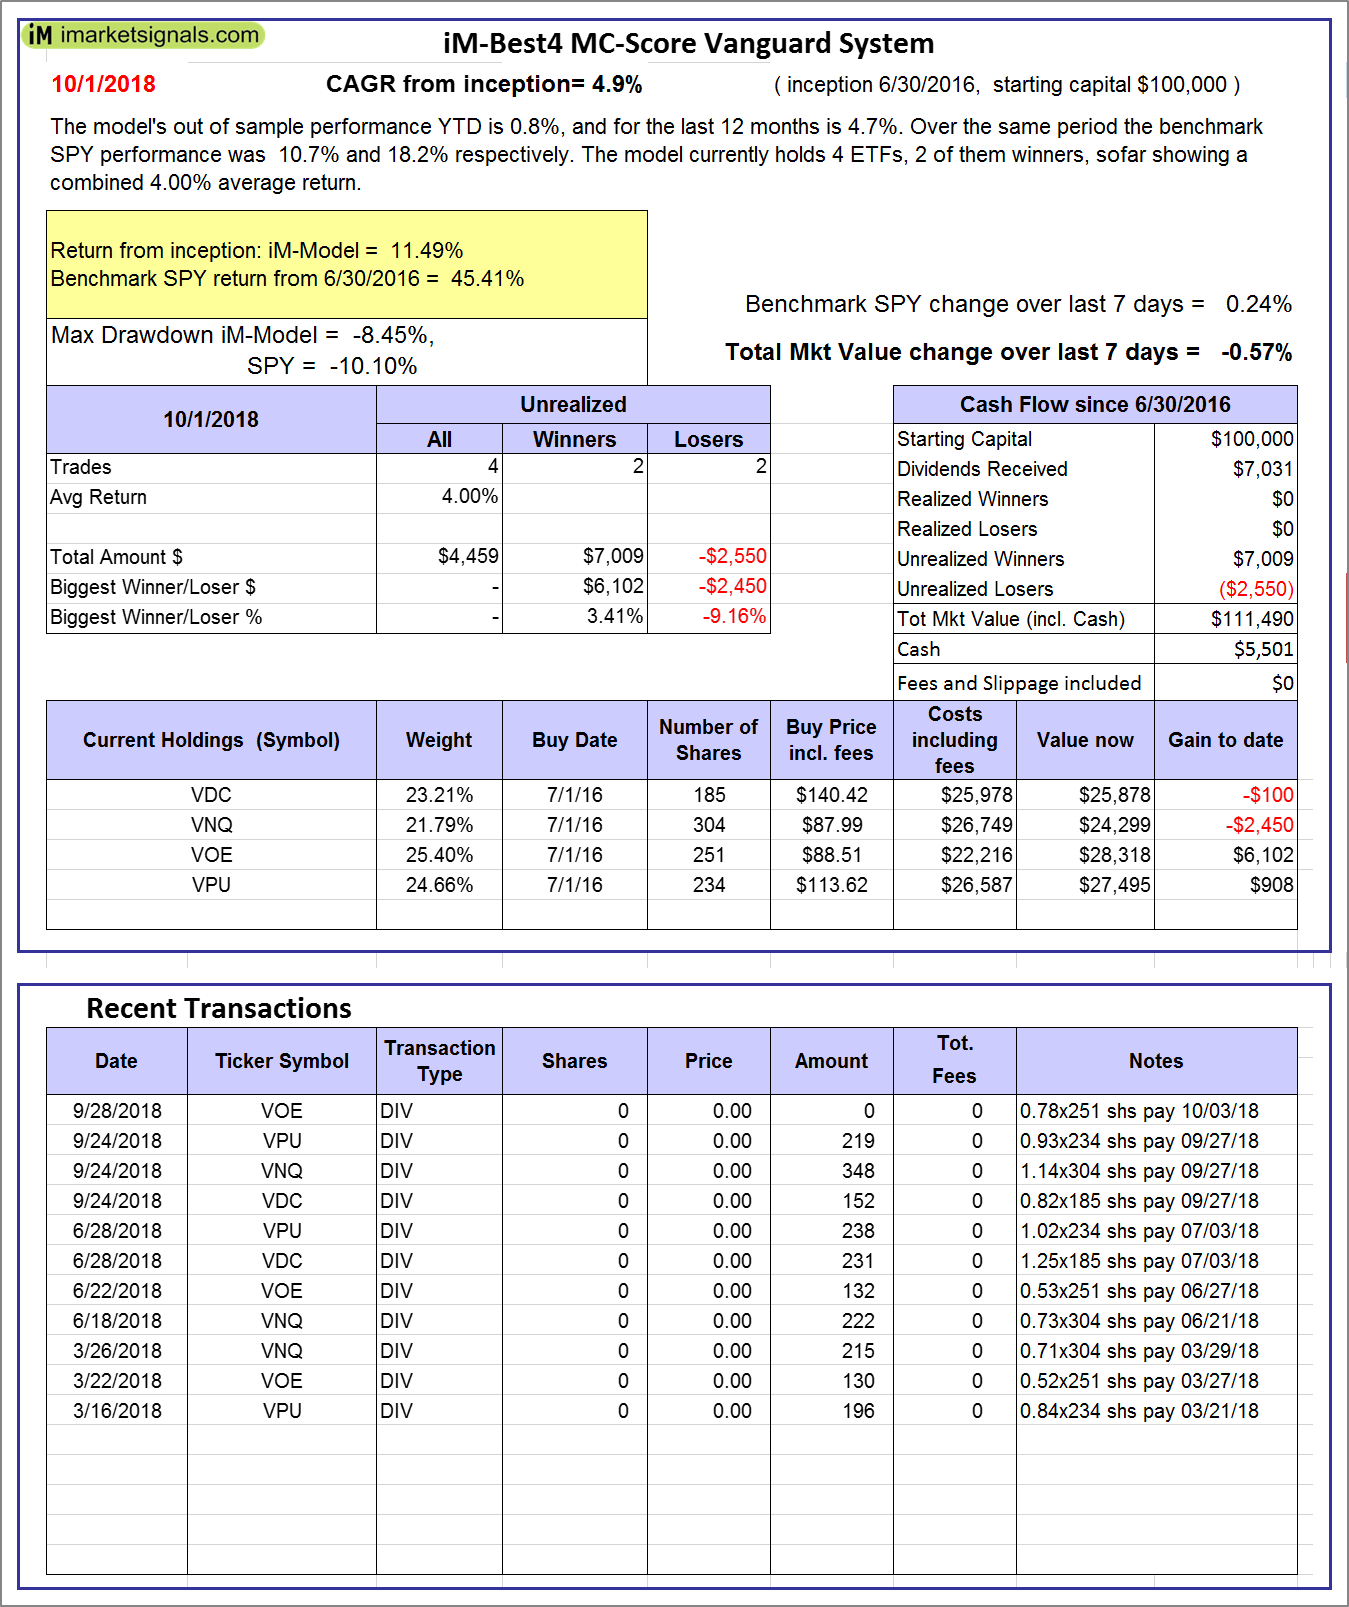 |
iM-Best4 MC-Score Vanguard System: The model’s out of sample performance YTD is 0.8%, and for the last 12 months is 4.7%. Over the same period the benchmark SPY performance was 10.7% and 18.2% respectively. Over the previous week the market value of the iM-Best4 MC-Score Vanguard System gained -0.57% at a time when SPY gained 0.24%. A starting capital of $100,000 at inception on 6/30/2016 would have grown to $111,490 which includes $5,501 cash and excludes $00 spent on fees and slippage. |
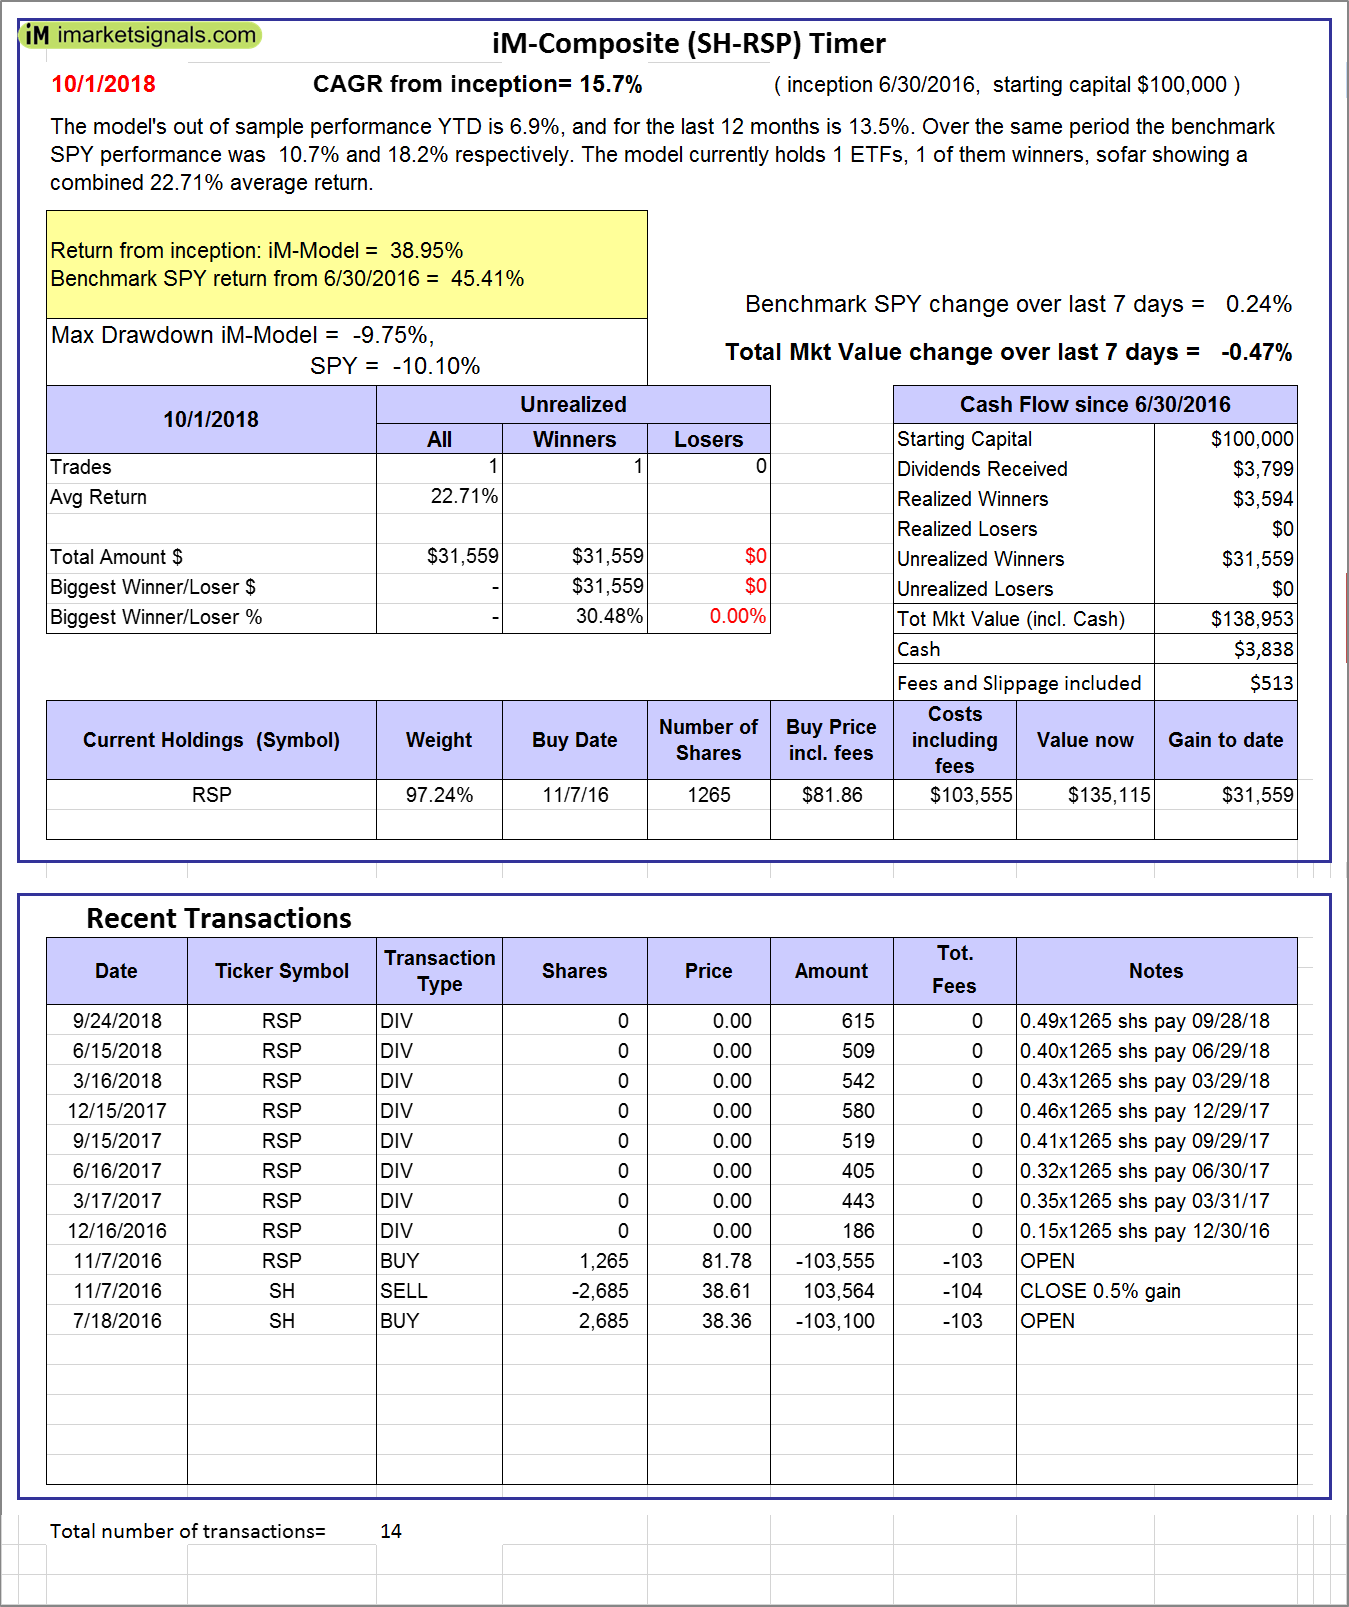 |
iM-Composite (SH-RSP) Timer: The model’s out of sample performance YTD is 6.9%, and for the last 12 months is 13.5%. Over the same period the benchmark SPY performance was 10.7% and 18.2% respectively. Over the previous week the market value of the iM-Composite (SH-RSP) Timer gained -0.47% at a time when SPY gained 0.24%. A starting capital of $100,000 at inception on 6/30/2016 would have grown to $138,953 which includes $3,838 cash and excludes $513 spent on fees and slippage. |
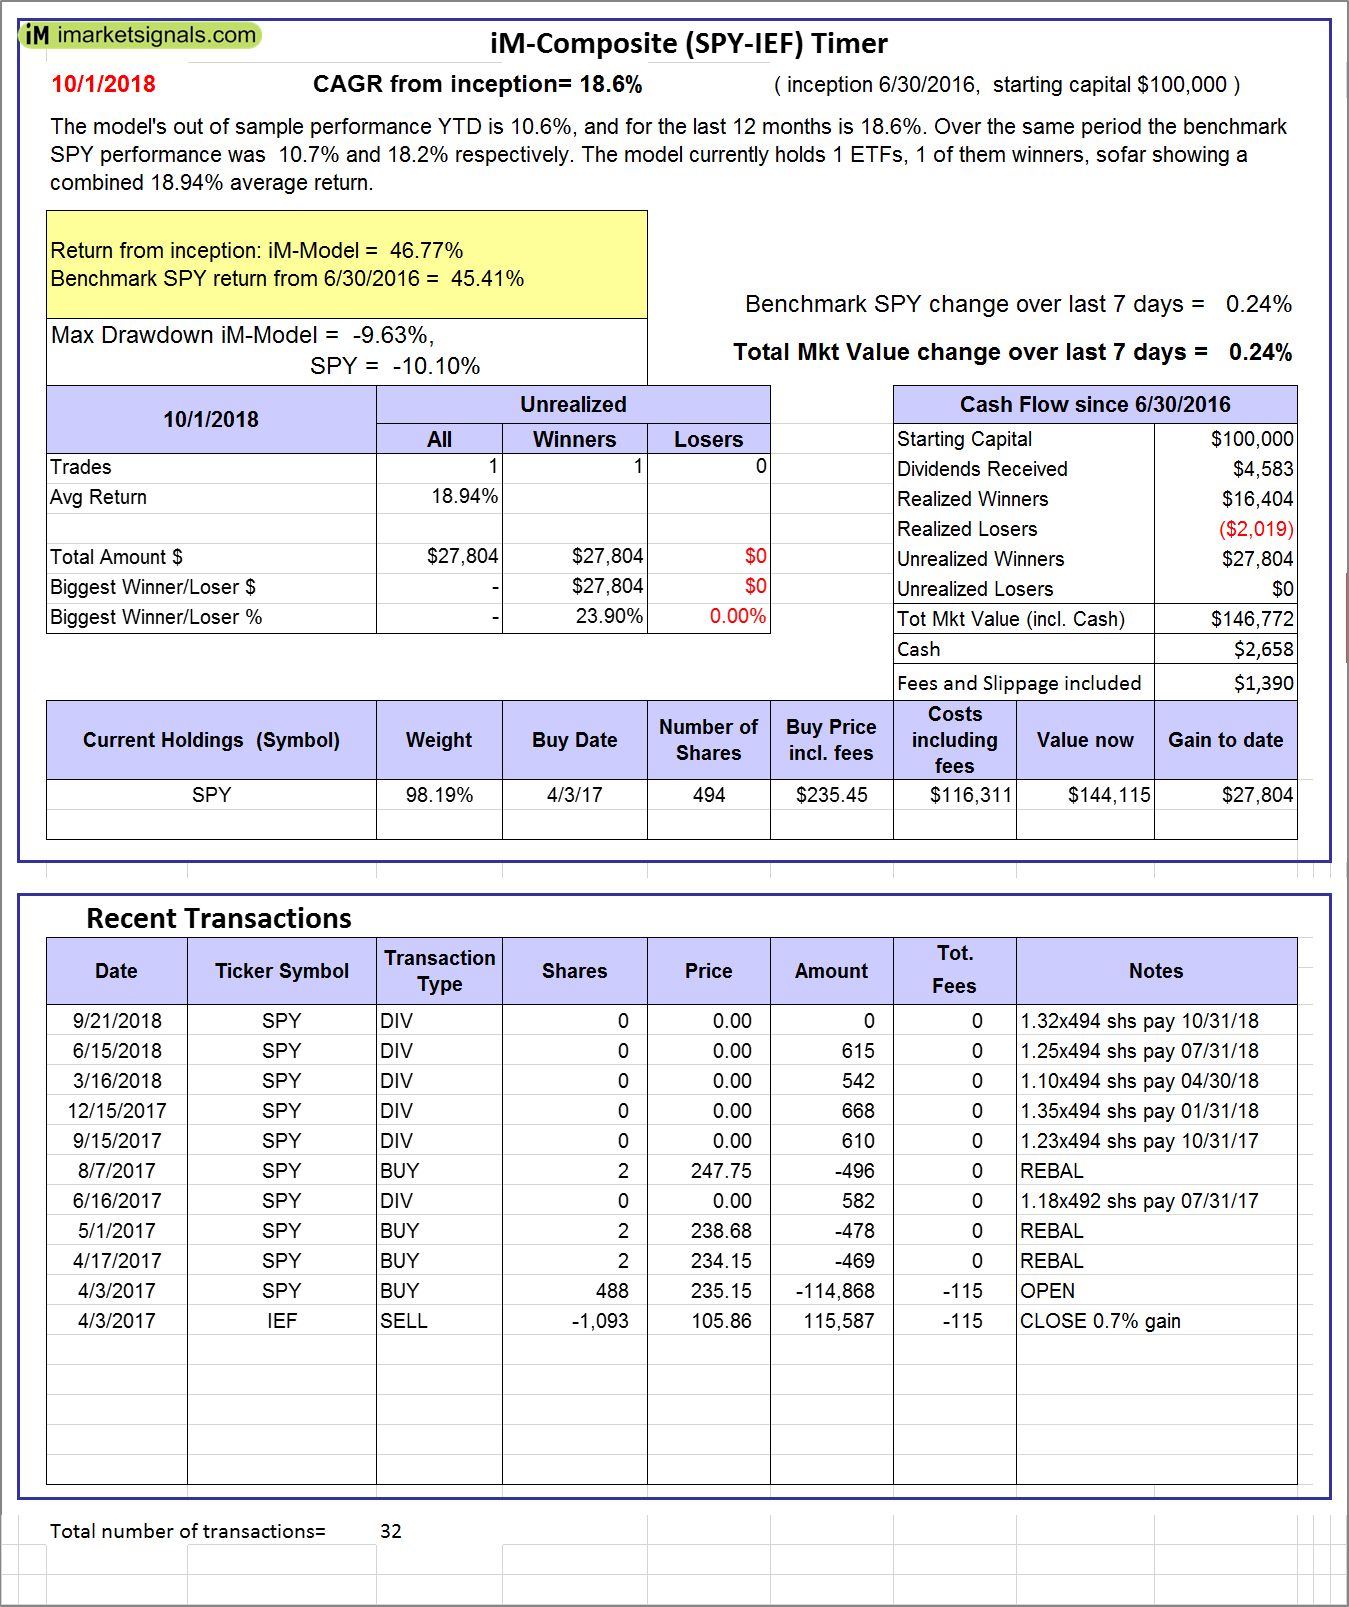 |
iM-Composite (SPY-IEF) Timer: The model’s out of sample performance YTD is 10.6%, and for the last 12 months is 18.6%. Over the same period the benchmark SPY performance was 10.7% and 18.2% respectively. Over the previous week the market value of the iM-Composite (SPY-IEF) Timer gained 0.24% at a time when SPY gained 0.24%. A starting capital of $100,000 at inception on 6/30/2016 would have grown to $146,772 which includes $2,658 cash and excludes $1,390 spent on fees and slippage. |
 |
iM-VIX Timer with ZIV: The model’s out of sample performance YTD is 38.9%, and for the last 12 months is 70.5%. Over the same period the benchmark SPY performance was 10.7% and 18.2% respectively. Over the previous week the market value of the iM-VIX Timer with ZIV gained 2.44% at a time when SPY gained 0.24%. A starting capital of $100,000 at inception on 6/30/2016 would have grown to $244,420 which includes $77 cash and excludes $2,429 spent on fees and slippage. |
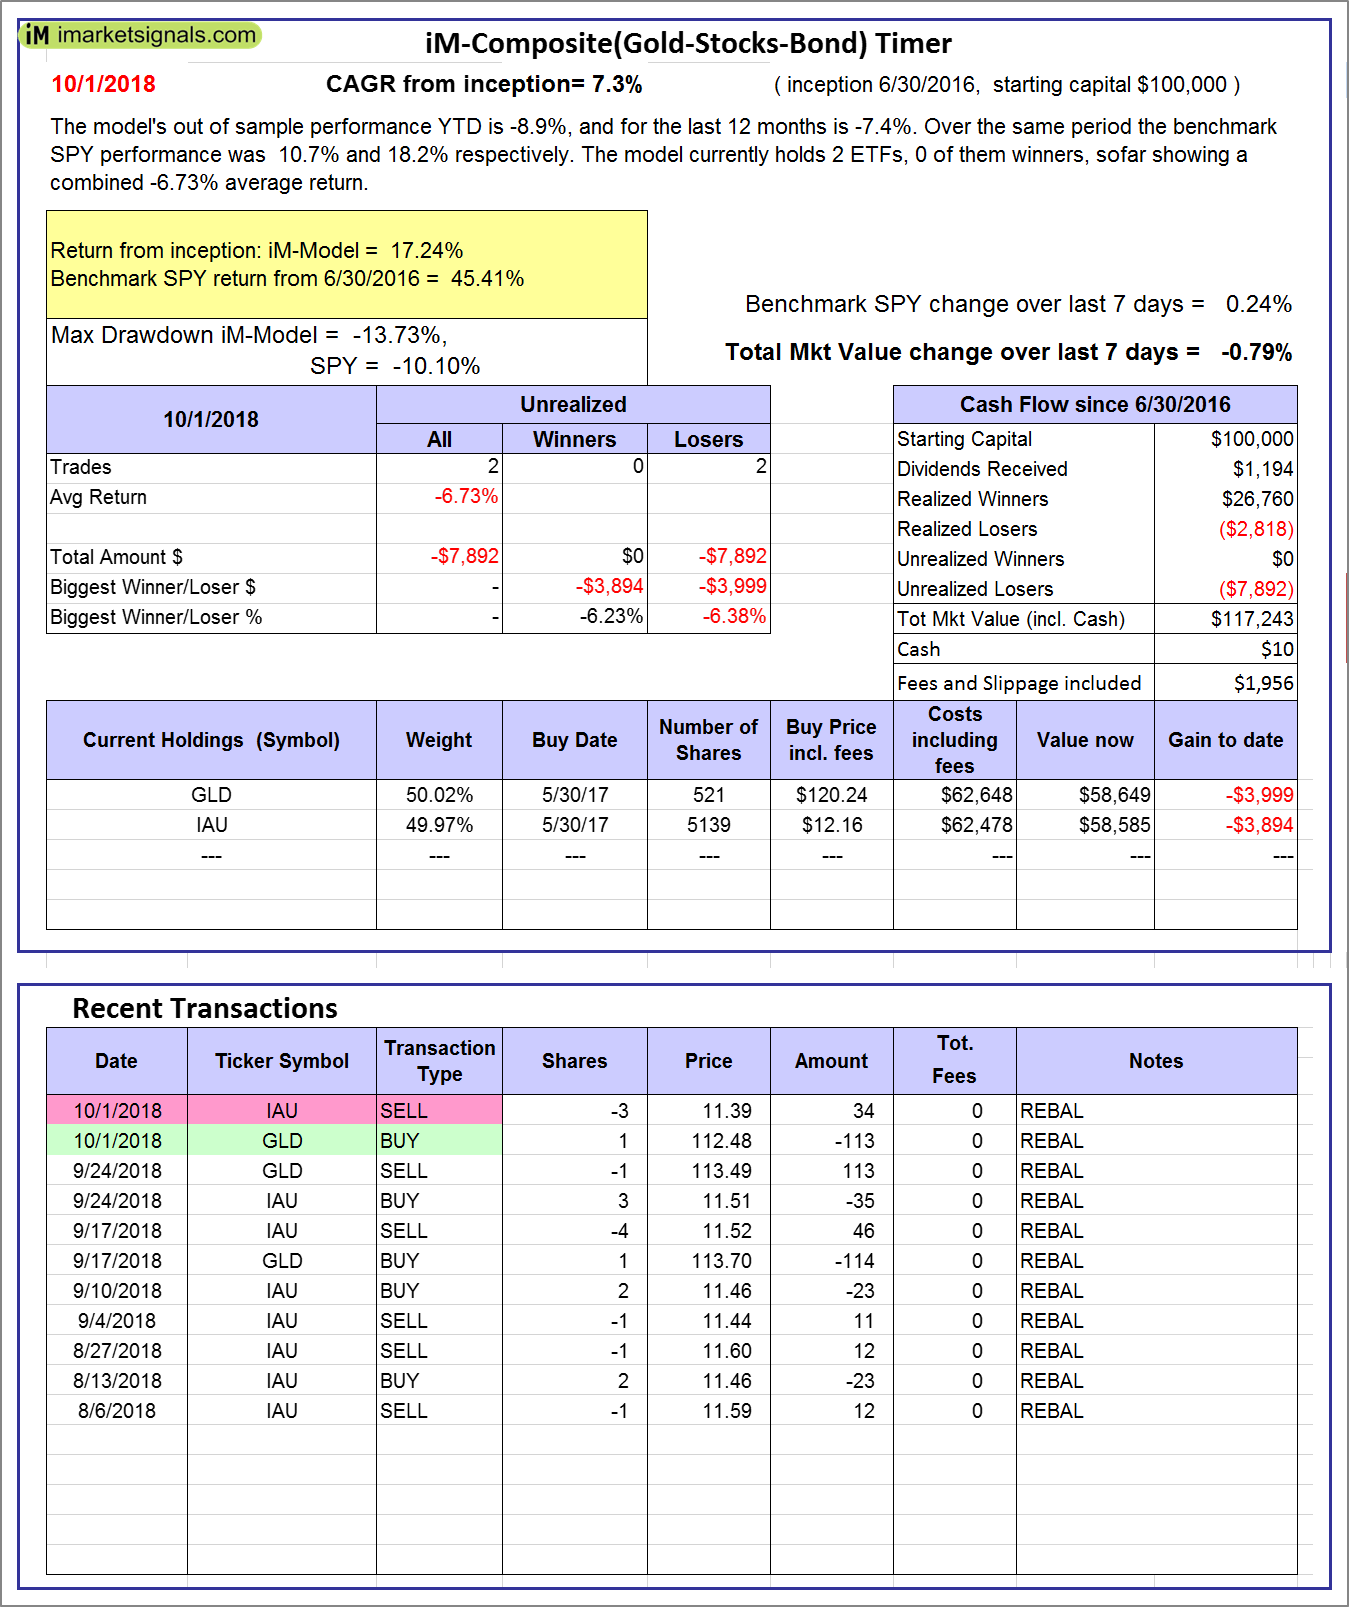 |
iM-Composite(Gold-Stocks-Bond) Timer: The model’s out of sample performance YTD is -8.9%, and for the last 12 months is -7.4%. Over the same period the benchmark SPY performance was 10.7% and 18.2% respectively. Over the previous week the market value of the iM-Composite(Gold-Stocks-Bond) Timer gained -0.79% at a time when SPY gained 0.24%. A starting capital of $100,000 at inception on 6/30/2016 would have grown to $117,243 which includes $10 cash and excludes $1,956 spent on fees and slippage. |
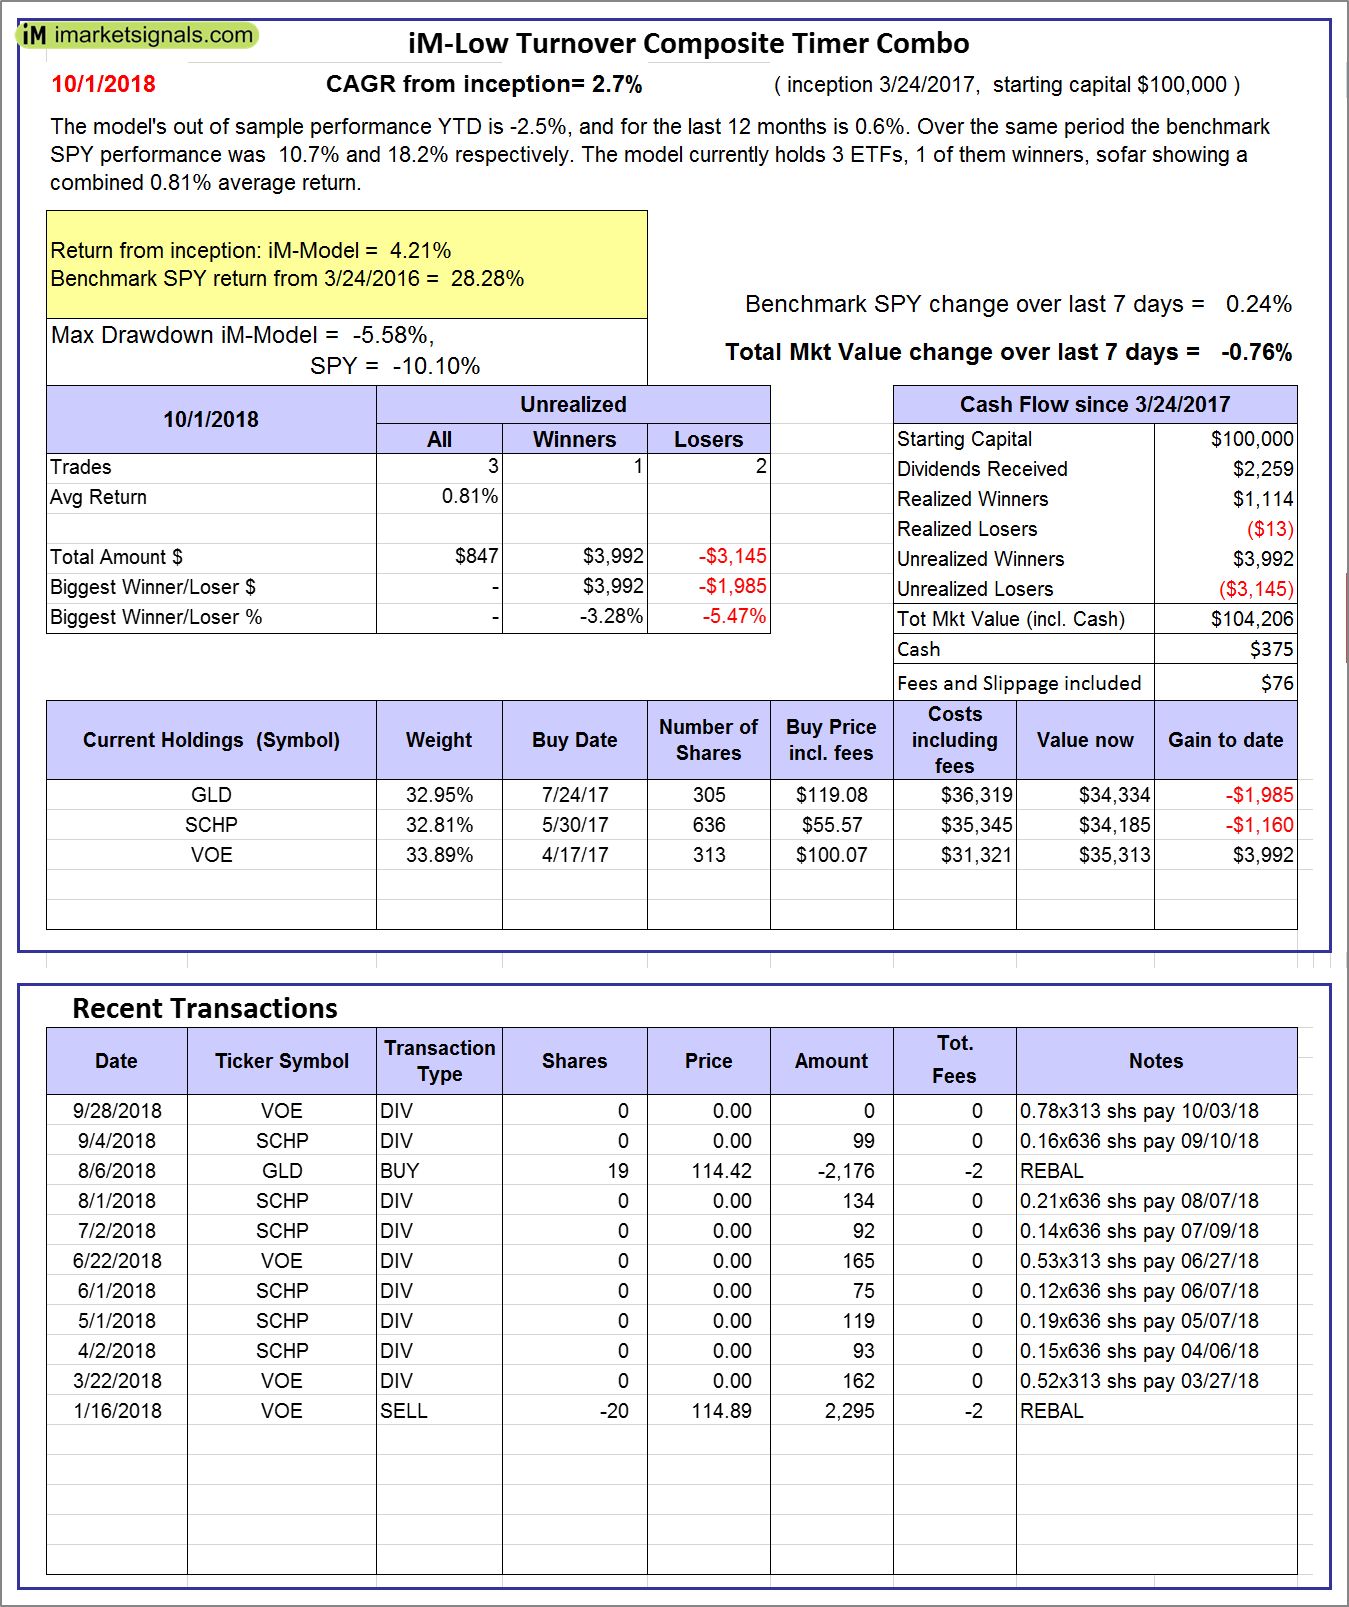 |
iM-Low Turnover Composite Timer Combo: The model’s out of sample performance YTD is -2.5%, and for the last 12 months is 0.6%. Over the same period the benchmark SPY performance was 10.7% and 18.2% respectively. Over the previous week the market value of the iM-Low Turnover Composite Timer Combo gained -0.76% at a time when SPY gained 0.24%. A starting capital of $100,000 at inception on 3/24/27 would have grown to $104,206 which includes $375 cash and excludes $76 spent on fees and slippage. |
 |
iM-Min Drawdown Combo: The model’s out of sample performance YTD is 2.3%, and for the last 12 months is 6.8%. Over the same period the benchmark SPY performance was 10.7% and 18.2% respectively. Over the previous week the market value of the iM-Min Drawdown Combo gained -0.70% at a time when SPY gained 0.24%. A starting capital of $100,000 at inception on 4/5/2017 would have grown to $110,061 which includes $1,282 cash and excludes $396 spent on fees and slippage. |
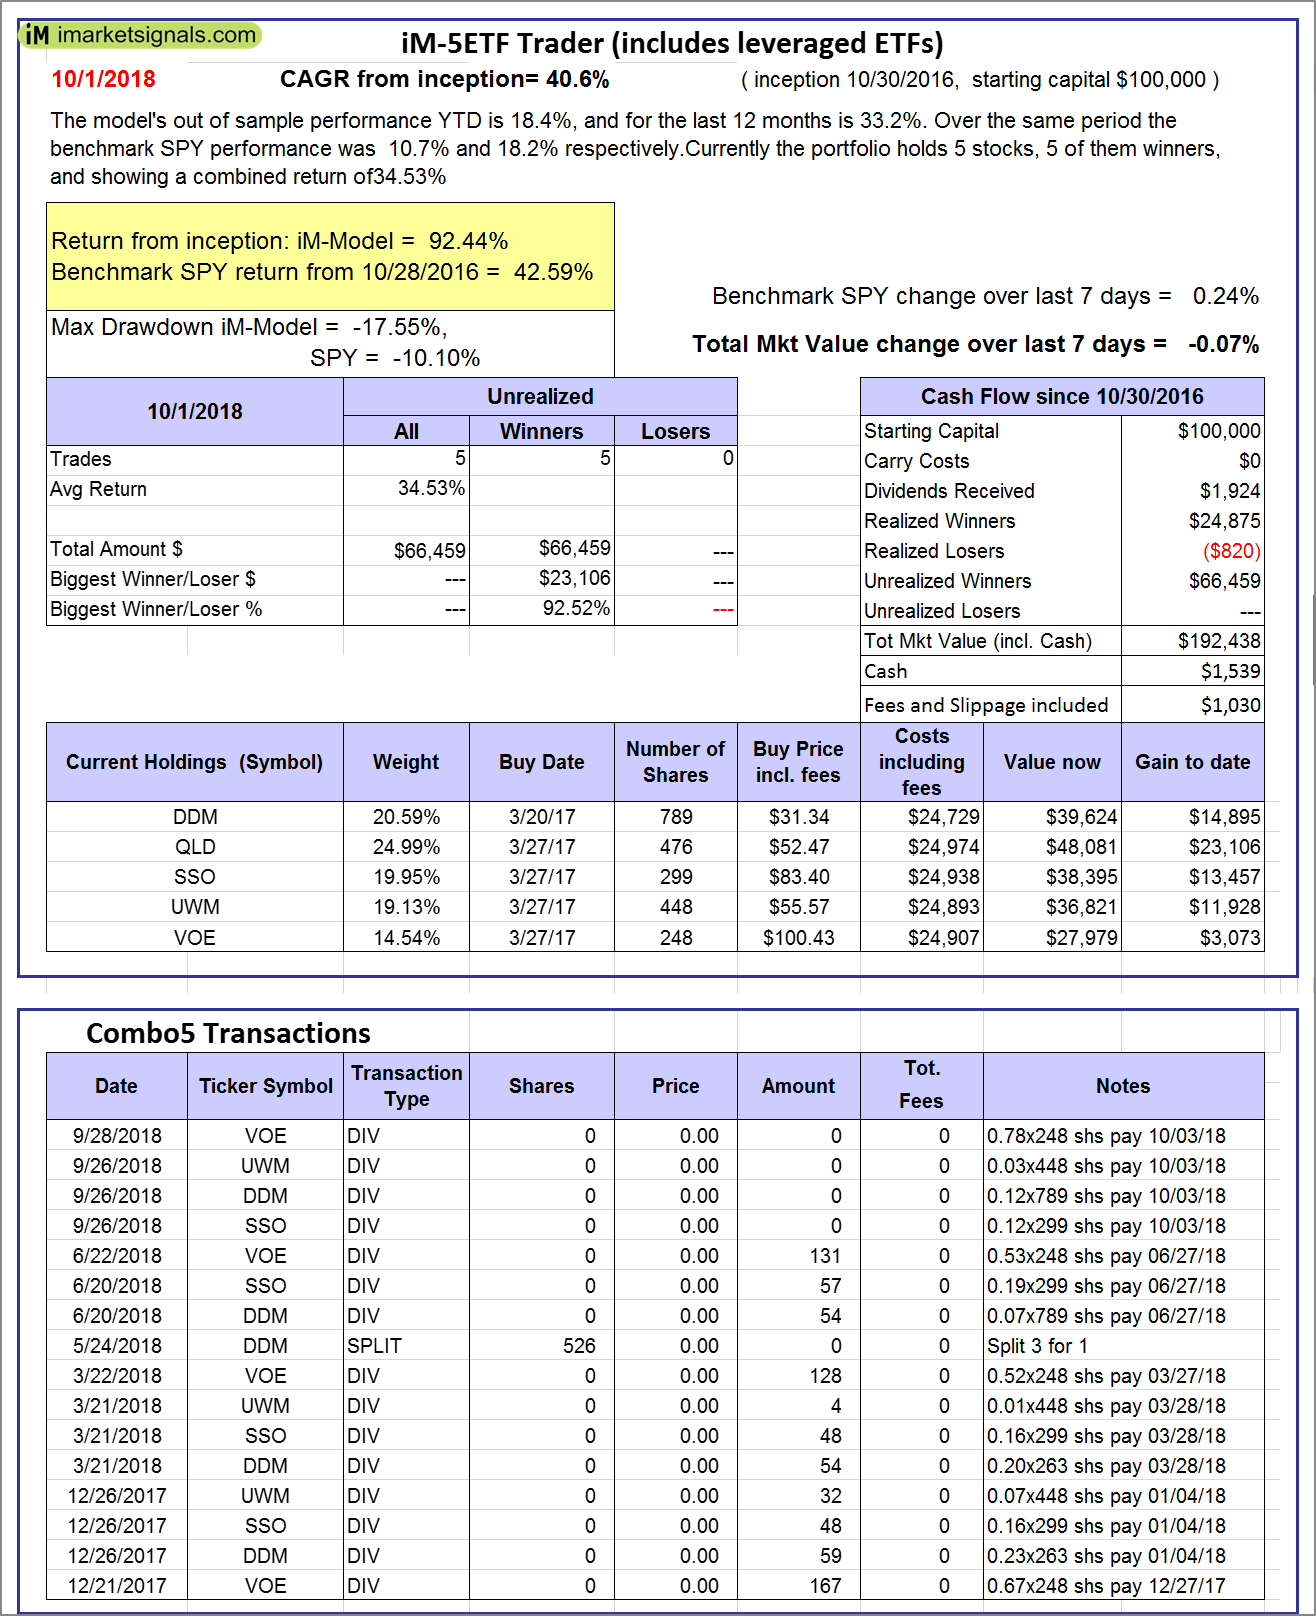 |
iM-5ETF Trader (includes leveraged ETFs): The model’s out of sample performance YTD is 18.4%, and for the last 12 months is 33.2%. Over the same period the benchmark SPY performance was 10.7% and 18.2% respectively. Over the previous week the market value of the iM-5ETF Trader (includes leveraged ETFs) gained -0.07% at a time when SPY gained 0.24%. A starting capital of $100,000 at inception on 10/30/2016 would have grown to $192,438 which includes $1,539 cash and excludes $1,030 spent on fees and slippage. |
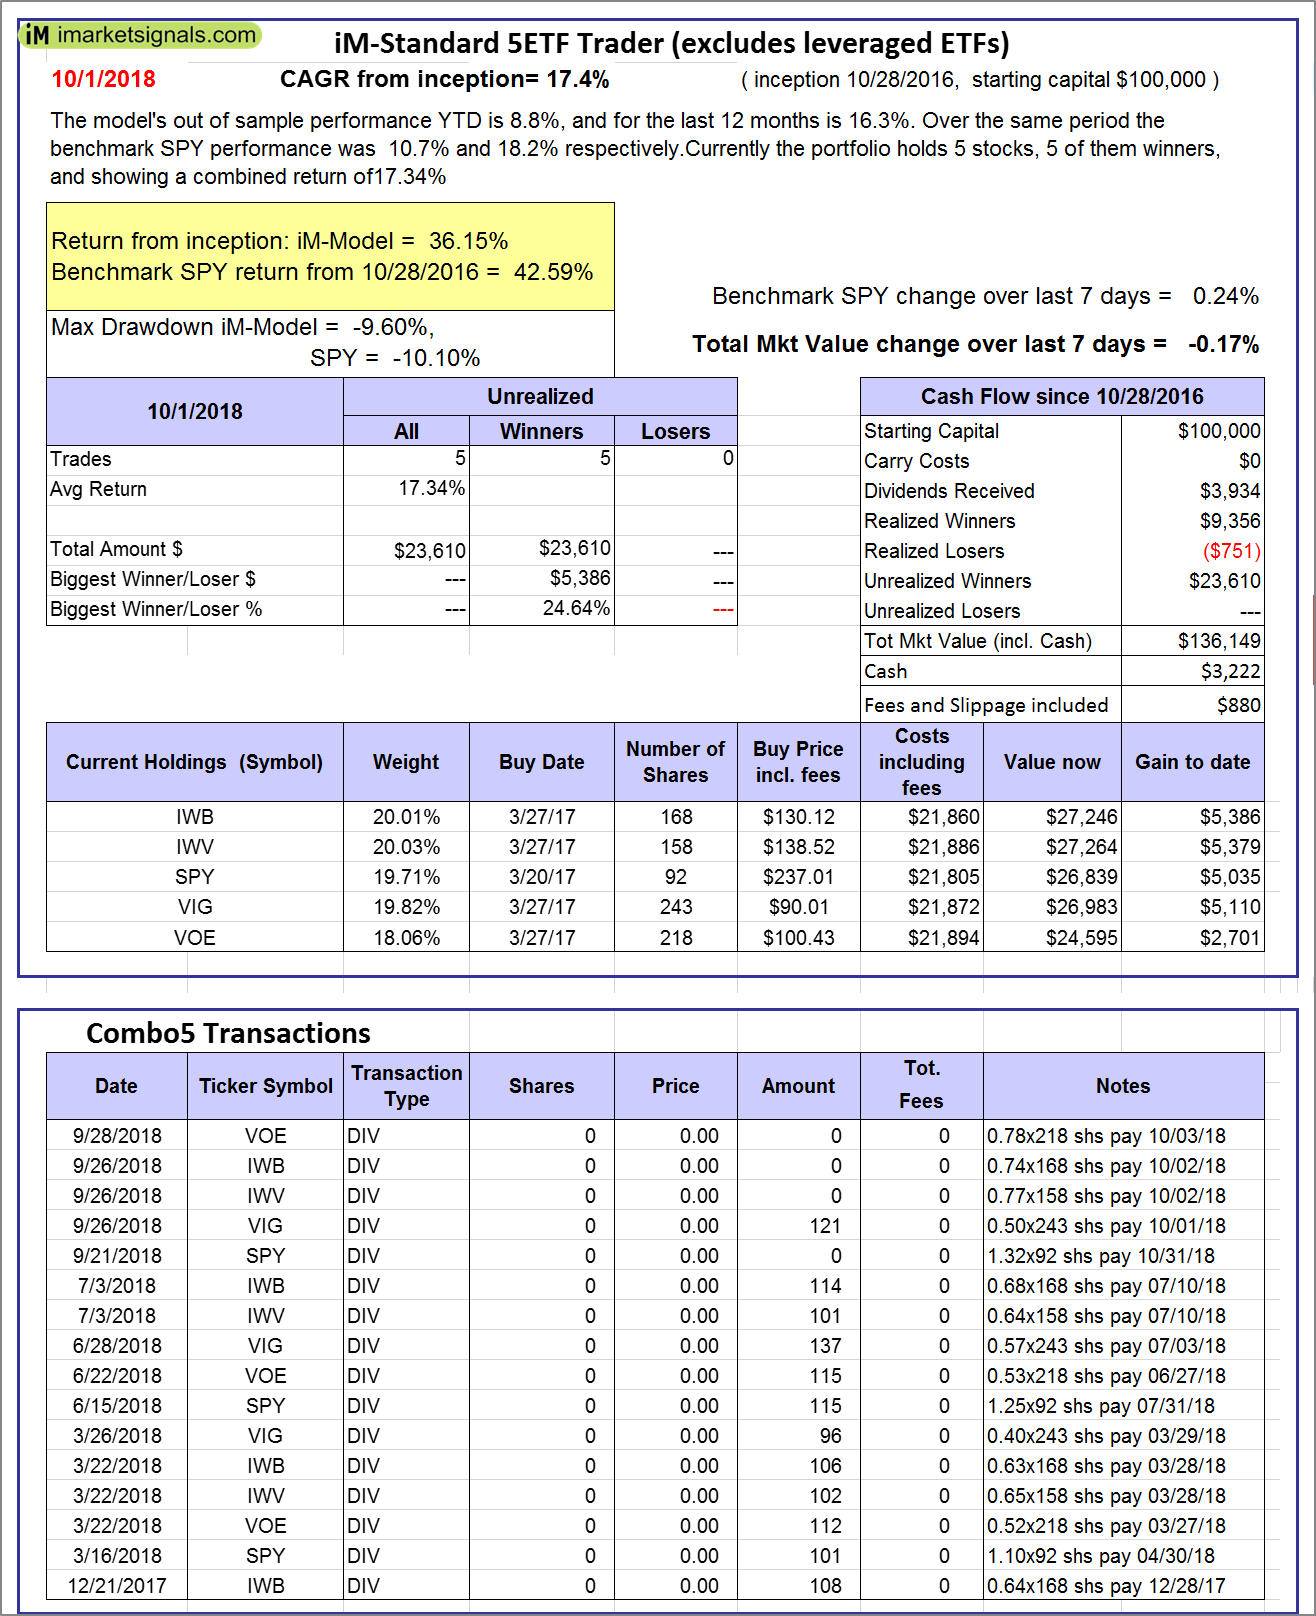 |
iM-Standard 5ETF Trader (excludes leveraged ETFs): The model’s out of sample performance YTD is 8.8%, and for the last 12 months is 16.3%. Over the same period the benchmark SPY performance was 10.7% and 18.2% respectively. Over the previous week the market value of the iM-Standard 5ETF Trader (excludes leveraged ETFs) gained -0.17% at a time when SPY gained 0.24%. A starting capital of $100,000 at inception on 10/30/2016 would have grown to $136,149 which includes $3,222 cash and excludes $880 spent on fees and slippage. |
iM-Best Reports – 10/1/2018
Posted in pmp SPY-SH
Leave a Reply
You must be logged in to post a comment.