
  |
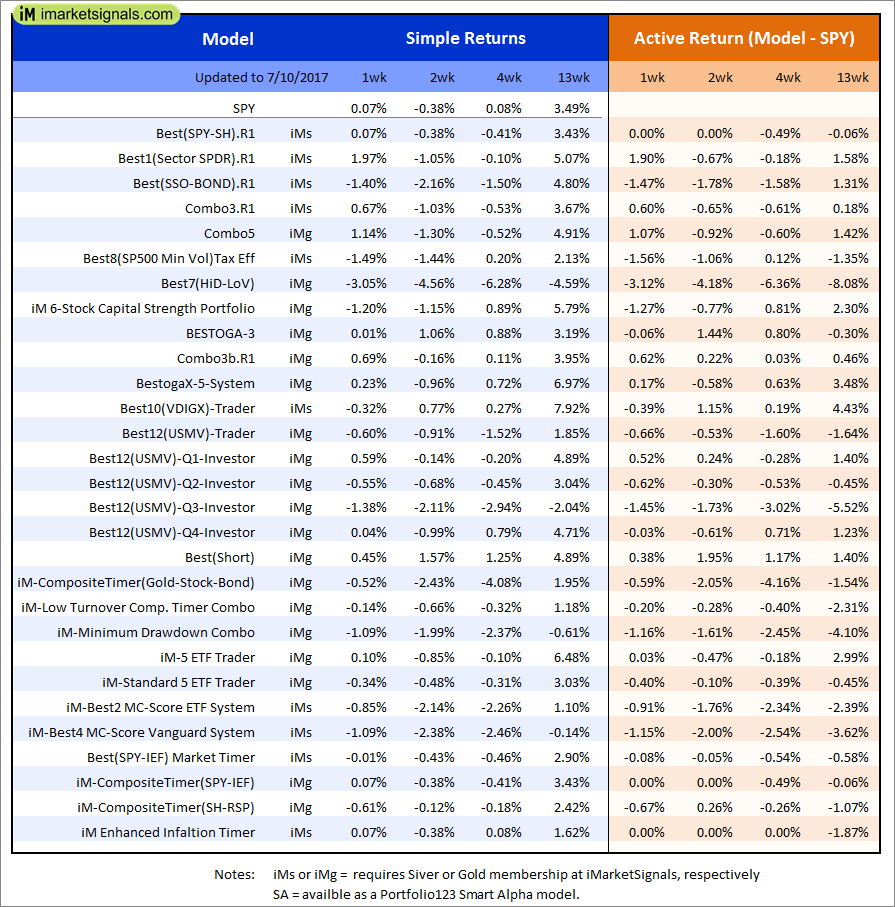
Out of sample performance summary of our models for the past 1, 2, 4 and 13 week periods. The active active return indicates how the models over- or underperformed the benchmark ETF SPY. Also the YTD, and the 1-, 3-, 5- and 10-year annualized returns are shown in the second table |
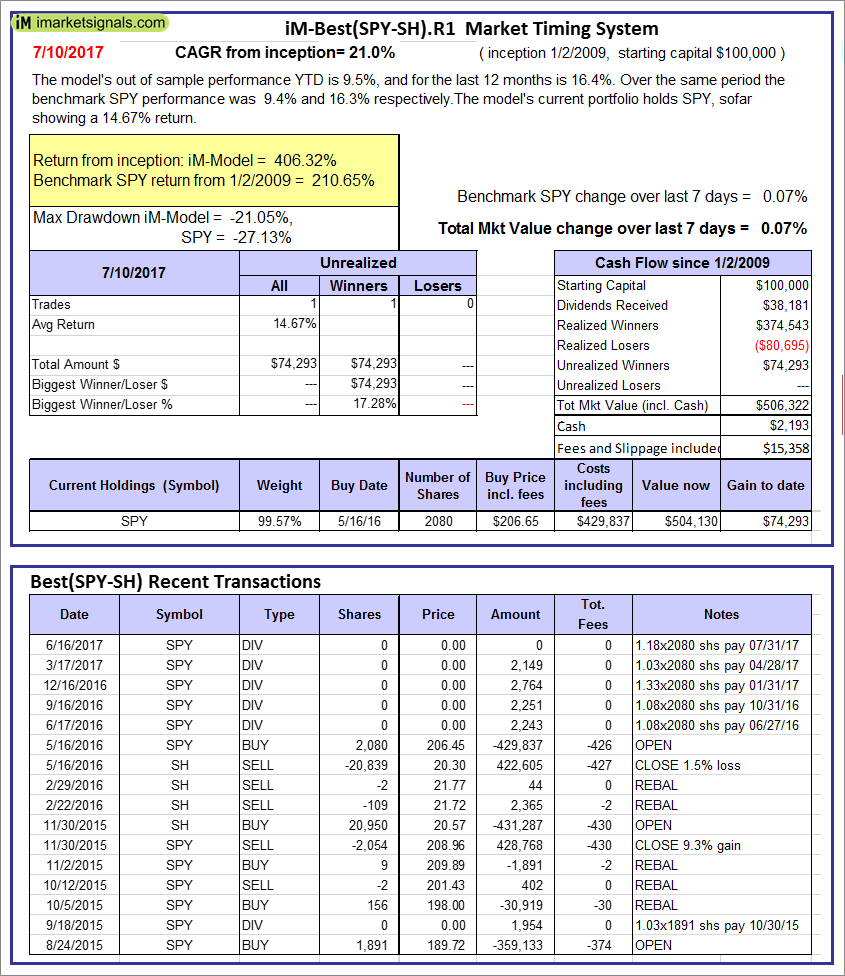 |
iM-Best(SPY-SH).R1: The model’s out of sample performance YTD is 9.5%, and for the last 12 months is 16.4%. Over the same period the benchmark SPY performance was 9.4% and 16.3% respectively. Over the previous week the market value of Best(SPY-SH) gained 0.07% at a time when SPY gained 0.07%. A starting capital of $100,000 at inception on 1/2/2009 would have grown to $506,322 which includes $2,193 cash and excludes $15,358 spent on fees and slippage. |
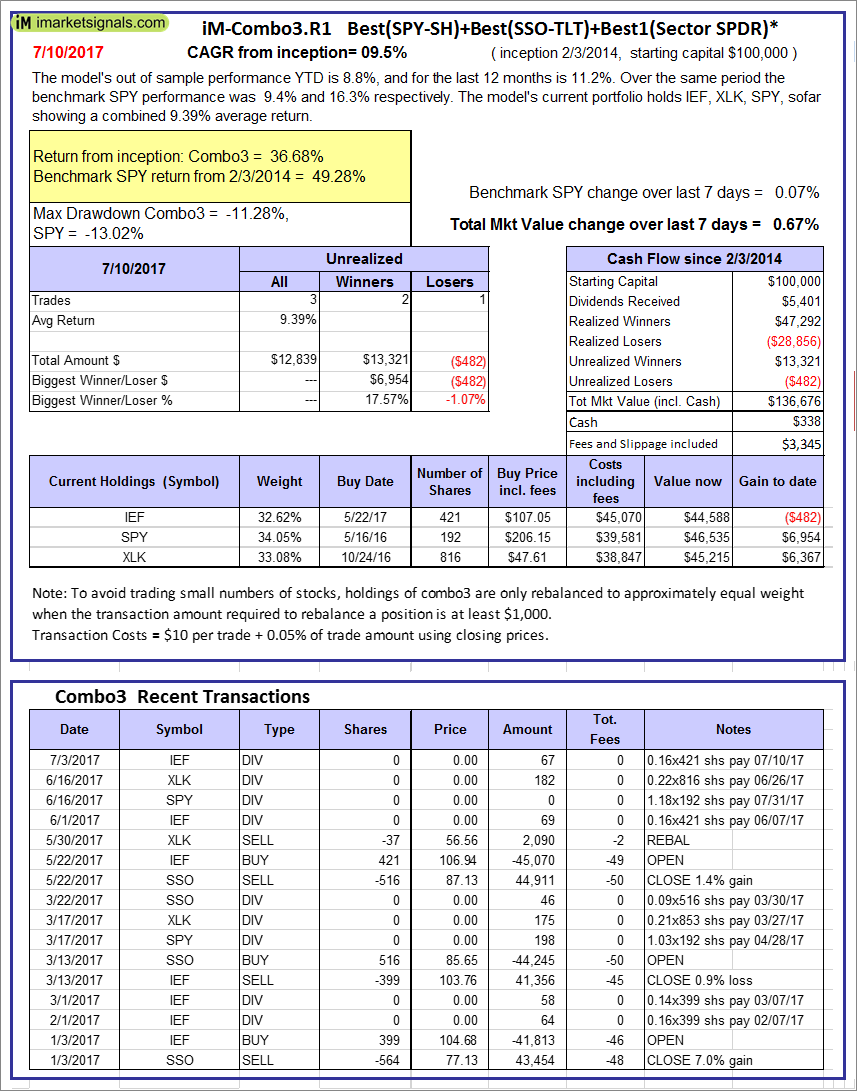 |
iM-Combo3.R1: The model’s out of sample performance YTD is 8.8%, and for the last 12 months is 11.2%. Over the same period the benchmark SPY performance was 9.4% and 16.3% respectively. Over the previous week the market value of iM-Combo3.R1 gained 0.67% at a time when SPY gained 0.07%. A starting capital of $100,000 at inception on 2/3/2014 would have grown to $136,676 which includes $338 cash and excludes $3,345 spent on fees and slippage. |
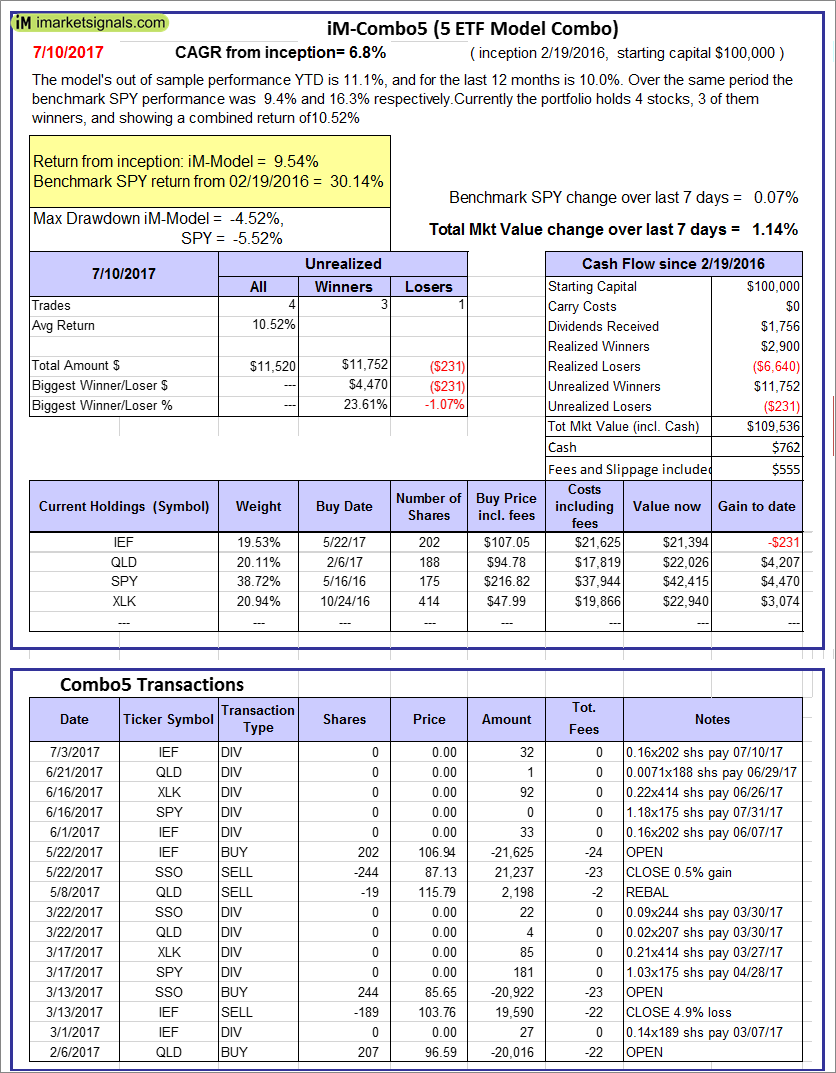 |
iM-Combo5: The model’s out of sample performance YTD is 11.1%, and for the last 12 months is 10.0%. Over the same period the benchmark SPY performance was 9.4% and 16.3% respectively. Over the previous week the market value of iM-Combo5 gained 1.14% at a time when SPY gained 0.07%. A starting capital of $100,000 at inception on 2/22/2016 would have grown to $109,536 which includes $762 cash and excludes $555 spent on fees and slippage. |
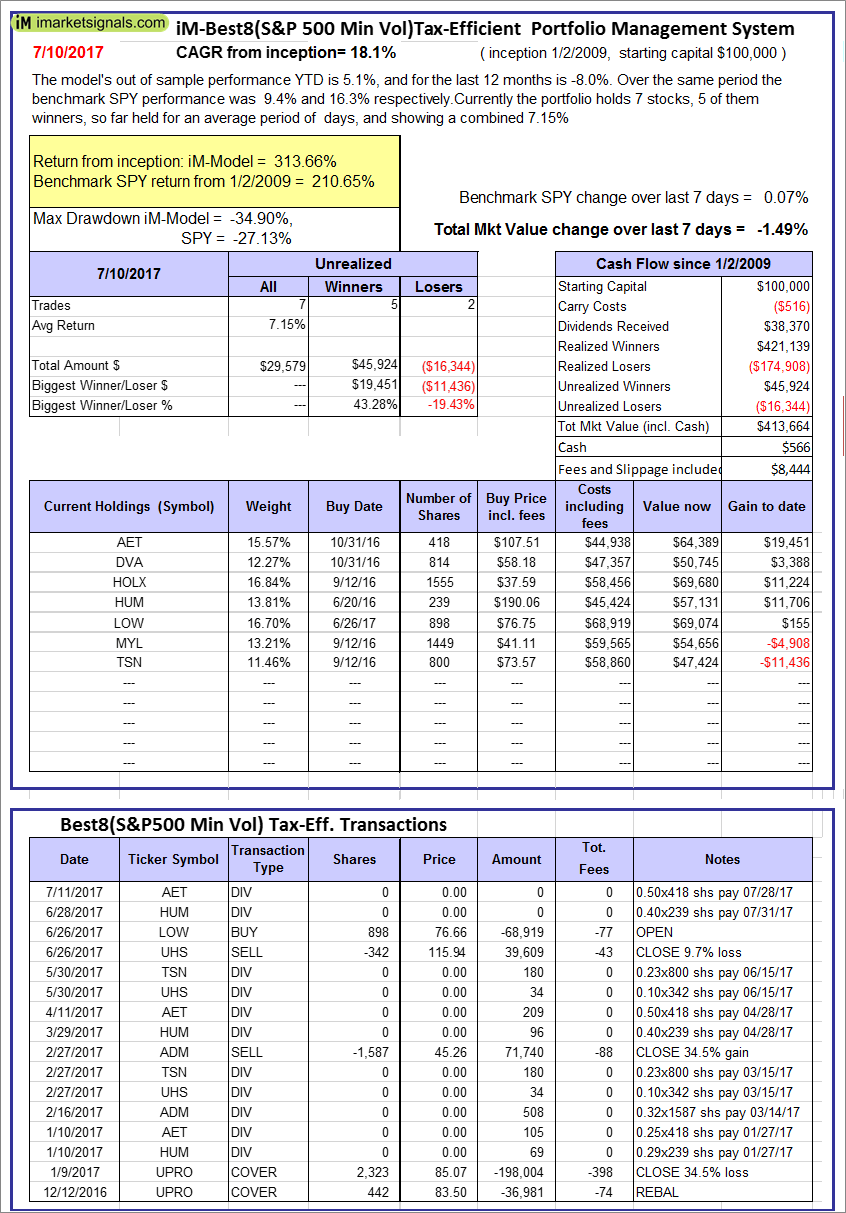 |
The iM-Best8(S&P500 Min Vol)Tax-Efficient The model’s out of sample performance YTD is 5.1%, and for the last 12 months is -8.0%. Over the same period the benchmark SPY performance was 9.4% and 16.3% respectively. Over the previous week the market value of iM-Best8(S&P 500)Tax-Eff. gained -1.49% at a time when SPY gained 0.07%. A starting capital of $100,000 at inception on 1/2/2009 would have grown to $413,664 which includes $566 cash and excludes $8,444 spent on fees and slippage. |
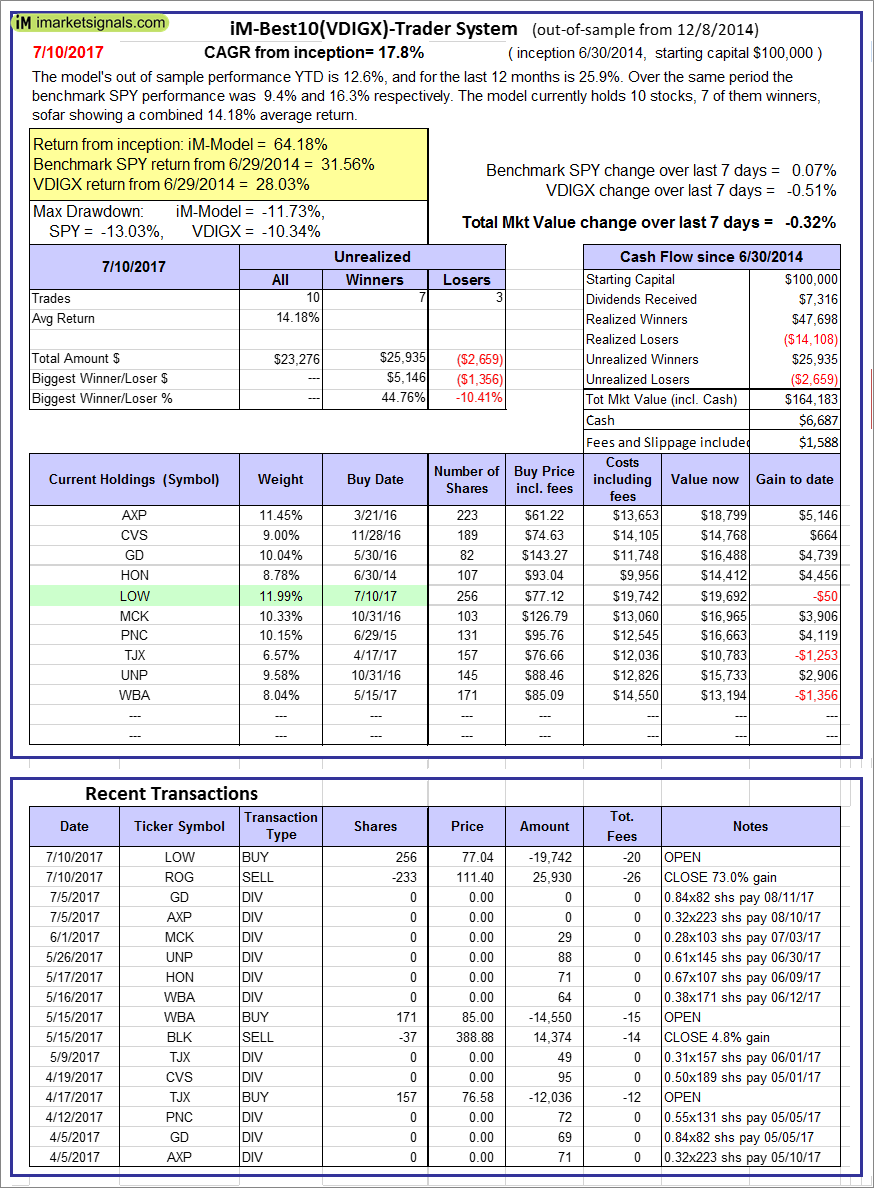  |
iM-Best10(VDIGX)-Trader: The model’s out of sample performance YTD is 12.6%, and for the last 12 months is 25.9%. Over the same period the benchmark SPY performance was 9.4% and 16.3% respectively. Since inception, on 7/1/2014, the model gained 64.18% while the benchmark SPY gained 31.56% and VDIGX gained 28.03% over the same period. Over the previous week the market value of iM-Best10(VDIGX) gained -0.32% at a time when SPY gained 0.07%. A starting capital of $100,000 at inception on 7/1/2014 would have grown to $164,183 which includes $6,687 cash and excludes $1,588 spent on fees and slippage. |
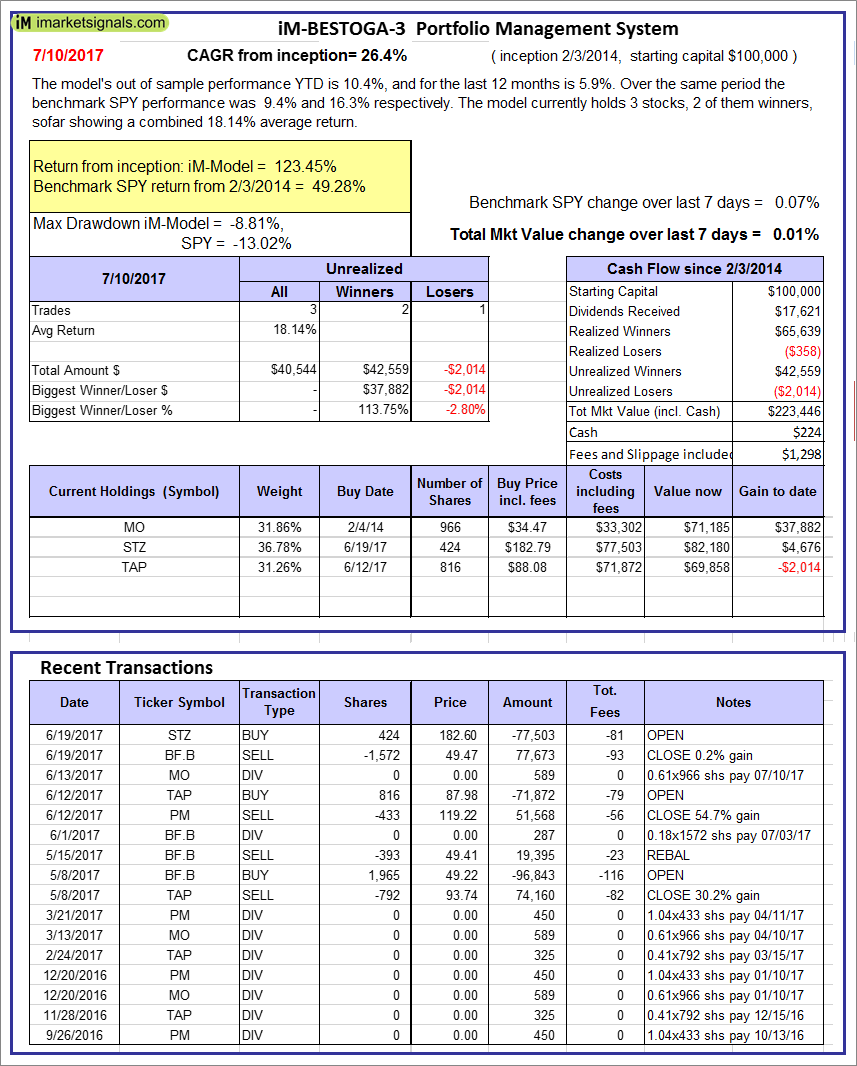 |
iM-BESTOGA-3: The model’s out of sample performance YTD is 10.4%, and for the last 12 months is 5.9%. Over the same period the benchmark SPY performance was 9.4% and 16.3% respectively. Over the previous week the market value of iM-BESTOGA-3 gained 0.01% at a time when SPY gained 0.07%. A starting capital of $100,000 at inception on 2/3/2014 would have grown to $223,446 which includes $224 cash and excludes $1,298 spent on fees and slippage. |
 |
iM-Best7(HiD-LoV): The model’s out of sample performance YTD is 0.2%, and for the last 12 months is 2.3%. Over the same period the benchmark SPY performance was 9.4% and 16.3% respectively. Over the previous week the market value of iM-BESTOGA-3 gained -3.05% at a time when SPY gained 0.07%. A starting capital of $100,000 at inception on 6/30/2016 would have grown to $102,908 which includes $243 cash and excludes $979 spent on fees and slippage. |
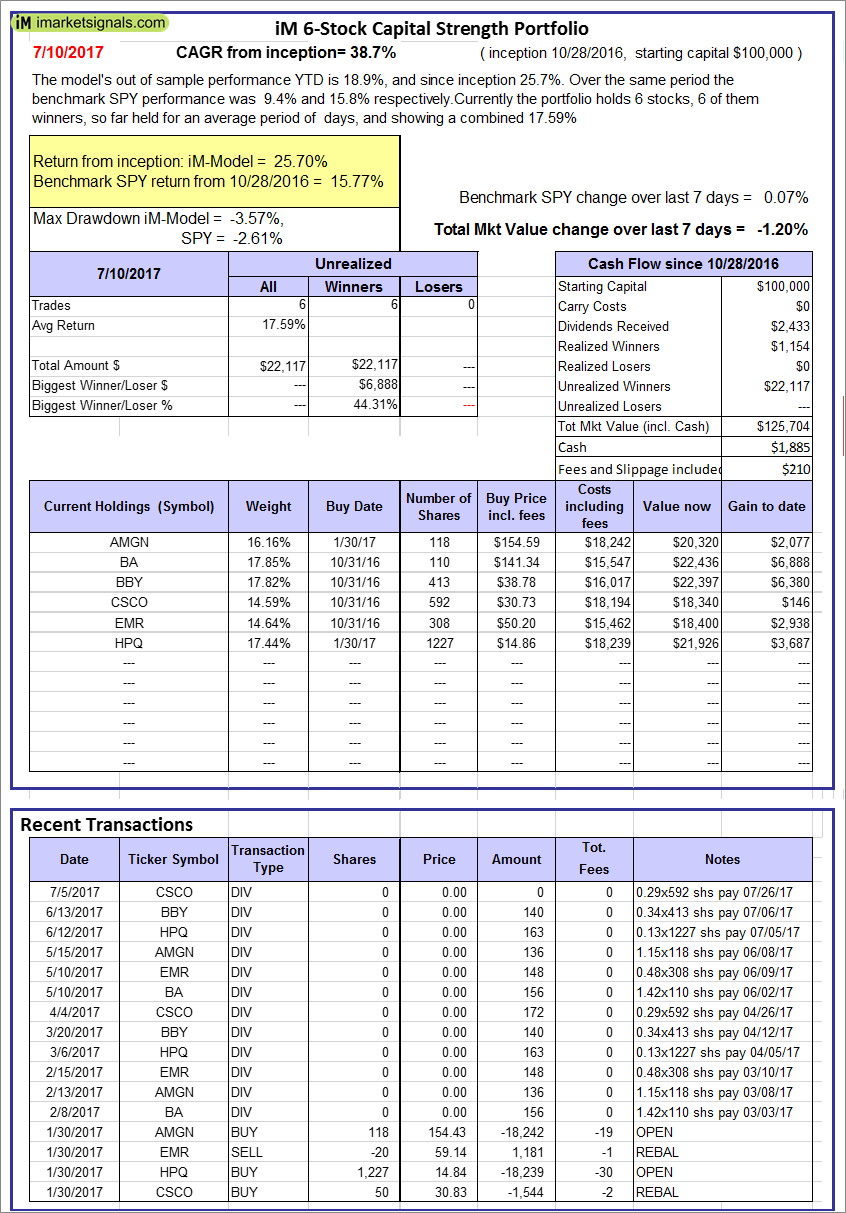 |
iM 6-Stock Capital Strength Portfolio: The model’s out of sample performance YTD is 18.9%, and since inception 25.7%. Over the same period the benchmark SPY performance was 9.4% and 15.8% respectively. Over the previous week the market value of the iM 6-Stock Capital Strength Portfolio gained -1.20% at a time when SPY gained 0.07%. A starting capital of $100,000 at inception on 10/28/2016 would have grown to $125,704 which includes $1,885 cash and excludes $210 spent on fees and slippage. |
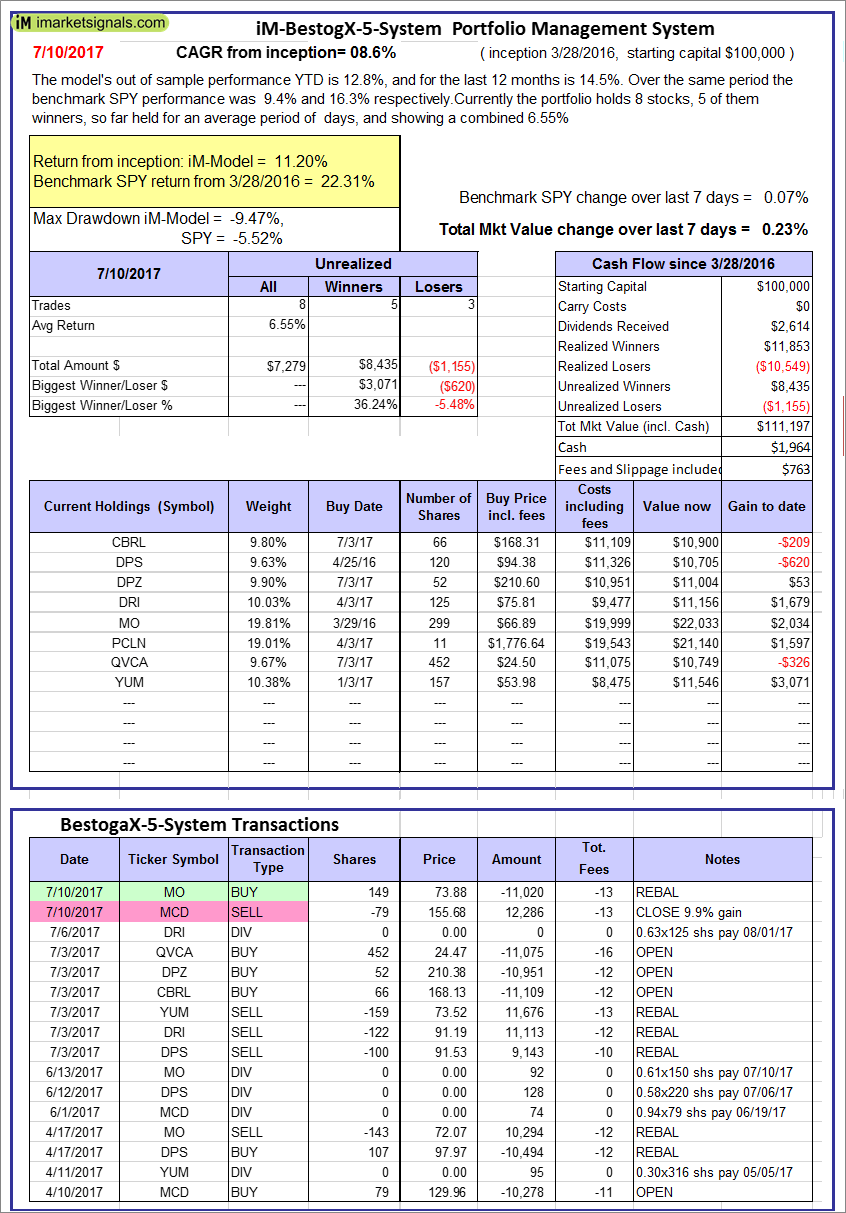 |
iM-BestogaX5-System: The model’s out of sample performance YTD is 12.8%, and for the last 12 months is 14.5%. Over the same period the benchmark SPY performance was 9.4% and 16.3% respectively. Over the previous week the market value of iM-Best8(S&P 500)Tax-Eff. gained 0.23% at a time when SPY gained 0.07%. A starting capital of $100,000 at inception on 3/28/2016 would have grown to $111,197 which includes $1,964 cash and excludes $763 spent on fees and slippage. |
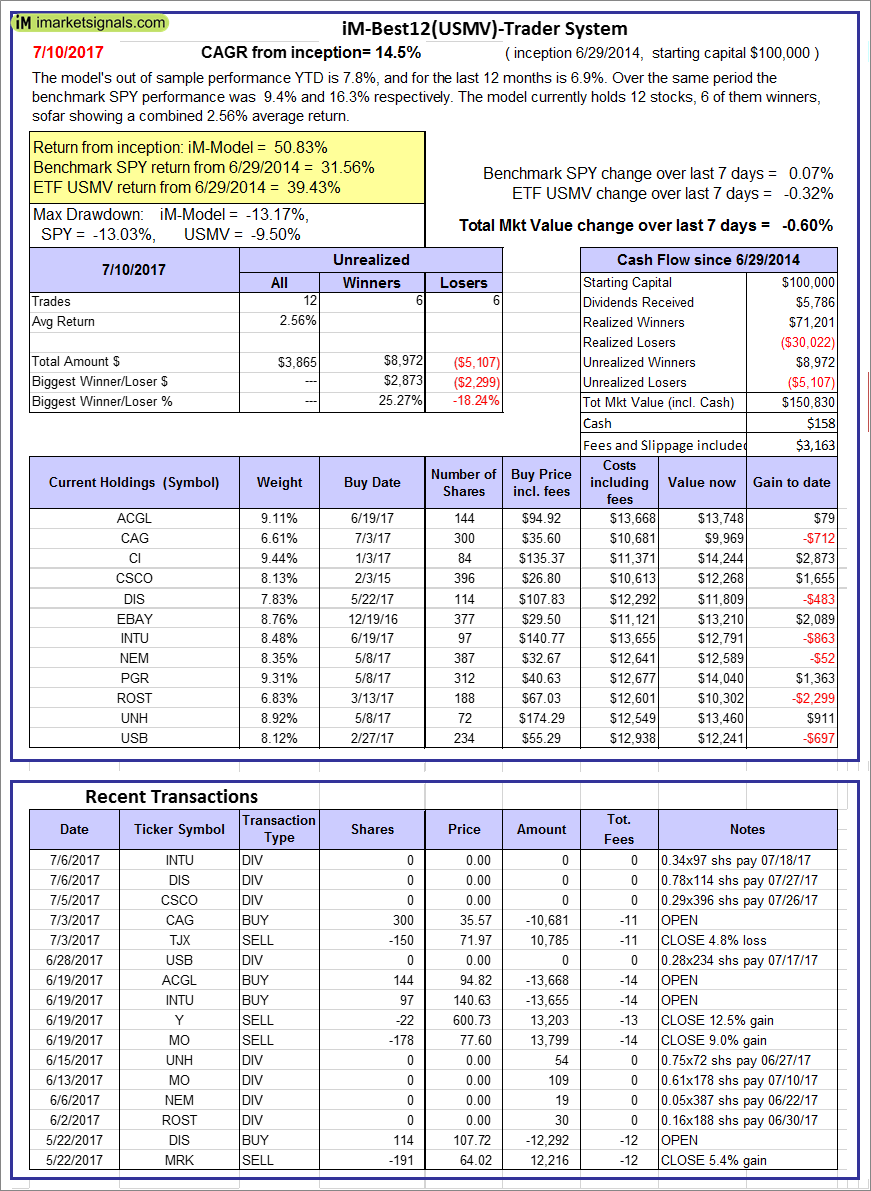 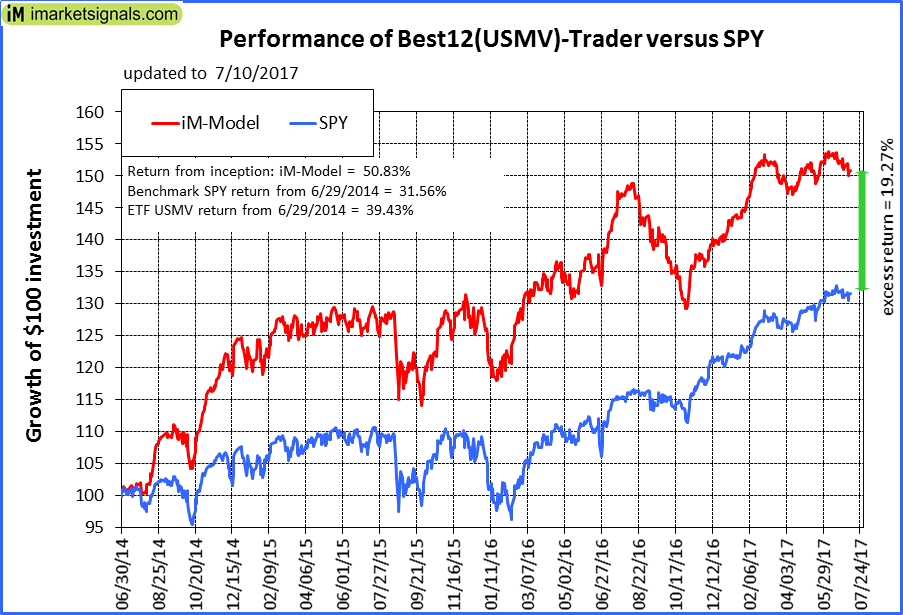 |
iM-Best12(USMV)-Trader: The model’s out of sample performance YTD is 7.8%, and for the last 12 months is 6.9%. Over the same period the benchmark SPY performance was 9.4% and 16.3% respectively. Since inception, on 6/30/2014, the model gained 50.83% while the benchmark SPY gained 31.56% and the ETF USMV gained 39.43% over the same period. Over the previous week the market value of iM-Best12(USMV)-Trader gained -0.60% at a time when SPY gained 0.07%. A starting capital of $100,000 at inception on 6/30/2014 would have grown to $150,830 which includes $158 cash and excludes $3,163 spent on fees and slippage. |
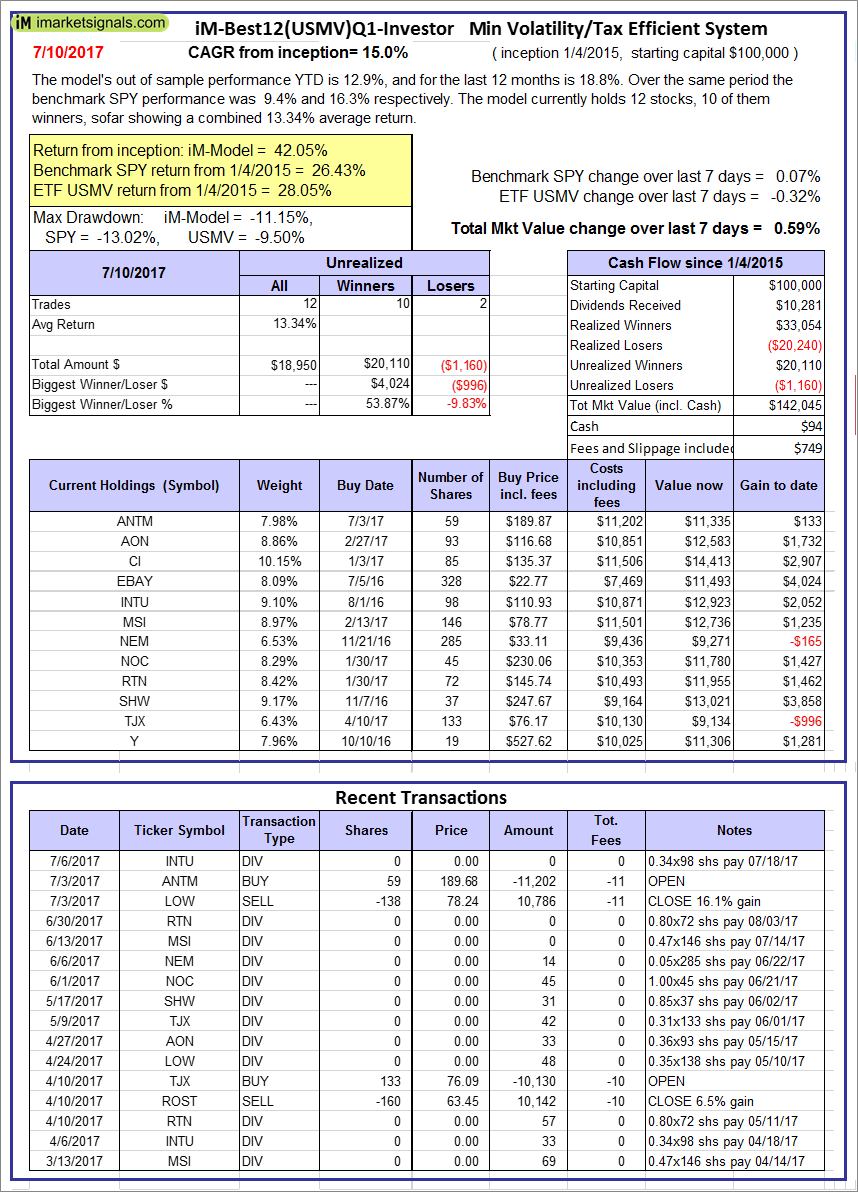 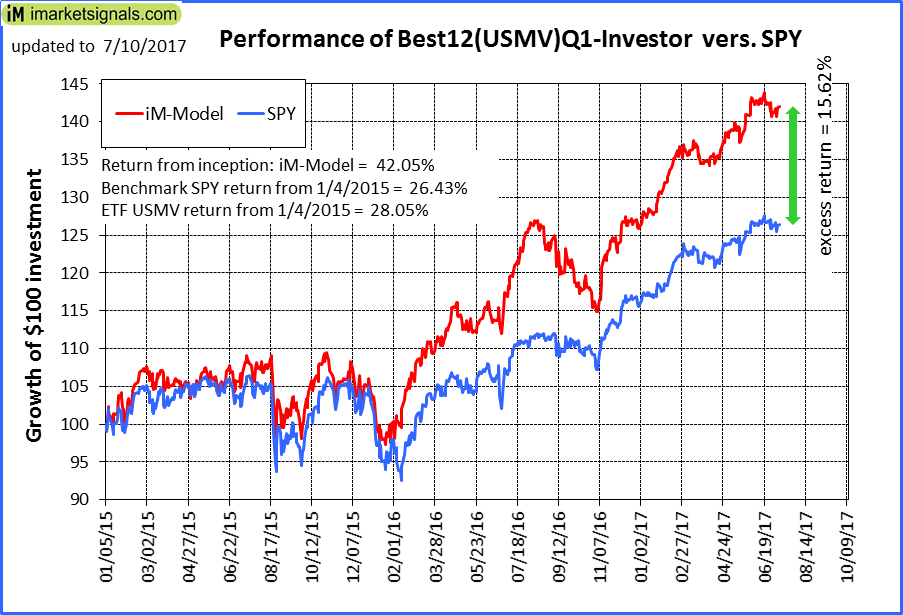 |
iM-Best12(USMV)Q1-Investor: The model’s out of sample performance YTD is 12.9%, and for the last 12 months is 18.8%. Over the same period the benchmark SPY performance was 9.4% and 16.3% respectively. Since inception, on 1/5/2015, the model gained 42.05% while the benchmark SPY gained 26.43% and the ETF USMV gained 28.05% over the same period. Over the previous week the market value of iM-Best12(USMV)Q1 gained 0.59% at a time when SPY gained 0.07%. A starting capital of $100,000 at inception on 1/5/2015 would have grown to $142,045 which includes $94 cash and excludes $749 spent on fees and slippage. |
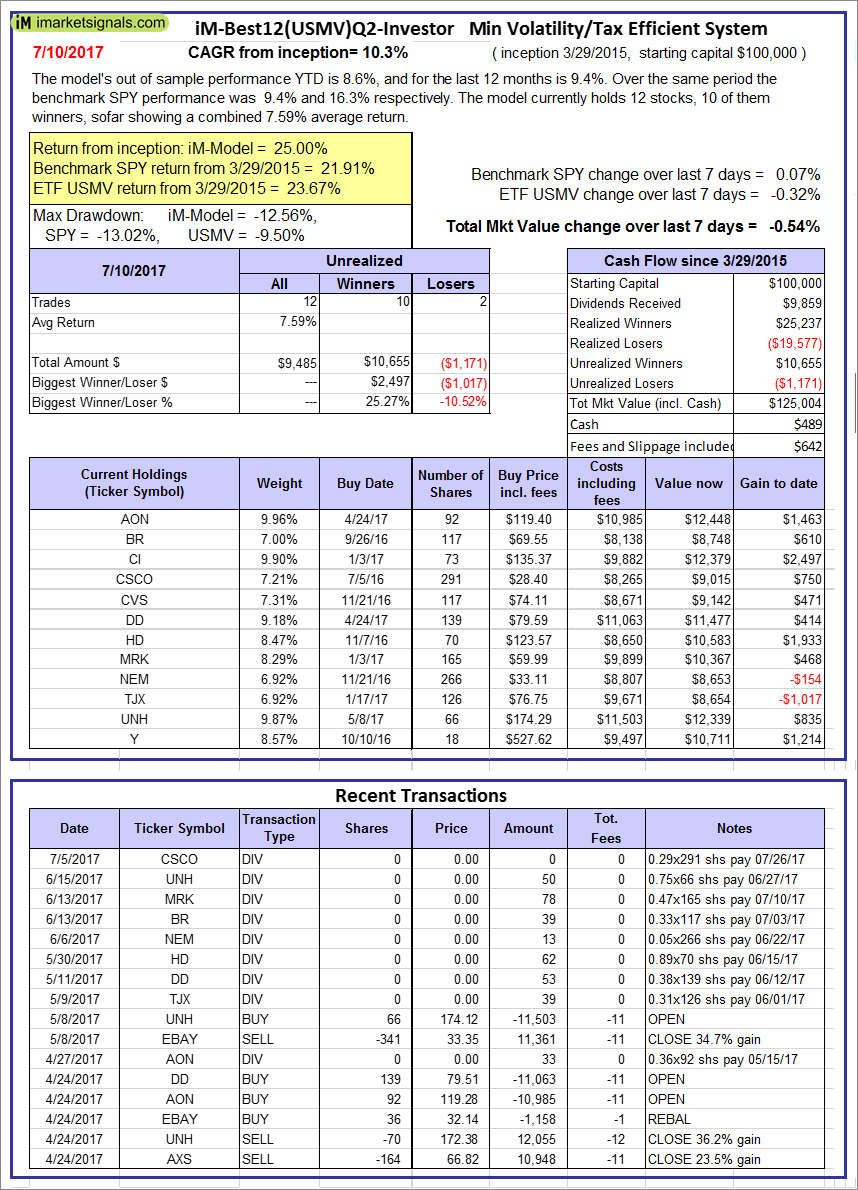 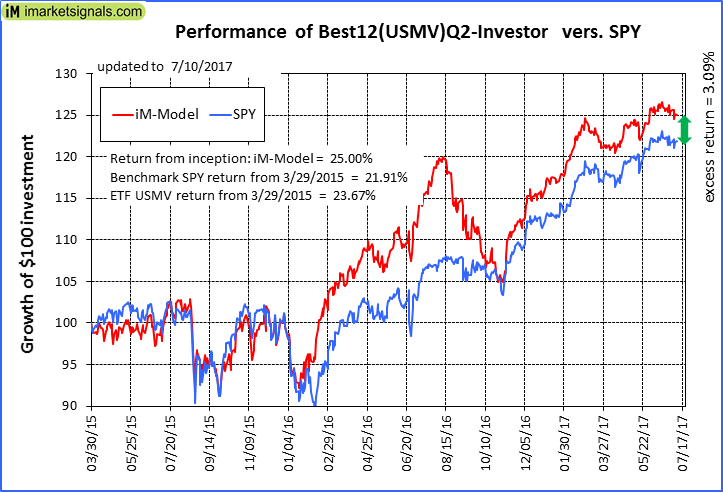 |
iM-Best12(USMV)Q2-Investor: The model’s out of sample performance YTD is 8.6%, and for the last 12 months is 9.4%. Over the same period the benchmark SPY performance was 9.4% and 16.3% respectively. Since inception, on 3/30/2015, the model gained 25.00% while the benchmark SPY gained 21.91% and the ETF USMV gained 23.67% over the same period. Over the previous week the market value of iM-Best12(USMV)Q2 gained -0.54% at a time when SPY gained 0.07%. A starting capital of $100,000 at inception on 3/30/2015 would have grown to $125,004 which includes $489 cash and excludes $642 spent on fees and slippage. |
 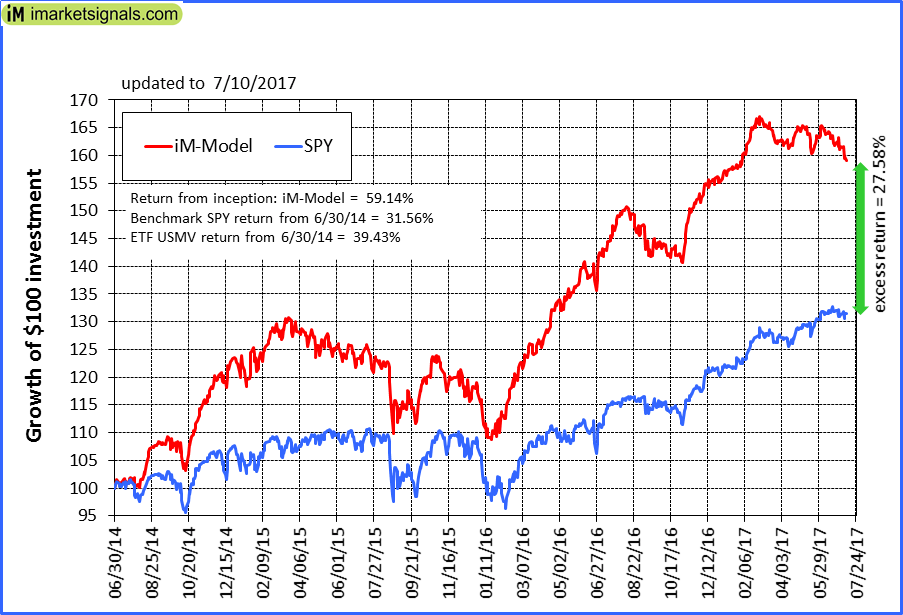 |
iM-Best12(USMV)Q3-Investor: The model’s out of sample performance YTD is 2.7%, and for the last 12 months is 11.2%. Over the same period the benchmark SPY performance was 9.4% and 16.3% respectively. Since inception, on 7/1/2014, the model gained 59.14% while the benchmark SPY gained 31.56% and the ETF USMV gained 39.43% over the same period. Over the previous week the market value of iM-Best12(USMV)Q3 gained -1.38% at a time when SPY gained 0.07%. A starting capital of $100,000 at inception on 7/1/2014 would have grown to $159,138 which includes $1,032 cash and excludes $972 spent on fees and slippage. |
  |
iM-Best12(USMV)Q4-Investor: Since inception, on 9/29/2014, the model gained 55.74% while the benchmark SPY gained 29.57% and the ETF USMV gained 37.50% over the same period. Over the previous week the market value of iM-Best12(USMV)Q4 gained 0.04% at a time when SPY gained 0.07%. A starting capital of $100,000 at inception on 9/29/2014 would have grown to $155,735 which includes $290 cash and excludes $841 spent on fees and slippage. |
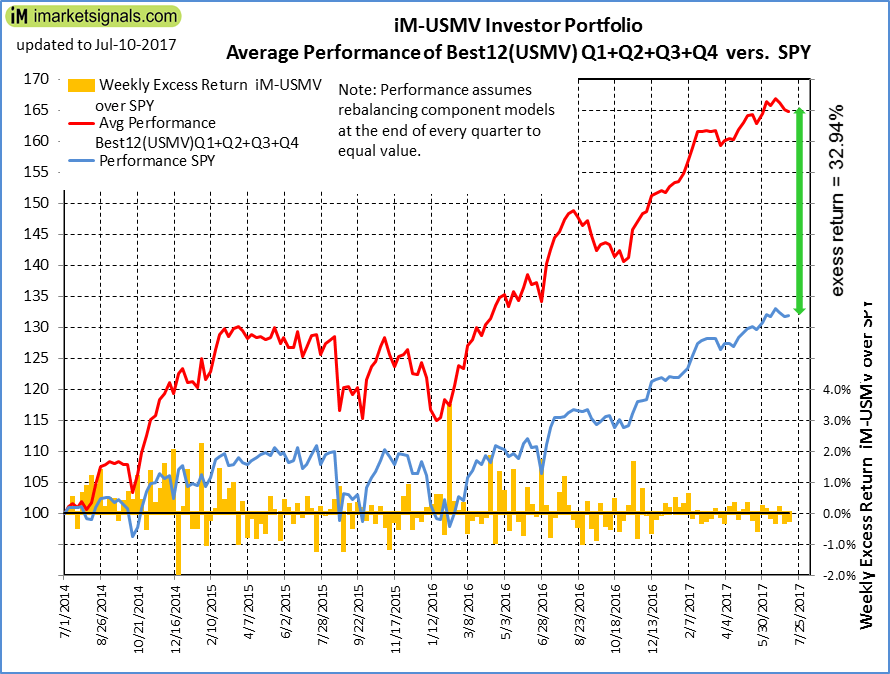 |
Average Performance of iM-Best12(USMV)Q1+Q2+Q3+Q4-Investor resulted in an excess return of 32.94% over SPY. (see iM-USMV Investor Portfolio) |
 |
iM-Best(Short): The model’s out of sample performance YTD is 3.6%, and for the last 12 months is 2.5%. Over the same period the benchmark SPY performance was 9.4% and 16.3% respectively. Over the previous week the market value of iM-Best(Short) gained 0.45% at a time when SPY gained 0.07%. Over the period 1/2/2009 to 7/10/2017 the starting capital of $100,000 would have grown to $100,231 which includes $100,231 cash and excludes $22,354 spent on fees and slippage. |
 |
iM-Best2 MC-Score ETF System: The model’s out of sample performance YTD is 7.4%, and for the last 12 months is 3.1%. Over the same period the benchmark SPY performance was 9.4% and 16.3% respectively. Over the previous week the market value of the iM-Best2 MC-Score ETF System gained -0.85% at a time when SPY gained 0.07%. A starting capital of $100,000 at inception on 6/30/2016 would have grown to $104,158 which includes $735 cash and excludes $107 spent on fees and slippage. |
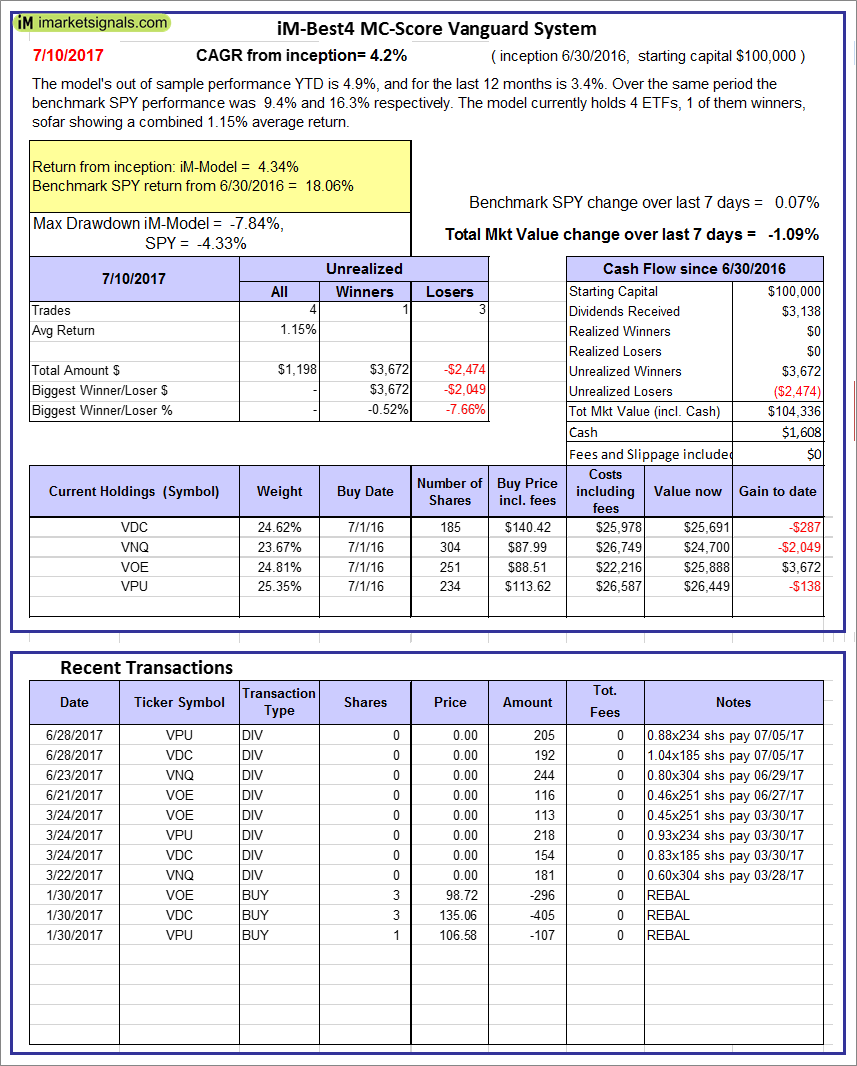 |
iM-Best4 MC-Score Vanguard System: The model’s out of sample performance YTD is 4.9%, and for the last 12 months is 3.4%. Over the same period the benchmark SPY performance was 9.4% and 16.3% respectively. Over the previous week the market value of the iM-Best4 MC-Score Vanguard System gained -1.09% at a time when SPY gained 0.07%. A starting capital of $100,000 at inception on 6/30/2016 would have grown to $104,336 which includes $1,608 cash and excludes $00 spent on fees and slippage. |
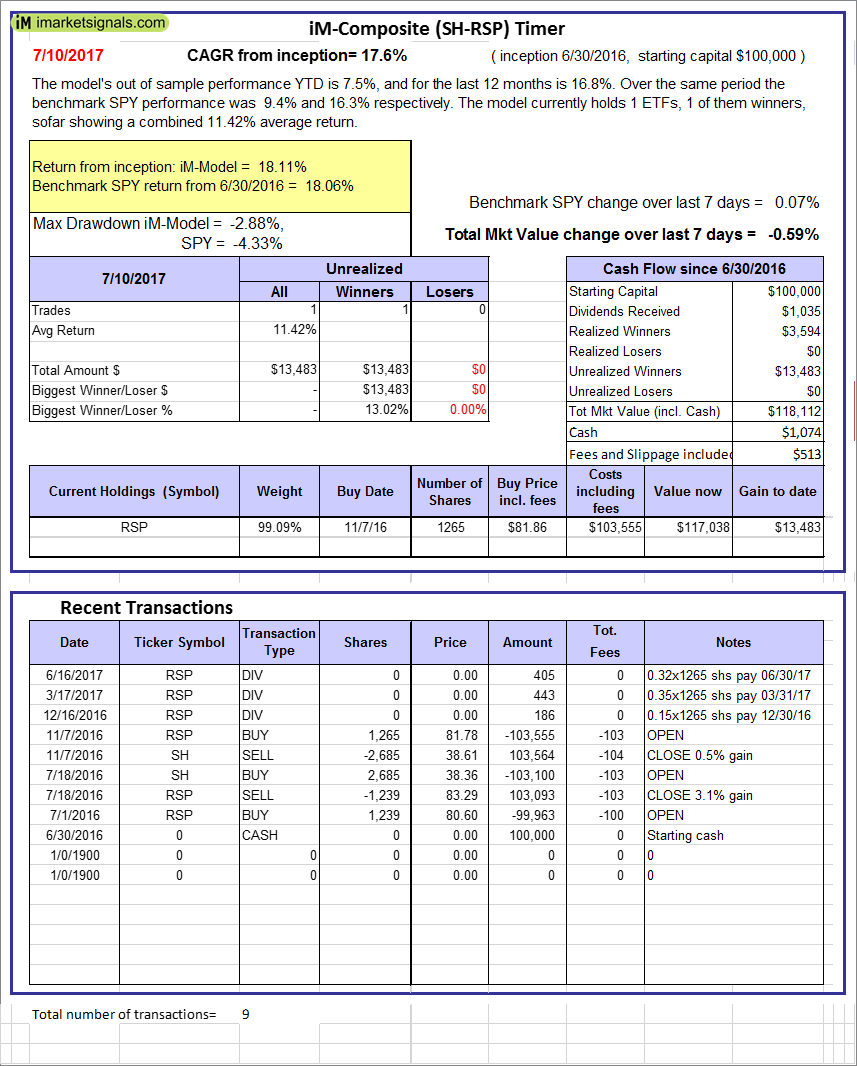 |
iM-Composite (SH-RSP) Timer: The model’s out of sample performance YTD is 7.5%, and for the last 12 months is 16.8%. Over the same period the benchmark SPY performance was 9.4% and 16.3% respectively. Over the previous week the market value of the iM-Composite (SH-RSP) Timer gained -0.59% at a time when SPY gained 0.07%. A starting capital of $100,000 at inception on 6/30/2016 would have grown to $118,112 which includes $1,074 cash and excludes $513 spent on fees and slippage. |
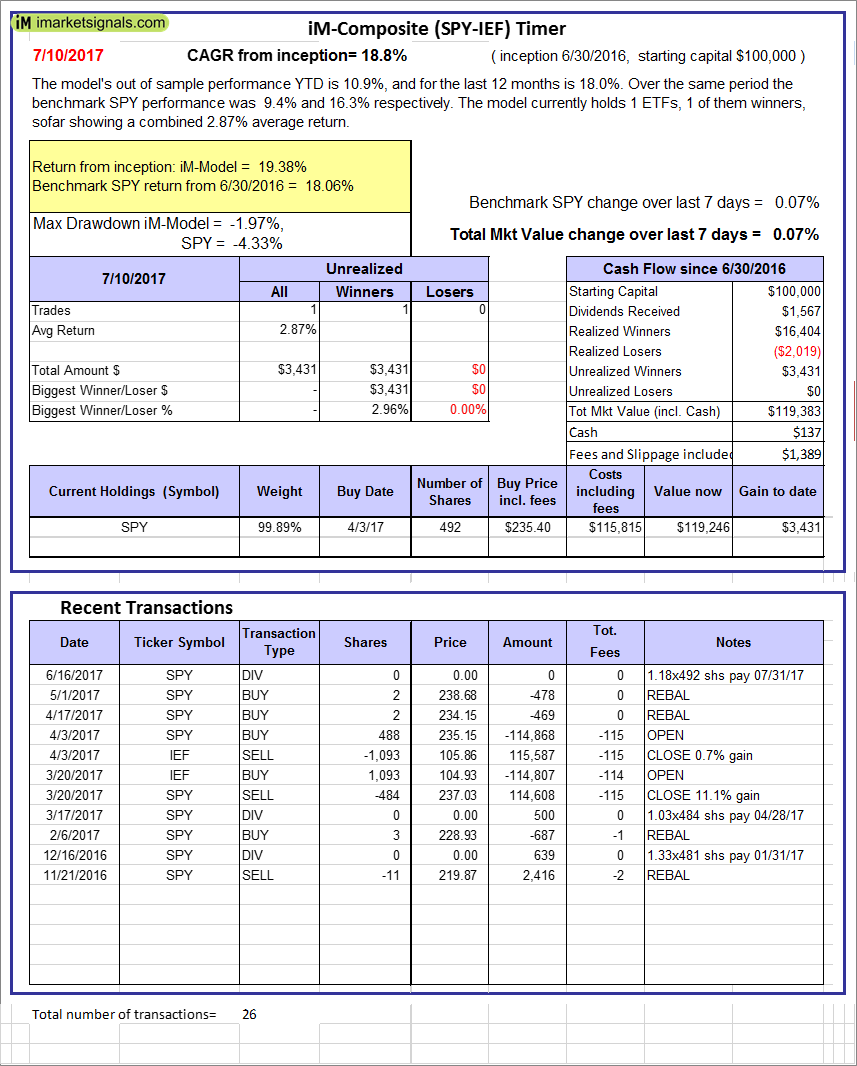 |
iM-Composite (SPY-IEF) Timer: The model’s out of sample performance YTD is 10.9%, and for the last 12 months is 18.0%. Over the same period the benchmark SPY performance was 9.4% and 16.3% respectively. Over the previous week the market value of the iM-Composite (SPY-IEF) Timer gained 0.07% at a time when SPY gained 0.07%. A starting capital of $100,000 at inception on 6/30/2016 would have grown to $119,383 which includes $137 cash and excludes $1,389 spent on fees and slippage. |
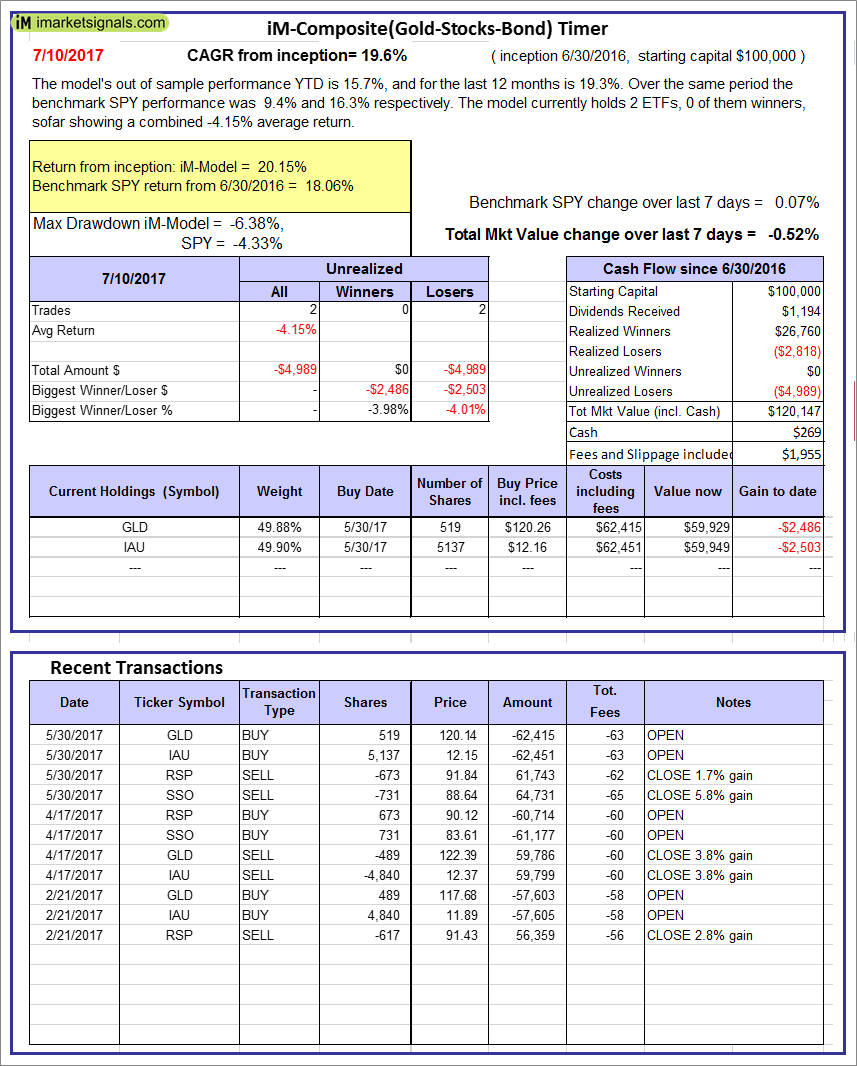 |
iM-Composite(Gold-Stocks-Bond) Timer: The model’s out of sample performance YTD is 15.7%, and for the last 12 months is 19.3%. Over the same period the benchmark SPY performance was 9.4% and 16.3% respectively. Over the previous week the market value of the iM-Composite(Gold-Stocks-Bond) Timer gained -0.52% at a time when SPY gained 0.07%. A starting capital of $100,000 at inception on 6/30/2016 would have grown to $120,147 which includes $269 cash and excludes $1,955 spent on fees and slippage. |
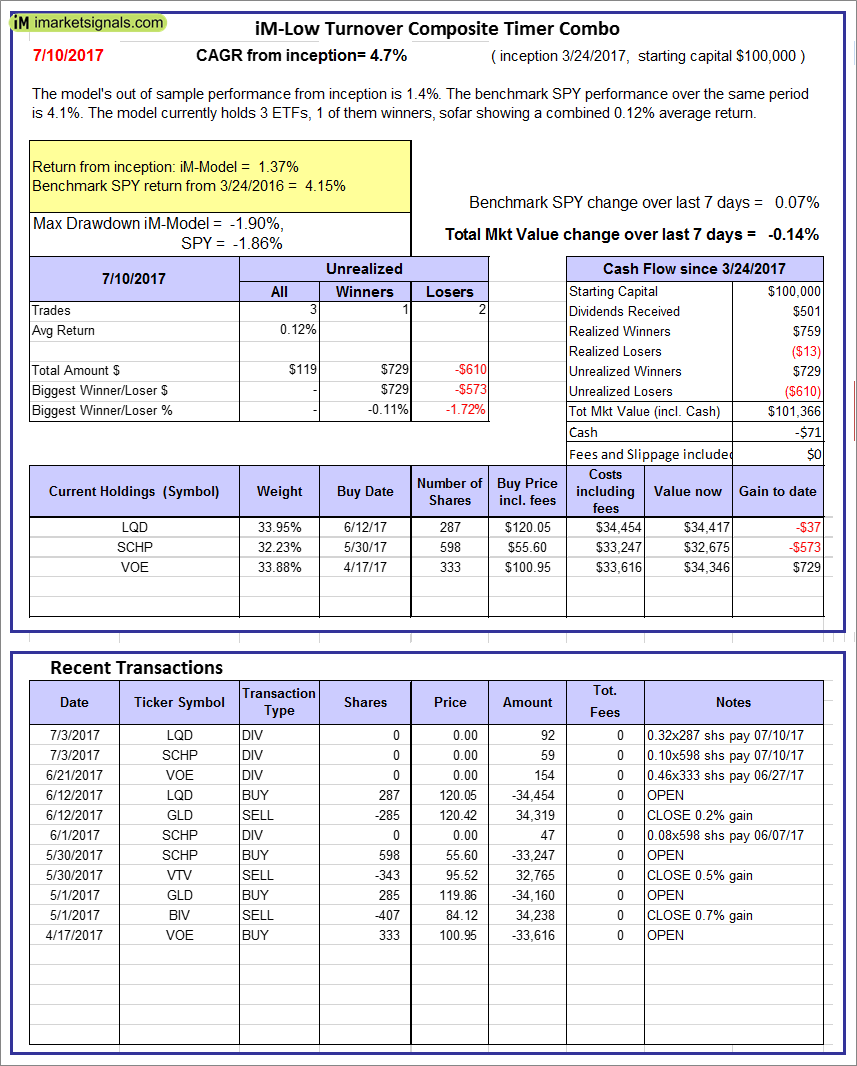 |
iM-Low Turnover Composite Timer Combo: The model’s out of sample performance from inception is 1.4%. The benchmark SPY performance over the same period is 4.1%. Over the previous week the market value of the iM-Low Turnover Composite Timer Combo gained -0.14% at a time when SPY gained 0.07%. A starting capital of $100,000 at inception on 3/24/27 would have grown to $101,366 which includes -$71 cash and excludes $00 spent on fees and slippage. |
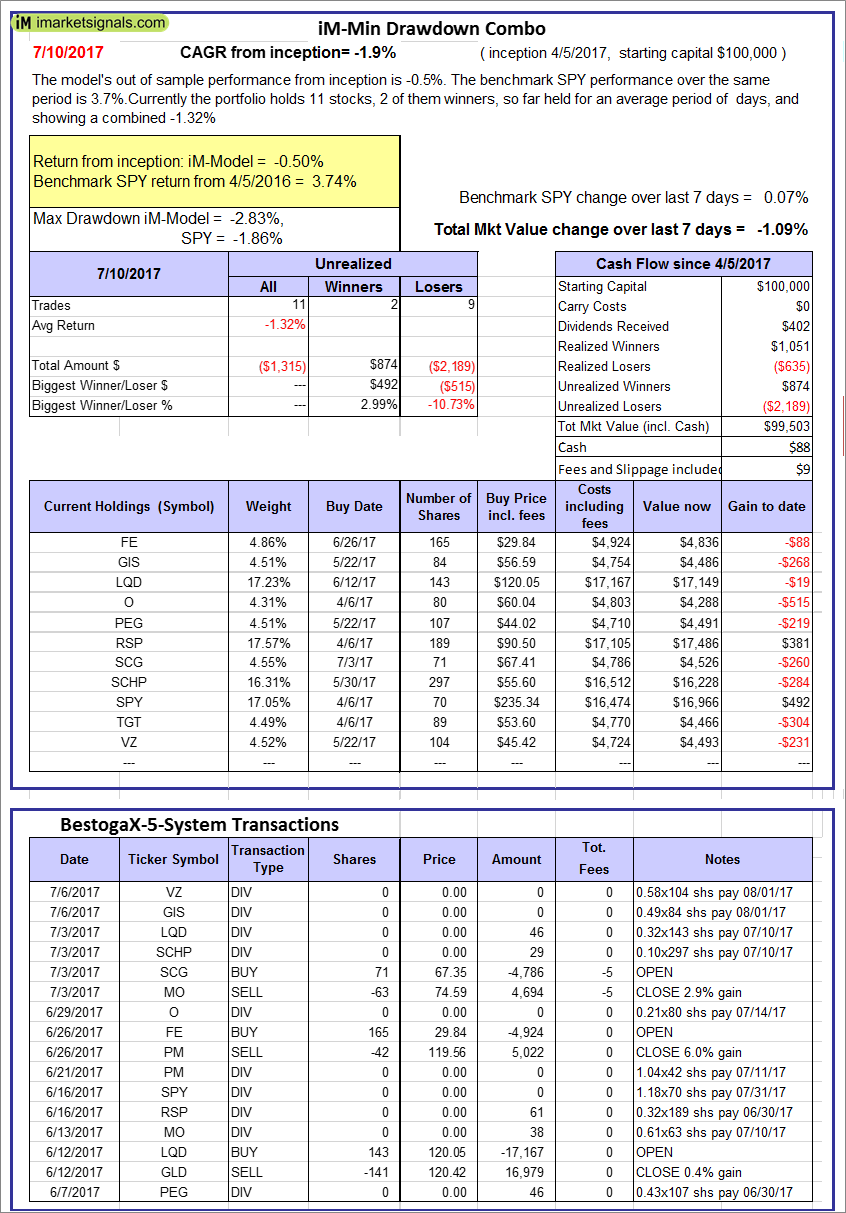 |
iM-Min Drawdown Combo: The model’s out of sample performance from inception is -0.5%. The benchmark SPY performance over the same period is 3.7%. Over the previous week the market value of the iM-Min Drawdown Combo gained -1.09% at a time when SPY gained 0.07%. A starting capital of $100,000 at inception on 4/5/2017 would have grown to $99,503 which includes $88 cash and excludes $09 spent on fees and slippage. |
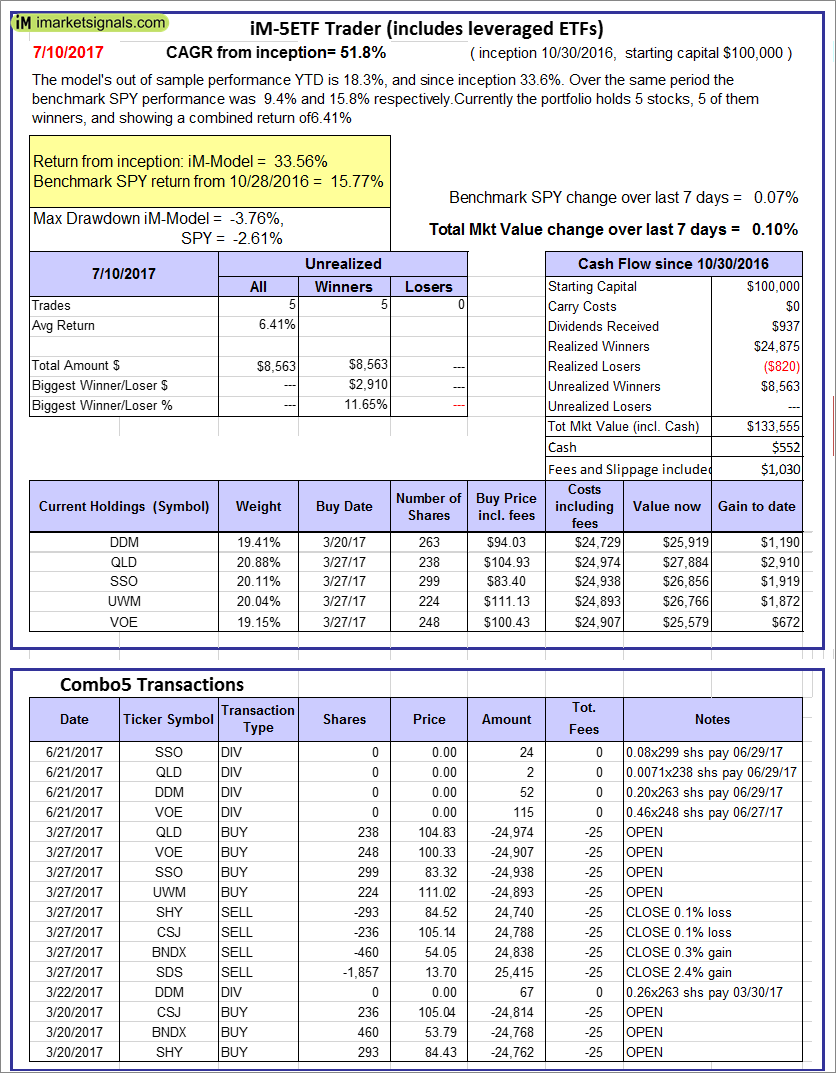 |
iM-5ETF Trader (includes leveraged ETFs): The model’s out of sample performance YTD is 10.2%, and since inception 13.3%. Over the same period the benchmark SPY performance was 9.4% and 15.8% respectively. Over the previous week the market value of the iM-5ETF Trader (includes leveraged ETFs) gained 0.10% at a time when SPY gained 0.07%. A starting capital of $100,000 at inception on 10/30/2016 would have grown to $133,555 which includes $552 cash and excludes $1,030 spent on fees and slippage. |
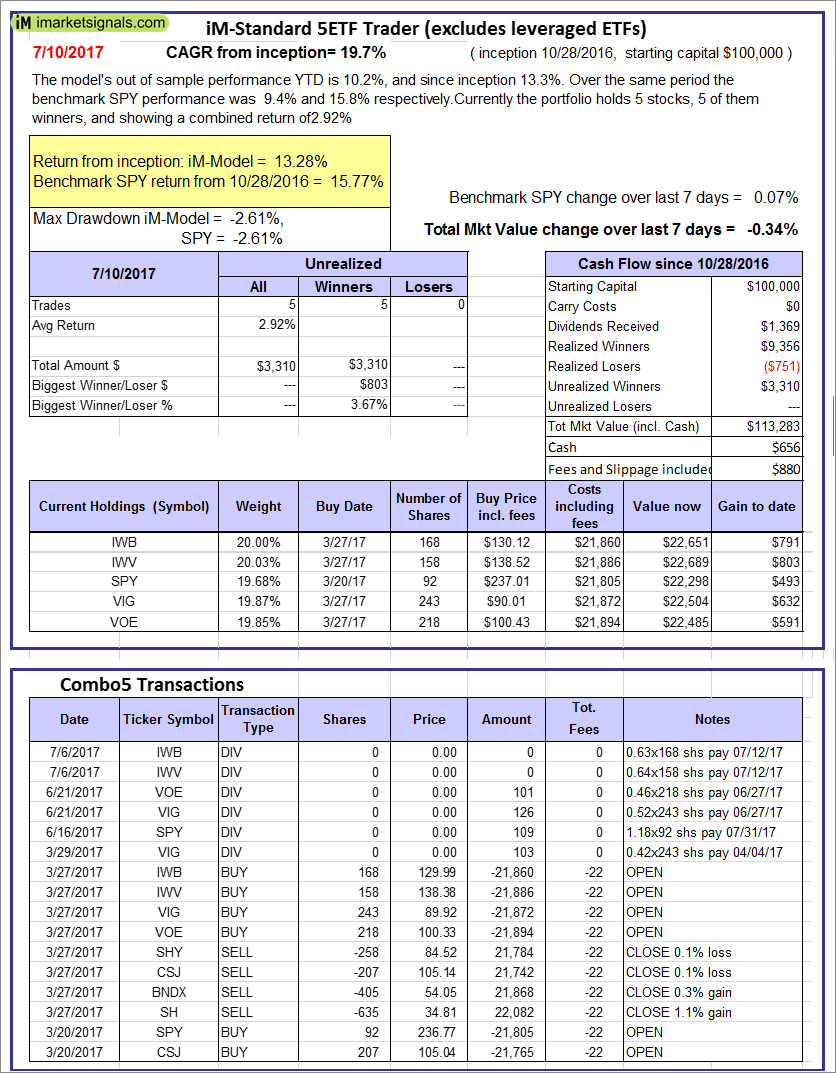 |
iM-Standard 5ETF Trader (excludes leveraged ETFs): The model’s out of sample performance YTD is 10.2%, and since inception 13.3%. Over the same period the benchmark SPY performance was 9.4% and 15.8% respectively. Over the previous week the market value of the iM-Standard 5ETF Trader (excludes leveraged ETFs) gained -0.34% at a time when SPY gained 0.07%. A starting capital of $100,000 at inception on 10/30/2016 would have grown to $113,283 which includes $656 cash and excludes $880 spent on fees and slippage. |
iM-Best Reports – 7/10/2017
Posted in pmp SPY-SH
Leave a Reply
You must be logged in to post a comment.