
  |
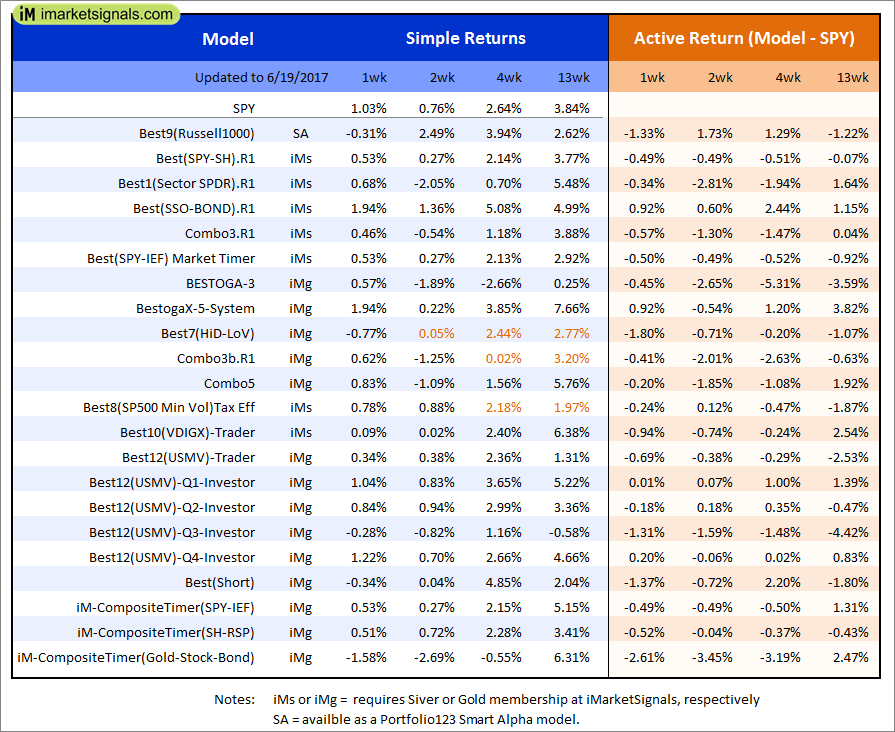
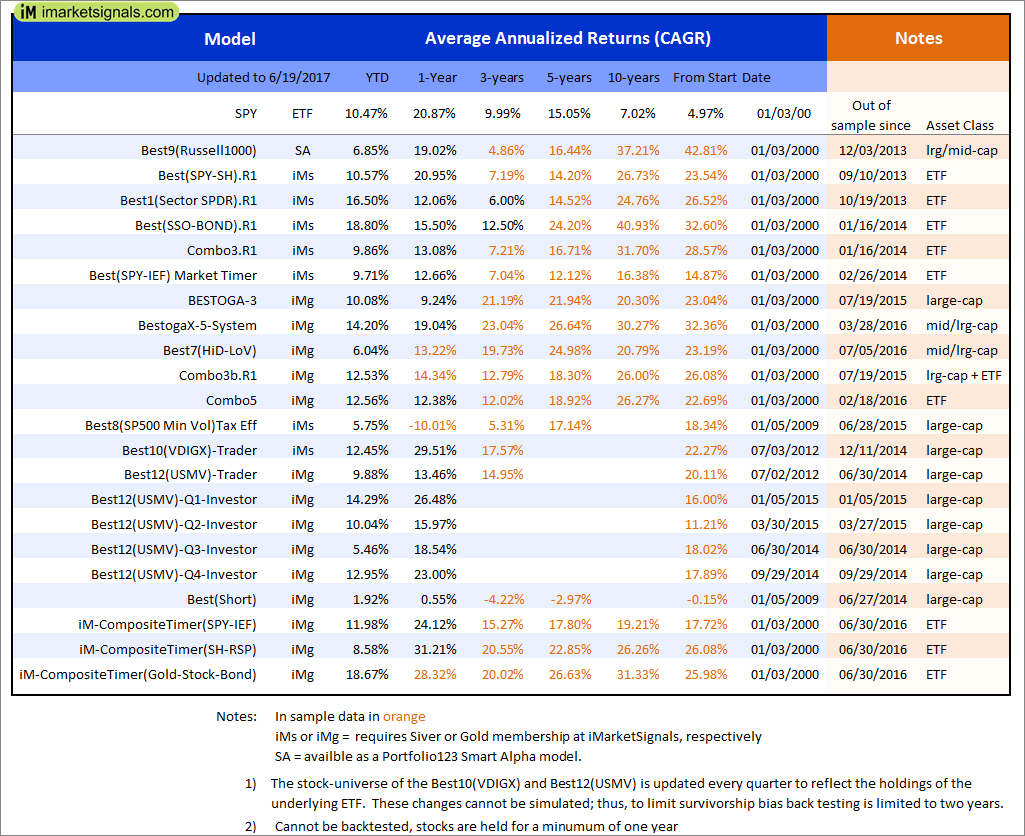
Out of sample performance summary of our models for the past 1, 2, 4 and 13 week periods. The active active return indicates how the models over- or underperformed the benchmark ETF SPY. Also the YTD, and the 1-, 3-, 5- and 10-year annualized returns are shown in the second table |
 |
iM-Best(SPY-SH).R1: The model’s out of sample performance YTD is 10.6%, and for the last 12 months is 21.0%. Over the same period the benchmark SPY performance was 10.5% and 20.9% respectively. Over the previous week the market value of Best(SPY-SH) gained 0.53% at a time when SPY gained 1.02%. A starting capital of $100,000 at inception on 1/2/2009 would have grown to $511,086 which includes $2,193 cash and excludes $15,358 spent on fees and slippage. |
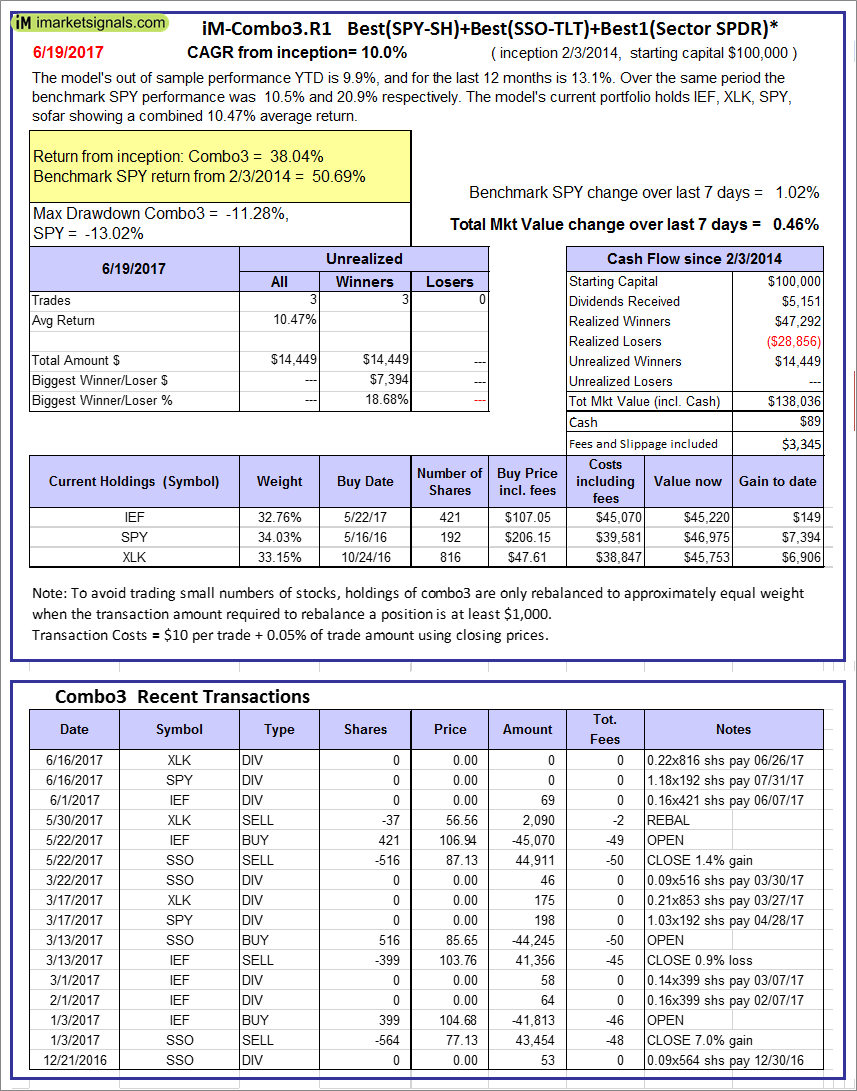 |
iM-Combo3.R1: The model’s out of sample performance YTD is 9.9%, and for the last 12 months is 13.1%. Over the same period the benchmark SPY performance was 10.5% and 20.9% respectively. Over the previous week the market value of iM-Combo3.R1 gained 0.46% at a time when SPY gained 1.02%. A starting capital of $100,000 at inception on 2/3/2014 would have grown to $138,036 which includes $89 cash and excludes $3,345 spent on fees and slippage. |
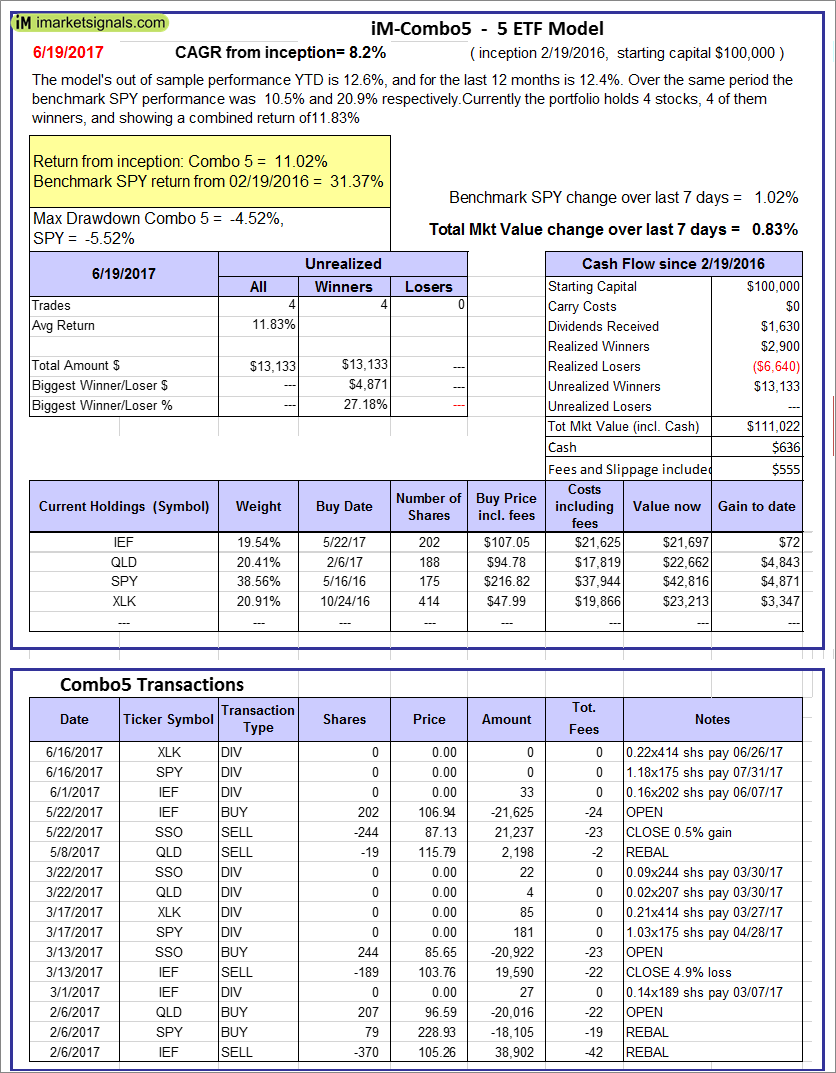 |
iM-Combo5: The model’s out of sample performance YTD is 12.6%, and for the last 12 months is 12.4%. Over the same period the benchmark SPY performance was 10.5% and 20.9% respectively. Over the previous week the market value of iM-Combo5 gained 0.83% at a time when SPY gained 1.02%. A starting capital of $100,000 at inception on 2/22/2016 would have grown to $111,022 which includes $636 cash and excludes $555 spent on fees and slippage. |
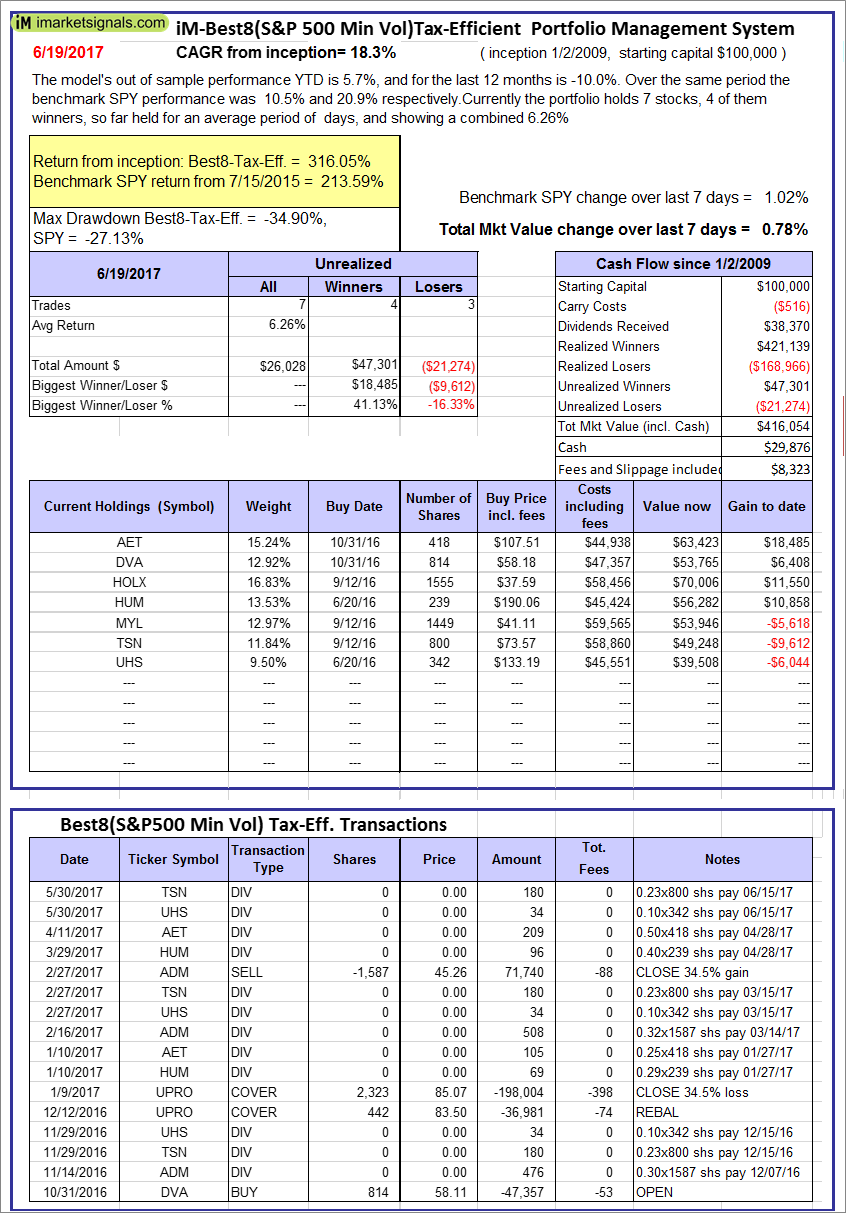 |
The iM-Best8(S&P500 Min Vol)Tax-Efficient The model’s out of sample performance YTD is 5.7%, and for the last 12 months is -10.0%. Over the same period the benchmark SPY performance was 10.5% and 20.9% respectively. Over the previous week the market value of iM-Best8(S&P 500)Tax-Eff. gained 0.78% at a time when SPY gained 1.02%. A starting capital of $100,000 at inception on 1/2/2009 would have grown to $416,054 which includes $29,876 cash and excludes $8,323 spent on fees and slippage. |
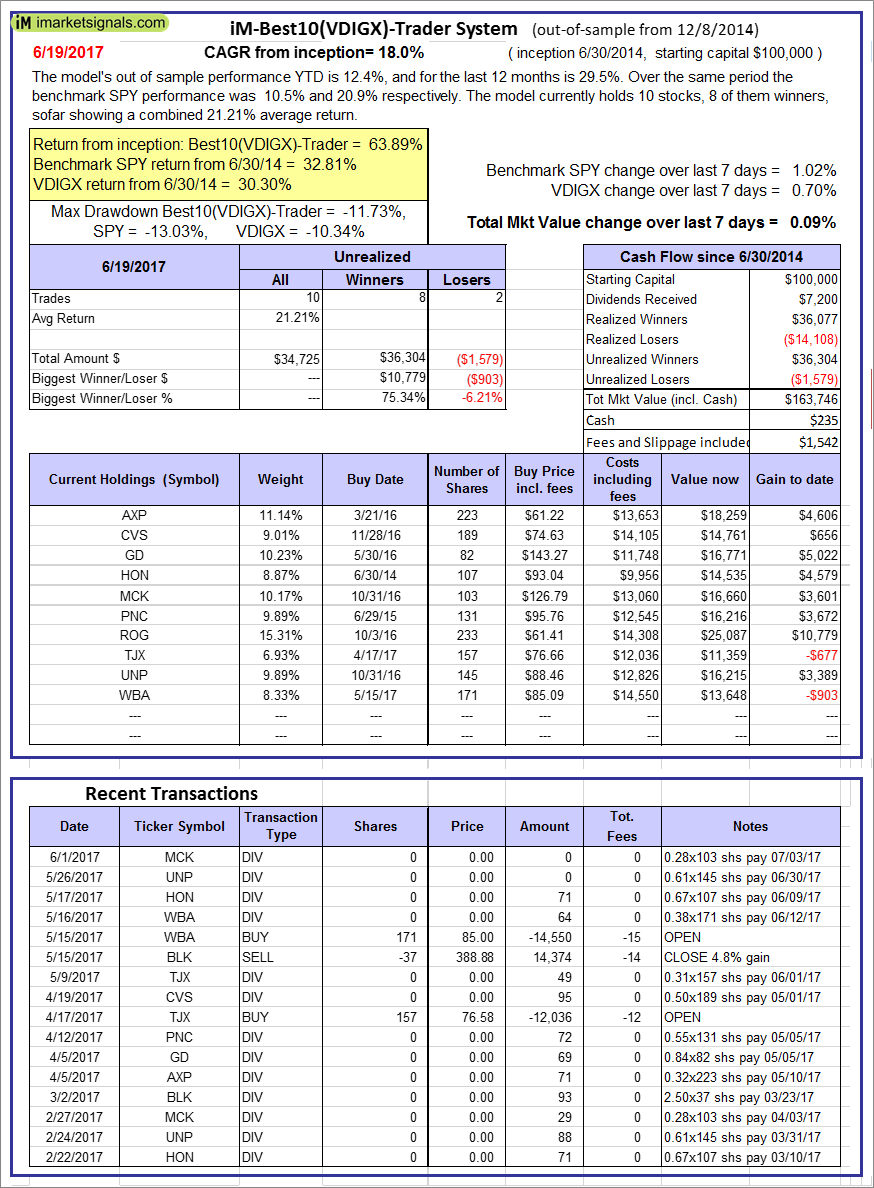 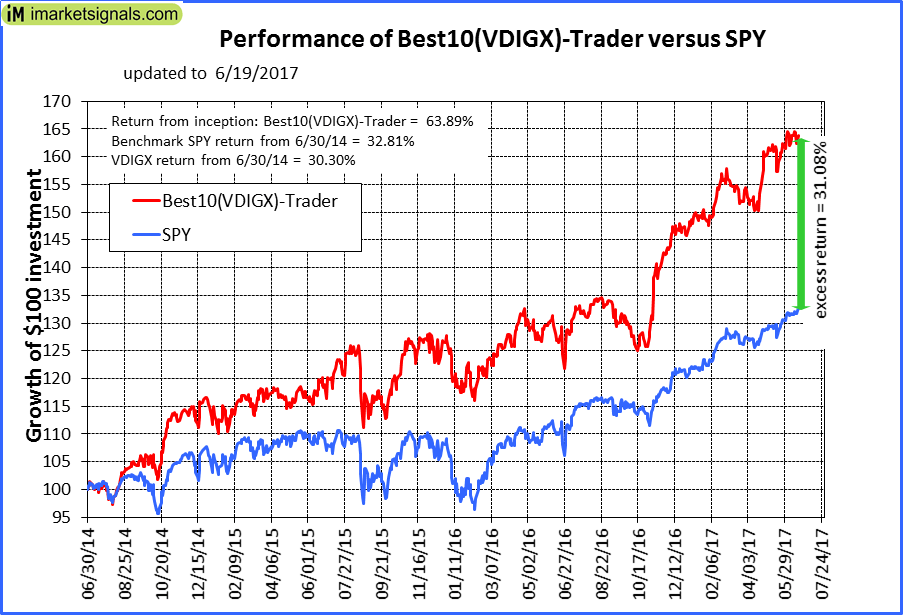 |
iM-Best10(VDIGX)-Trader: The model’s out of sample performance YTD is 12.4%, and for the last 12 months is 29.5%. Over the same period the benchmark SPY performance was 10.5% and 20.9% respectively. Since inception, on 7/1/2014, the model gained 63.89% while the benchmark SPY gained 32.81% and VDIGX gained 30.30% over the same period. Over the previous week the market value of iM-Best10(VDIGX) gained 0.09% at a time when SPY gained 1.02%. A starting capital of $100,000 at inception on 7/1/2014 would have grown to $163,746 which includes $235 cash and excludes $1,542 spent on fees and slippage. |
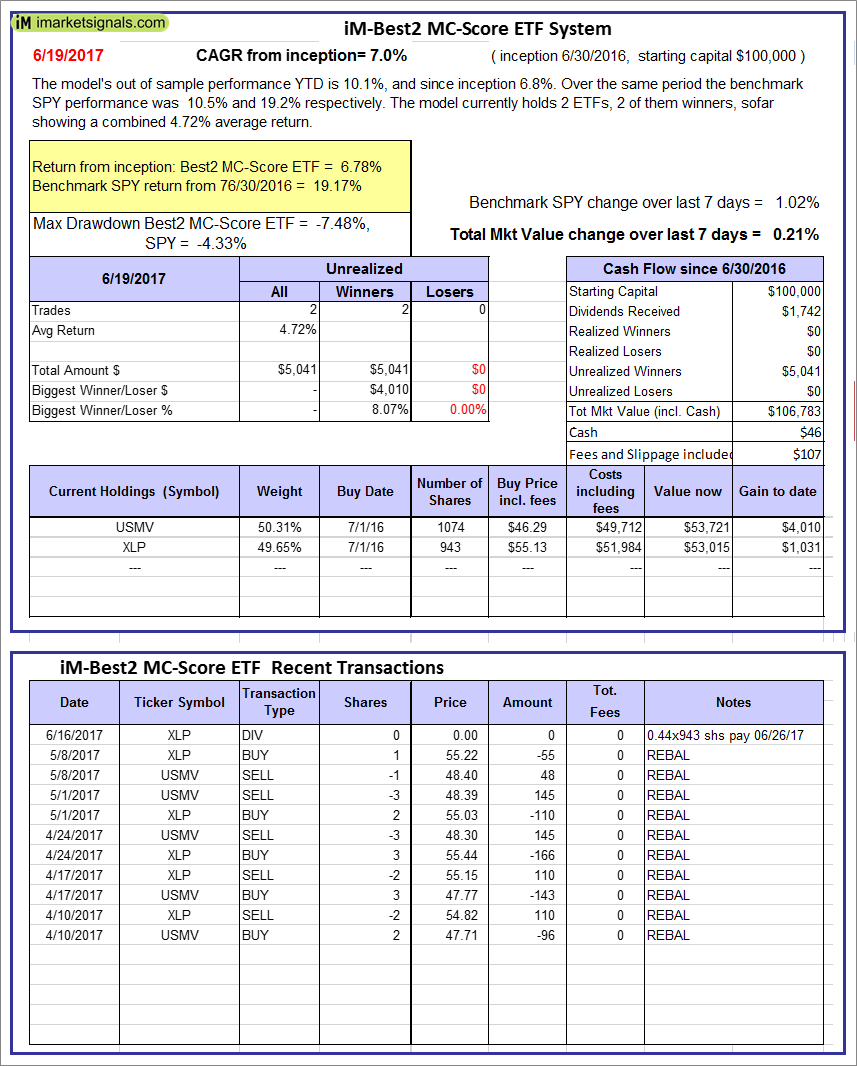 |
iM-Best2 MC-Score ETF System: The model’s out of sample performance YTD is 10.1%, and since inception 6.8%. Over the same period the benchmark SPY performance was 10.5% and 19.2% respectively. Over the previous week the market value of iM-BESTOGA-3 gained 0.21% at a time when SPY gained 1.02%. A starting capital of $100,000 at inception on 6/30/2016 would have grown to $46 which includes $107 cash and excludes Gain to date spent on fees and slippage. |
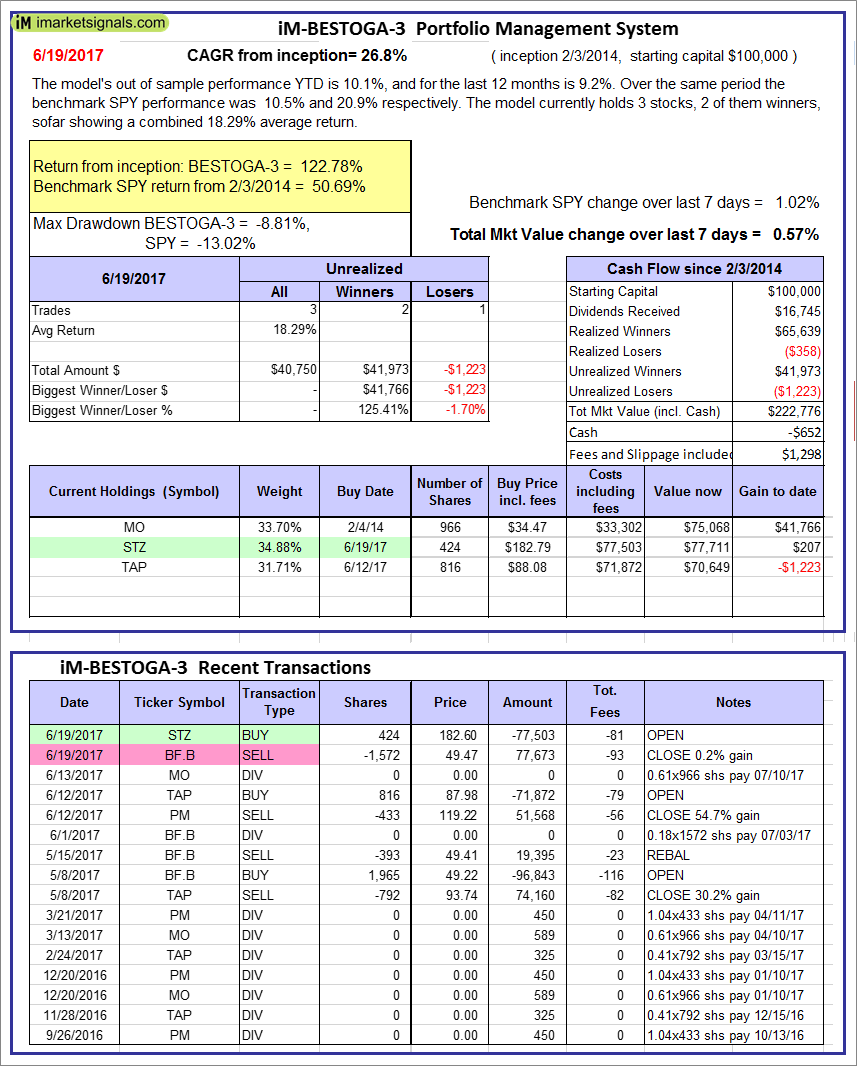 |
iM-BESTOGA-3: The model’s out of sample performance YTD is 10.1%, and for the last 12 months is 9.2%. Over the same period the benchmark SPY performance was 10.5% and 20.9% respectively. Over the previous week the market value of iM-BESTOGA-3 gained 0.57% at a time when SPY gained 1.02%. A starting capital of $100,000 at inception on 2/3/2014 would have grown to $222,776 which includes -$652 cash and excludes $1,298 spent on fees and slippage. |
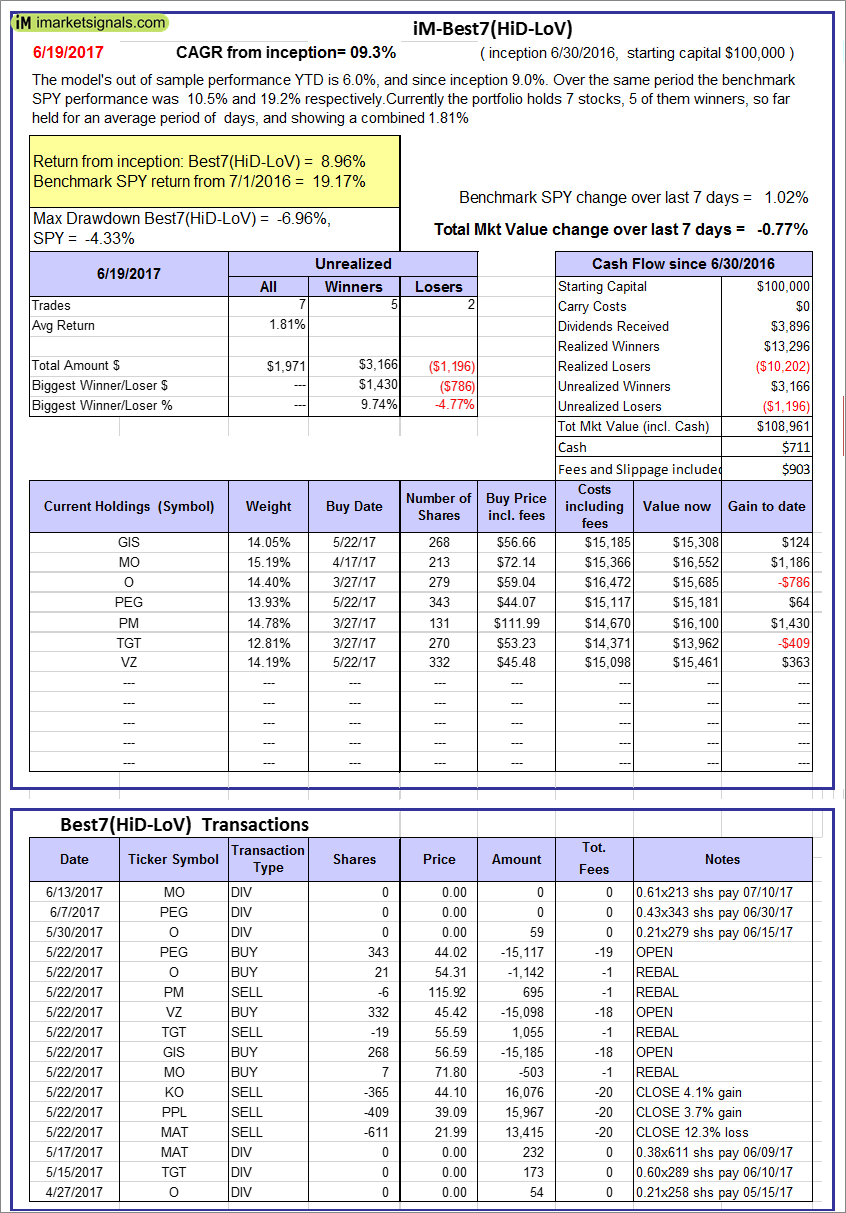 |
iM-Best7(HiD-LoV): The model’s out of sample performance YTD is 6.0%, and since inception 9.0%. Over the same period the benchmark SPY performance was 10.5% and 19.2% respectively. Over the previous week the market value of iM-BESTOGA-3 gained -0.77% at a time when SPY gained 1.02%. A starting capital of $100,000 at inception on 6/30/2016 would have grown to $108,961 which includes $711 cash and excludes $903 spent on fees and slippage. |
 |
iM-BestogaX5-System: The model’s out of sample performance YTD is 14.2%, and for the last 12 months is 19.0%. Over the same period the benchmark SPY performance was 10.5% and 20.9% respectively. Over the previous week the market value of iM-Best8(S&P 500)Tax-Eff. gained 1.94% at a time when SPY gained 1.02%. A starting capital of $100,000 at inception on 3/28/2016 would have grown to $112,553 which includes $1,681 cash and excludes $662 spent on fees and slippage. |
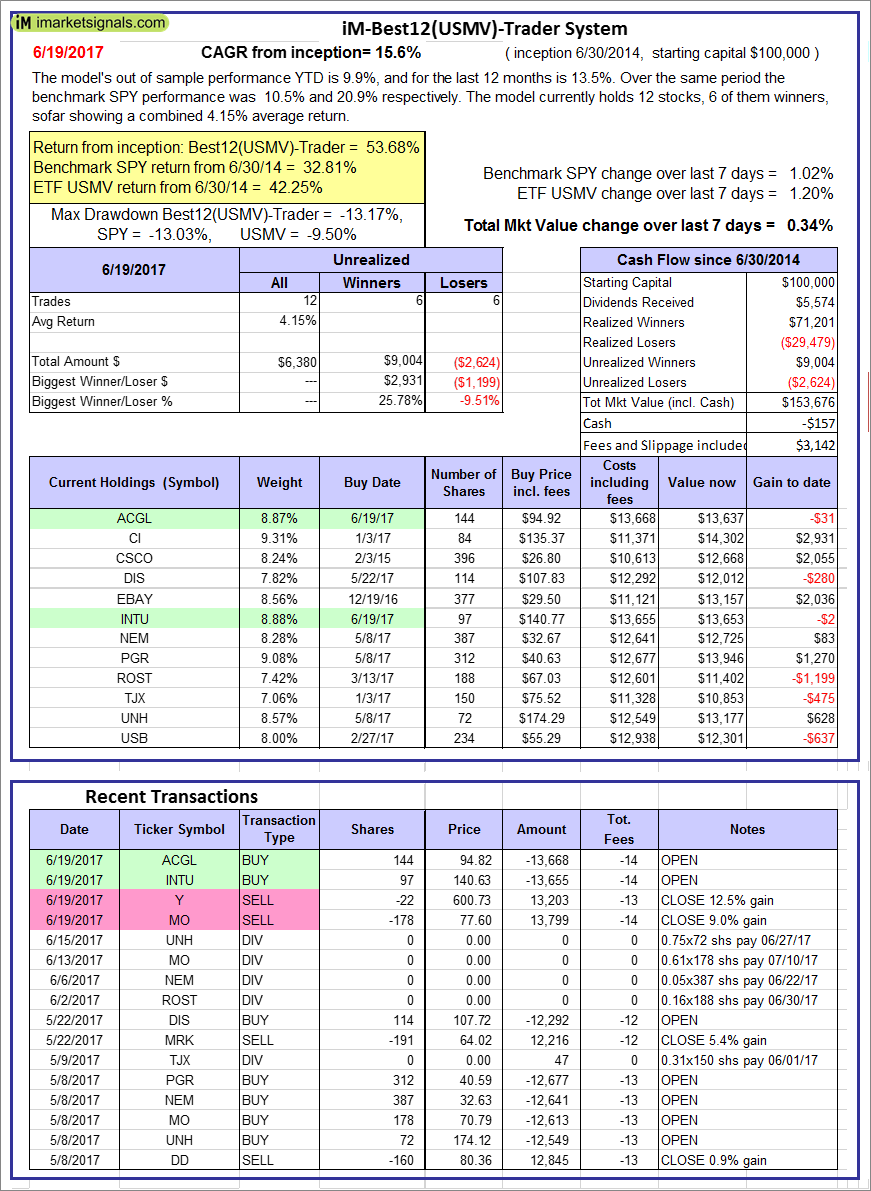 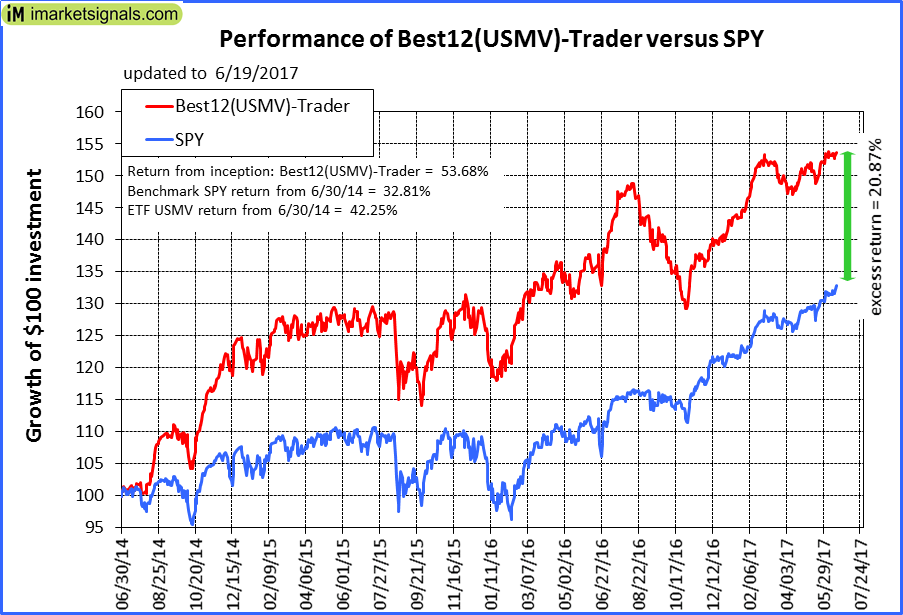 |
iM-Best12(USMV)-Trader: The model’s out of sample performance YTD is 9.9%, and for the last 12 months is 13.5%. Over the same period the benchmark SPY performance was 10.5% and 20.9% respectively. Since inception, on 7/1/2014, the model gained 53.68% while the benchmark SPY gained 32.81% and the ETF USMV gained 42.25% over the same period. Over the previous week the market value of iM-Best12(USMV)-Trader gained 0.34% at a time when SPY gained 1.02%. A starting capital of $100,000 at inception on 7/1/2014 would have grown to $153,676 which includes -$157 cash and excludes $3,142 spent on fees and slippage. |
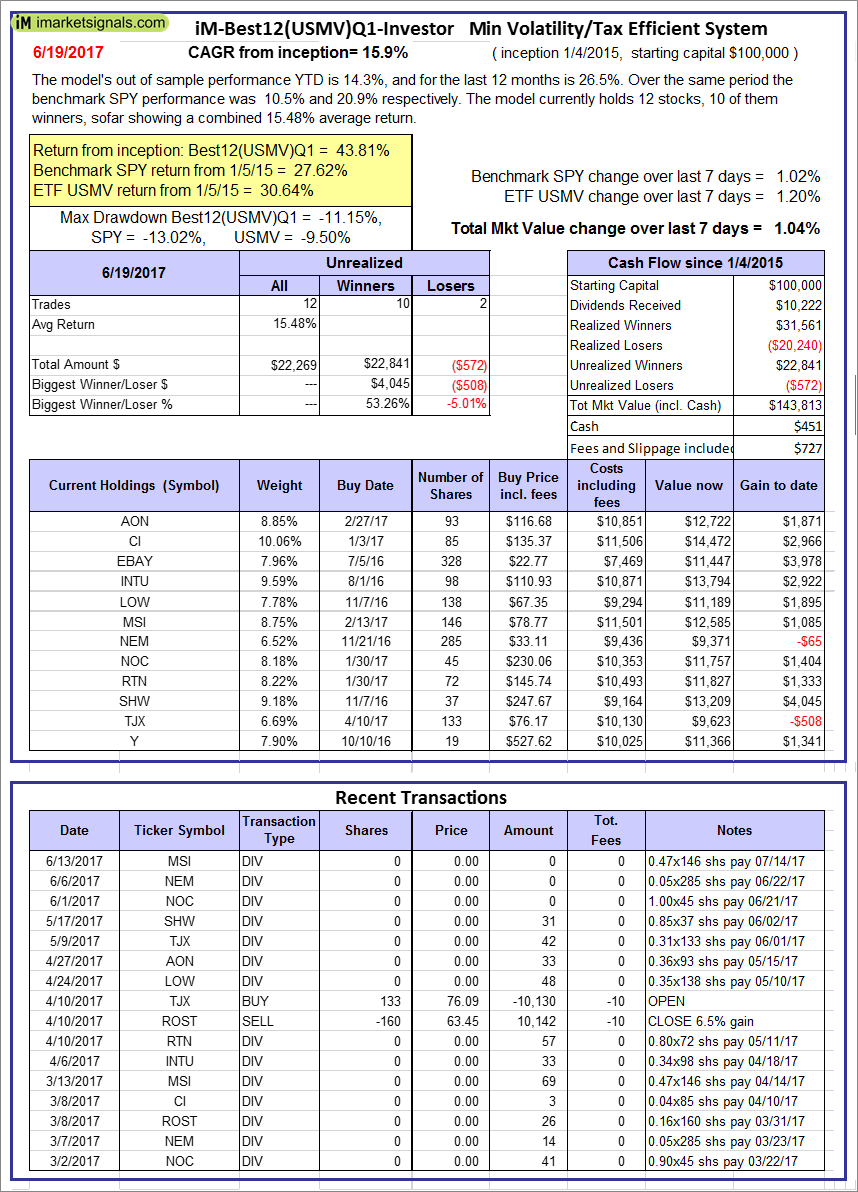 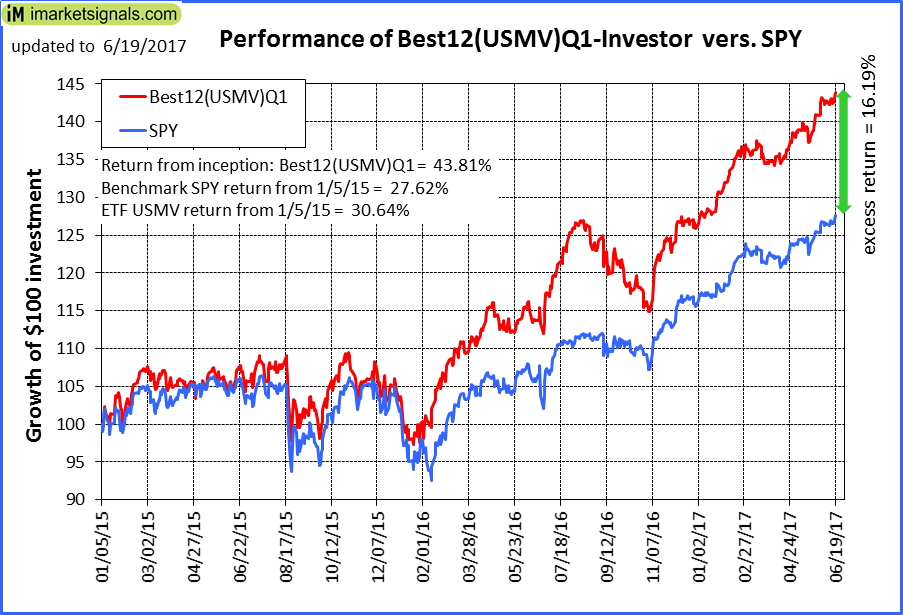 |
iM-Best12(USMV)Q1-Investor: The model’s out of sample performance YTD is 14.3%, and for the last 12 months is 26.5%. Over the same period the benchmark SPY performance was 10.5% and 20.9% respectively. Since inception, on 1/5/2015, the model gained 43.81% while the benchmark SPY gained 27.62% and the ETF USMV gained 30.64% over the same period. Over the previous week the market value of iM-Best12(USMV)Q1 gained 1.04% at a time when SPY gained 1.02%. A starting capital of $100,000 at inception on 1/5/2015 would have grown to $143,813 which includes $451 cash and excludes $727 spent on fees and slippage. |
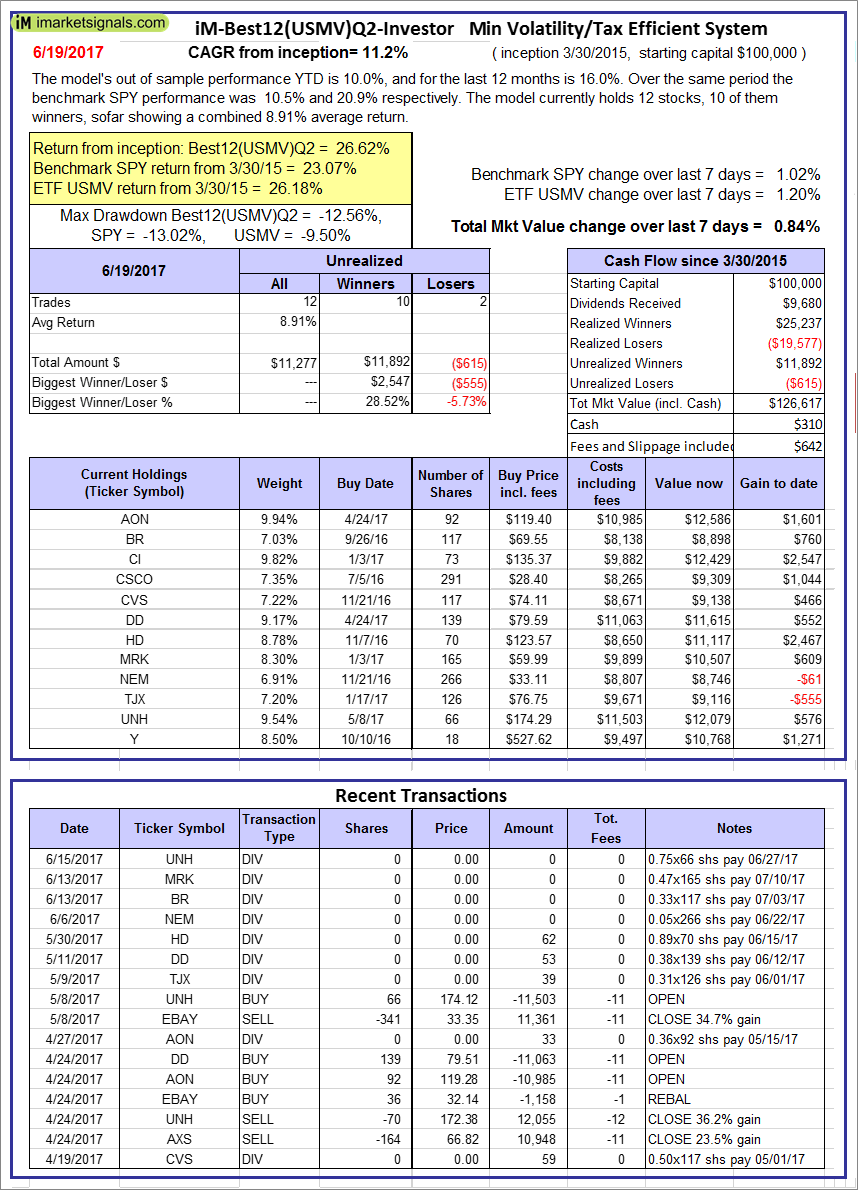 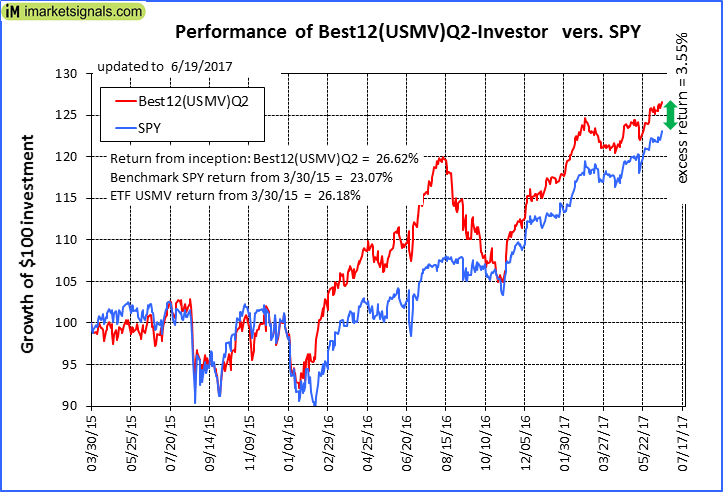 |
iM-Best12(USMV)Q2-Investor: The model’s out of sample performance YTD is 10.0%, and for the last 12 months is 16.0%. Over the same period the benchmark SPY performance was 10.5% and 20.9% respectively. Since inception, on 3/31/2015, the model gained 26.62% while the benchmark SPY gained 23.07% and the ETF USMV gained 26.18% over the same period. Over the previous week the market value of iM-Best12(USMV)Q2 gained 0.84% at a time when SPY gained 1.02%. A starting capital of $100,000 at inception on 3/31/2015 would have grown to $126,617 which includes $310 cash and excludes $642 spent on fees and slippage. |
 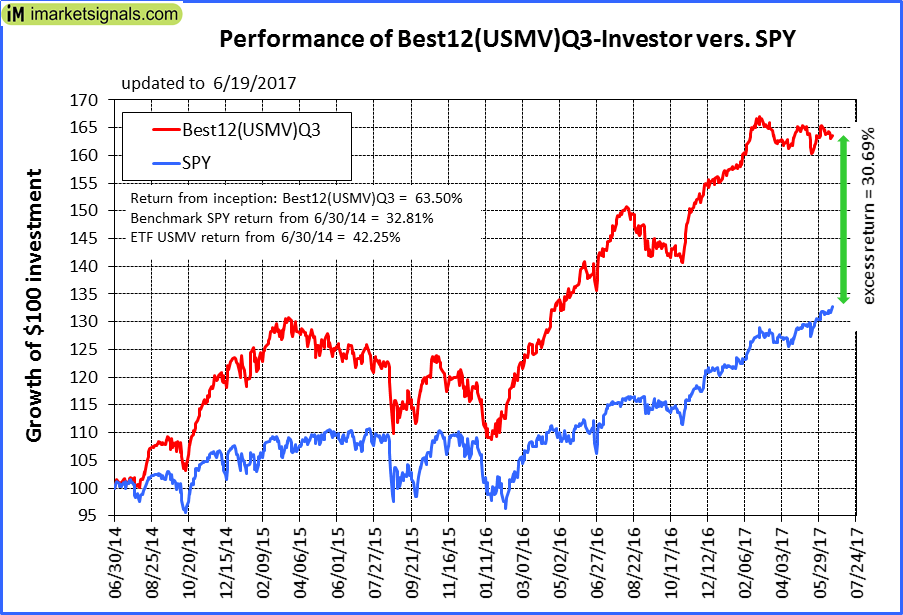 |
iM-Best12(USMV)Q3-Investor: The model’s out of sample performance YTD is 5.5%, and for the last 12 months is 18.5%. Over the same period the benchmark SPY performance was 10.5% and 20.9% respectively. Since inception, on 7/1/2014, the model gained 63.50% while the benchmark SPY gained 32.81% and the ETF USMV gained 42.25% over the same period. Over the previous week the market value of iM-Best12(USMV)Q3 gained -0.28% at a time when SPY gained 1.02%. A starting capital of $100,000 at inception on 7/1/2014 would have grown to $163,499 which includes $805 cash and excludes $972 spent on fees and slippage. |
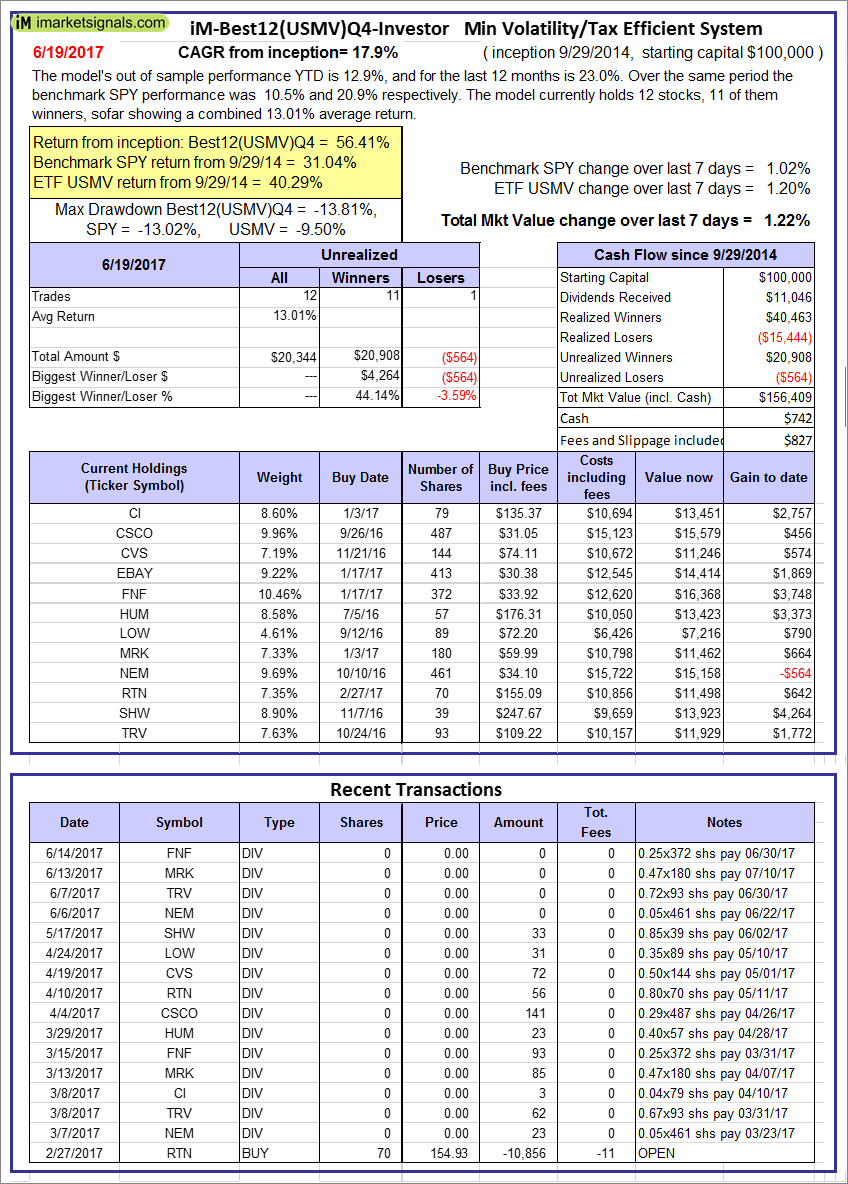  |
iM-Best12(USMV)Q4-Investor: Since inception, on 9/30/2014, the model gained 56.41% while the benchmark SPY gained 31.04% and the ETF USMV gained 40.29% over the same period. Over the previous week the market value of iM-Best12(USMV)Q4 gained 1.22% at a time when SPY gained 1.02%. A starting capital of $100,000 at inception on 9/30/2014 would have grown to $156,409 which includes $742 cash and excludes $827 spent on fees and slippage. |
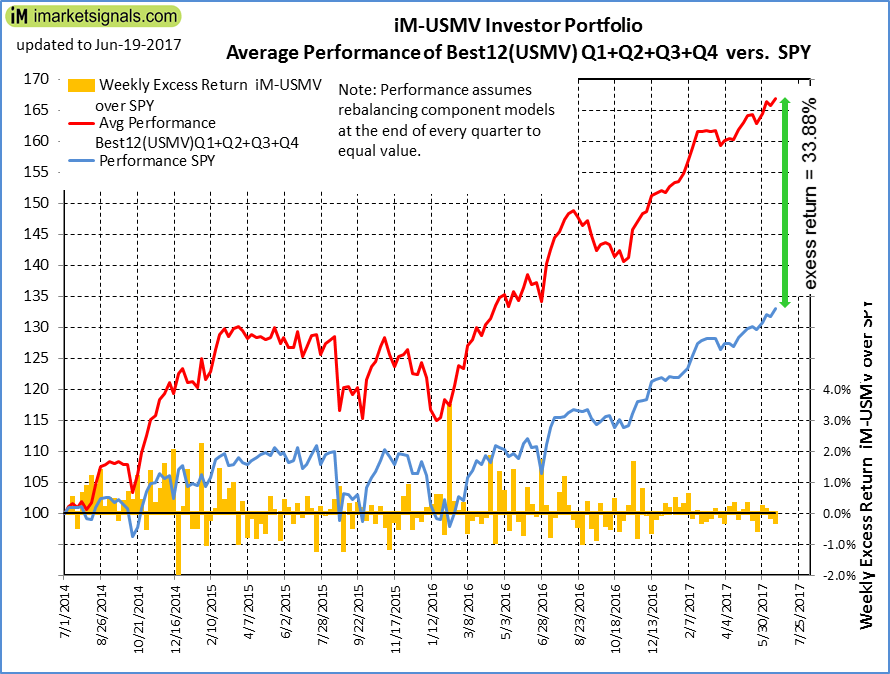 |
Average Performance of iM-Best12(USMV)Q1+Q2+Q3+Q4-Investor resulted in an excess return of 33.88% over SPY. (see iM-USMV Investor Portfolio) |
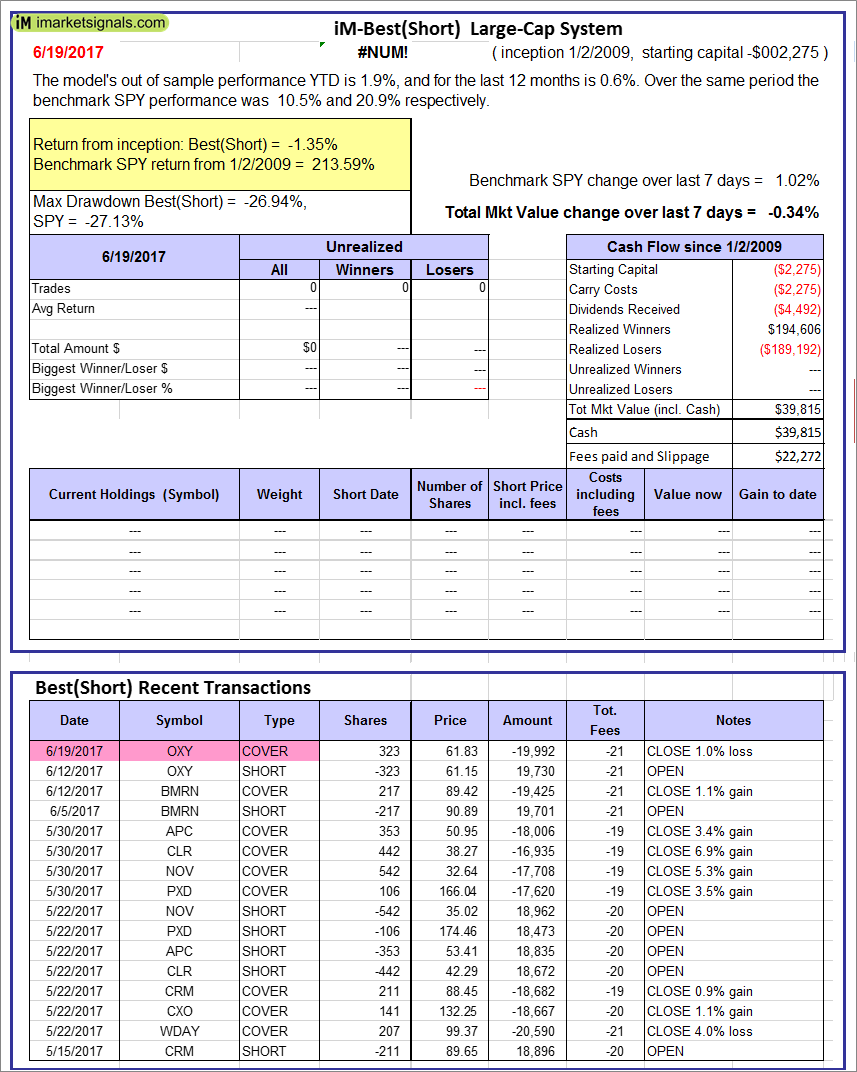 |
iM-Best(Short): The model’s out of sample performance YTD is 1.9%, and for the last 12 months is 0.6%. Over the same period the benchmark SPY performance was 10.5% and 20.9% respectively. Over the previous week the market value of iM-Best(Short) gained -0.34% at a time when SPY gained 1.02%. Over the period 1/2/2009 to 6/19/2017 the starting capital of $100,000 would have grown to $39,815 which includes $39,815 cash and excludes $22,272 spent on fees and slippage. |
iM-Best Reports – 6/19/2017
Posted in pmp SPY-SH
Leave a Reply
You must be logged in to post a comment.