
  |
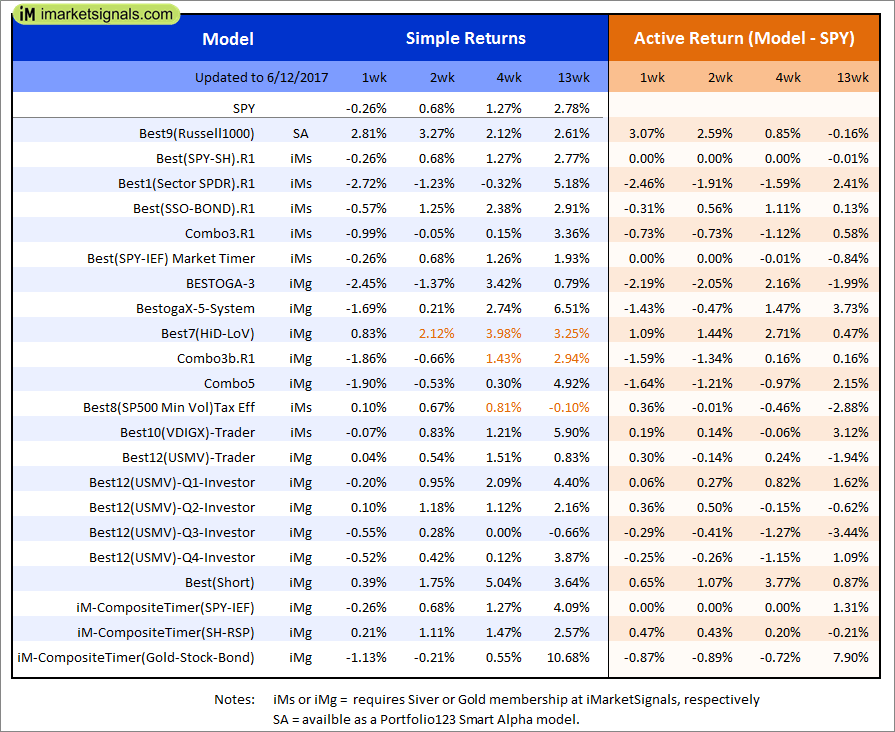
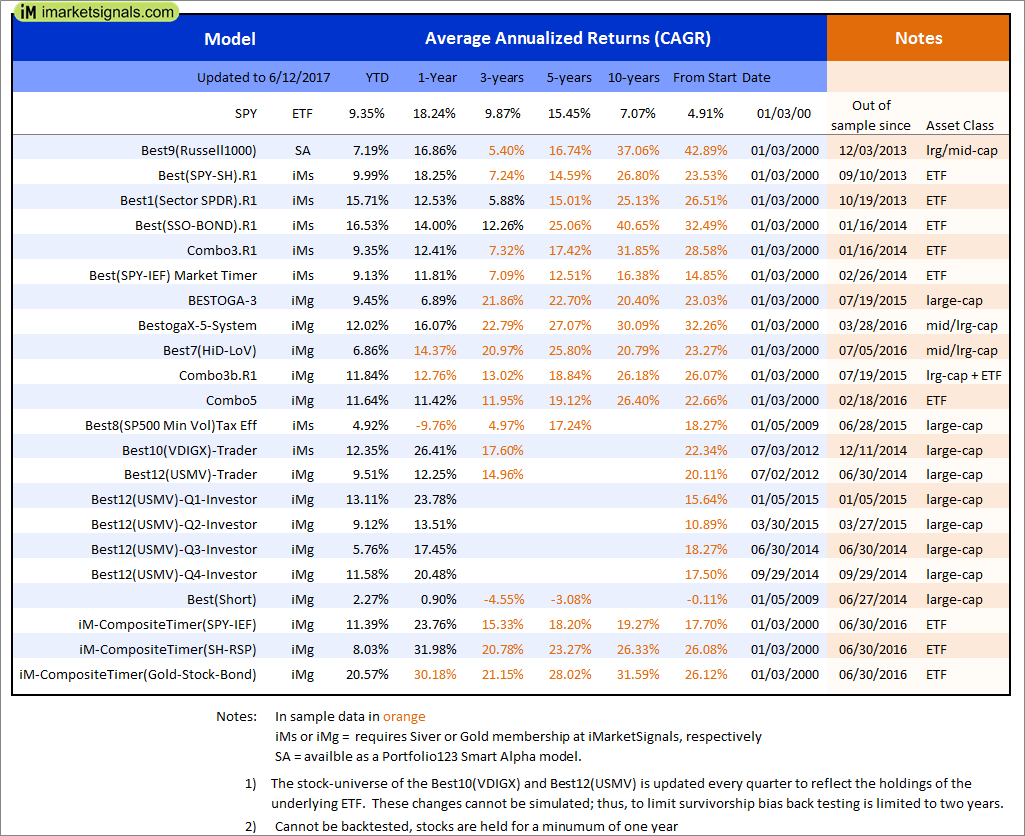
Out of sample performance summary of our models for the past 1, 2, 4 and 13 week periods. The active active return indicates how the models over- or underperformed the benchmark ETF SPY. Also the YTD, and the 1-, 3-, 5- and 10-year annualized returns are shown in the second table |
 |
iM-Best(SPY-SH).R1: The model’s out of sample performance YTD is 10.0%, and for the last 12 months is 18.3%. Over the same period the benchmark SPY performance was 9.3% and 18.2% respectively. Over the previous week the market value of Best(SPY-SH) gained -0.26% at a time when SPY gained -0.26%. A starting capital of $100,000 at inception on 1/2/2009 would have grown to $508,382 which includes $2,193 cash and excludes $15,358 spent on fees and slippage. |
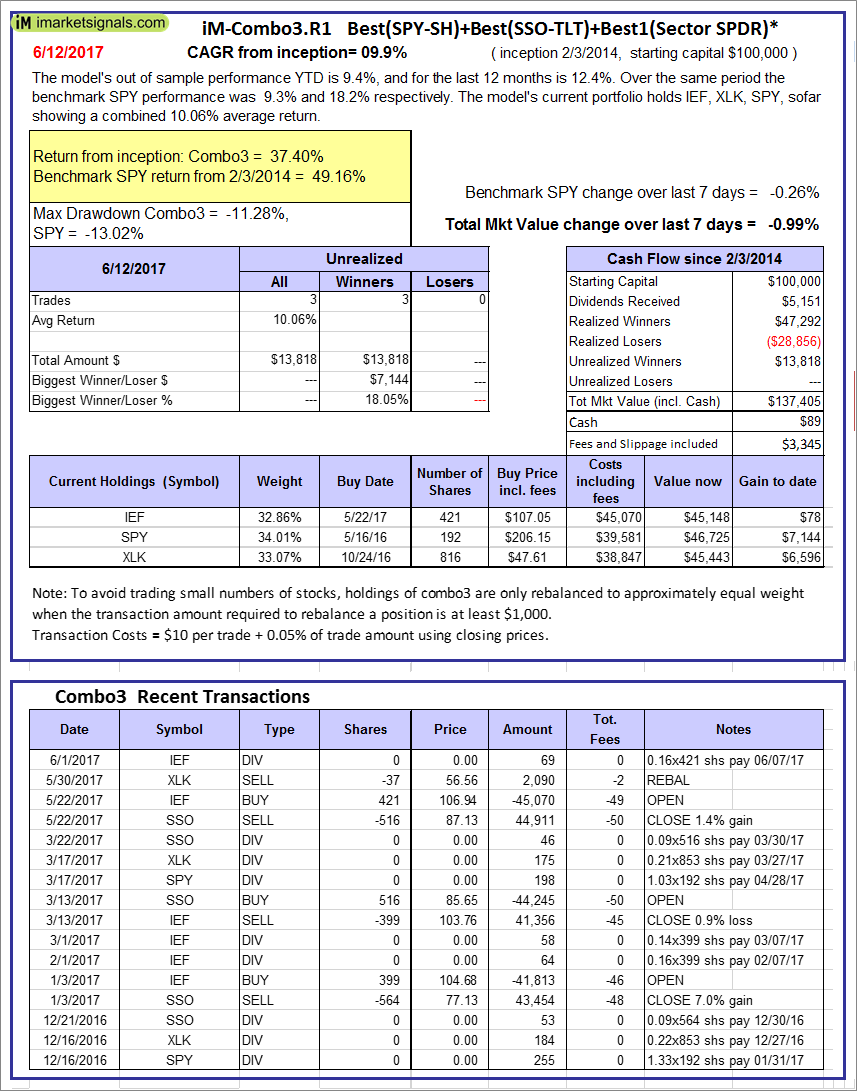 |
iM-Combo3.R1: The model’s out of sample performance YTD is 9.4%, and for the last 12 months is 12.4%. Over the same period the benchmark SPY performance was 9.3% and 18.2% respectively. Over the previous week the market value of iM-Combo3.R1 gained -0.99% at a time when SPY gained -0.26%. A starting capital of $100,000 at inception on 2/3/2014 would have grown to $137,405 which includes $89 cash and excludes $3,345 spent on fees and slippage. |
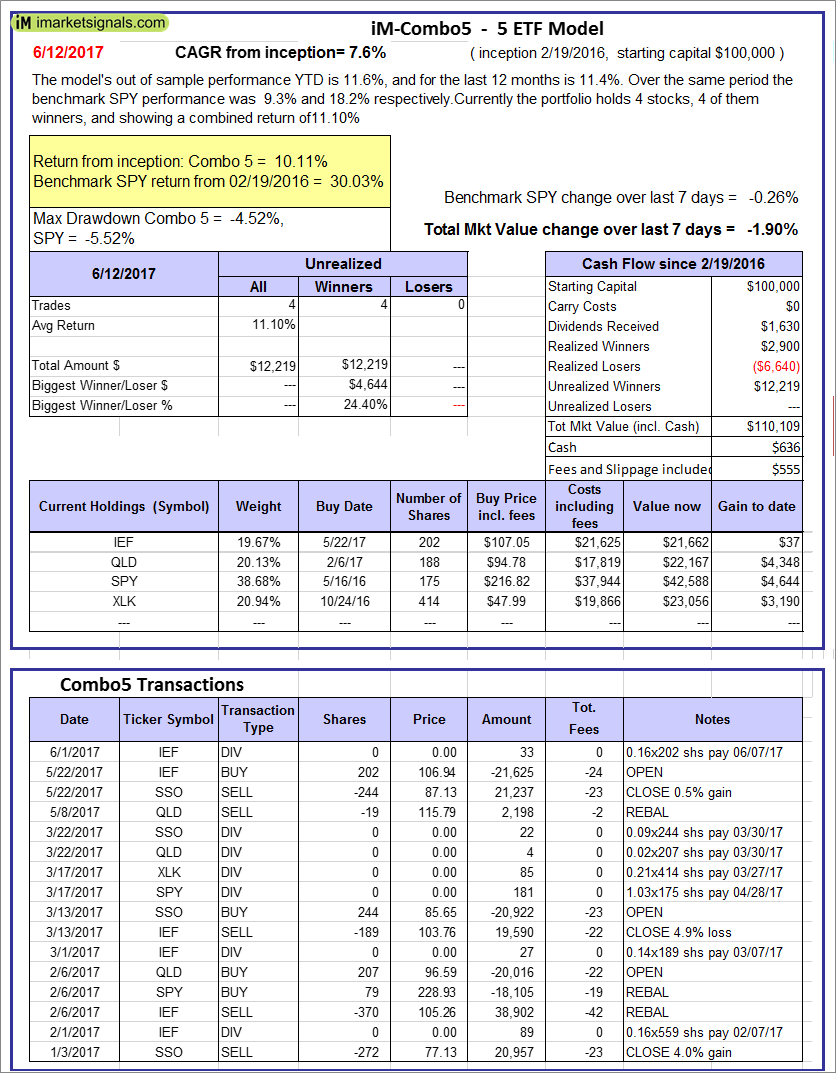 |
iM-Combo5: The model’s out of sample performance YTD is 11.6%, and for the last 12 months is 11.4%. Over the same period the benchmark SPY performance was 9.3% and 18.2% respectively. Over the previous week the market value of iM-Combo5 gained -1.90% at a time when SPY gained -0.26%. A starting capital of $100,000 at inception on 2/22/2016 would have grown to $110,109 which includes $636 cash and excludes $555 spent on fees and slippage. |
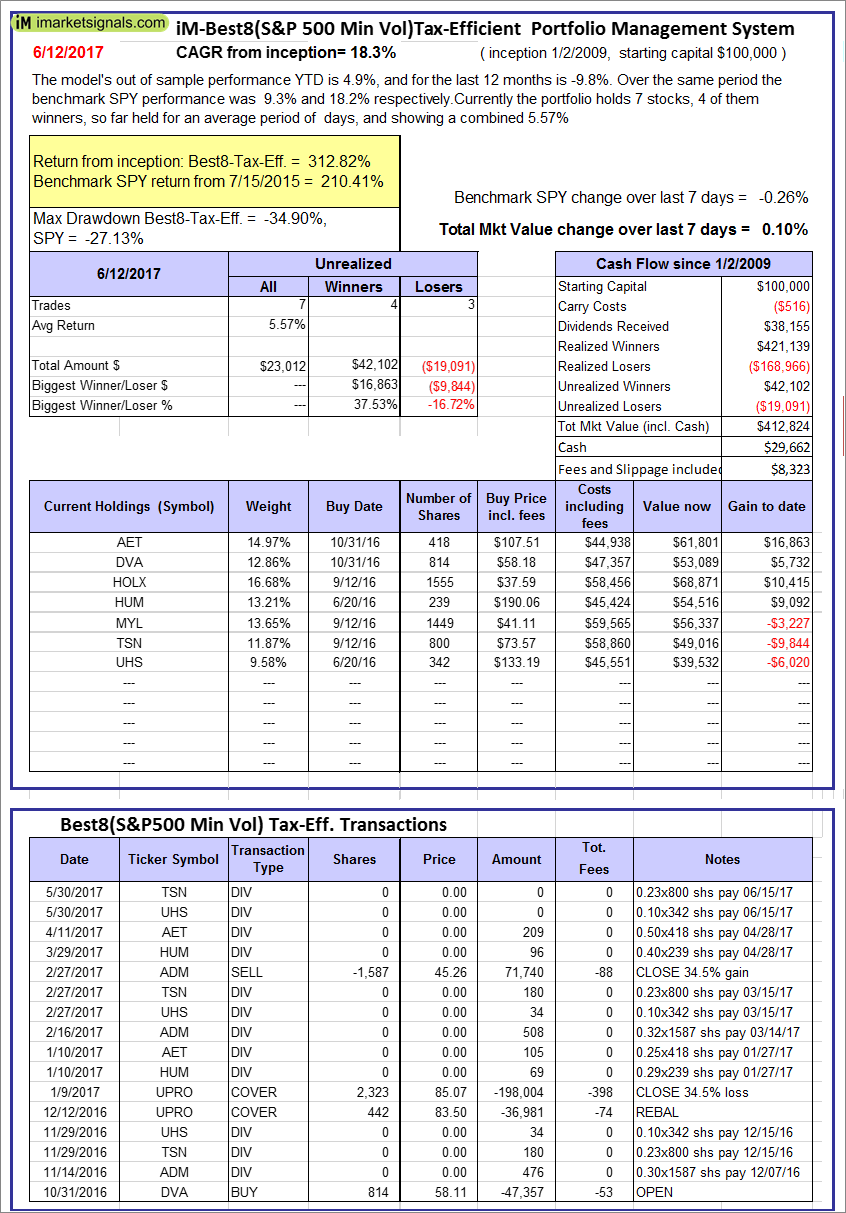 |
The iM-Best8(S&P500 Min Vol)Tax-Efficient The model’s out of sample performance YTD is 4.9%, and for the last 12 months is -9.8%. Over the same period the benchmark SPY performance was 9.3% and 18.2% respectively. Over the previous week the market value of iM-Best8(S&P 500)Tax-Eff. gained 0.10% at a time when SPY gained -0.26%. A starting capital of $100,000 at inception on 1/2/2009 would have grown to $412,824 which includes $29,662 cash and excludes $8,323 spent on fees and slippage. |
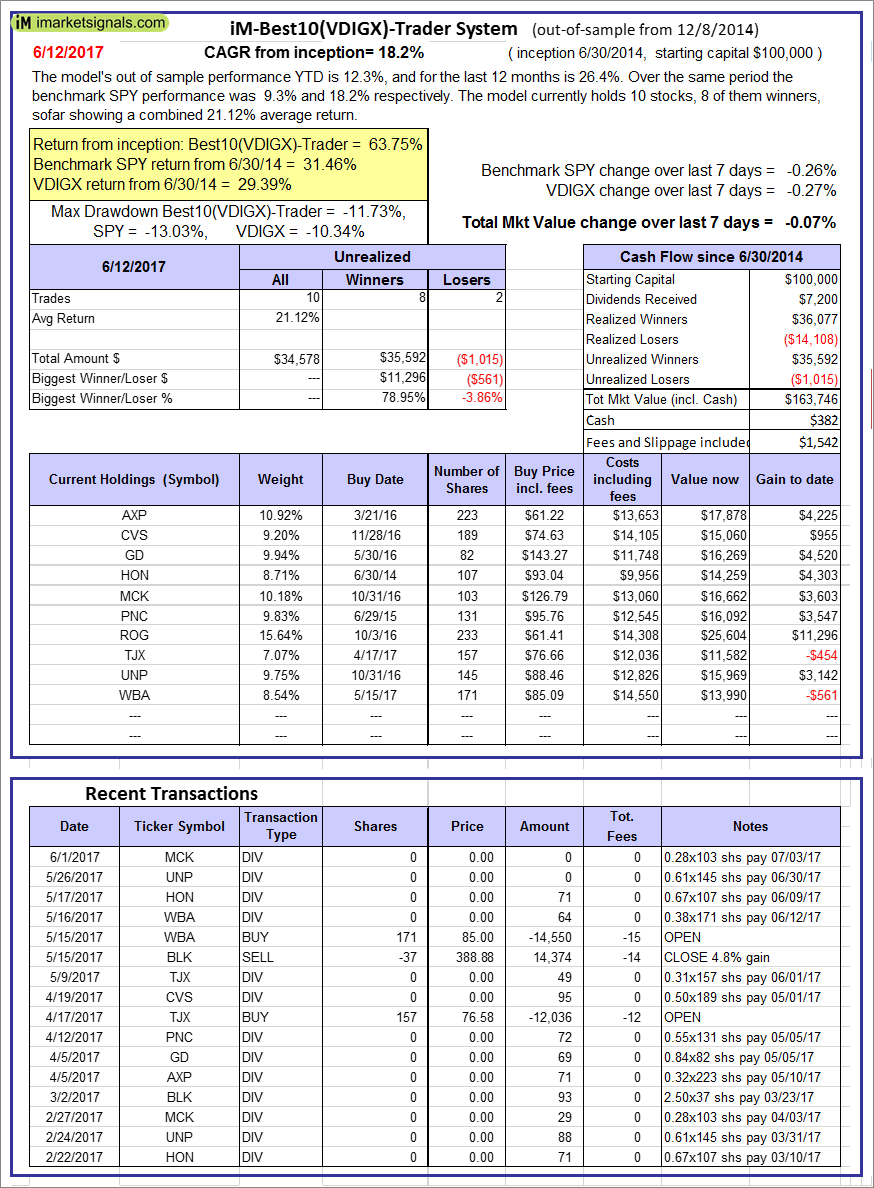 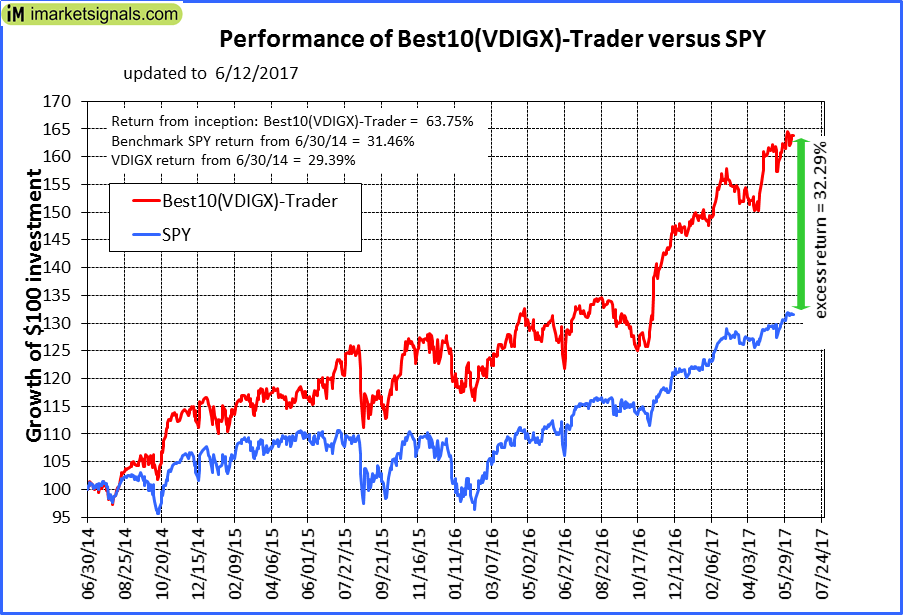 |
iM-Best10(VDIGX)-Trader: The model’s out of sample performance YTD is 12.3%, and for the last 12 months is 26.4%. Over the same period the benchmark SPY performance was 9.3% and 18.2% respectively. Since inception, on 7/1/2014, the model gained 63.75% while the benchmark SPY gained 31.46% and VDIGX gained 29.39% over the same period. Over the previous week the market value of iM-Best10(VDIGX) gained -0.07% at a time when SPY gained -0.26%. A starting capital of $100,000 at inception on 7/1/2014 would have grown to $163,746 which includes $382 cash and excludes $1,542 spent on fees and slippage. |
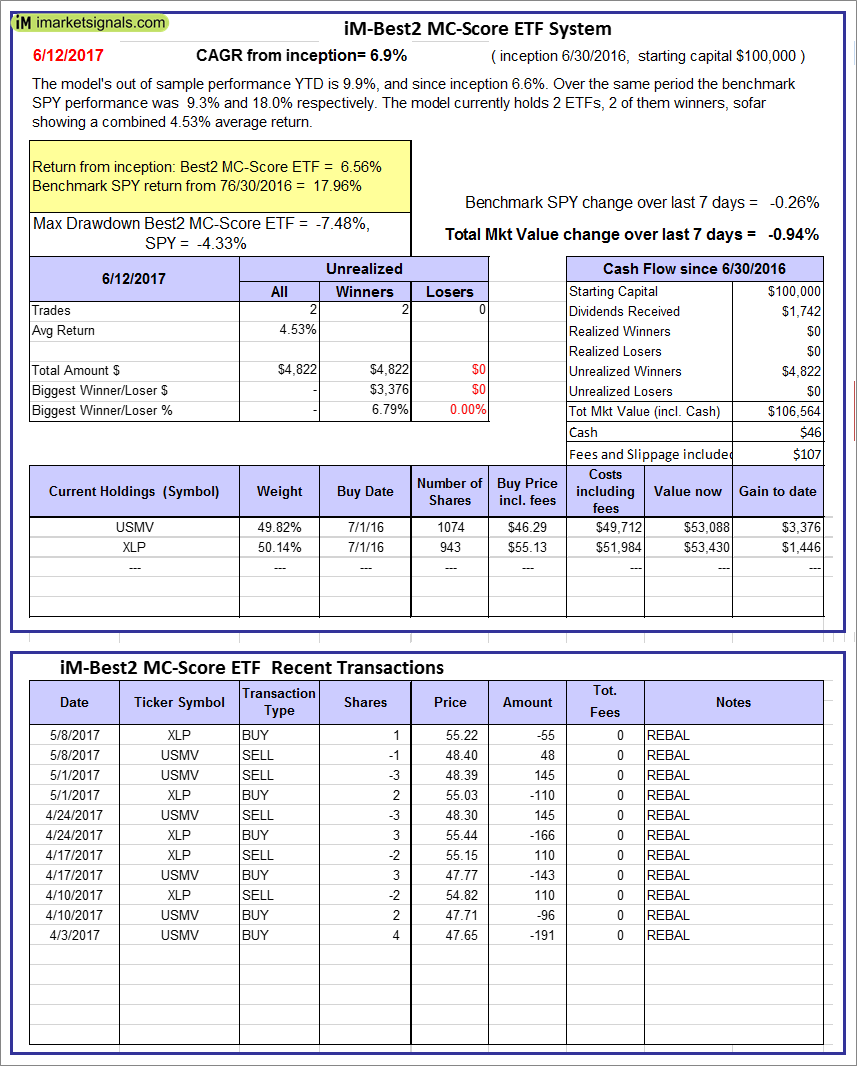 |
iM-Best2 MC-Score ETF System: The model’s out of sample performance YTD is 9.9%, and since inception 6.6%. Over the same period the benchmark SPY performance was 9.3% and 18.0% respectively. Over the previous week the market value of iM-BESTOGA-3 gained -0.94% at a time when SPY gained -0.26%. A starting capital of $100,000 at inception on 6/30/2016 would have grown to $46 which includes $107 cash and excludes Gain to date spent on fees and slippage. |
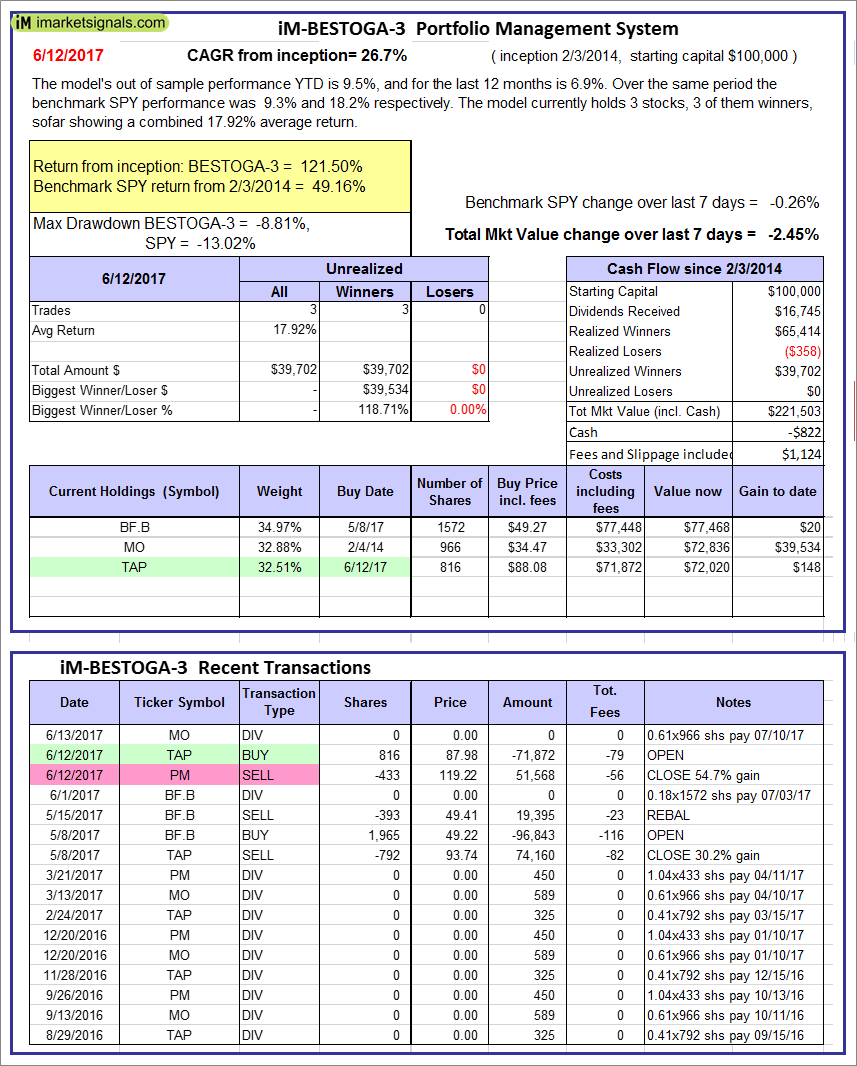 |
iM-BESTOGA-3: The model’s out of sample performance YTD is 9.5%, and for the last 12 months is 6.9%. Over the same period the benchmark SPY performance was 9.3% and 18.2% respectively. Over the previous week the market value of iM-BESTOGA-3 gained -2.45% at a time when SPY gained -0.26%. A starting capital of $100,000 at inception on 2/3/2014 would have grown to $221,503 which includes -$822 cash and excludes $1,124 spent on fees and slippage. |
 |
iM-Best7(HiD-LoV): The model’s out of sample performance YTD is 6.9%, and since inception 9.8%. Over the same period the benchmark SPY performance was 9.3% and 18.0% respectively. Over the previous week the market value of iM-BESTOGA-3 gained 0.83% at a time when SPY gained -0.26%. A starting capital of $100,000 at inception on 6/30/2016 would have grown to $109,807 which includes $652 cash and excludes $903 spent on fees and slippage. |
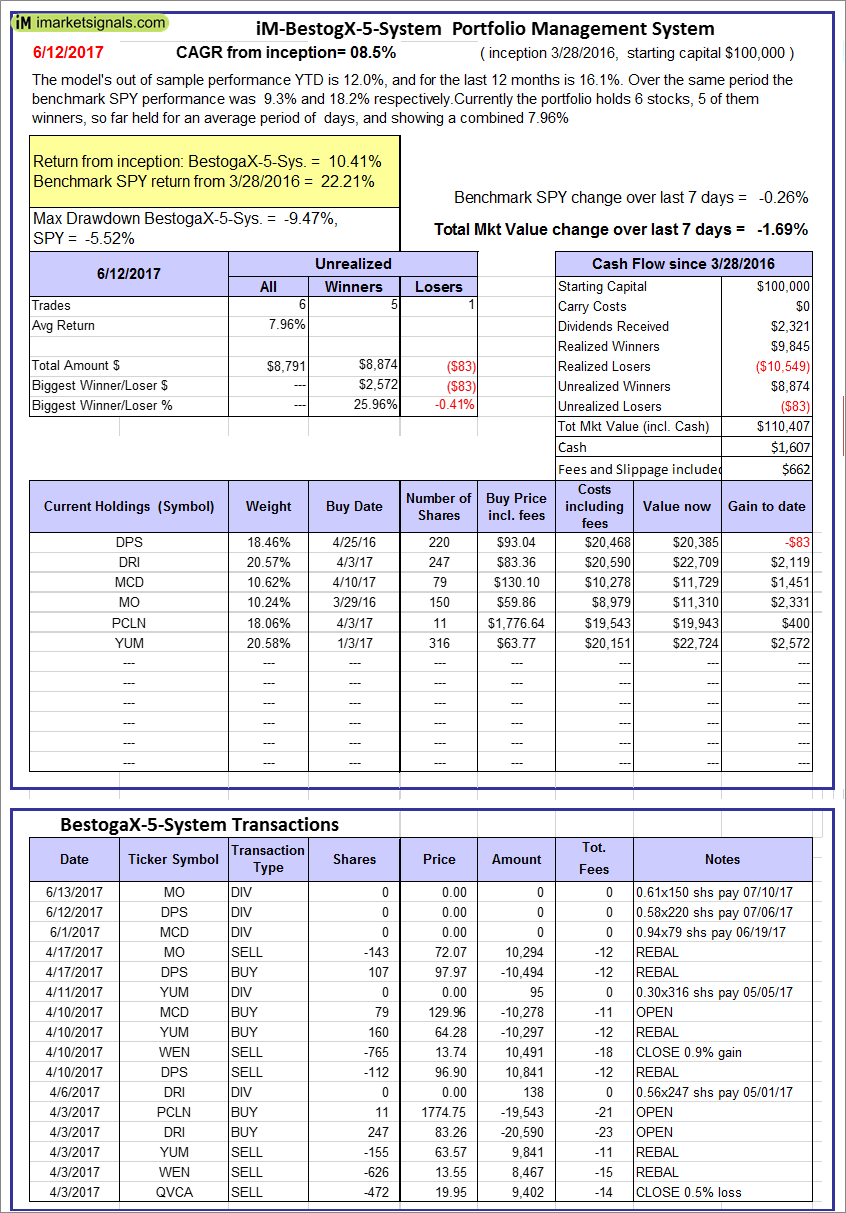 |
iM-BestogaX5-System: The model’s out of sample performance YTD is 12.0%, and for the last 12 months is 16.1%. Over the same period the benchmark SPY performance was 9.3% and 18.2% respectively. Over the previous week the market value of iM-Best8(S&P 500)Tax-Eff. gained -1.69% at a time when SPY gained -0.26%. A starting capital of $100,000 at inception on 3/28/2016 would have grown to $110,407 which includes $1,607 cash and excludes $662 spent on fees and slippage. |
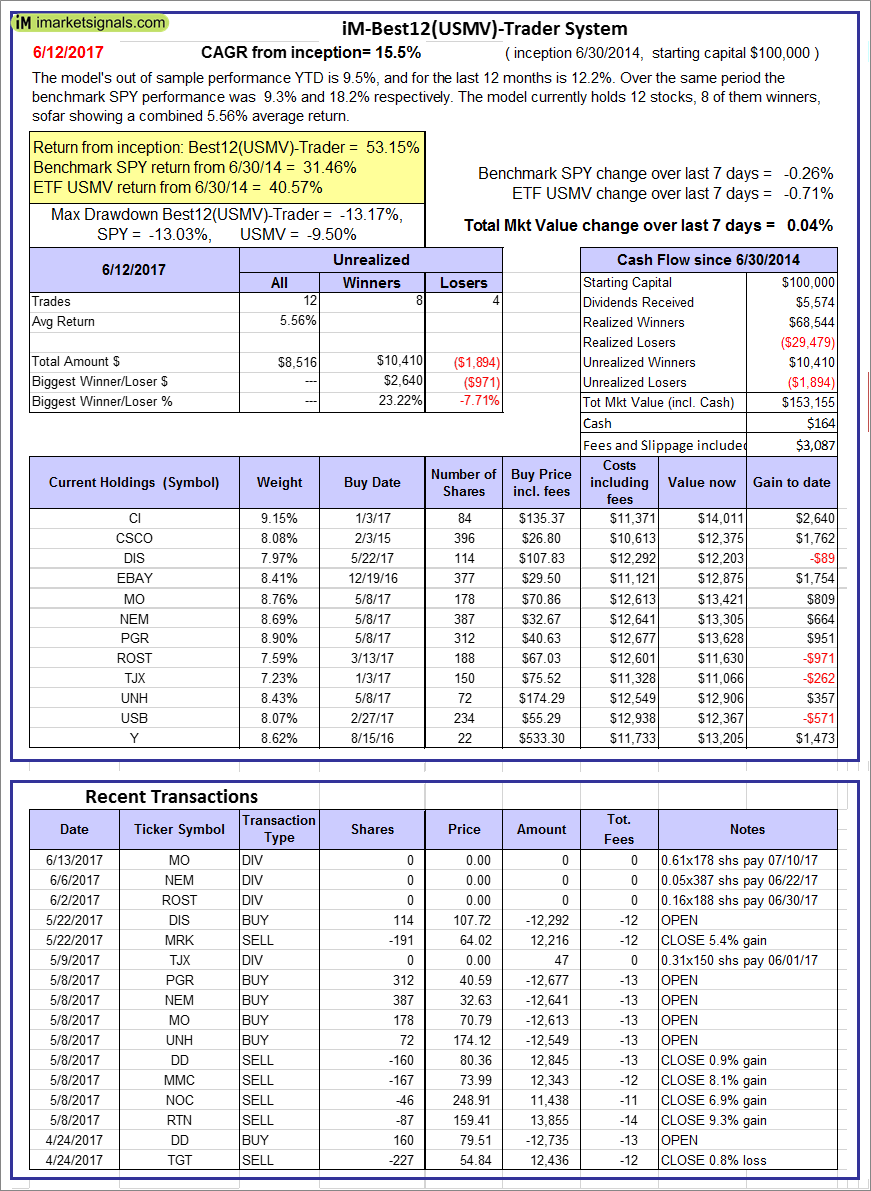  |
iM-Best12(USMV)-Trader: The model’s out of sample performance YTD is 9.5%, and for the last 12 months is 12.2%. Over the same period the benchmark SPY performance was 9.3% and 18.2% respectively. Since inception, on 7/1/2014, the model gained 53.15% while the benchmark SPY gained 31.46% and the ETF USMV gained 40.57% over the same period. Over the previous week the market value of iM-Best12(USMV)-Trader gained 0.04% at a time when SPY gained -0.26%. A starting capital of $100,000 at inception on 7/1/2014 would have grown to $153,155 which includes $164 cash and excludes $3,087 spent on fees and slippage. |
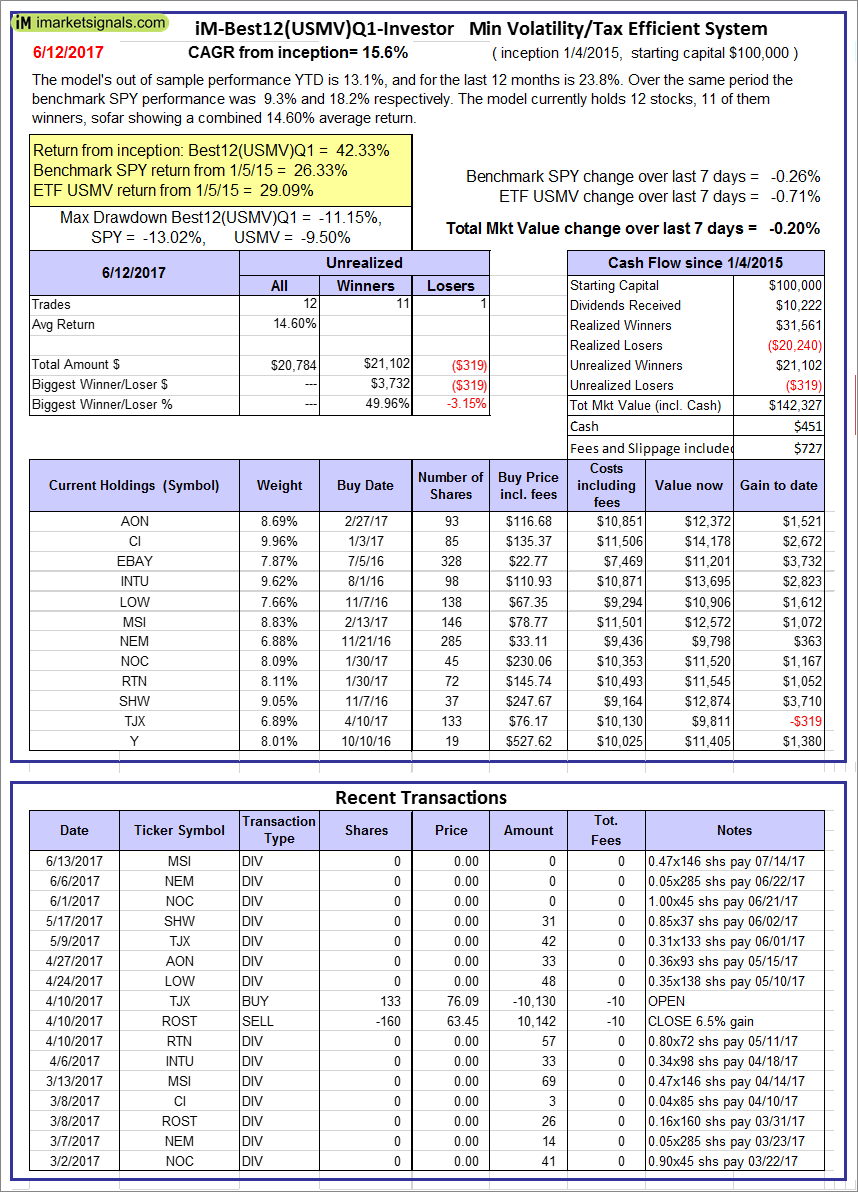 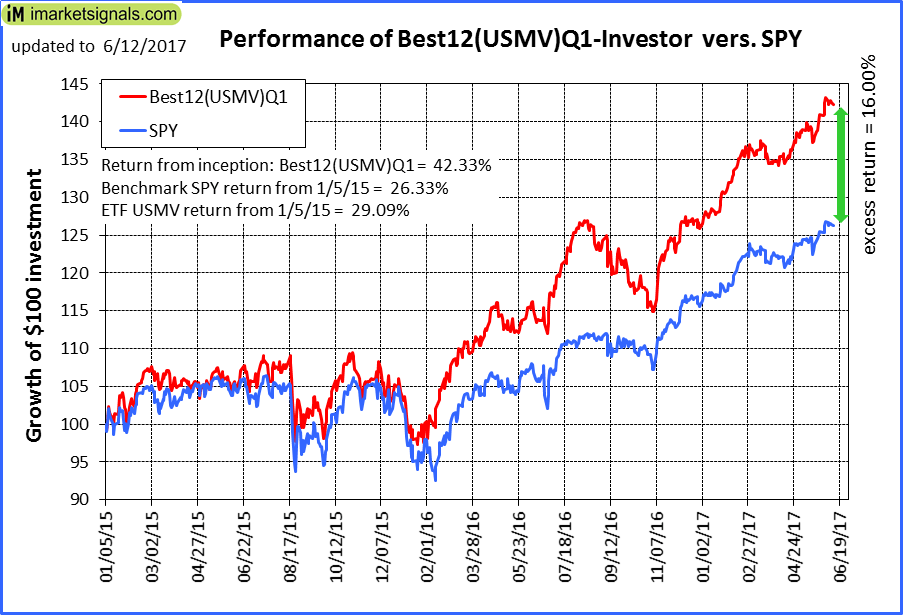 |
iM-Best12(USMV)Q1-Investor: The model’s out of sample performance YTD is 13.1%, and for the last 12 months is 23.8%. Over the same period the benchmark SPY performance was 9.3% and 18.2% respectively. Since inception, on 1/5/2015, the model gained 42.33% while the benchmark SPY gained 26.33% and the ETF USMV gained 29.09% over the same period. Over the previous week the market value of iM-Best12(USMV)Q1 gained -0.20% at a time when SPY gained -0.26%. A starting capital of $100,000 at inception on 1/5/2015 would have grown to $142,327 which includes $451 cash and excludes $727 spent on fees and slippage. |
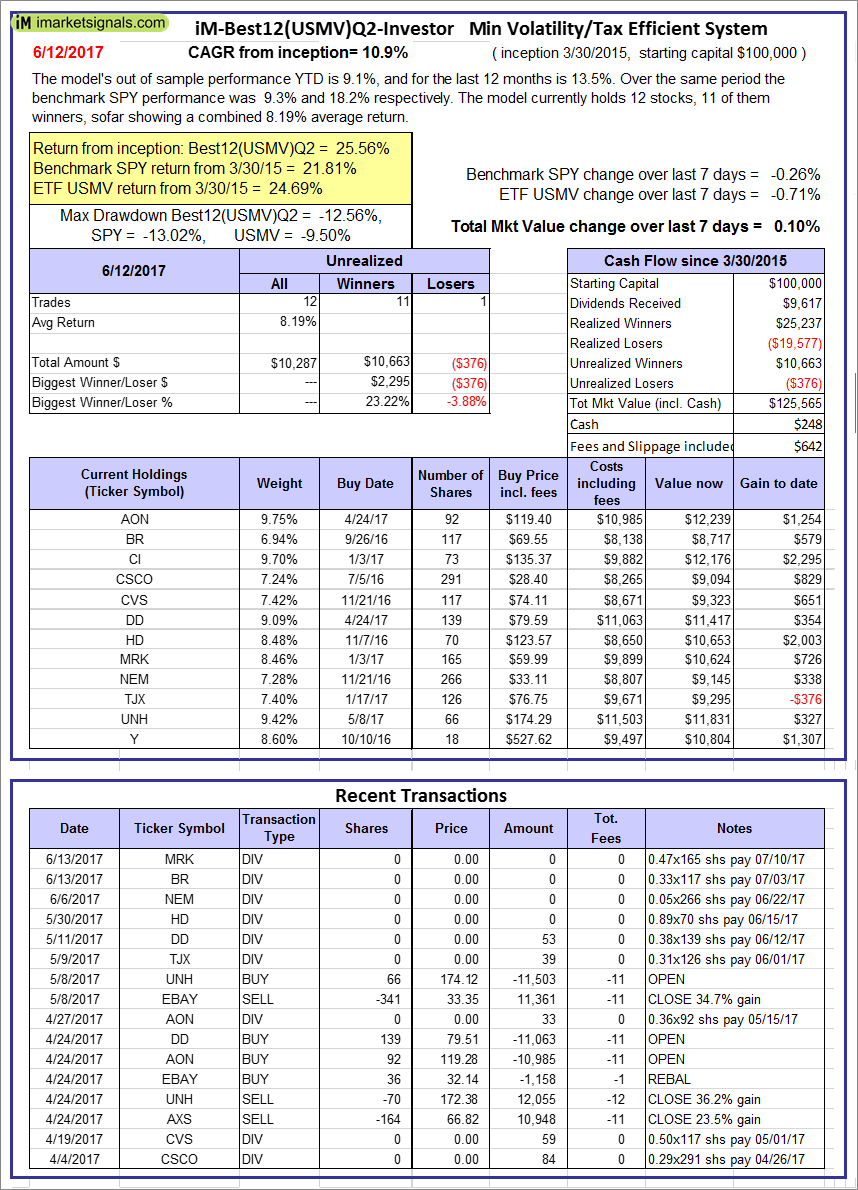 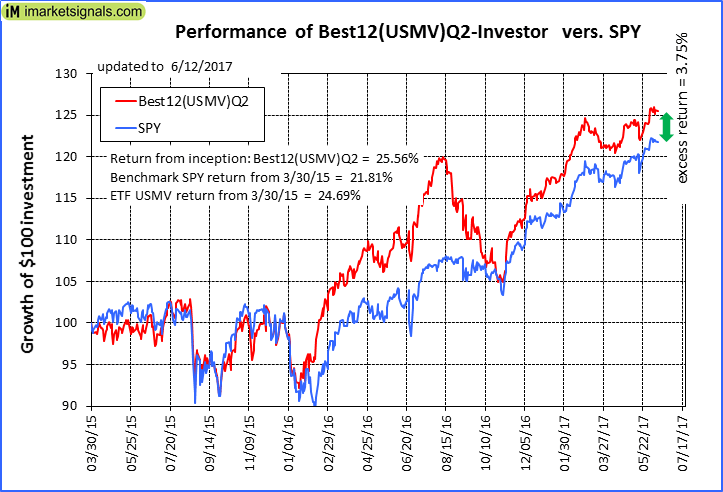 |
iM-Best12(USMV)Q2-Investor: The model’s out of sample performance YTD is 9.1%, and for the last 12 months is 13.5%. Over the same period the benchmark SPY performance was 9.3% and 18.2% respectively. Since inception, on 3/31/2015, the model gained 25.56% while the benchmark SPY gained 21.81% and the ETF USMV gained 24.69% over the same period. Over the previous week the market value of iM-Best12(USMV)Q2 gained 0.10% at a time when SPY gained -0.26%. A starting capital of $100,000 at inception on 3/31/2015 would have grown to $125,565 which includes $248 cash and excludes $642 spent on fees and slippage. |
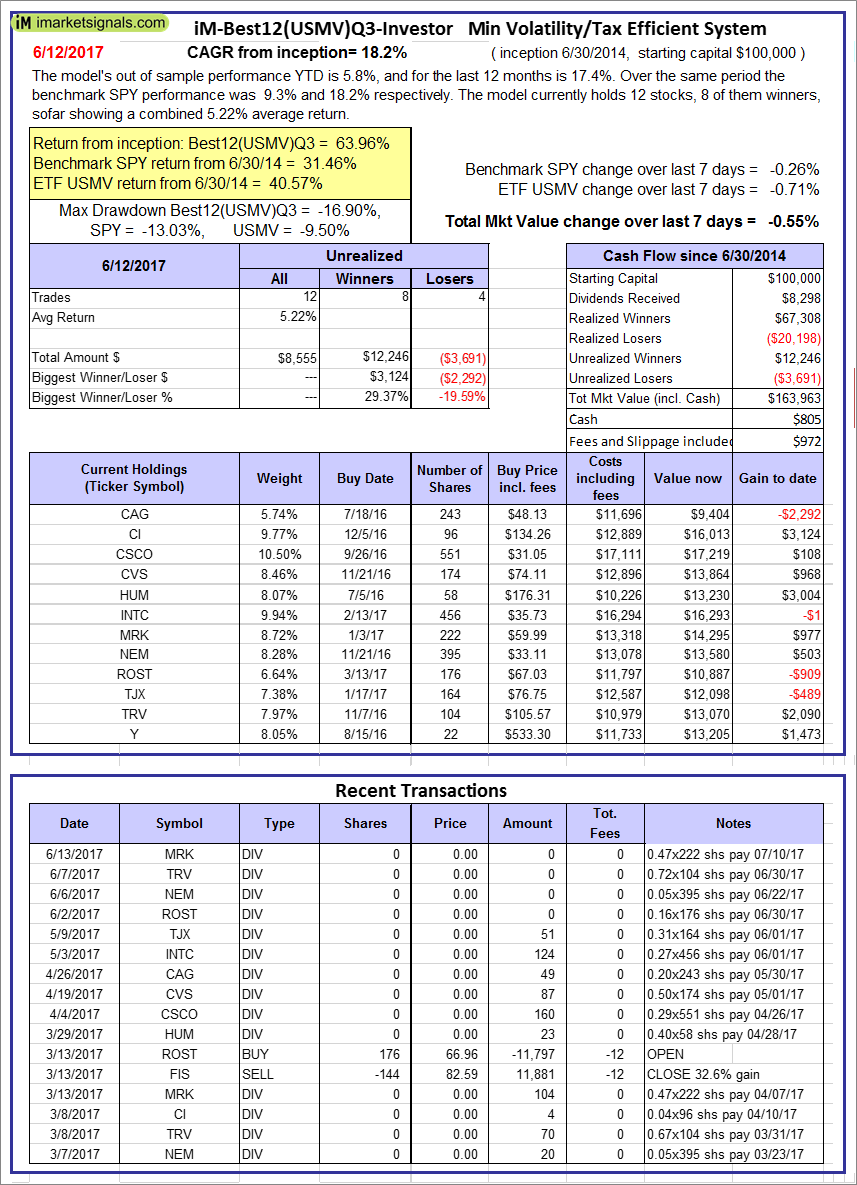  |
iM-Best12(USMV)Q3-Investor: The model’s out of sample performance YTD is 5.8%, and for the last 12 months is 17.4%. Over the same period the benchmark SPY performance was 9.3% and 18.2% respectively. Since inception, on 7/1/2014, the model gained 63.96% while the benchmark SPY gained 31.46% and the ETF USMV gained 40.57% over the same period. Over the previous week the market value of iM-Best12(USMV)Q3 gained -0.55% at a time when SPY gained -0.26%. A starting capital of $100,000 at inception on 7/1/2014 would have grown to $163,963 which includes $805 cash and excludes $972 spent on fees and slippage. |
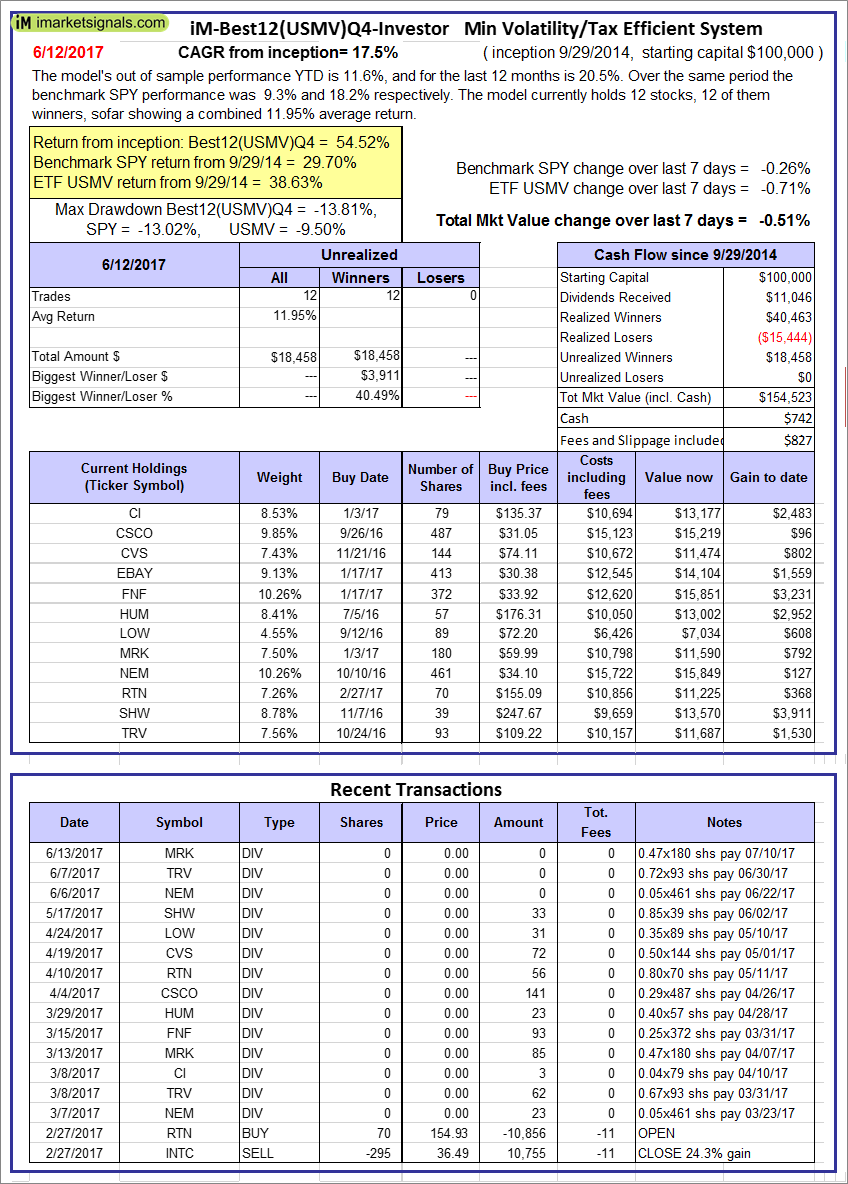 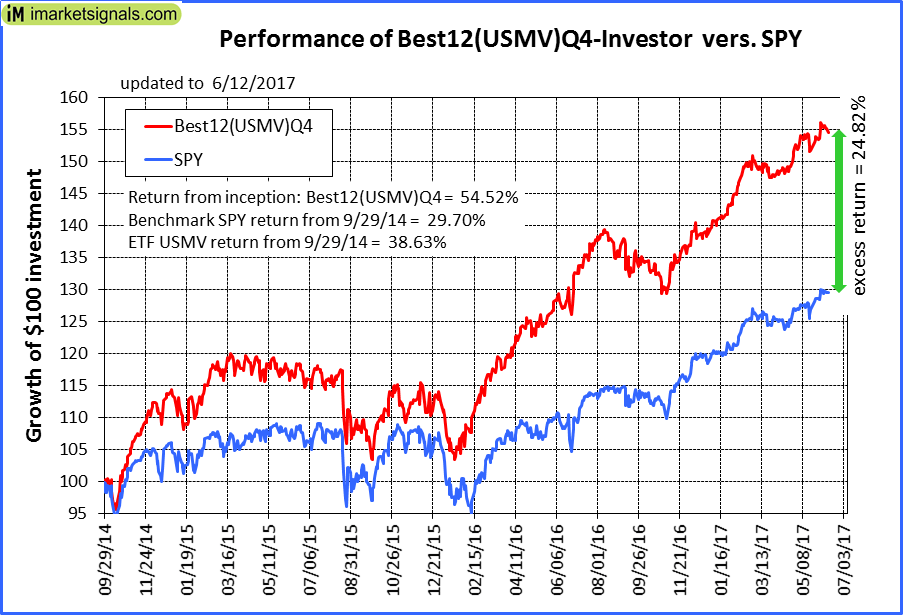 |
iM-Best12(USMV)Q4-Investor: Since inception, on 9/30/2014, the model gained 54.52% while the benchmark SPY gained 29.70% and the ETF USMV gained 38.63% over the same period. Over the previous week the market value of iM-Best12(USMV)Q4 gained -0.51% at a time when SPY gained -0.26%. A starting capital of $100,000 at inception on 9/30/2014 would have grown to $154,523 which includes $742 cash and excludes $827 spent on fees and slippage. |
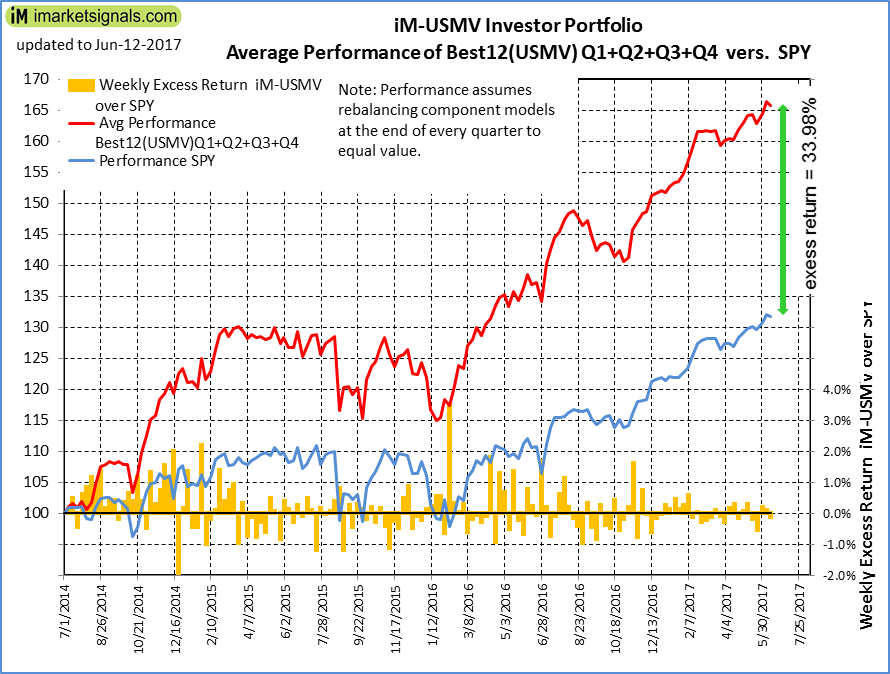 |
Average Performance of iM-Best12(USMV)Q1+Q2+Q3+Q4-Investor resulted in an excess return of 33.98% over SPY. (see iM-USMV Investor Portfolio) |
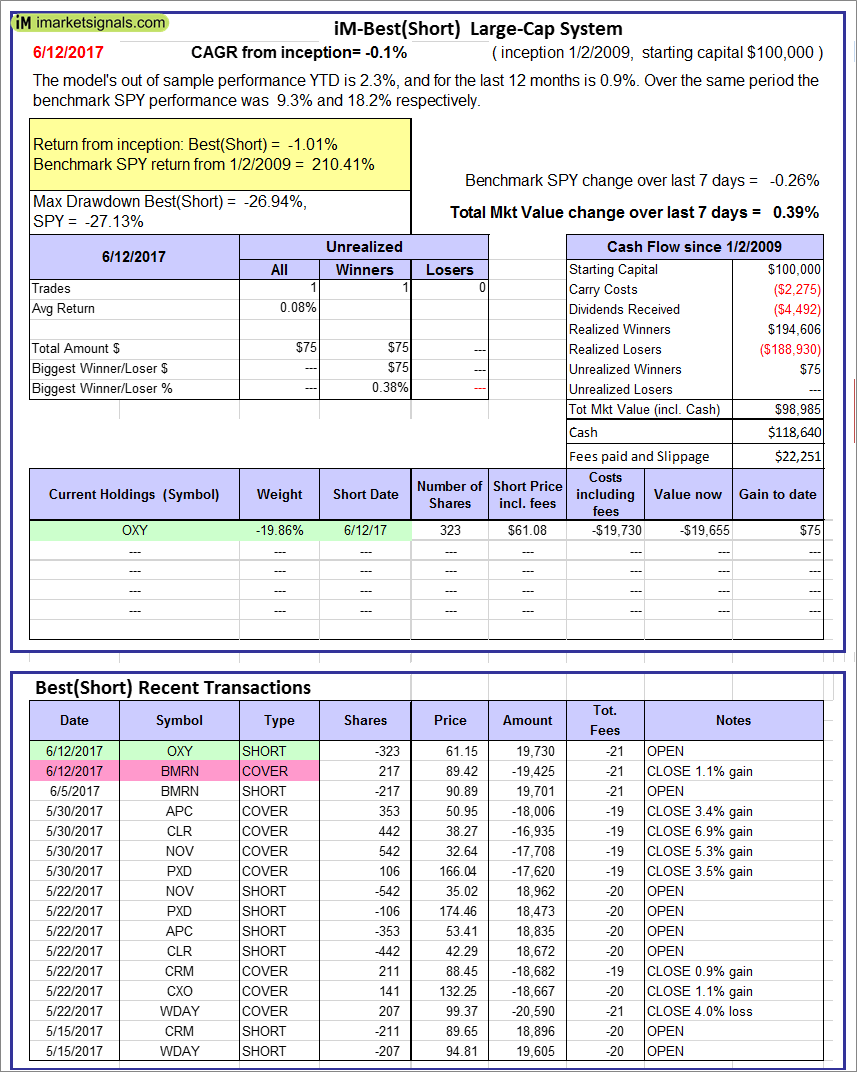 |
iM-Best(Short): The model’s out of sample performance YTD is 2.3%, and for the last 12 months is 0.9%. Over the same period the benchmark SPY performance was 9.3% and 18.2% respectively. Over the previous week the market value of iM-Best(Short) gained 0.39% at a time when SPY gained -0.26%. Over the period 1/2/2009 to 6/12/2017 the starting capital of $100,000 would have grown to $98,985 which includes $118,640 cash and excludes $22,251 spent on fees and slippage. |
iM-Best Reports – 6/12/2017
Posted in pmp SPY-SH
Leave a Reply
You must be logged in to post a comment.