
  |
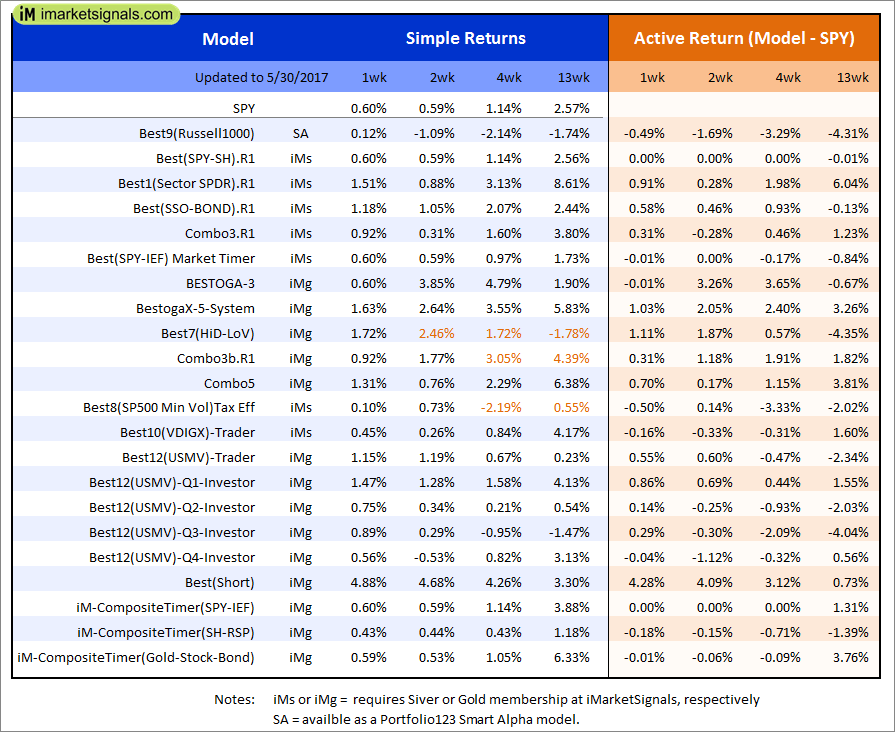
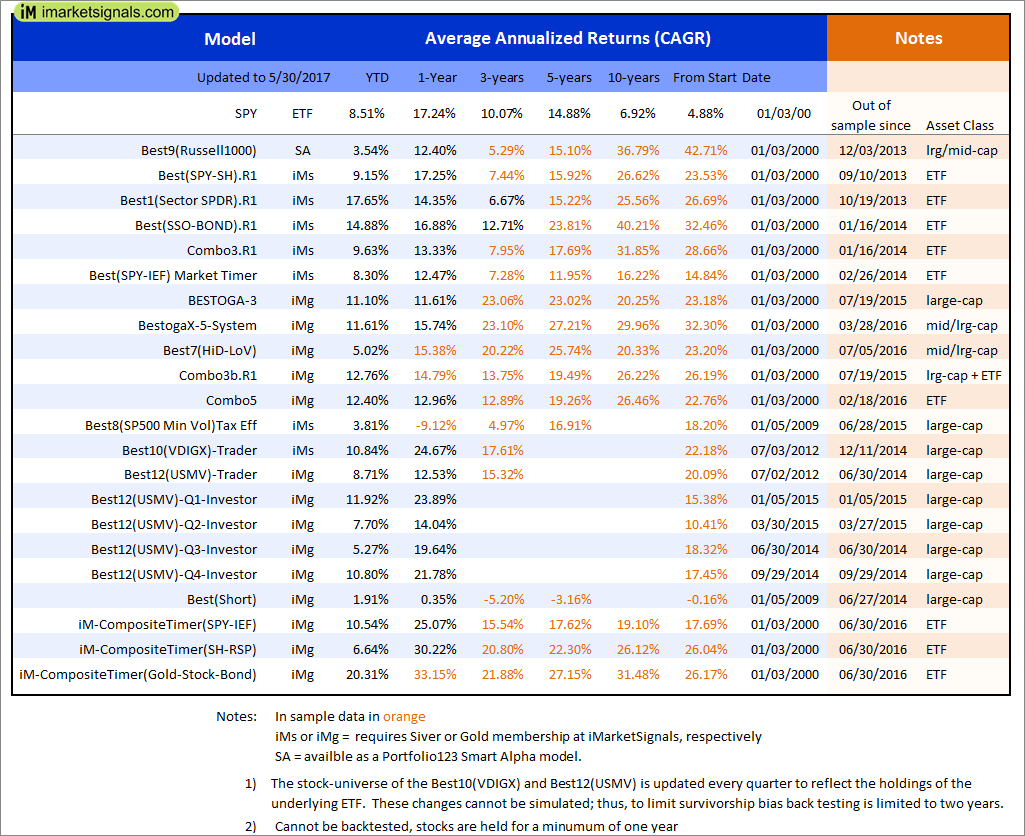
Out of sample performance summary of our models for the past 1, 2, 4 and 13 week periods. The active active return indicates how the models over- or underperformed the benchmark ETF SPY. Also the YTD, and the 1-, 3-, 5- and 10-year annualized returns are shown in the second table |
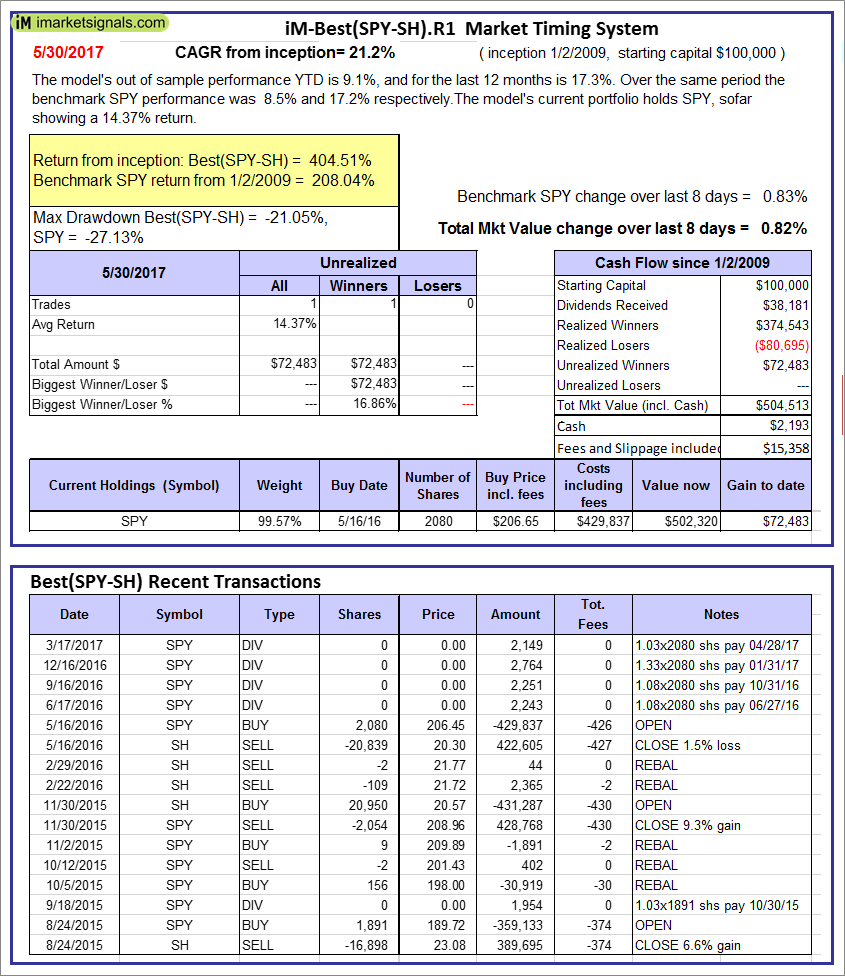 |
iM-Best(SPY-SH).R1: The model’s out of sample performance YTD is 9.1%, and for the last 12 months is 17.3%. Over the same period the benchmark SPY performance was 8.5% and 17.2% respectively. Over the previous week the market value of Best(SPY-SH) gained 0.82% at a time when SPY gained 0.83%. A starting capital of $100,000 at inception on 1/2/2009 would have grown to $504,513 which includes $2,193 cash and excludes $15,358 spent on fees and slippage. |
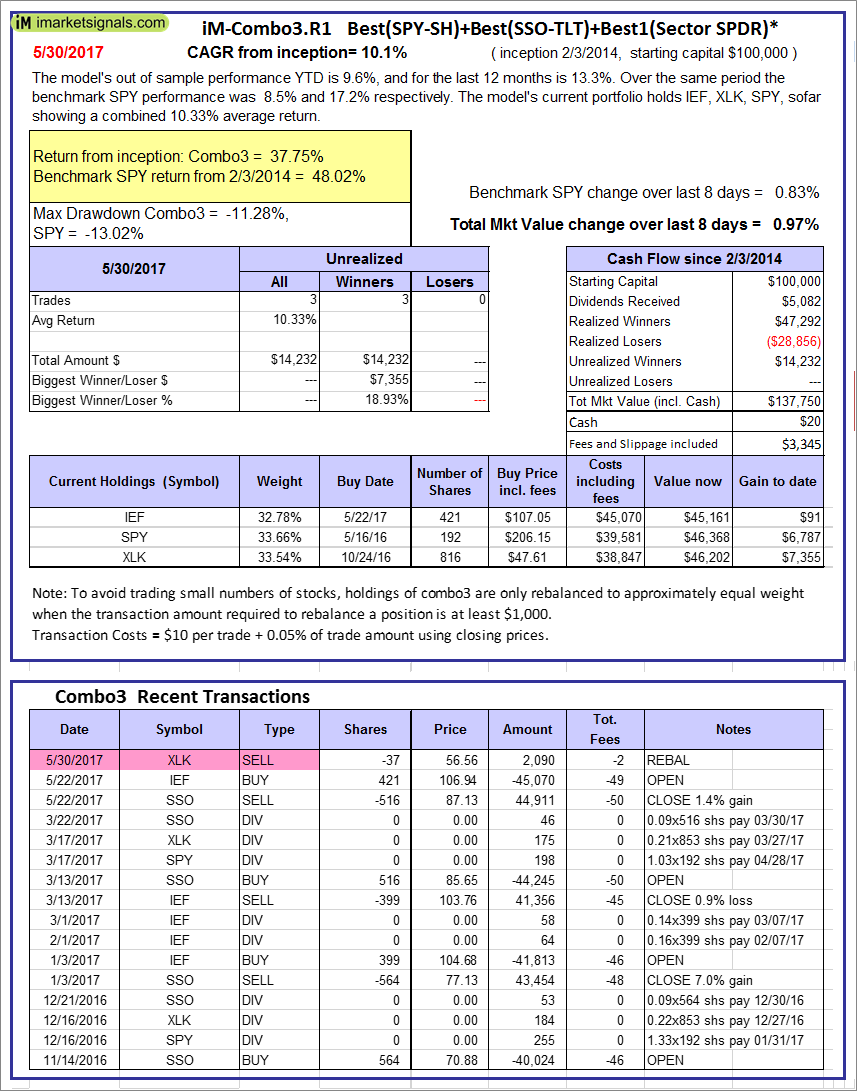 |
iM-Combo3.R1: The model’s out of sample performance YTD is 9.6%, and for the last 12 months is 13.3%. Over the same period the benchmark SPY performance was 8.5% and 17.2% respectively. Over the previous week the market value of iM-Combo3.R1 gained 0.97% at a time when SPY gained 0.83%. A starting capital of $100,000 at inception on 2/3/2014 would have grown to $137,750 which includes $20 cash and excludes $3,345 spent on fees and slippage. |
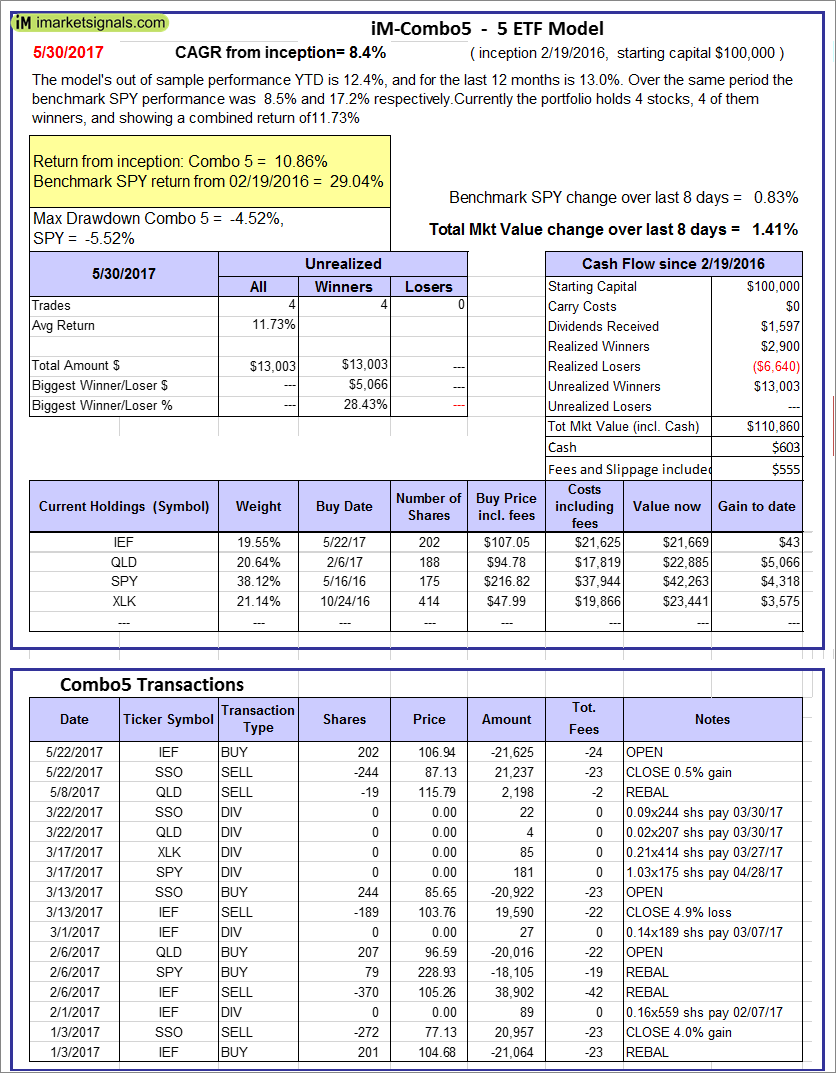 |
iM-Combo5: The model’s out of sample performance YTD is 12.4%, and for the last 12 months is 13.0%. Over the same period the benchmark SPY performance was 8.5% and 17.2% respectively. Over the previous week the market value of iM-Combo5 gained 1.41% at a time when SPY gained 0.83%. A starting capital of $100,000 at inception on 2/22/2016 would have grown to $110,860 which includes $603 cash and excludes $555 spent on fees and slippage. |
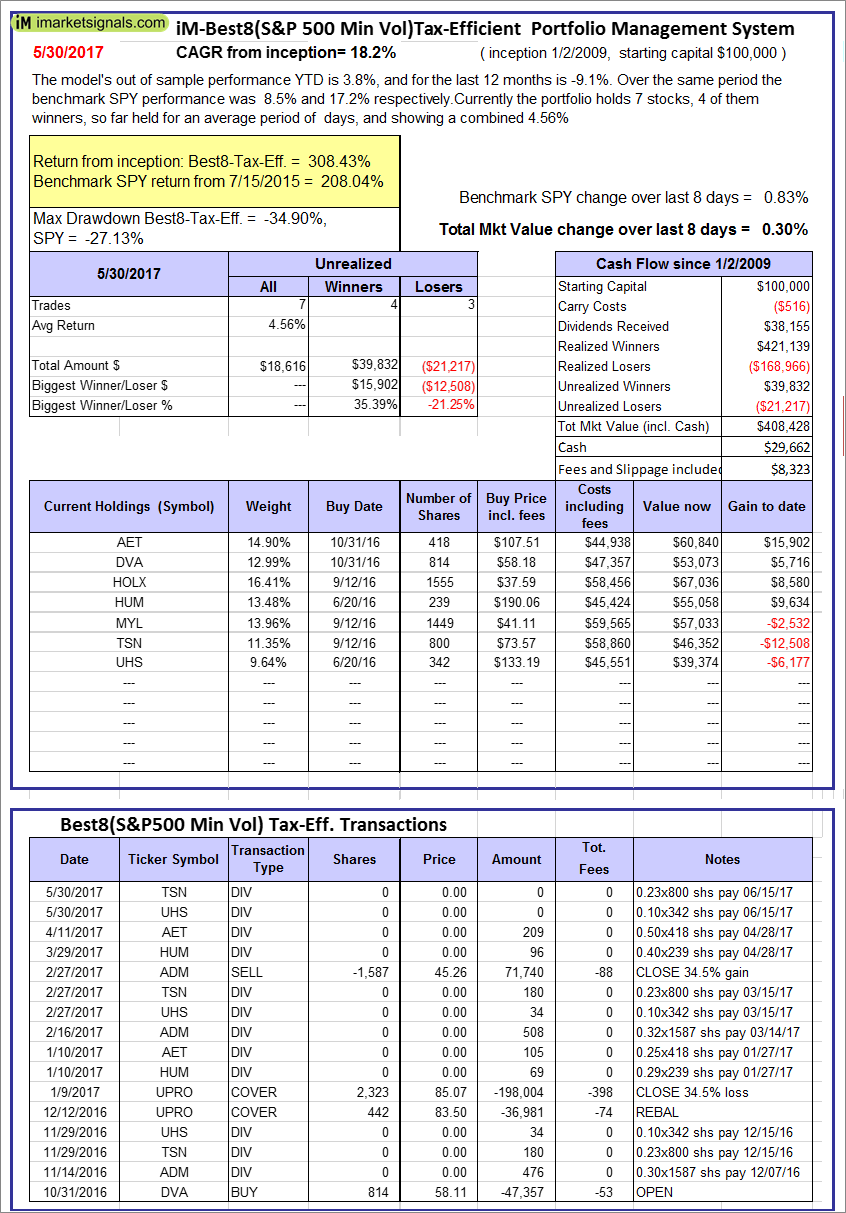 |
The iM-Best8(S&P500 Min Vol)Tax-Efficient The model’s out of sample performance YTD is 3.8%, and for the last 12 months is -9.1%. Over the same period the benchmark SPY performance was 8.5% and 17.2% respectively. Over the previous week the market value of iM-Best8(S&P 500)Tax-Eff. gained 0.30% at a time when SPY gained 0.83%. A starting capital of $100,000 at inception on 1/2/2009 would have grown to $408,428 which includes $29,662 cash and excludes $8,323 spent on fees and slippage. |
 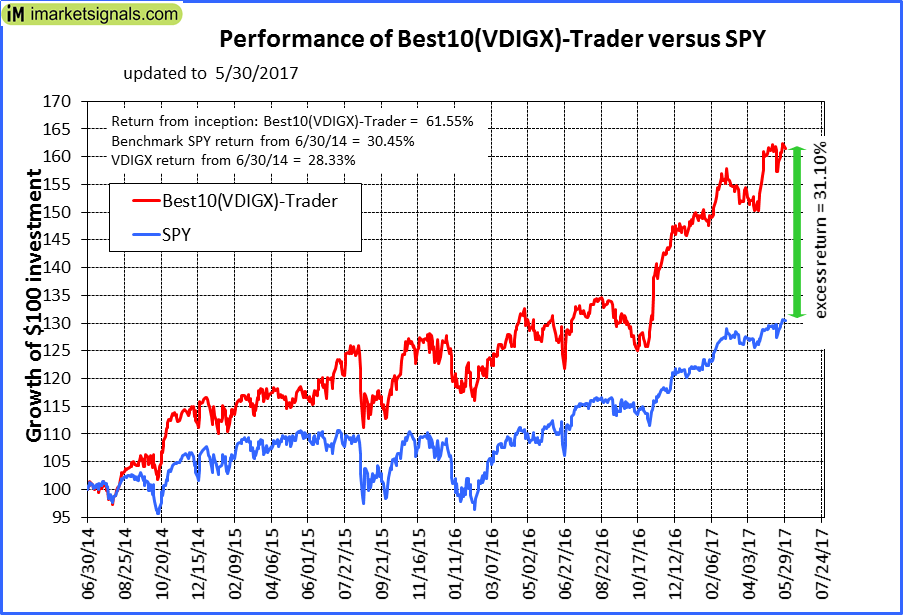 |
iM-Best10(VDIGX)-Trader: The model’s out of sample performance YTD is 10.8%, and for the last 12 months is 24.7%. Over the same period the benchmark SPY performance was 8.5% and 17.2% respectively. Since inception, on 7/1/2014, the model gained 61.55% while the benchmark SPY gained 30.45% and VDIGX gained 28.33% over the same period. Over the previous week the market value of iM-Best10(VDIGX) gained 0.94% at a time when SPY gained 0.83%. A starting capital of $100,000 at inception on 7/1/2014 would have grown to $161,552 which includes $198 cash and excludes $1,542 spent on fees and slippage. |
 |
iM-Best2 MC-Score ETF System: The model’s out of sample performance YTD is 9.5%, and since inception 6.2%. Over the same period the benchmark SPY performance was 8.5% and 17.1% respectively. Over the previous week the market value of iM-BESTOGA-3 gained 1.42% at a time when SPY gained 0.83%. A starting capital of $100,000 at inception on 6/30/2016 would have grown to $46 which includes $107 cash and excludes Gain to date spent on fees and slippage. |
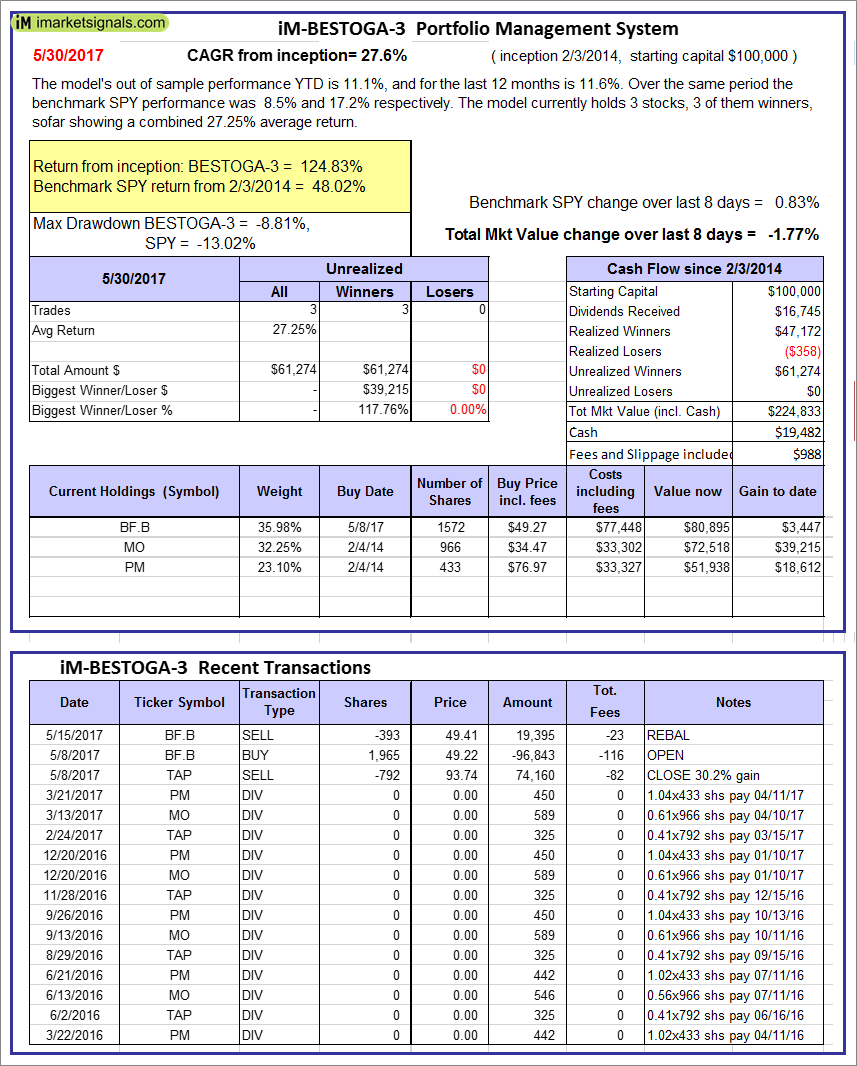 |
iM-BESTOGA-3: The model’s out of sample performance YTD is 11.1%, and for the last 12 months is 11.6%. Over the same period the benchmark SPY performance was 8.5% and 17.2% respectively. Over the previous week the market value of iM-BESTOGA-3 gained -1.77% at a time when SPY gained 0.83%. A starting capital of $100,000 at inception on 2/3/2014 would have grown to $224,833 which includes $19,482 cash and excludes $988 spent on fees and slippage. |
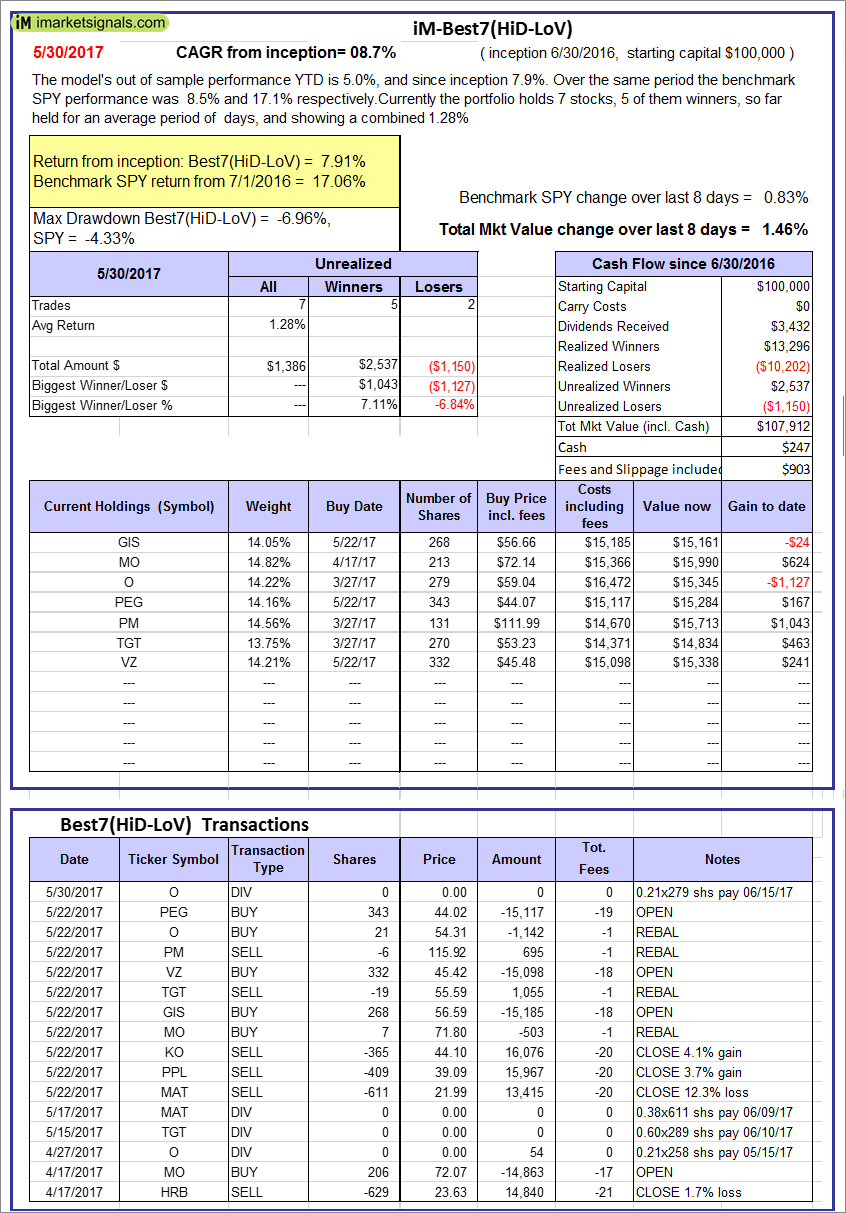 |
iM-Best7(HiD-LoV): The model’s out of sample performance YTD is 5.0%, and since inception 7.9%. Over the same period the benchmark SPY performance was 8.5% and 17.1% respectively. Over the previous week the market value of iM-BESTOGA-3 gained 1.46% at a time when SPY gained 0.83%. A starting capital of $100,000 at inception on 6/30/2016 would have grown to $107,912 which includes $247 cash and excludes $903 spent on fees and slippage. |
 |
iM-BestogaX5-System: The model’s out of sample performance YTD is 11.6%, and for the last 12 months is 15.8%. Over the same period the benchmark SPY performance was 8.5% and 17.2% respectively. Over the previous week the market value of iM-Best8(S&P 500)Tax-Eff. gained 1.50% at a time when SPY gained 0.83%. A starting capital of $100,000 at inception on 3/28/2016 would have grown to $110,005 which includes $1,607 cash and excludes $662 spent on fees and slippage. |
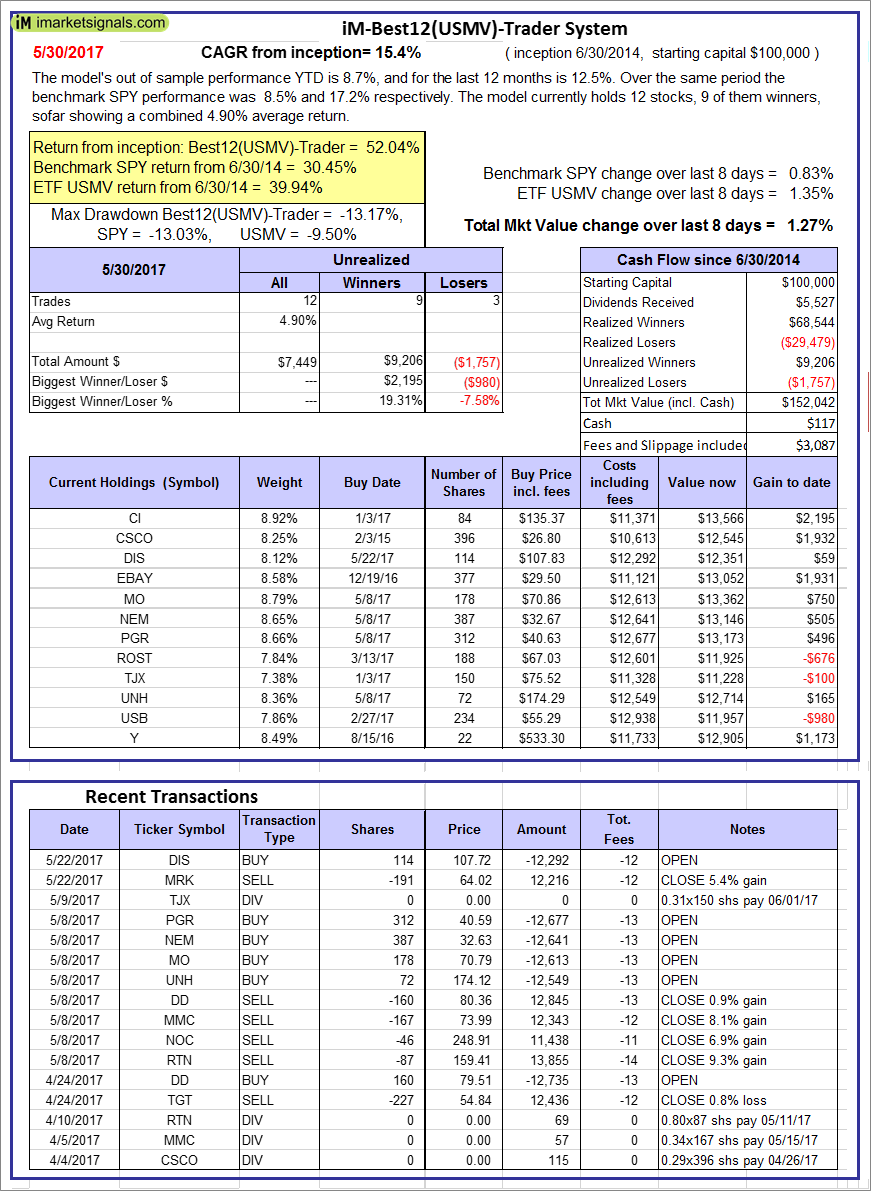 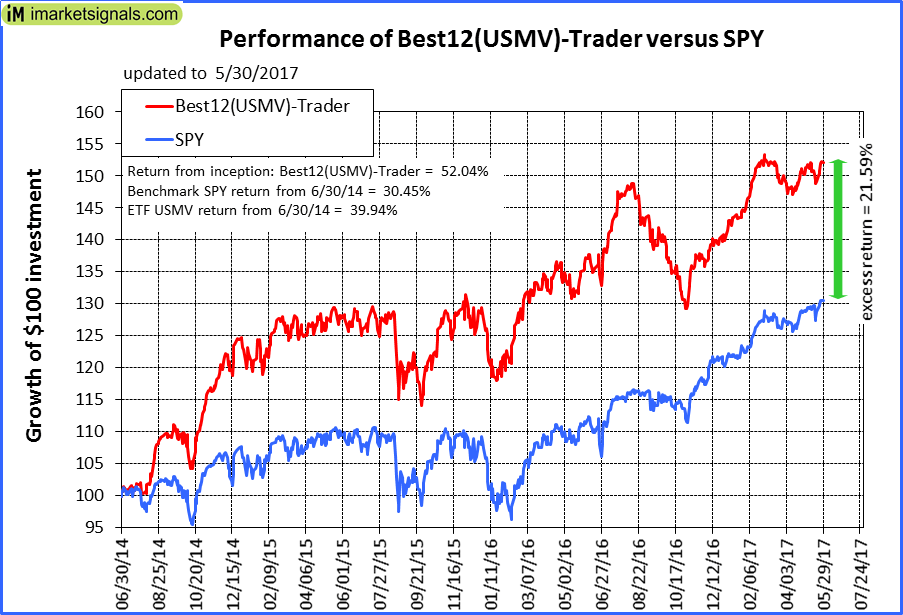 |
iM-Best12(USMV)-Trader: The model’s out of sample performance YTD is 8.7%, and for the last 12 months is 12.5%. Over the same period the benchmark SPY performance was 8.5% and 17.2% respectively. Since inception, on 7/1/2014, the model gained 52.04% while the benchmark SPY gained 30.45% and the ETF USMV gained 39.94% over the same period. Over the previous week the market value of iM-Best12(USMV)-Trader gained 1.27% at a time when SPY gained 0.83%. A starting capital of $100,000 at inception on 7/1/2014 would have grown to $152,042 which includes $117 cash and excludes $3,087 spent on fees and slippage. |
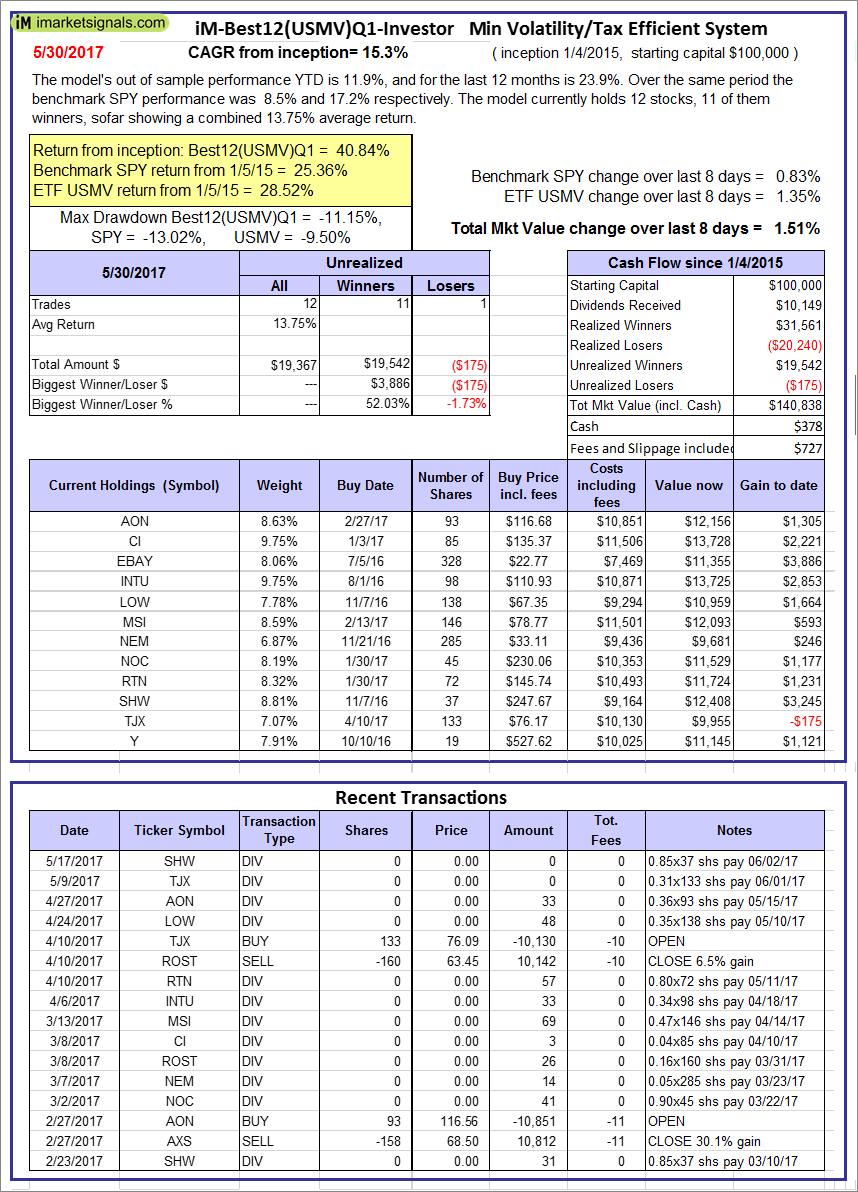 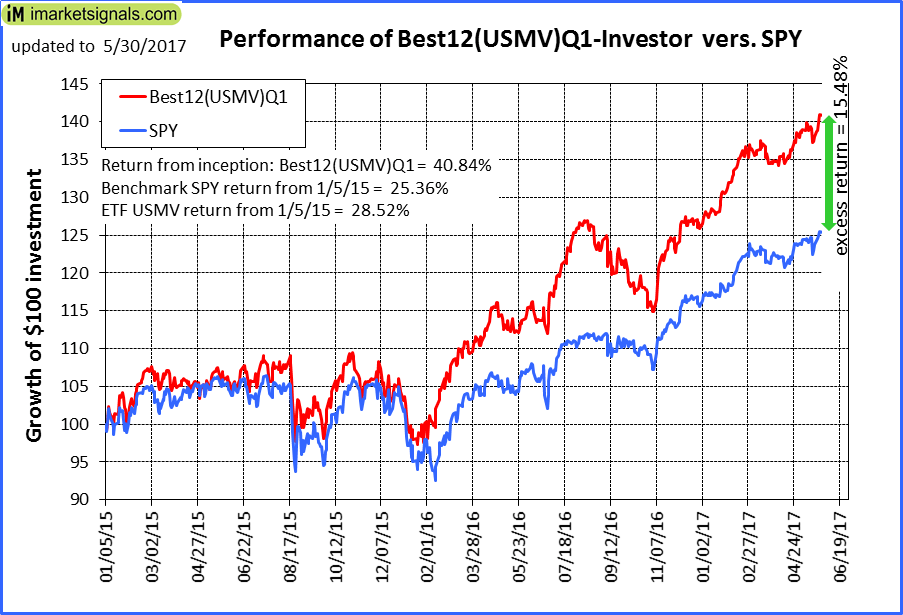 |
iM-Best12(USMV)Q1-Investor: The model’s out of sample performance YTD is 11.9%, and for the last 12 months is 23.9%. Over the same period the benchmark SPY performance was 8.5% and 17.2% respectively. Since inception, on 1/5/2015, the model gained 40.84% while the benchmark SPY gained 25.36% and the ETF USMV gained 28.52% over the same period. Over the previous week the market value of iM-Best12(USMV)Q1 gained 1.51% at a time when SPY gained 0.83%. A starting capital of $100,000 at inception on 1/5/2015 would have grown to $140,838 which includes $378 cash and excludes $727 spent on fees and slippage. |
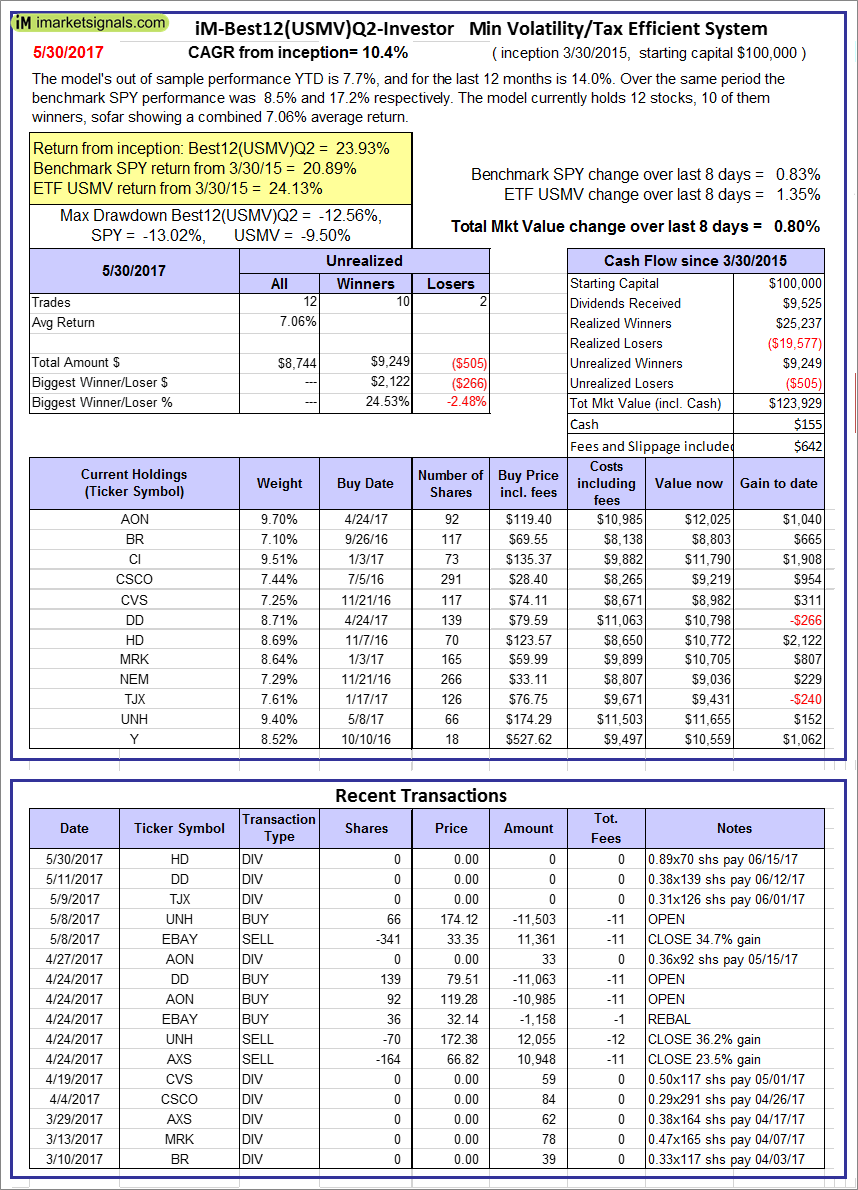 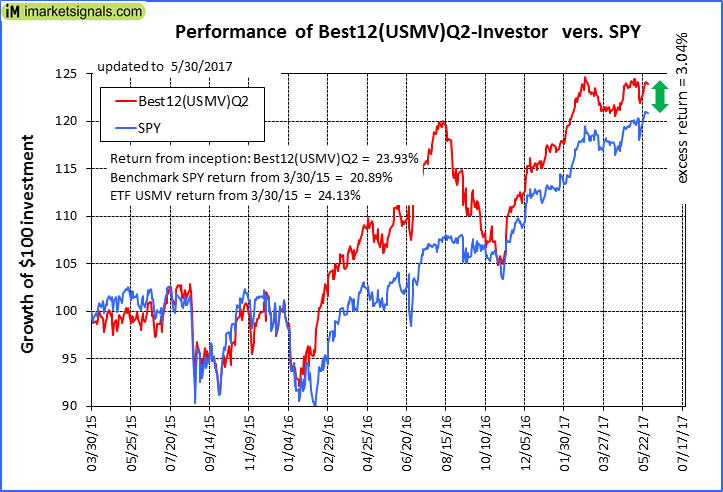 |
iM-Best12(USMV)Q2-Investor: The model’s out of sample performance YTD is 7.7%, and for the last 12 months is 14.0%. Over the same period the benchmark SPY performance was 8.5% and 17.2% respectively. Since inception, on 3/31/2015, the model gained 23.93% while the benchmark SPY gained 20.89% and the ETF USMV gained 24.13% over the same period. Over the previous week the market value of iM-Best12(USMV)Q2 gained 0.80% at a time when SPY gained 0.83%. A starting capital of $100,000 at inception on 3/31/2015 would have grown to $123,929 which includes $155 cash and excludes $642 spent on fees and slippage. |
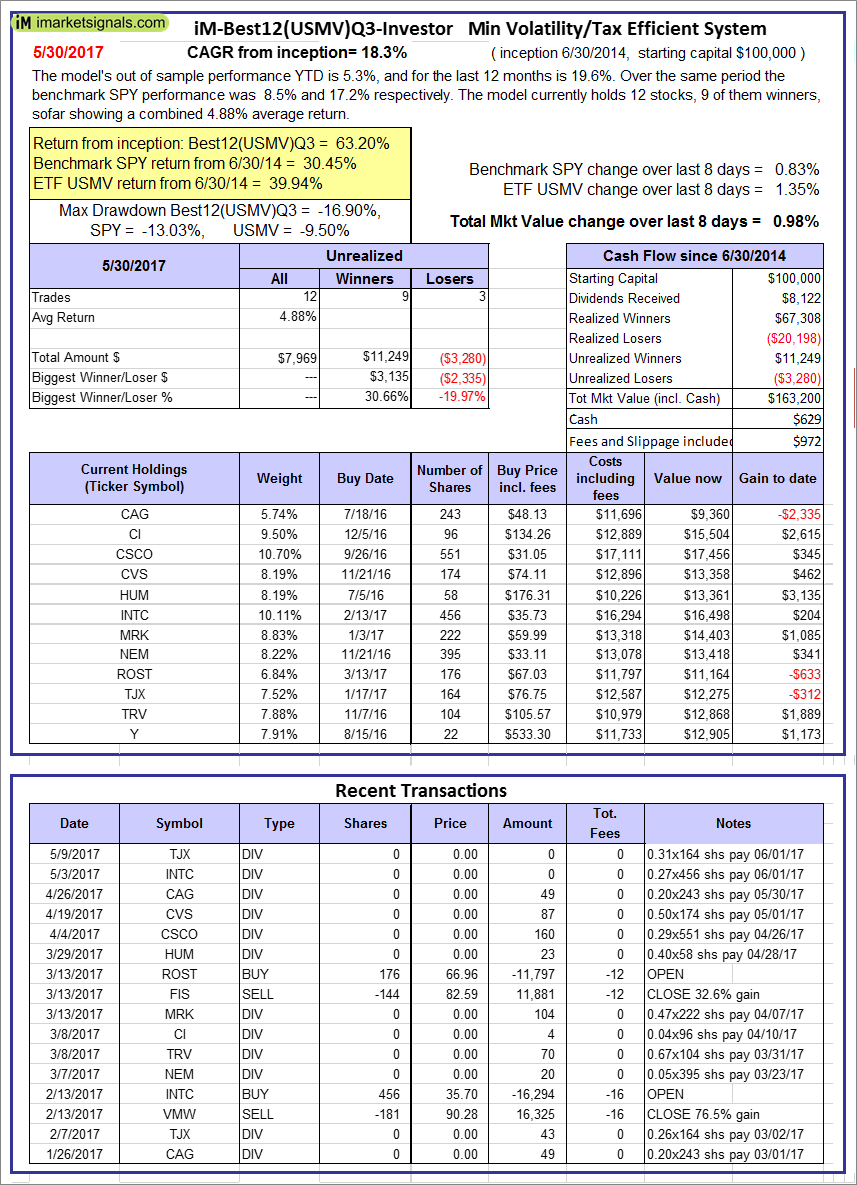 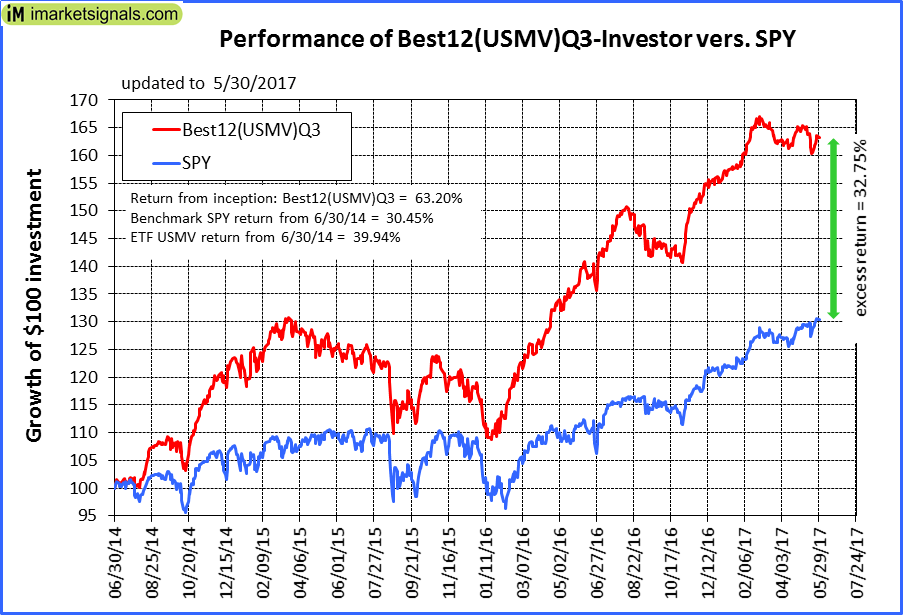 |
iM-Best12(USMV)Q3-Investor: The model’s out of sample performance YTD is 5.3%, and for the last 12 months is 19.6%. Over the same period the benchmark SPY performance was 8.5% and 17.2% respectively. Since inception, on 7/1/2014, the model gained 63.20% while the benchmark SPY gained 30.45% and the ETF USMV gained 39.94% over the same period. Over the previous week the market value of iM-Best12(USMV)Q3 gained 0.98% at a time when SPY gained 0.83%. A starting capital of $100,000 at inception on 7/1/2014 would have grown to $163,200 which includes $629 cash and excludes $972 spent on fees and slippage. |
 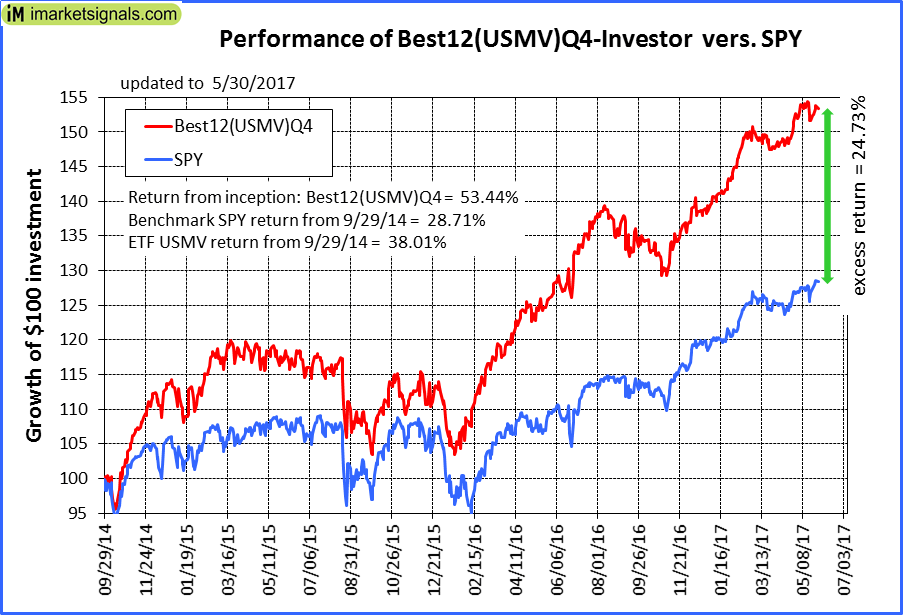 |
iM-Best12(USMV)Q4-Investor: Since inception, on 9/30/2014, the model gained 53.44% while the benchmark SPY gained 28.71% and the ETF USMV gained 38.01% over the same period. Over the previous week the market value of iM-Best12(USMV)Q4 gained 0.70% at a time when SPY gained 0.83%. A starting capital of $100,000 at inception on 9/30/2014 would have grown to $153,435 which includes $709 cash and excludes $827 spent on fees and slippage. |
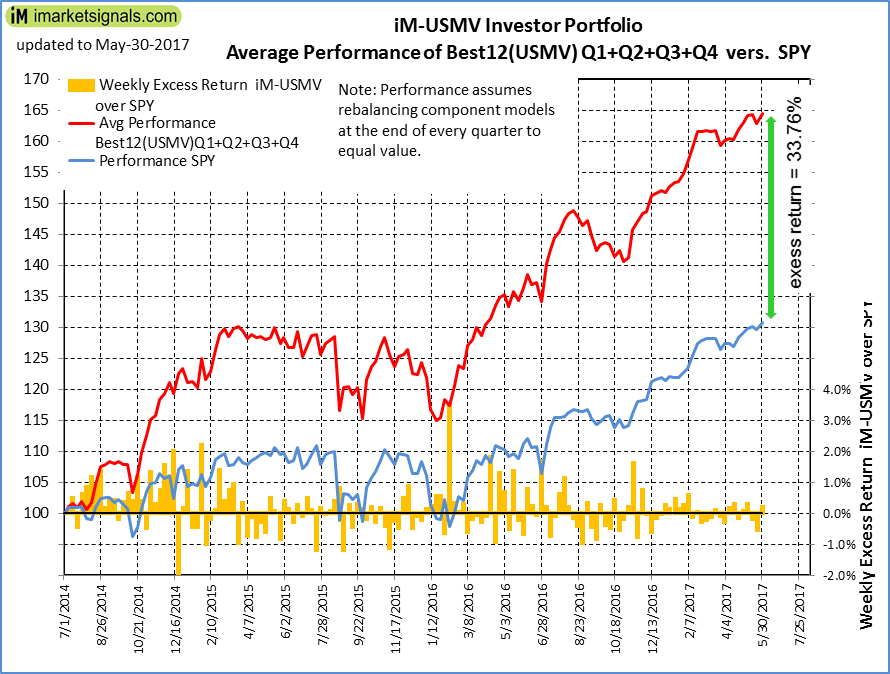 |
Average Performance of iM-Best12(USMV)Q1+Q2+Q3+Q4-Investor resulted in an excess return of 33.76% over SPY. (see iM-USMV Investor Portfolio) |
 |
iM-Best(Short): The model’s out of sample performance YTD is 1.9%, and for the last 12 months is 0.3%. Over the same period the benchmark SPY performance was 8.5% and 17.2% respectively. Over the previous week the market value of iM-Best(Short) gained 4.83% at a time when SPY gained 0.83%. Over the period 1/2/2009 to 5/30/2017 the starting capital of $100,000 would have grown to $98,634 which includes $98,634 cash and excludes $22,189 spent on fees and slippage. |
iM-Best Reports – 5/30/2017
Posted in pmp SPY-SH
Leave a Reply
You must be logged in to post a comment.