
  |
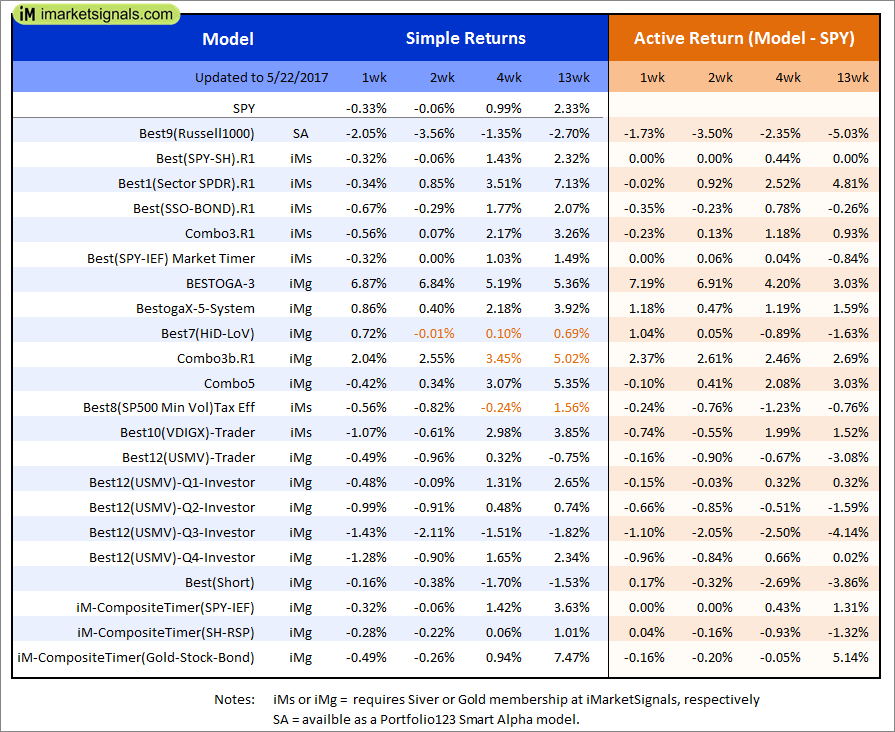
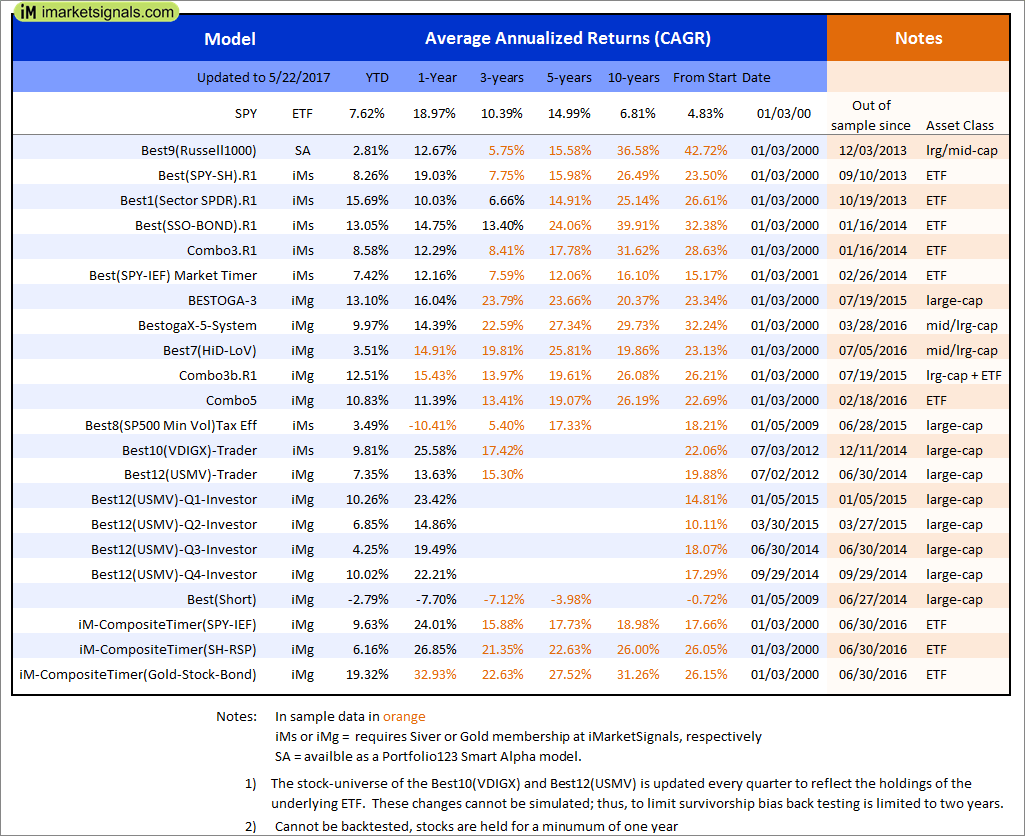
Out of sample performance summary of our models for the past 1, 2, 4 and 13 week periods. The active active return indicates how the models over- or underperformed the benchmark ETF SPY. Also the YTD, and the 1-, 3-, 5- and 10-year annualized returns are shown in the second table |
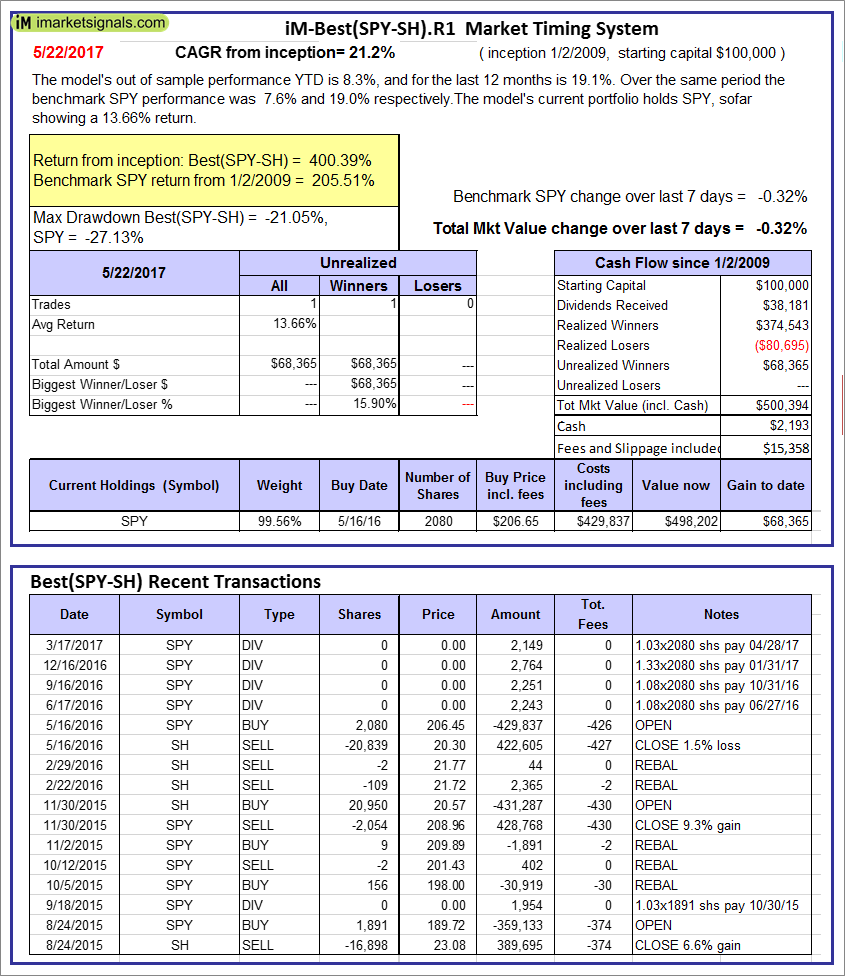 |
iM-Best(SPY-SH).R1: The model’s out of sample performance YTD is 8.3%, and for the last 12 months is 19.1%. Over the same period the benchmark SPY performance was 7.6% and 19.0% respectively. Over the previous week the market value of Best(SPY-SH) gained -0.32% at a time when SPY gained -0.32%. A starting capital of $100,000 at inception on 1/2/2009 would have grown to $500,394 which includes $2,193 cash and excludes $15,358 spent on fees and slippage. |
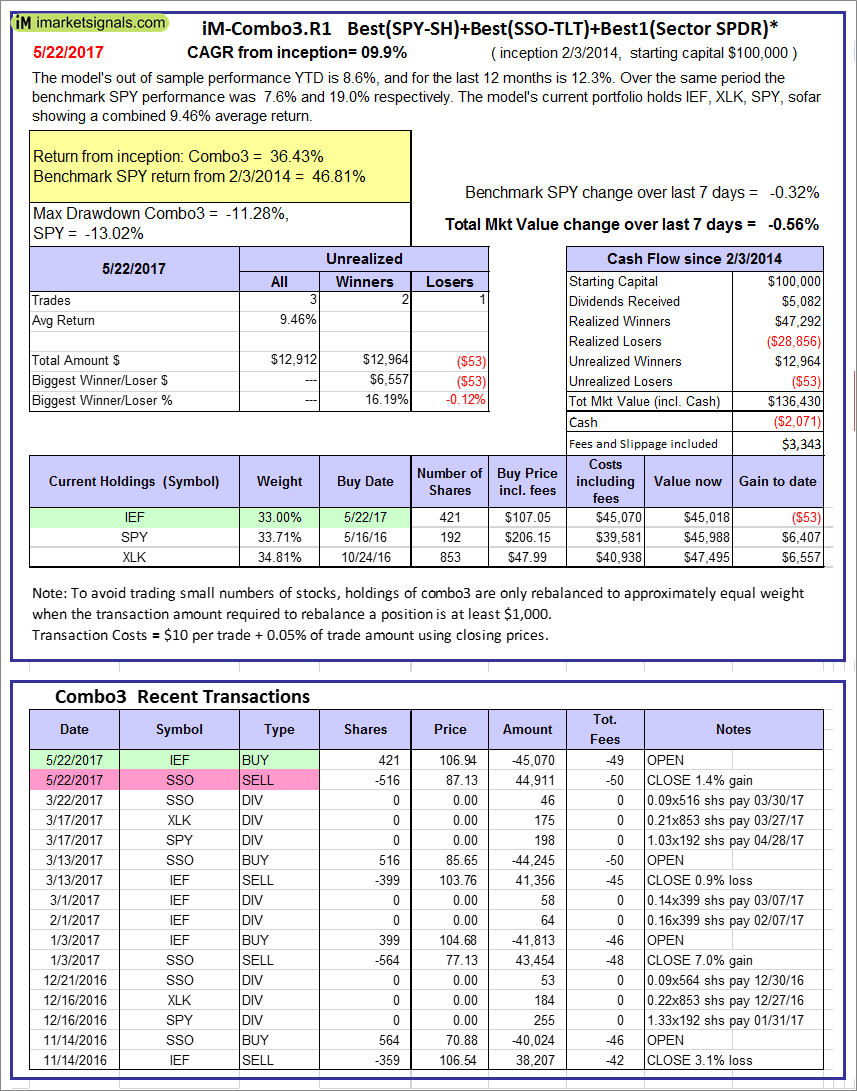 |
iM-Combo3.R1: The model’s out of sample performance YTD is 8.6%, and for the last 12 months is 12.3%. Over the same period the benchmark SPY performance was 7.6% and 19.0% respectively. Over the previous week the market value of iM-Combo3.R1 gained -0.56% at a time when SPY gained -0.32%. A starting capital of $100,000 at inception on 2/3/2014 would have grown to $136,430 which includes -$2,071 cash and excludes $3,343 spent on fees and slippage. |
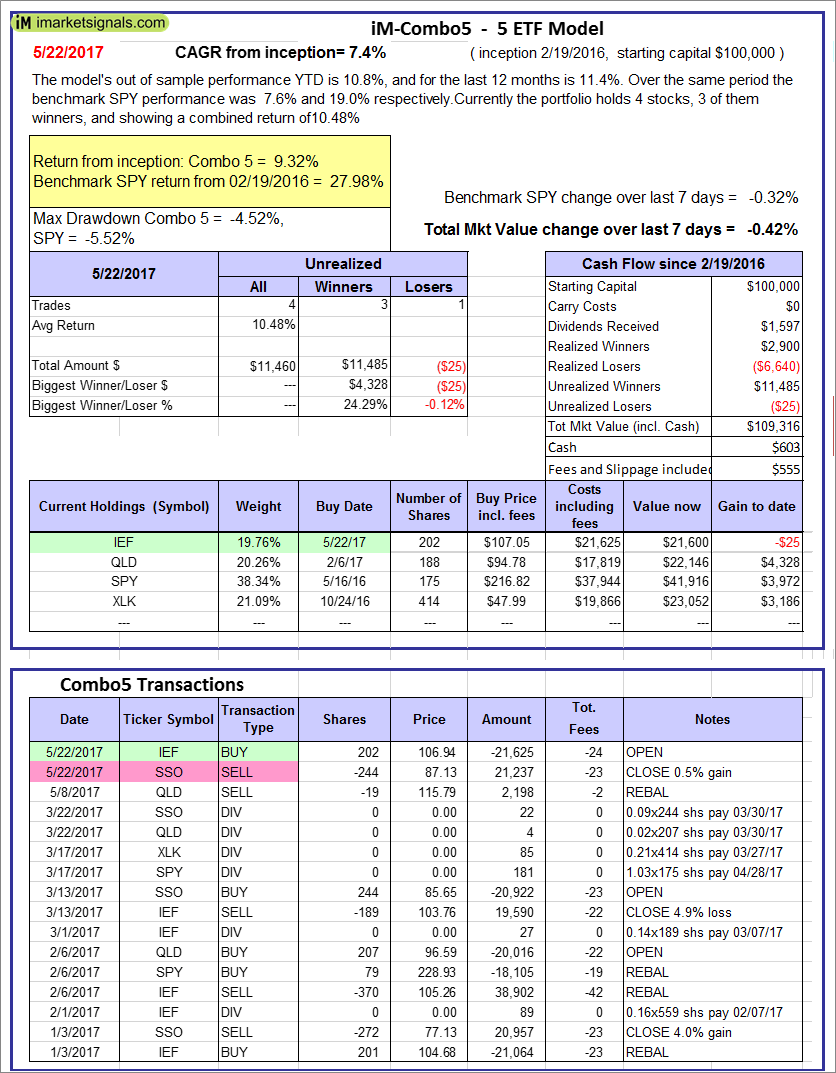 |
iM-Combo5: The model’s out of sample performance YTD is 10.8%, and for the last 12 months is 11.4%. Over the same period the benchmark SPY performance was 7.6% and 19.0% respectively. Over the previous week the market value of iM-Combo5 gained -0.42% at a time when SPY gained -0.32%. A starting capital of $100,000 at inception on 2/22/2016 would have grown to $109,316 which includes $603 cash and excludes $555 spent on fees and slippage. |
 |
The iM-Best8(S&P500 Min Vol)Tax-Efficient The model’s out of sample performance YTD is 3.5%, and for the last 12 months is -10.4%. Over the same period the benchmark SPY performance was 7.6% and 19.0% respectively. Over the previous week the market value of iM-Best8(S&P 500)Tax-Eff. gained -0.56% at a time when SPY gained -0.32%. A starting capital of $100,000 at inception on 1/2/2009 would have grown to $407,192 which includes $29,662 cash and excludes $8,323 spent on fees and slippage. |
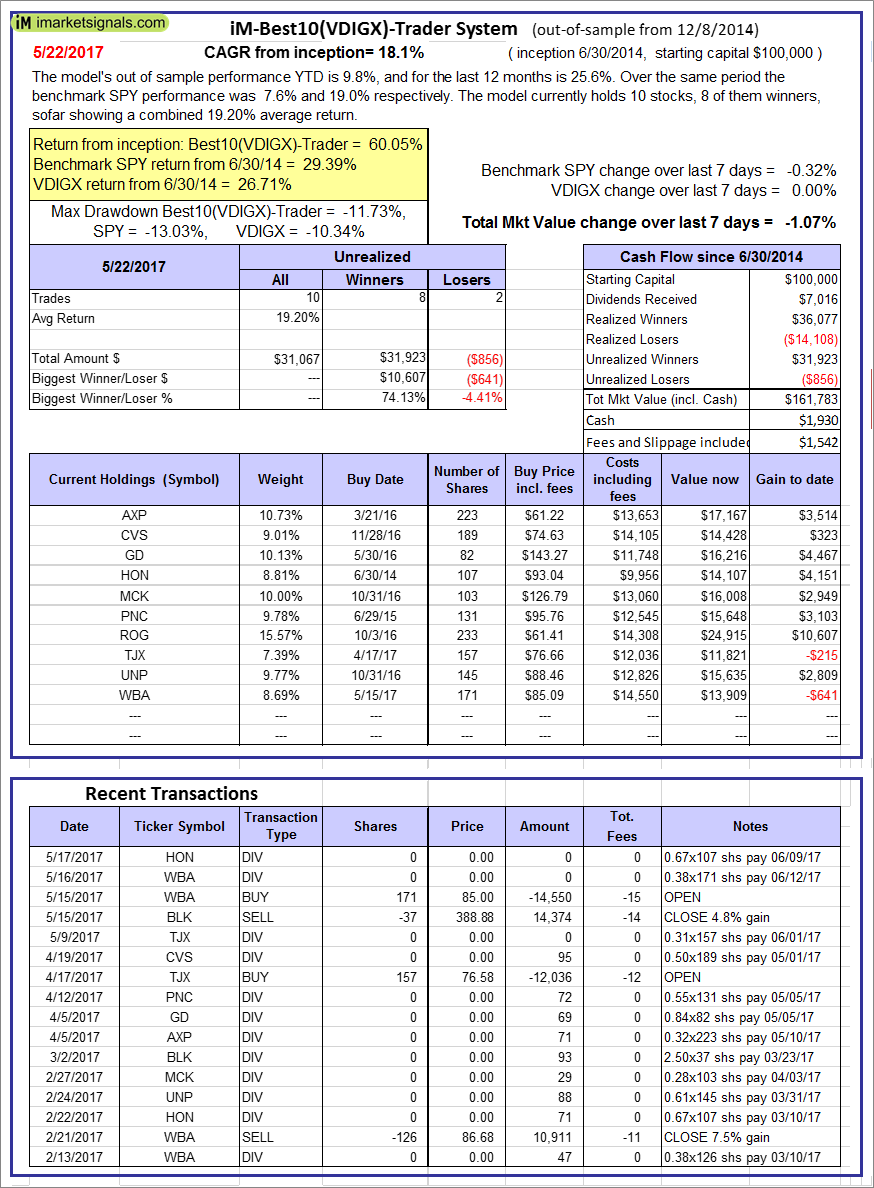  |
iM-Best10(VDIGX)-Trader: The model’s out of sample performance YTD is 9.8%, and for the last 12 months is 25.6%. Over the same period the benchmark SPY performance was 7.6% and 19.0% respectively. Since inception, on 7/1/2014, the model gained 60.05% while the benchmark SPY gained 29.39% and VDIGX gained 26.71% over the same period. Over the previous week the market value of iM-Best10(VDIGX) gained -1.07% at a time when SPY gained -0.32%. A starting capital of $100,000 at inception on 7/1/2014 would have grown to $161,783 which includes $1,930 cash and excludes $1,542 spent on fees and slippage. |
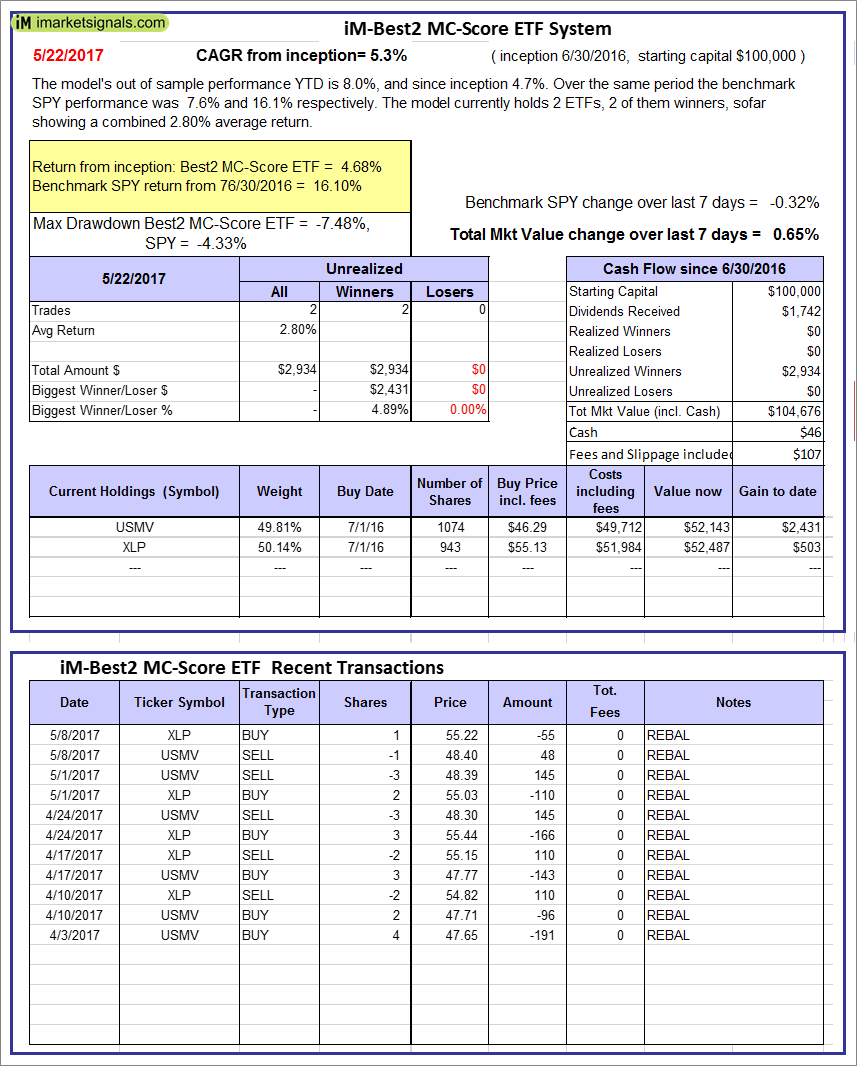 |
iM-Best2 MC-Score ETF System: The model’s out of sample performance YTD is 8.0%, and since inception 4.7%. Over the same period the benchmark SPY performance was 7.6% and 16.1% respectively. Over the previous week the market value of iM-BESTOGA-3 gained 0.65% at a time when SPY gained -0.32%. A starting capital of $100,000 at inception on 6/30/2016 would have grown to $46 which includes $107 cash and excludes Gain to date spent on fees and slippage. |
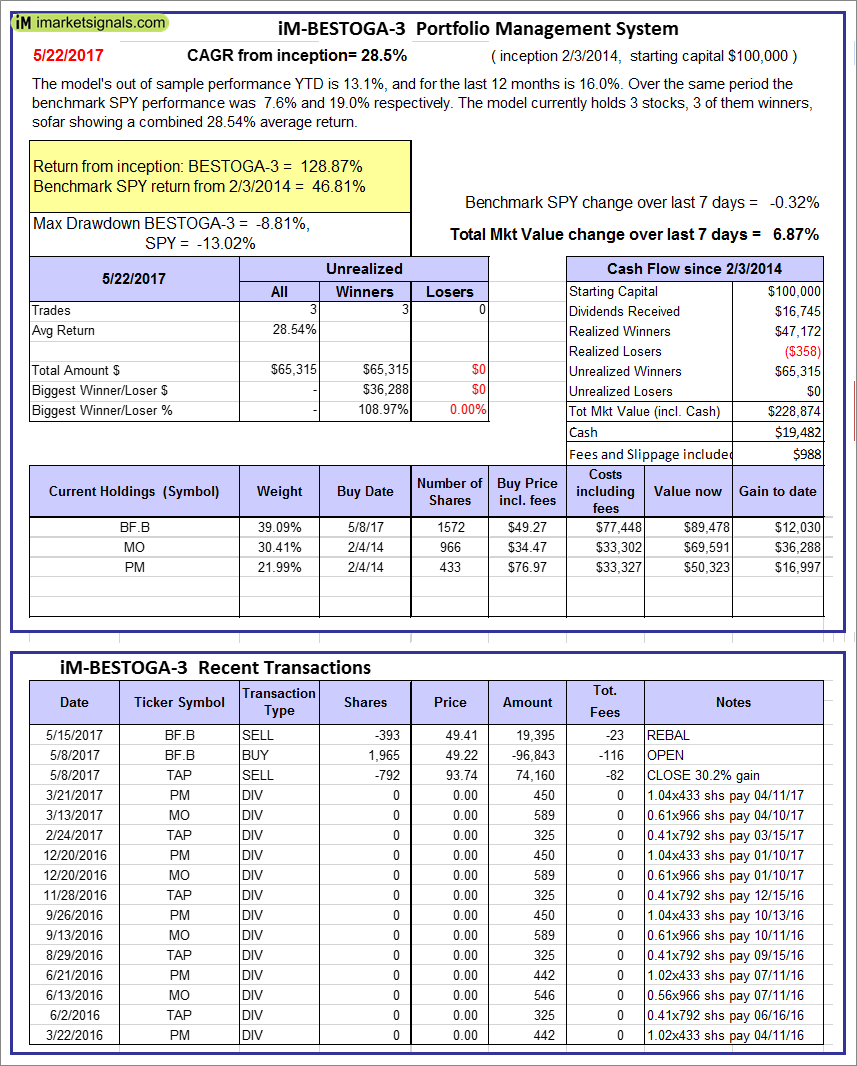 |
iM-BESTOGA-3: The model’s out of sample performance YTD is 13.1%, and for the last 12 months is 16.0%. Over the same period the benchmark SPY performance was 7.6% and 19.0% respectively. Over the previous week the market value of iM-BESTOGA-3 gained 6.87% at a time when SPY gained -0.32%. A starting capital of $100,000 at inception on 2/3/2014 would have grown to $228,874 which includes $19,482 cash and excludes $988 spent on fees and slippage. |
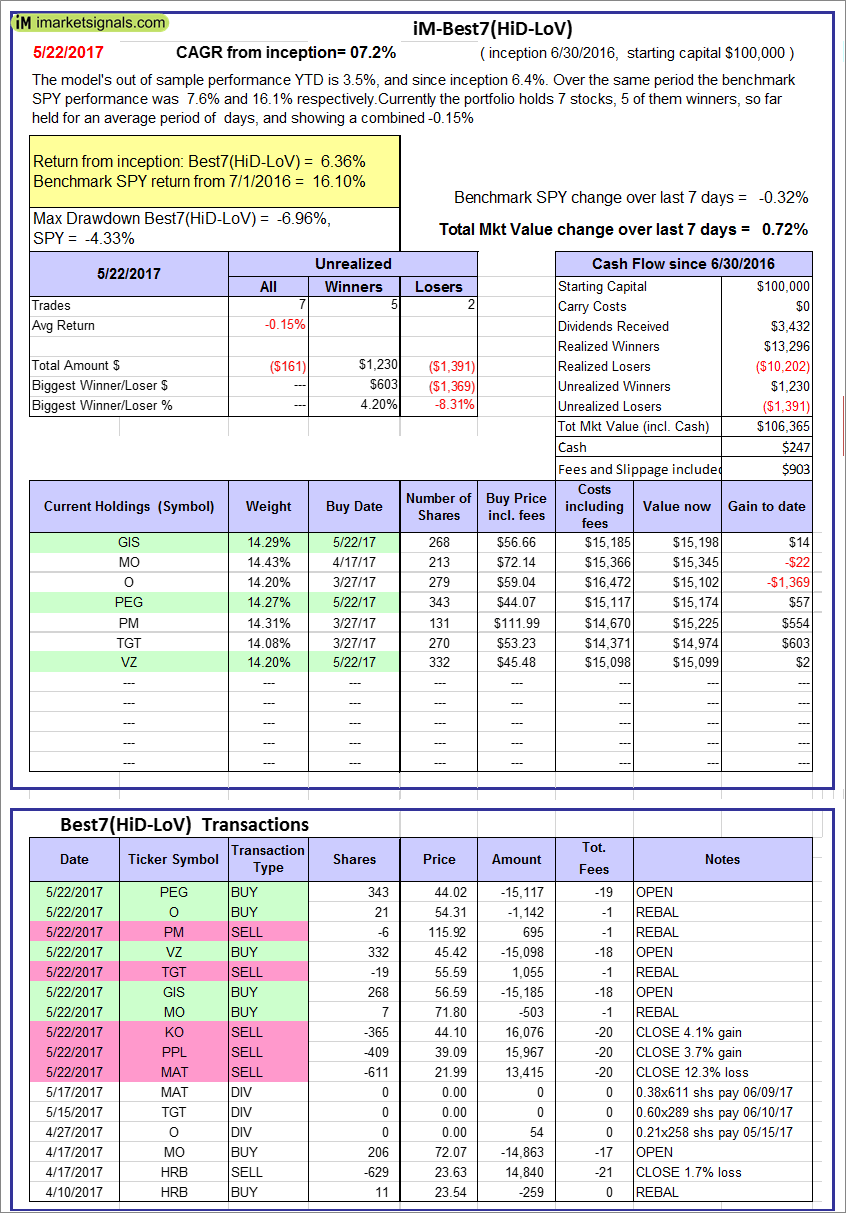 |
iM-Best7(HiD-LoV): The model’s out of sample performance YTD is 3.5%, and since inception 6.4%. Over the same period the benchmark SPY performance was 7.6% and 16.1% respectively. Over the previous week the market value of iM-BESTOGA-3 gained 0.72% at a time when SPY gained -0.32%. A starting capital of $100,000 at inception on 6/30/2016 would have grown to $106,365 which includes $247 cash and excludes $903 spent on fees and slippage. |
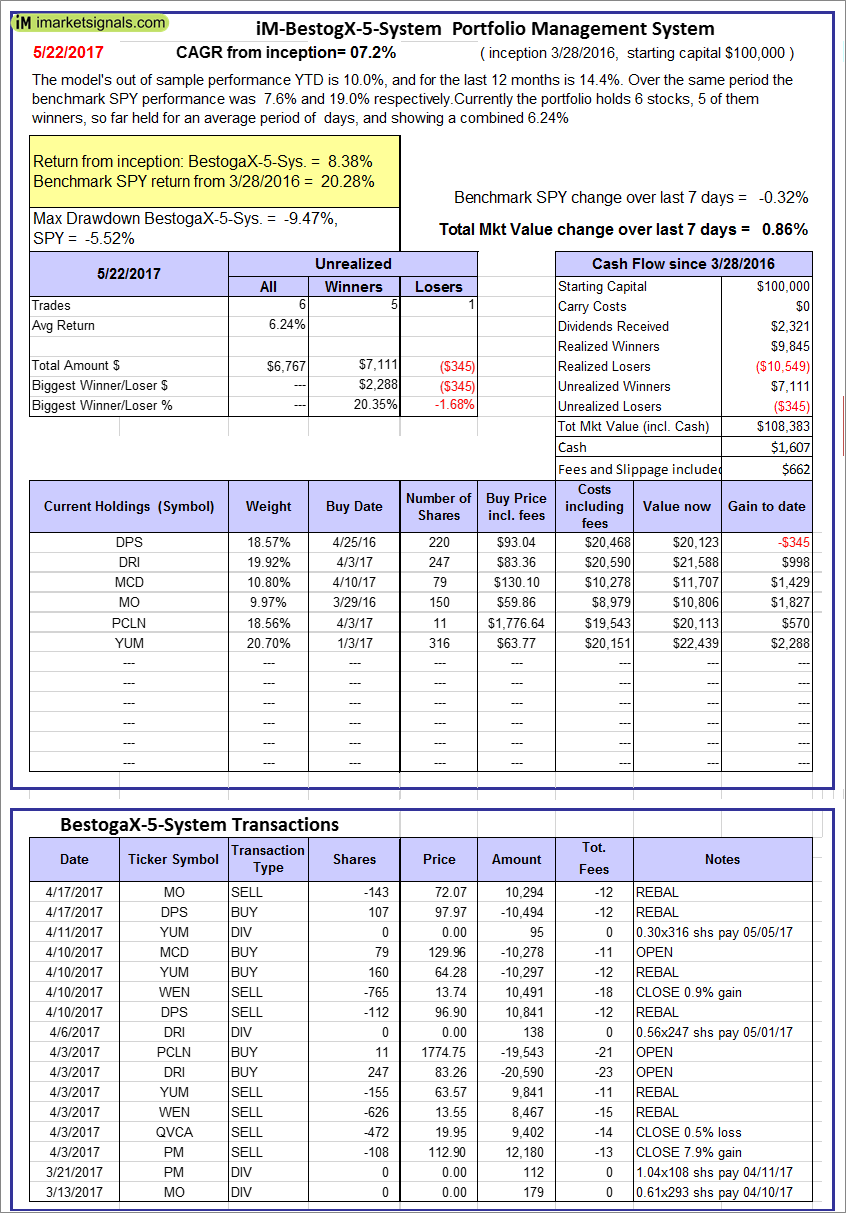 |
iM-BestogaX5-System: The model’s out of sample performance YTD is 10.0%, and for the last 12 months is 14.4%. Over the same period the benchmark SPY performance was 7.6% and 19.0% respectively. Over the previous week the market value of iM-Best8(S&P 500)Tax-Eff. gained 0.86% at a time when SPY gained -0.32%. A starting capital of $100,000 at inception on 3/28/2016 would have grown to $108,383 which includes $1,607 cash and excludes $662 spent on fees and slippage. |
 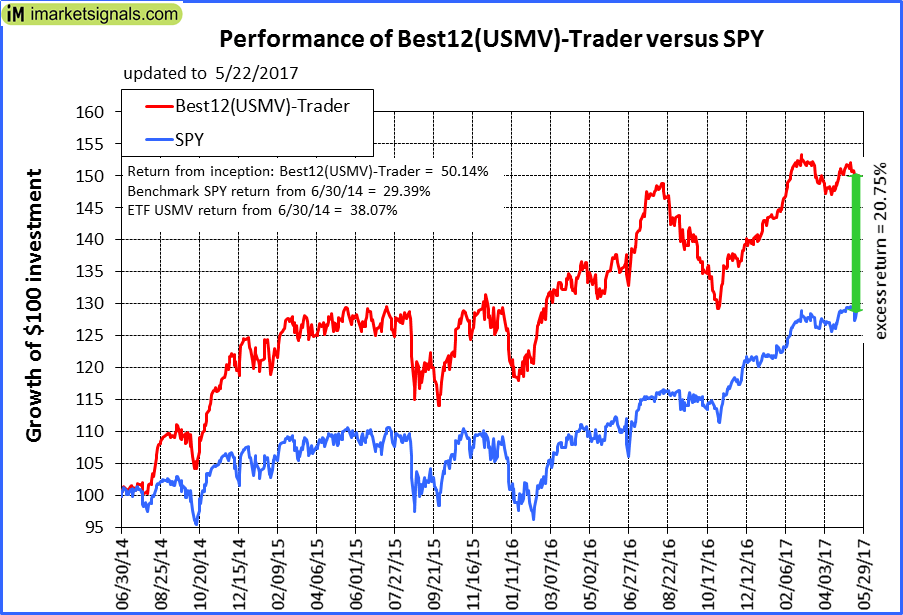 |
iM-Best12(USMV)-Trader: The model’s out of sample performance YTD is 7.4%, and for the last 12 months is 13.6%. Over the same period the benchmark SPY performance was 7.6% and 19.0% respectively. Since inception, on 7/1/2014, the model gained 50.14% while the benchmark SPY gained 29.39% and the ETF USMV gained 38.07% over the same period. Over the previous week the market value of iM-Best12(USMV)-Trader gained -0.49% at a time when SPY gained -0.32%. A starting capital of $100,000 at inception on 7/1/2014 would have grown to $150,136 which includes $117 cash and excludes $3,087 spent on fees and slippage. |
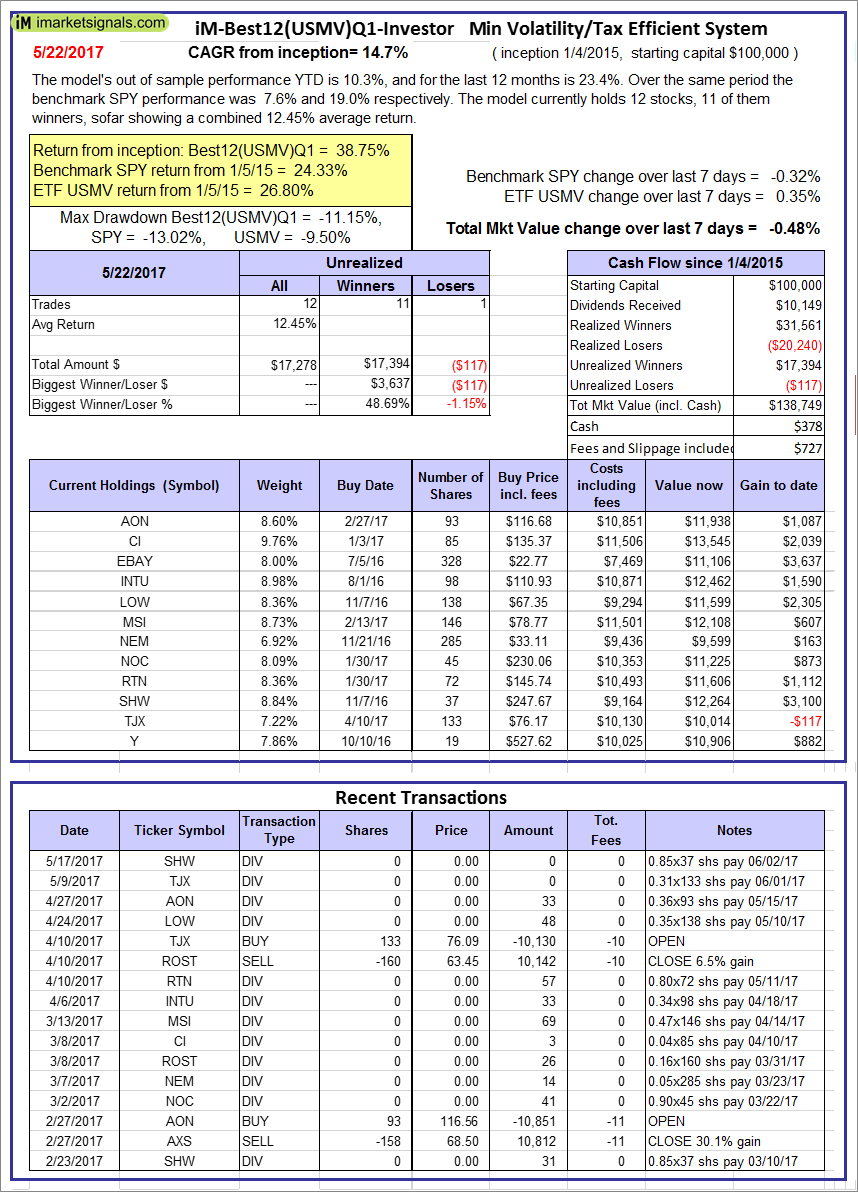 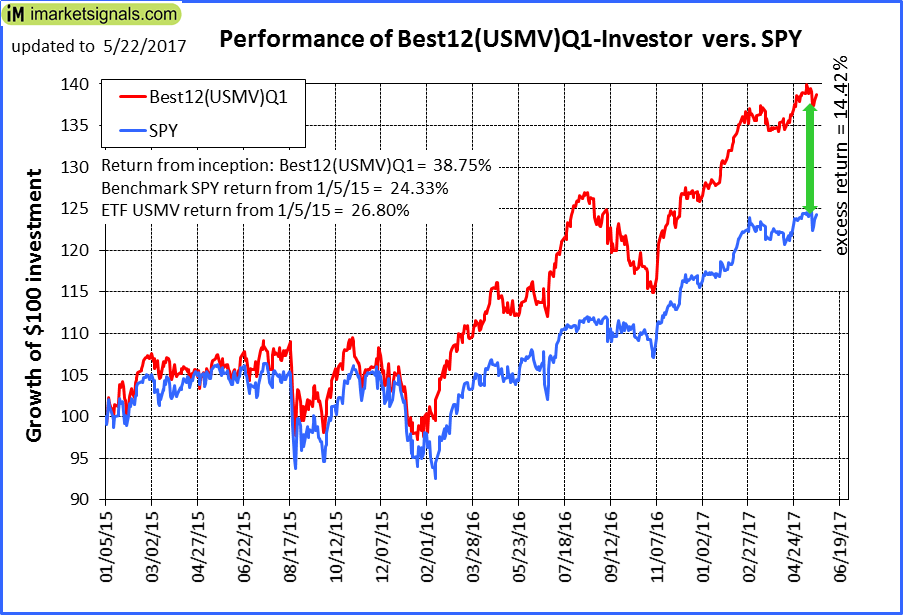 |
iM-Best12(USMV)Q1-Investor: The model’s out of sample performance YTD is 10.3%, and for the last 12 months is 23.4%. Over the same period the benchmark SPY performance was 7.6% and 19.0% respectively. Since inception, on 1/5/2015, the model gained 38.75% while the benchmark SPY gained 24.33% and the ETF USMV gained 26.80% over the same period. Over the previous week the market value of iM-Best12(USMV)Q1 gained -0.48% at a time when SPY gained -0.32%. A starting capital of $100,000 at inception on 1/5/2015 would have grown to $138,749 which includes $378 cash and excludes $727 spent on fees and slippage. |
 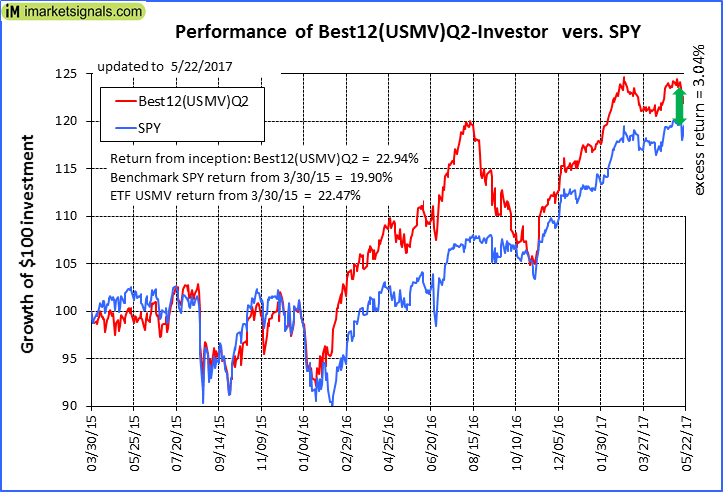 |
iM-Best12(USMV)Q2-Investor: The model’s out of sample performance YTD is 6.8%, and for the last 12 months is 14.9%. Over the same period the benchmark SPY performance was 7.6% and 19.0% respectively. Since inception, on 3/31/2015, the model gained 22.94% while the benchmark SPY gained 19.90% and the ETF USMV gained 22.47% over the same period. Over the previous week the market value of iM-Best12(USMV)Q2 gained -0.99% at a time when SPY gained -0.32%. A starting capital of $100,000 at inception on 3/31/2015 would have grown to $122,944 which includes $155 cash and excludes $642 spent on fees and slippage. |
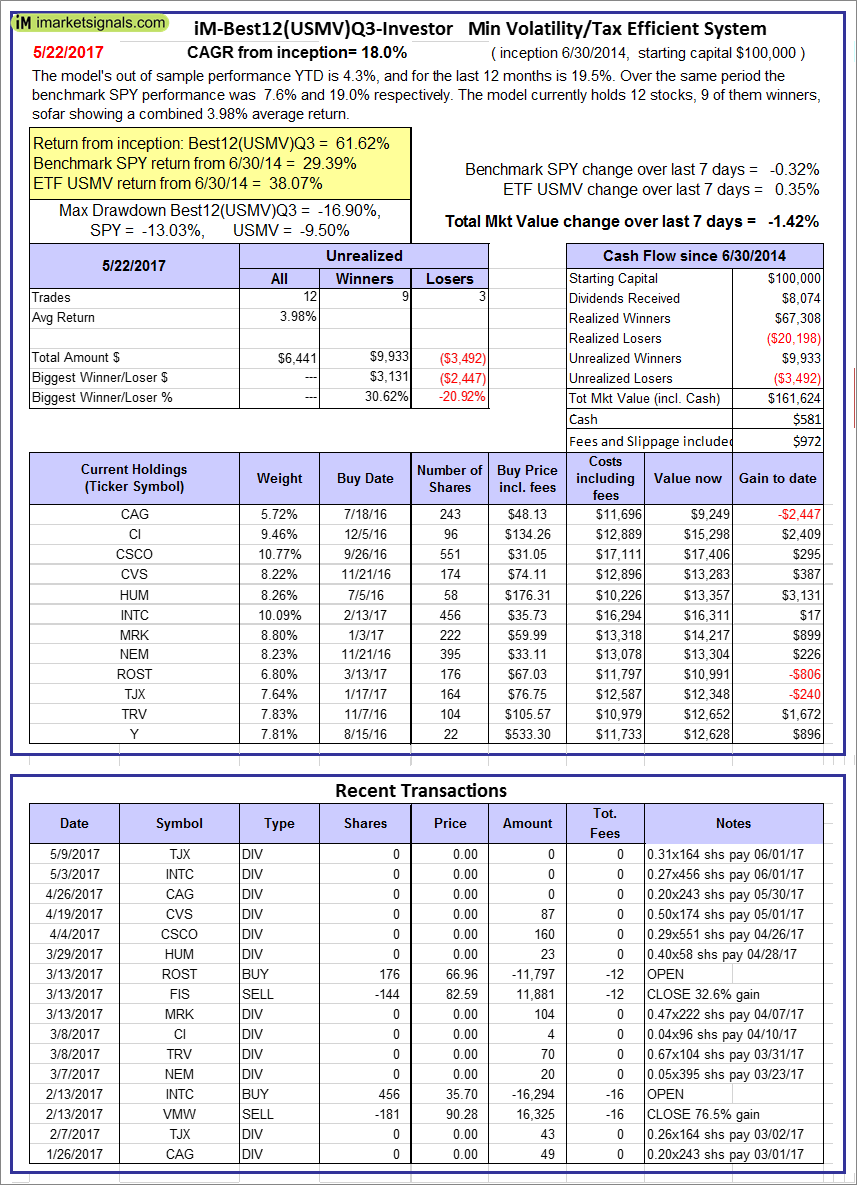  |
iM-Best12(USMV)Q3-Investor: The model’s out of sample performance YTD is 4.3%, and for the last 12 months is 19.5%. Over the same period the benchmark SPY performance was 7.6% and 19.0% respectively. Since inception, on 7/1/2014, the model gained 61.62% while the benchmark SPY gained 29.39% and the ETF USMV gained 38.07% over the same period. Over the previous week the market value of iM-Best12(USMV)Q3 gained -1.42% at a time when SPY gained -0.32%. A starting capital of $100,000 at inception on 7/1/2014 would have grown to $161,624 which includes $581 cash and excludes $972 spent on fees and slippage. |
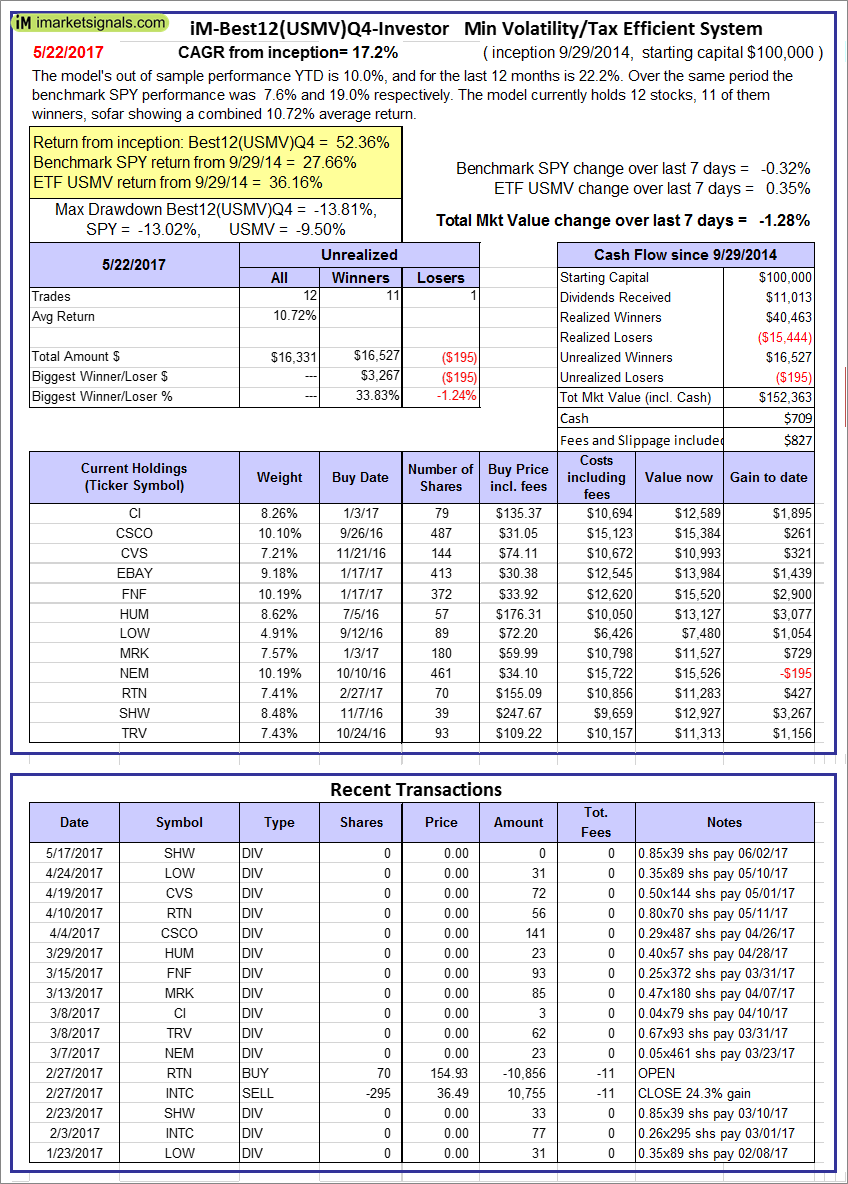 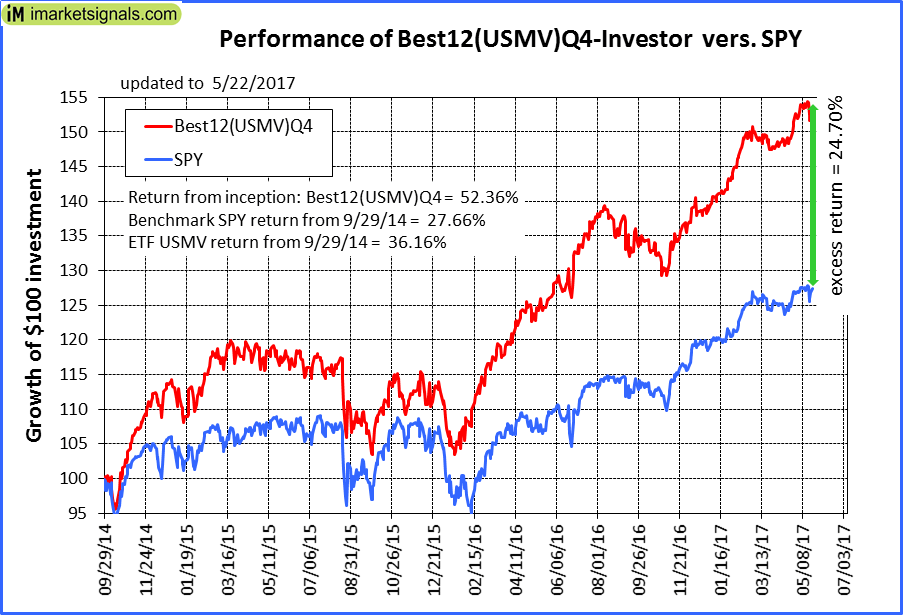 |
iM-Best12(USMV)Q4-Investor: Since inception, on 9/30/2014, the model gained 52.36% while the benchmark SPY gained 27.66% and the ETF USMV gained 36.16% over the same period. Over the previous week the market value of iM-Best12(USMV)Q4 gained -1.28% at a time when SPY gained -0.32%. A starting capital of $100,000 at inception on 9/30/2014 would have grown to $152,363 which includes $709 cash and excludes $827 spent on fees and slippage. |
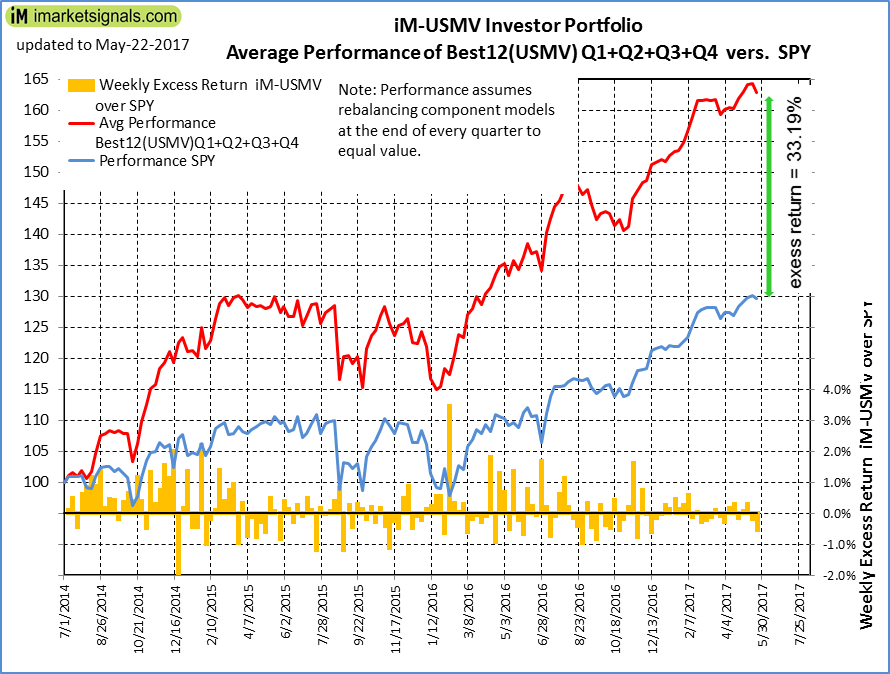 |
Average Performance of iM-Best12(USMV)Q1+Q2+Q3+Q4-Investor resulted in an excess return of 33.19% over SPY. (see iM-USMV Investor Portfolio) |
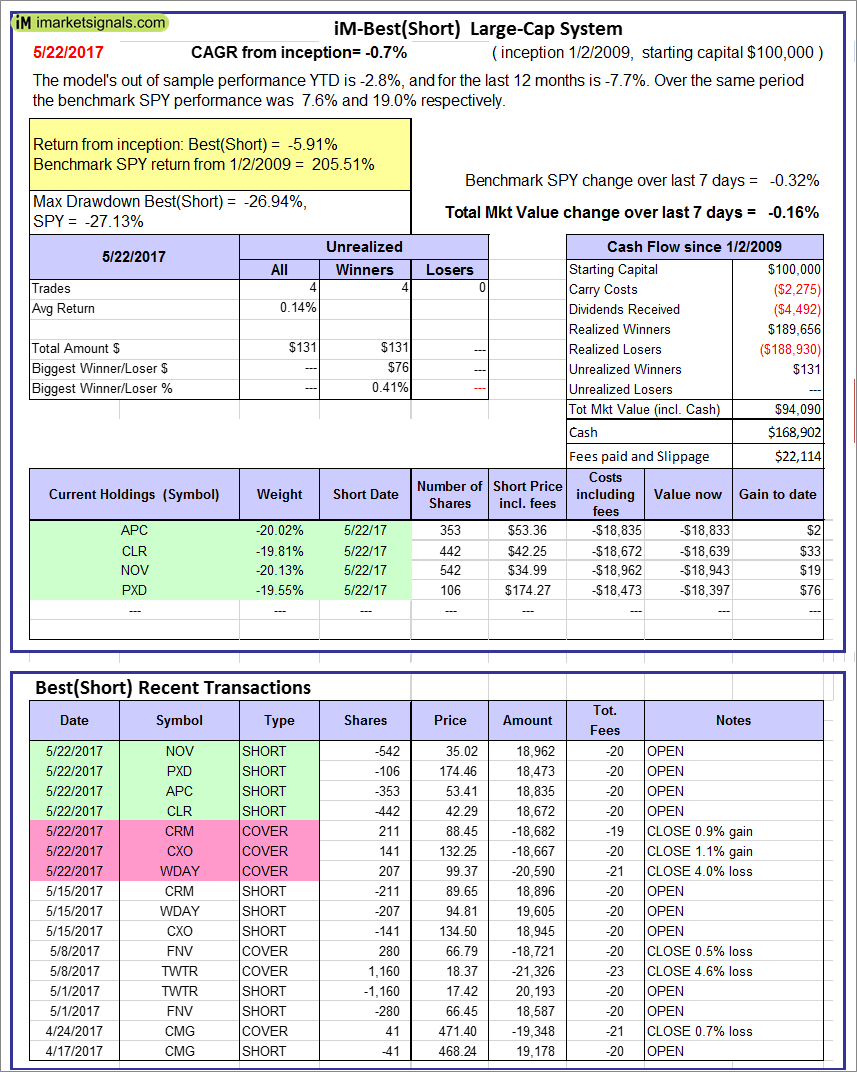 |
iM-Best(Short): The model’s out of sample performance YTD is -2.8%, and for the last 12 months is -7.7%. Over the same period the benchmark SPY performance was 7.6% and 19.0% respectively. Over the previous week the market value of iM-Best(Short) gained -0.16% at a time when SPY gained -0.32%. Over the period 1/2/2009 to 5/22/2017 the starting capital of $100,000 would have grown to $94,090 which includes $168,902 cash and excludes $22,114 spent on fees and slippage. |
iM-Best Reports – 5/22/2017
Posted in pmp SPY-SH
Leave a Reply
You must be logged in to post a comment.