
  |
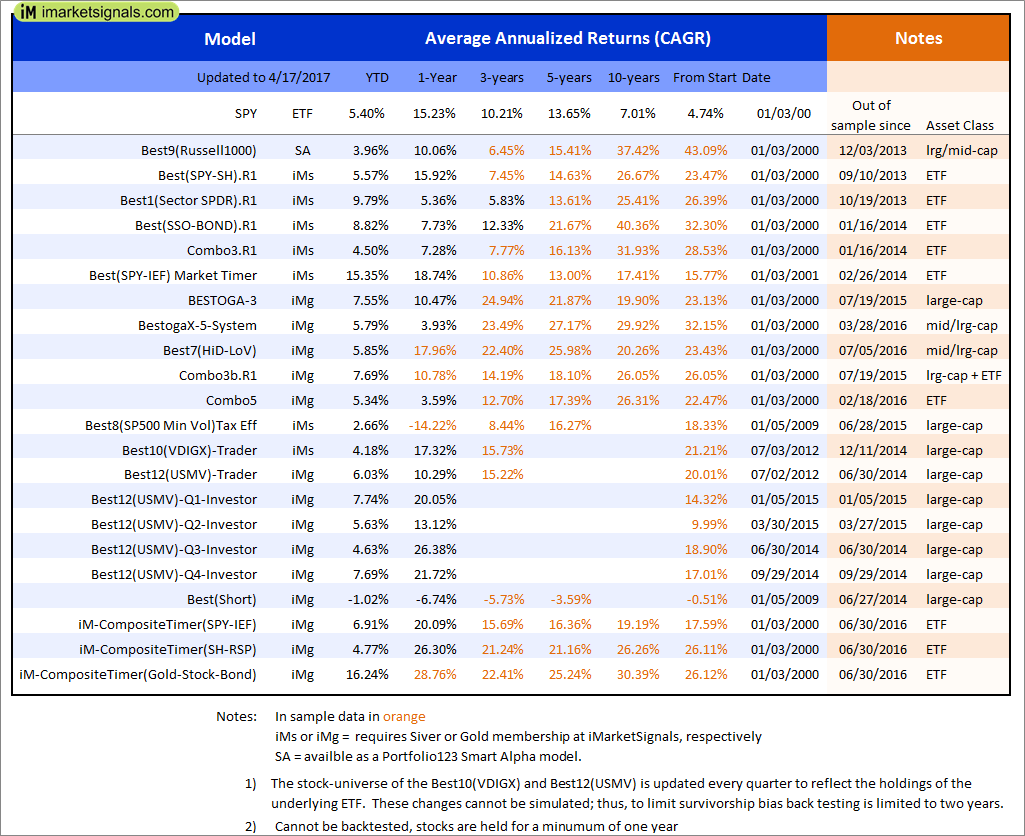
Out of sample performance summary of our models for the past 1, 2, 4 and 13 week periods. The active active return indicates how the models over- or underperformed the benchmark ETF SPY. Also the YTD, and the 1-, 3-, 5- and 10-year annualized returns are shown in the second table |
 |
iM-Best(SPY-SH).R1: The model’s out of sample performance YTD is 5.6%, and for the last 12 months is 16.0%. Over the same period the benchmark SPY performance was 5.4% and 15.2% respectively. Over the previous week the market value of Best(SPY-SH) gained -0.33% at a time when SPY gained -0.33%. A starting capital of $100,000 at inception on 1/2/2009 would have grown to $487,949 which includes $44 cash and excludes $15,358 spent on fees and slippage. |
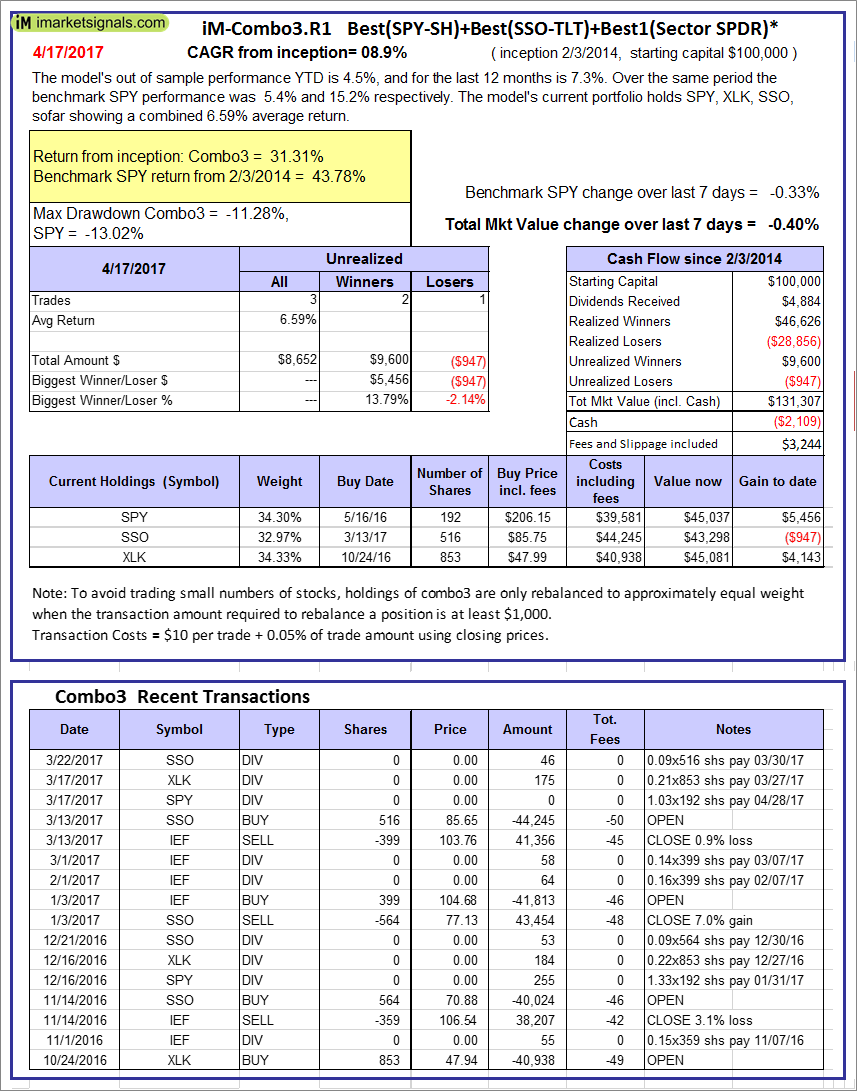 |
iM-Combo3.R1: The model’s out of sample performance YTD is 4.5%, and for the last 12 months is 7.3%. Over the same period the benchmark SPY performance was 5.4% and 15.2% respectively. Over the previous week the market value of iM-Combo3.R1 gained -0.40% at a time when SPY gained -0.33%. A starting capital of $100,000 at inception on 2/3/2014 would have grown to $131,307 which includes -$2,109 cash and excludes $3,244 spent on fees and slippage. |
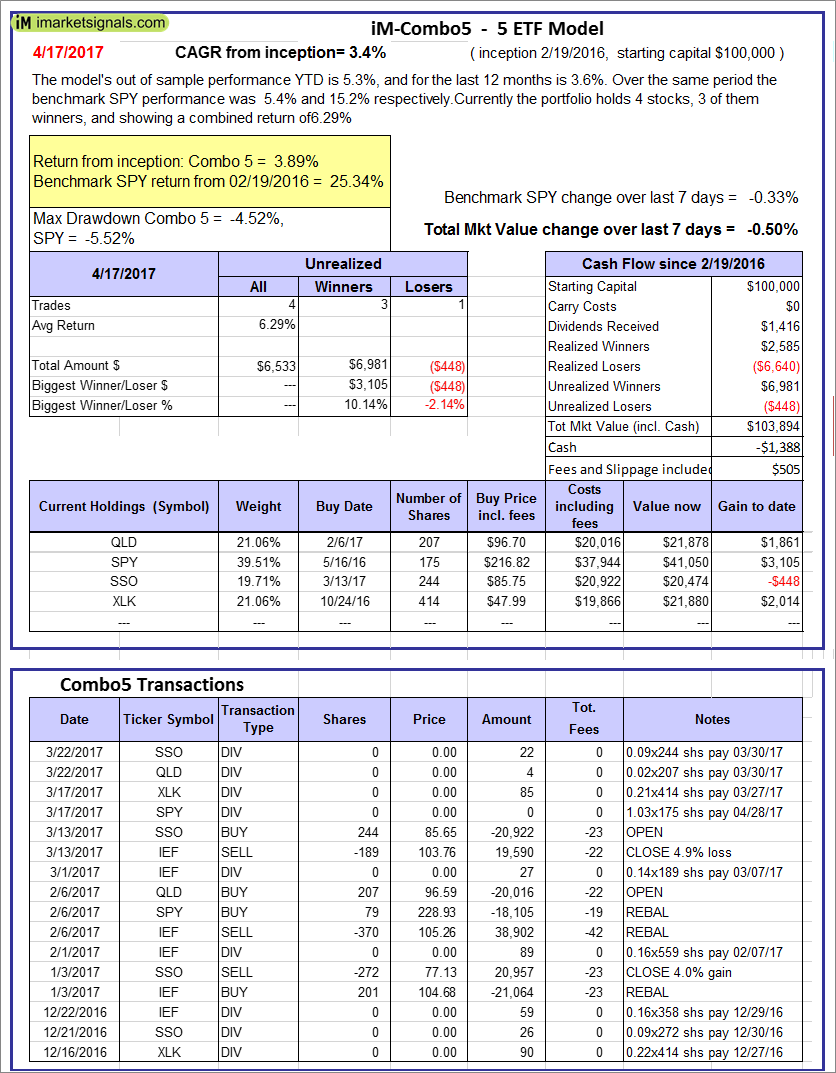 |
iM-Combo5: The model’s out of sample performance YTD is 5.3%, and for the last 12 months is 3.6%. Over the same period the benchmark SPY performance was 5.4% and 15.2% respectively. Over the previous week the market value of iM-Combo5 gained -0.50% at a time when SPY gained -0.33%. A starting capital of $100,000 at inception on 2/22/2016 would have grown to $103,894 which includes -$1,388 cash and excludes $505 spent on fees and slippage. |
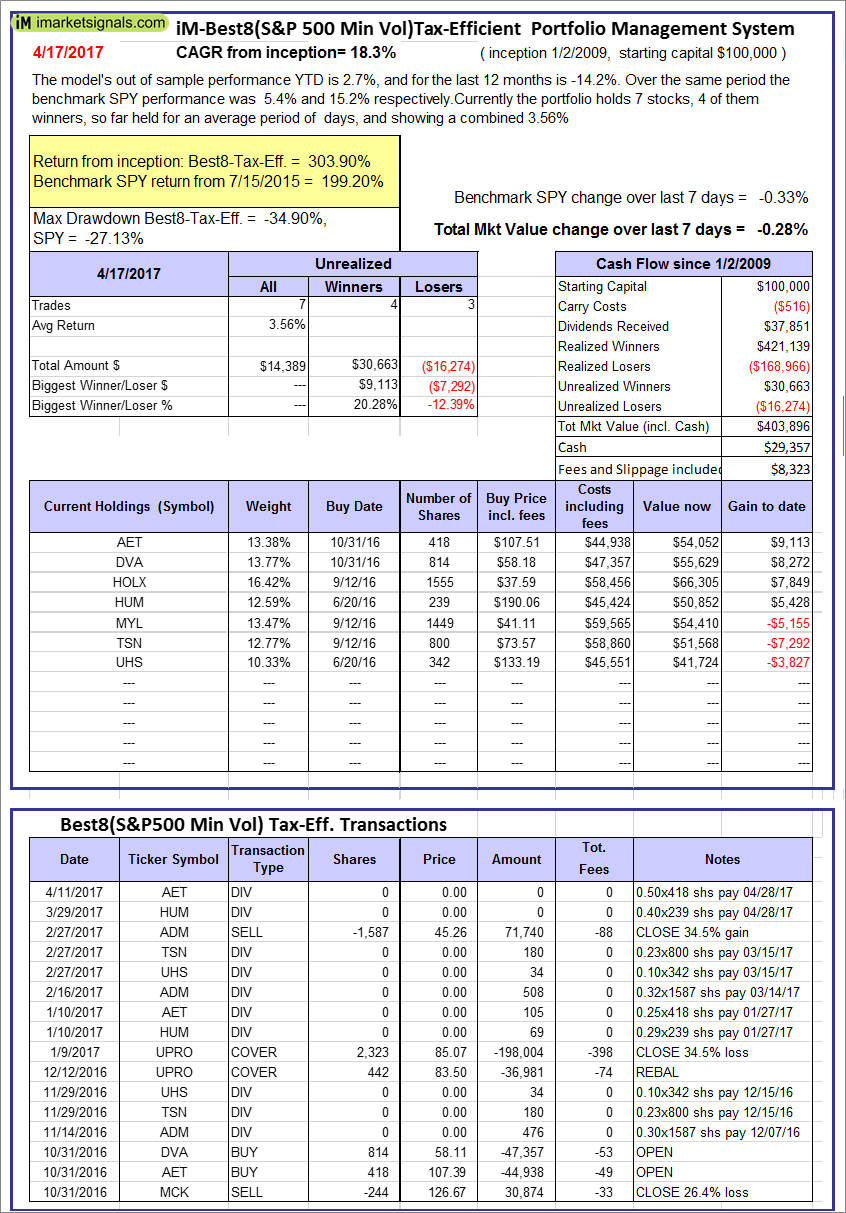 |
The iM-Best8(S&P500 Min Vol)Tax-Efficient The model’s out of sample performance YTD is 2.7%, and for the last 12 months is -14.2%. Over the same period the benchmark SPY performance was 5.4% and 15.2% respectively. Over the previous week the market value of iM-Best8(S&P 500)Tax-Eff. gained -0.28% at a time when SPY gained -0.33%. A starting capital of $100,000 at inception on 1/2/2009 would have grown to $403,896 which includes $29,357 cash and excludes $8,323 spent on fees and slippage. |
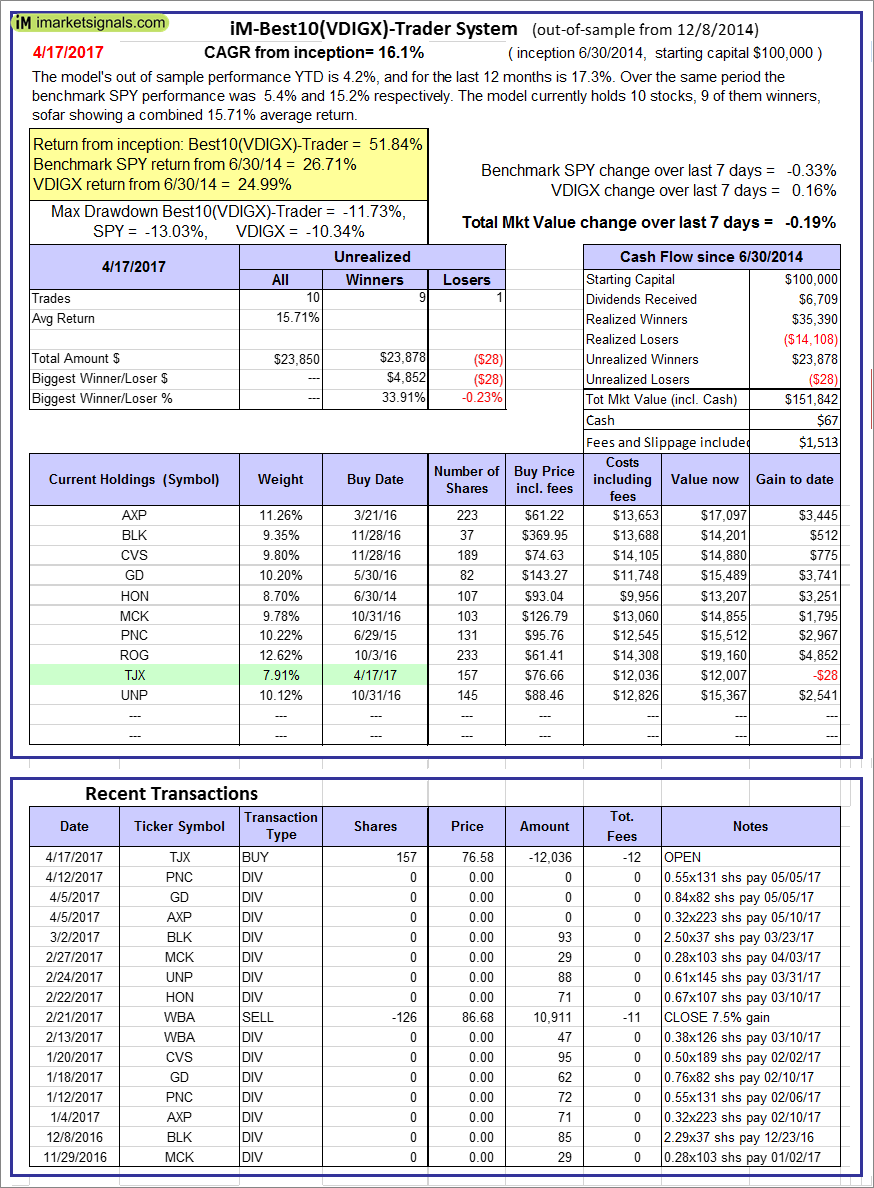 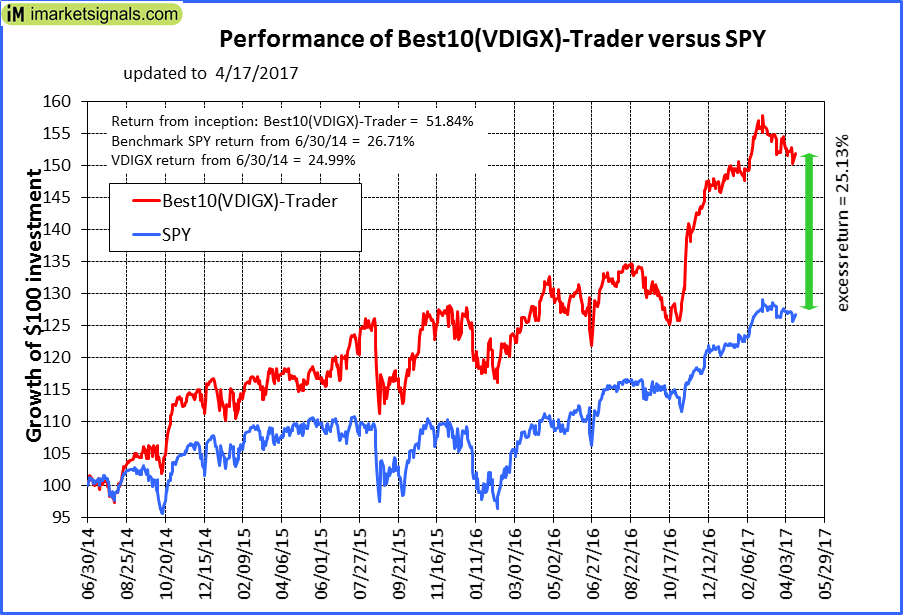 |
iM-Best10(VDIGX)-Trader: The model’s out of sample performance YTD is 4.2%, and for the last 12 months is 17.3%. Over the same period the benchmark SPY performance was 5.4% and 15.2% respectively. Since inception, on 7/1/2014, the model gained 51.84% while the benchmark SPY gained 26.71% and VDIGX gained 24.99% over the same period. Over the previous week the market value of iM-Best10(VDIGX) gained -0.19% at a time when SPY gained -0.33%. A starting capital of $100,000 at inception on 7/1/2014 would have grown to $151,842 which includes $67 cash and excludes $1,513 spent on fees and slippage. |
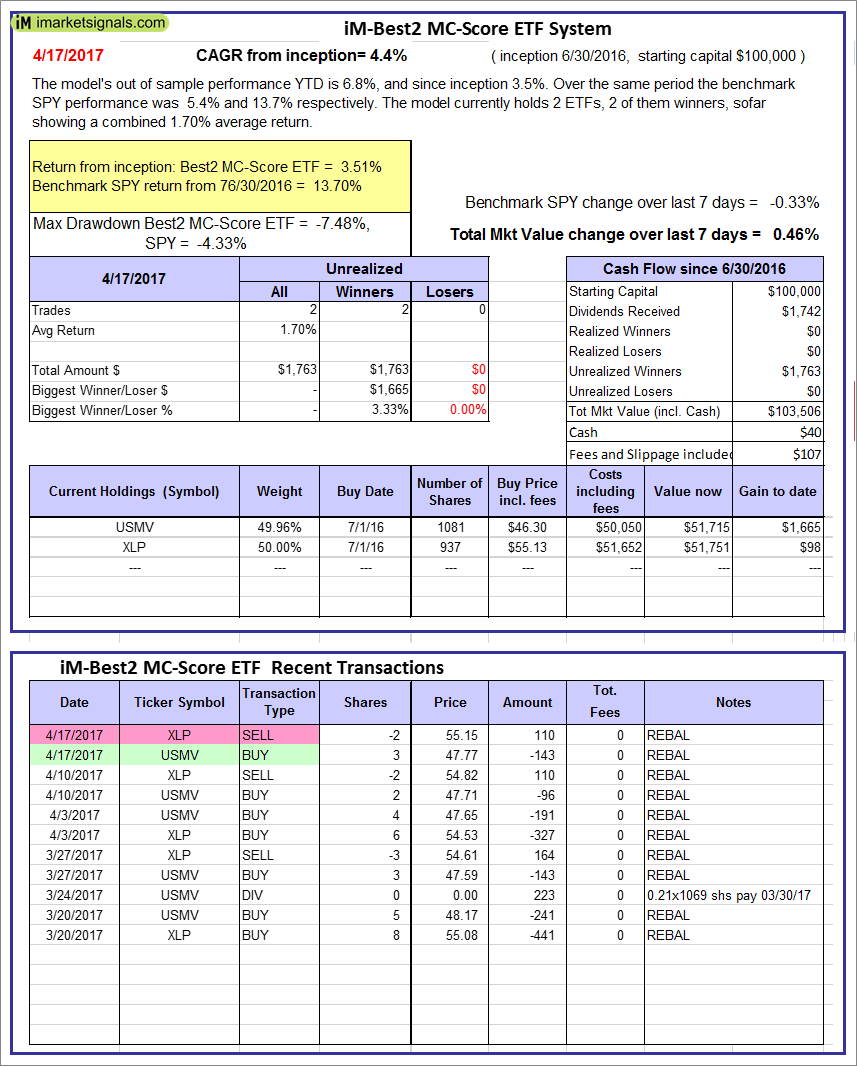 |
iM-Best2 MC-Score ETF System: The model’s out of sample performance YTD is 6.8%, and since inception 3.5%. Over the same period the benchmark SPY performance was 5.4% and 13.7% respectively. Over the previous week the market value of iM-BESTOGA-3 gained 0.46% at a time when SPY gained -0.33%. A starting capital of $100,000 at inception on 6/30/2016 would have grown to $40 which includes $107 cash and excludes Gain to date spent on fees and slippage. |
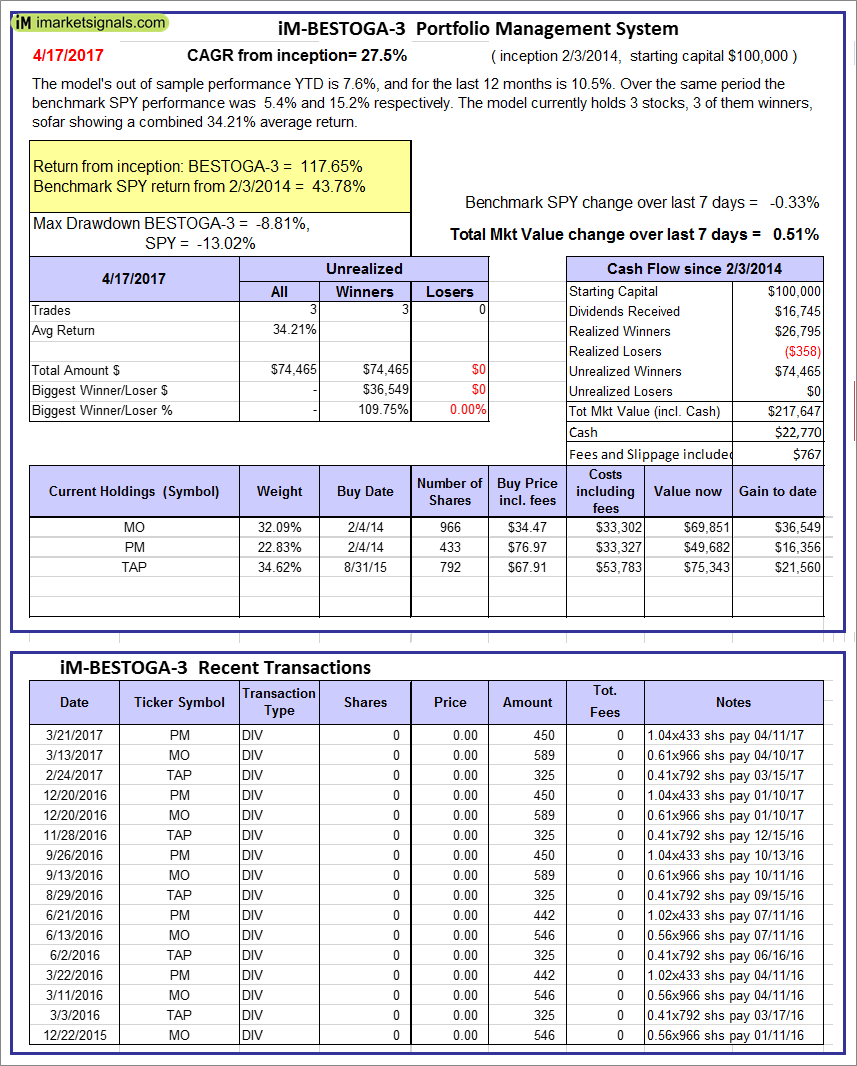 |
iM-BESTOGA-3: The model’s out of sample performance YTD is 7.6%, and for the last 12 months is 10.5%. Over the same period the benchmark SPY performance was 5.4% and 15.2% respectively. Over the previous week the market value of iM-BESTOGA-3 gained 0.51% at a time when SPY gained -0.33%. A starting capital of $100,000 at inception on 2/3/2014 would have grown to $217,647 which includes $22,770 cash and excludes $767 spent on fees and slippage. |
 |
iM-Best7(HiD-LoV): The model’s out of sample performance YTD is 5.8%, and since inception 8.8%. Over the same period the benchmark SPY performance was 5.4% and 13.7% respectively. Over the previous week the market value of iM-BESTOGA-3 gained 0.83% at a time when SPY gained -0.33%. A starting capital of $100,000 at inception on 6/30/2016 would have grown to $108,761 which includes $30 cash and excludes $785 spent on fees and slippage. |
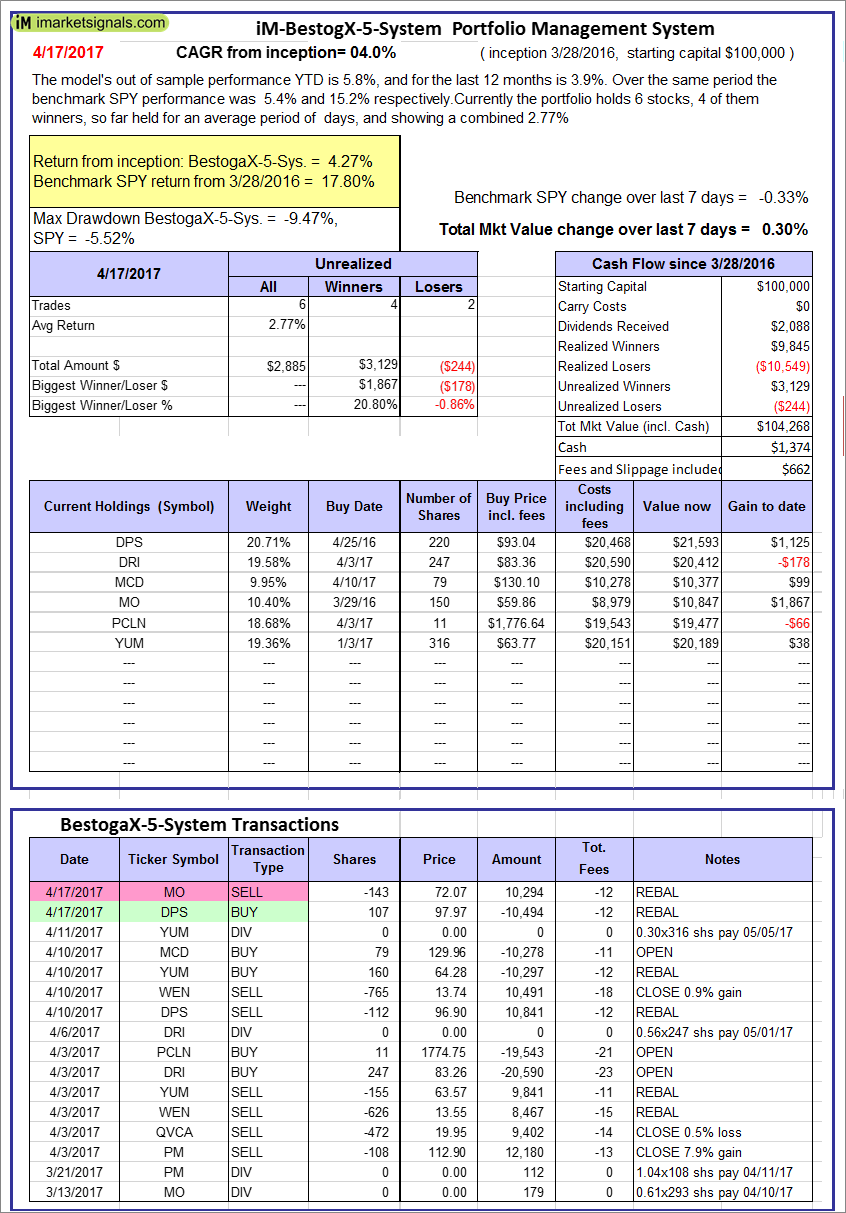 |
iM-BestogaX5-System: The model’s out of sample performance YTD is 5.8%, and for the last 12 months is 3.9%. Over the same period the benchmark SPY performance was 5.4% and 15.2% respectively. Over the previous week the market value of iM-Best8(S&P 500)Tax-Eff. gained 0.30% at a time when SPY gained -0.33%. A starting capital of $100,000 at inception on 3/28/2016 would have grown to $104,268 which includes $1,374 cash and excludes $662 spent on fees and slippage. |
 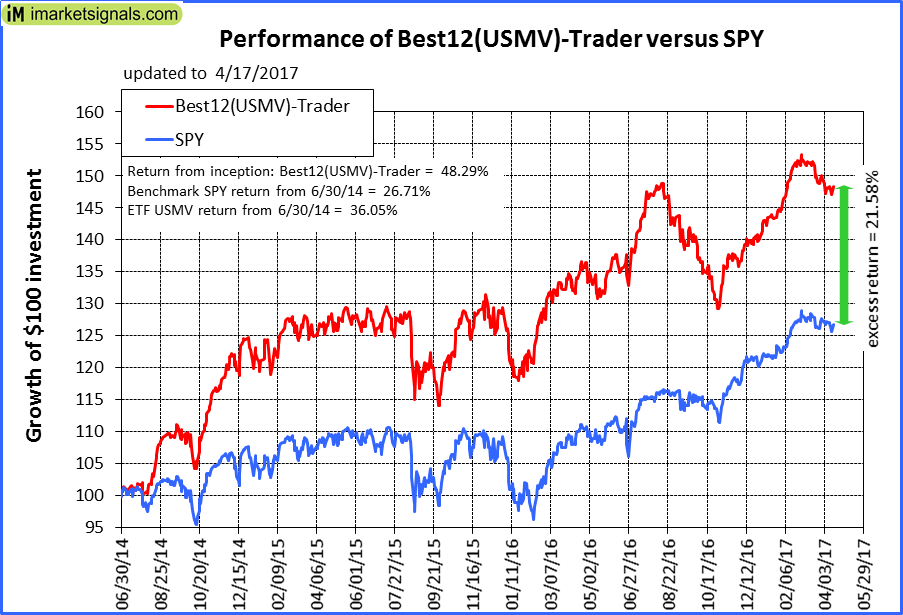 |
iM-Best12(USMV)-Trader: The model’s out of sample performance YTD is 6.0%, and for the last 12 months is 10.3%. Over the same period the benchmark SPY performance was 5.4% and 15.2% respectively. Since inception, on 7/1/2014, the model gained 48.29% while the benchmark SPY gained 26.71% and the ETF USMV gained 36.05% over the same period. Over the previous week the market value of iM-Best12(USMV)-Trader gained 0.13% at a time when SPY gained -0.33%. A starting capital of $100,000 at inception on 7/1/2014 would have grown to $148,289 which includes $248 cash and excludes $2,937 spent on fees and slippage. |
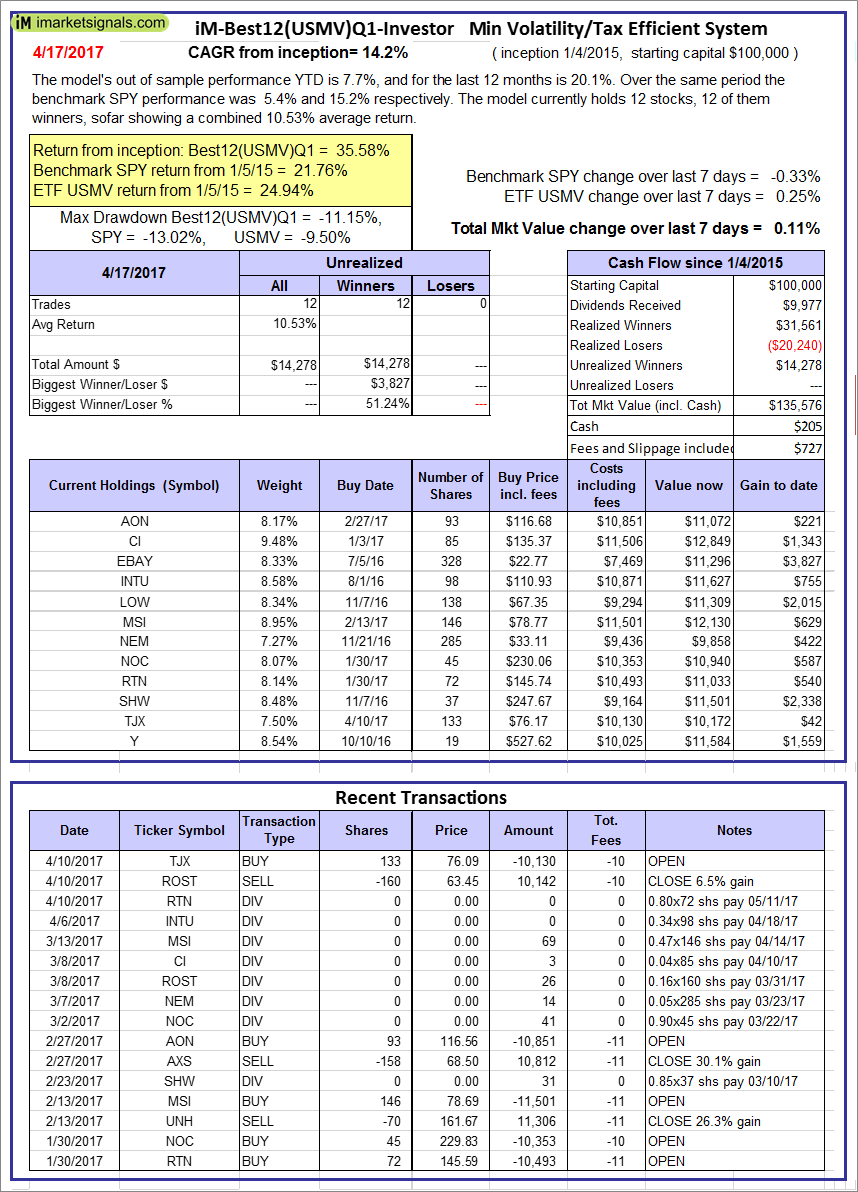 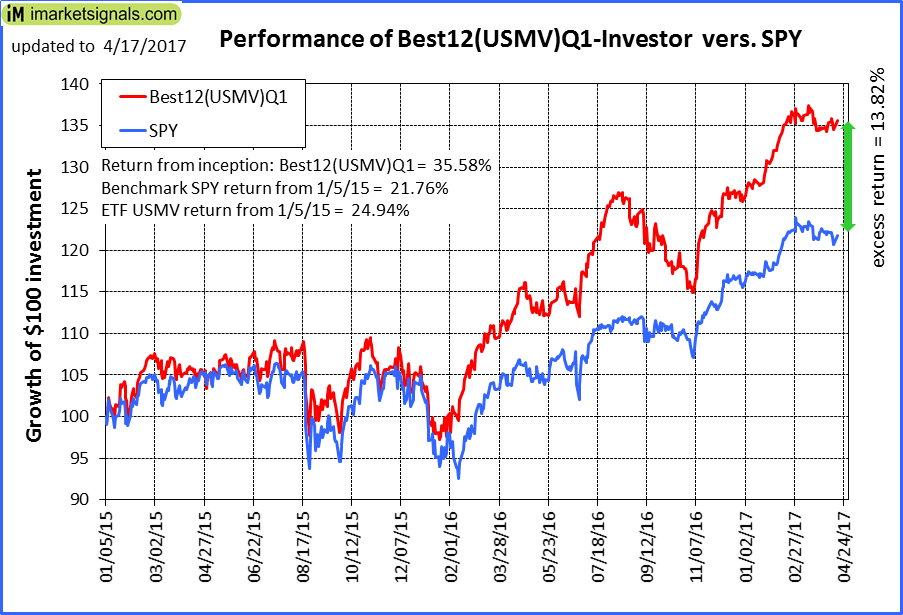 |
iM-Best12(USMV)Q1-Investor: The model’s out of sample performance YTD is 7.7%, and for the last 12 months is 20.1%. Over the same period the benchmark SPY performance was 5.4% and 15.2% respectively. Since inception, on 1/5/2015, the model gained 35.58% while the benchmark SPY gained 21.76% and the ETF USMV gained 24.94% over the same period. Over the previous week the market value of iM-Best12(USMV)Q1 gained 0.11% at a time when SPY gained -0.33%. A starting capital of $100,000 at inception on 1/5/2015 would have grown to $135,576 which includes $205 cash and excludes $727 spent on fees and slippage. |
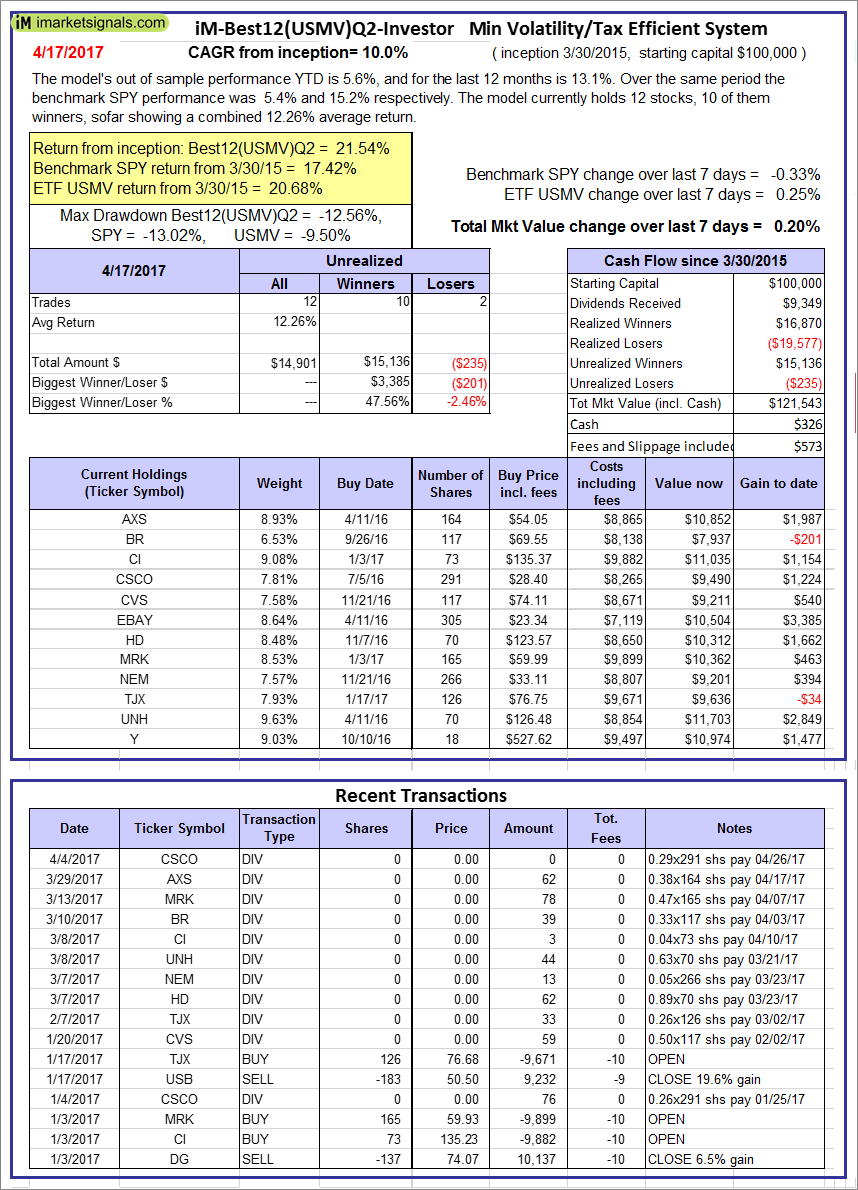 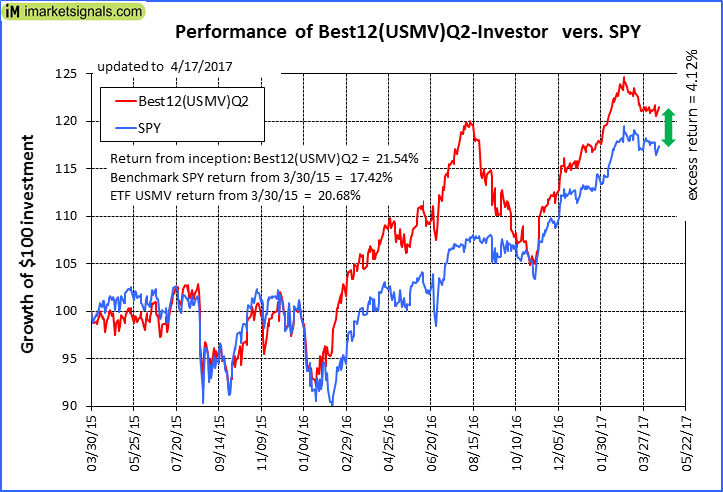 |
iM-Best12(USMV)Q2-Investor: The model’s out of sample performance YTD is 5.6%, and for the last 12 months is 13.1%. Over the same period the benchmark SPY performance was 5.4% and 15.2% respectively. Since inception, on 3/31/2015, the model gained 21.54% while the benchmark SPY gained 17.42% and the ETF USMV gained 20.68% over the same period. Over the previous week the market value of iM-Best12(USMV)Q2 gained 0.20% at a time when SPY gained -0.33%. A starting capital of $100,000 at inception on 3/31/2015 would have grown to $121,543 which includes $326 cash and excludes $573 spent on fees and slippage. |
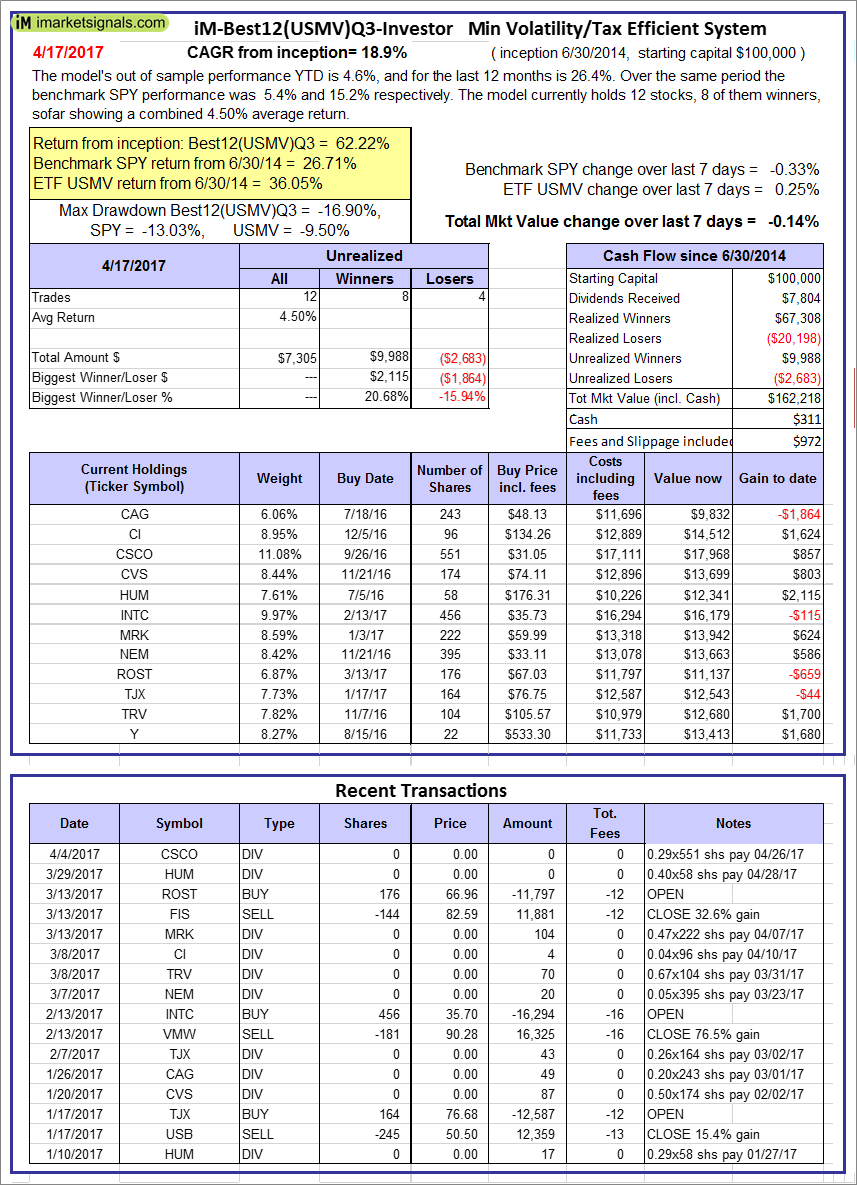 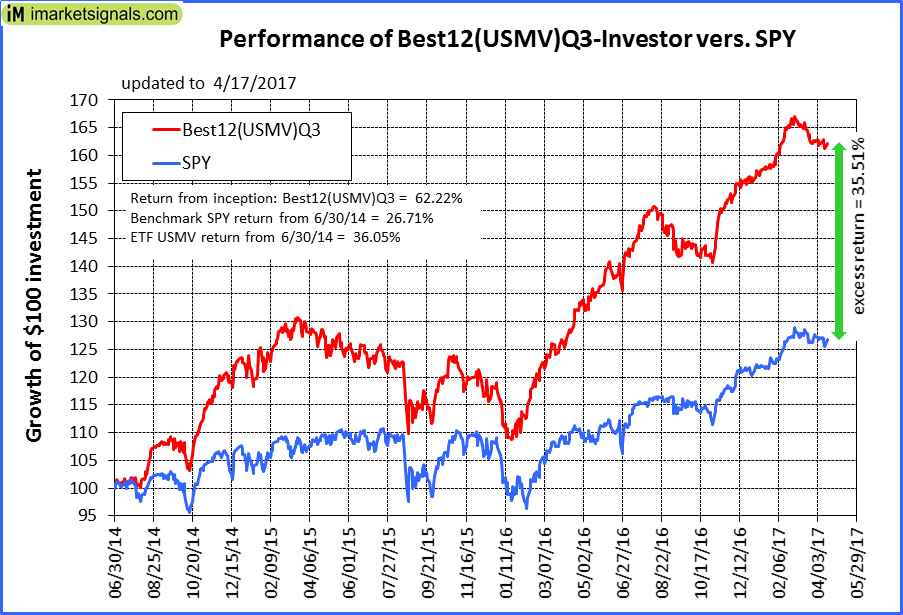 |
iM-Best12(USMV)Q3-Investor: The model’s out of sample performance YTD is 4.6%, and for the last 12 months is 26.4%. Over the same period the benchmark SPY performance was 5.4% and 15.2% respectively. Since inception, on 7/1/2014, the model gained 62.22% while the benchmark SPY gained 26.71% and the ETF USMV gained 36.05% over the same period. Over the previous week the market value of iM-Best12(USMV)Q3 gained -0.14% at a time when SPY gained -0.33%. A starting capital of $100,000 at inception on 7/1/2014 would have grown to $162,218 which includes $311 cash and excludes $972 spent on fees and slippage. |
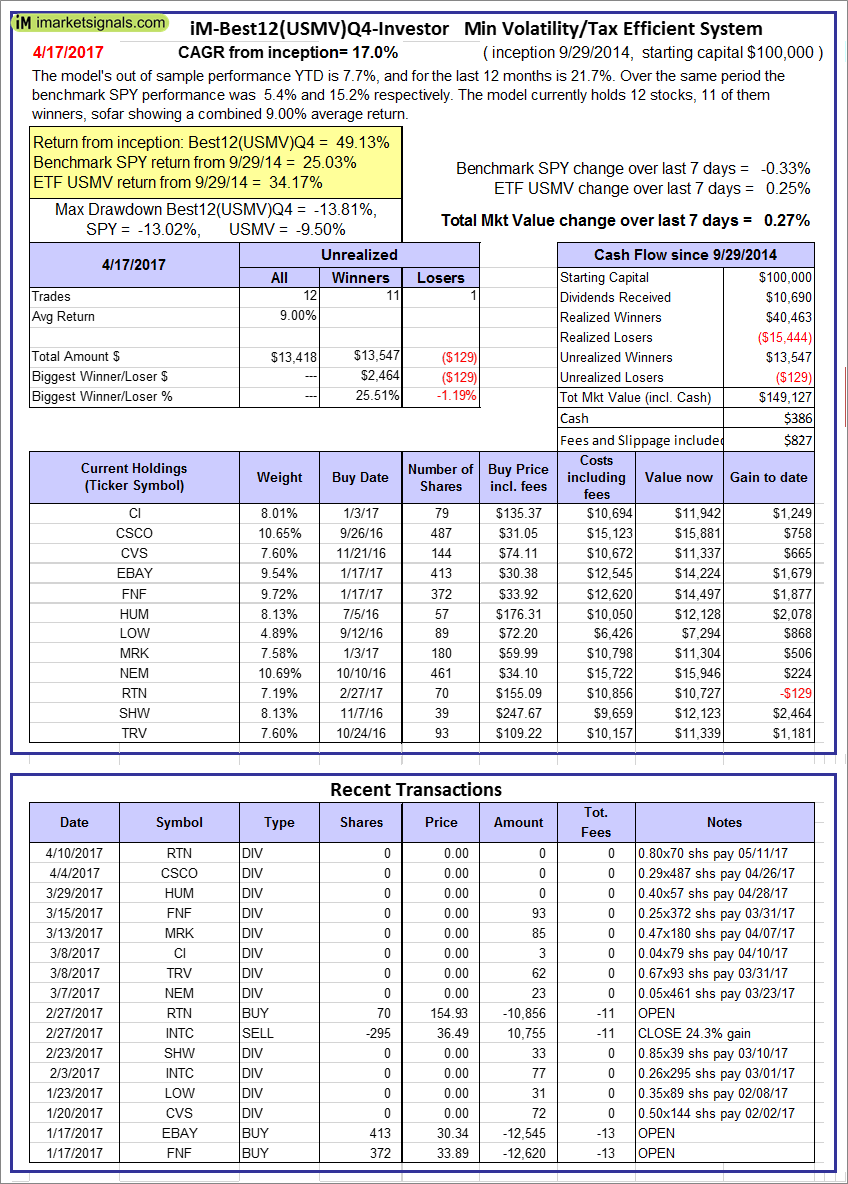 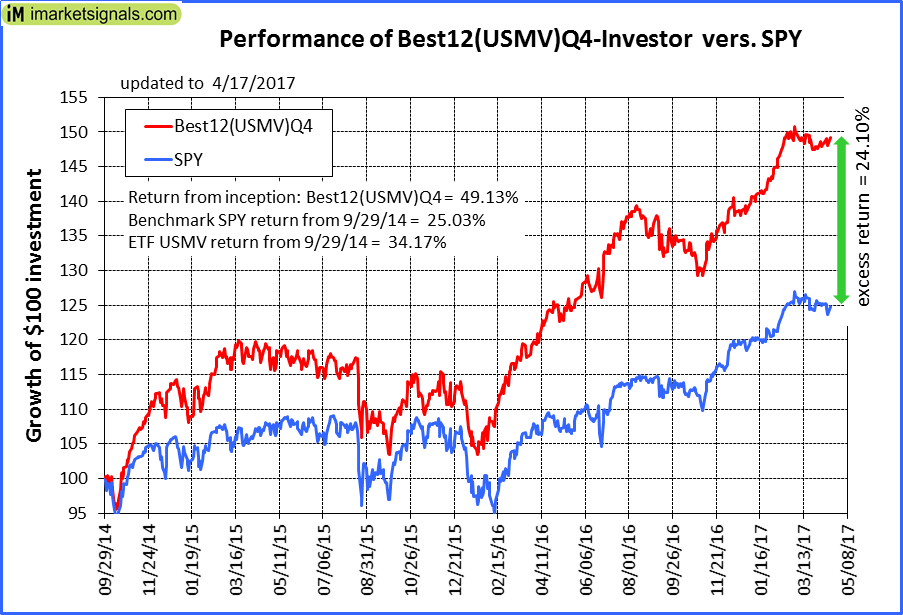 |
iM-Best12(USMV)Q4-Investor: Since inception, on 9/30/2014, the model gained 49.13% while the benchmark SPY gained 25.03% and the ETF USMV gained 34.17% over the same period. Over the previous week the market value of iM-Best12(USMV)Q4 gained 0.27% at a time when SPY gained -0.33%. A starting capital of $100,000 at inception on 9/30/2014 would have grown to $149,127 which includes $386 cash and excludes $827 spent on fees and slippage. |
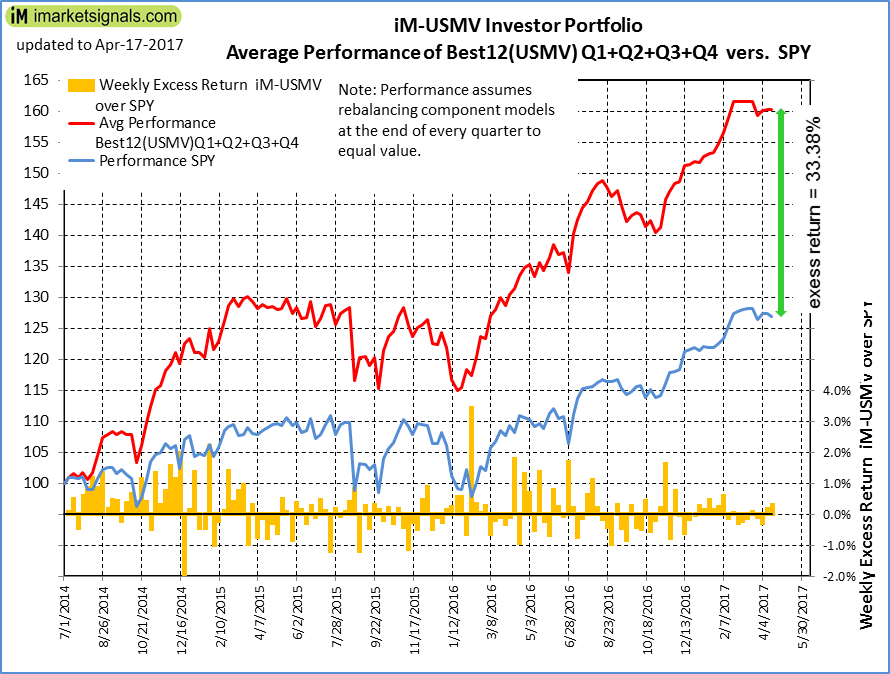 |
Average Performance of iM-Best12(USMV)Q1+Q2+Q3+Q4-Investor resulted in an excess return of 33.38% over SPY. (see iM-USMV Investor Portfolio) |
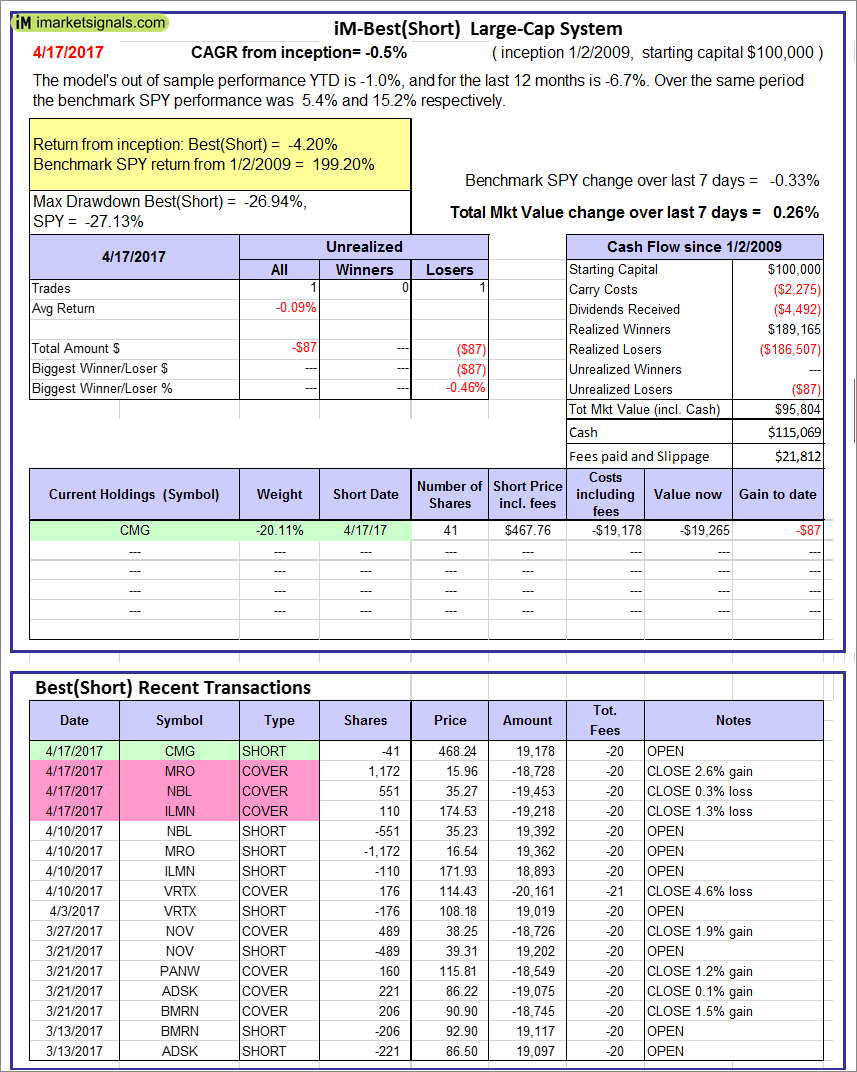 |
iM-Best(Short): The model’s out of sample performance YTD is -1.0%, and for the last 12 months is -6.7%. Over the same period the benchmark SPY performance was 5.4% and 15.2% respectively. Over the previous week the market value of iM-Best(Short) gained 0.26% at a time when SPY gained -0.33%. Over the period 1/2/2009 to 4/17/2017 the starting capital of $100,000 would have grown to $95,804 which includes $115,069 cash and excludes $21,812 spent on fees and slippage. |
iM-Best Reports – 4/17/2017
Posted in pmp SPY-SH
Leave a Reply
You must be logged in to post a comment.