
  |
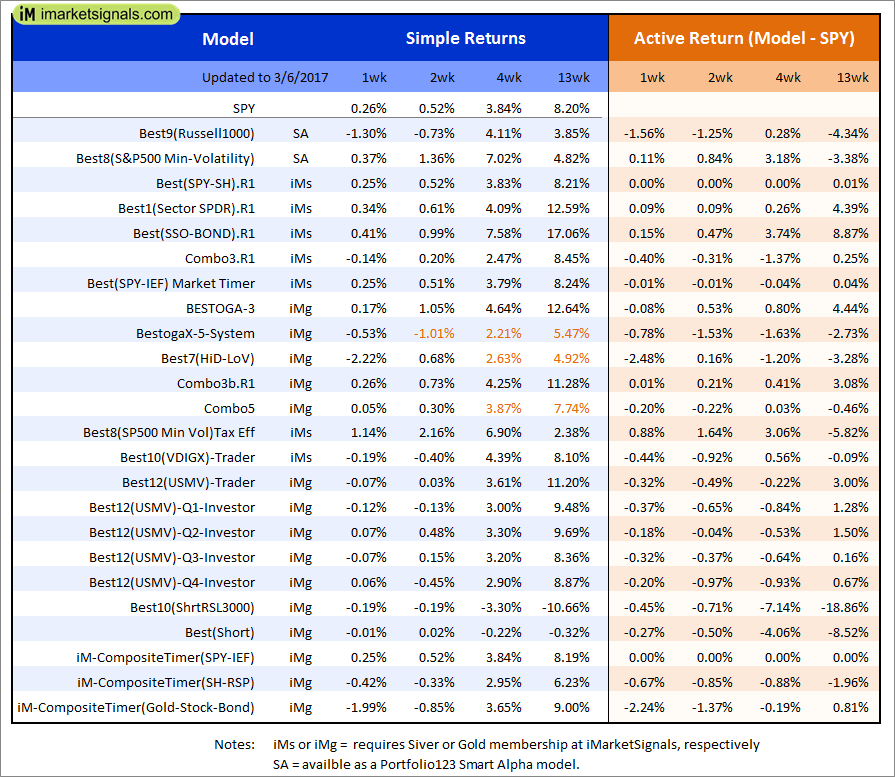
Out of sample performance summary of our models for the past 1, 2, 4 and 13 week periods. The active active return indicates how the models over- or underperformed the benchmark ETF SPY. Also the YTD, and the 1-, 3-, 5- and 10-year annualized returns are shown in the second table |
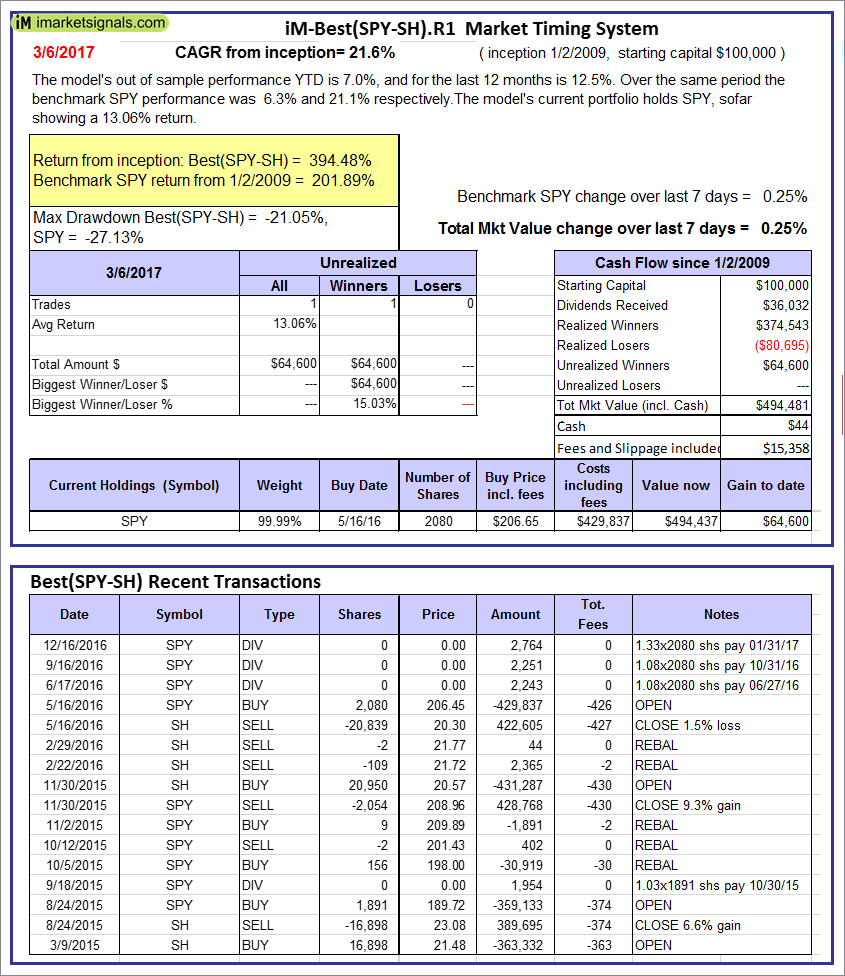 |
iM-Best(SPY-SH).R1: The model’s out of sample performance YTD is 7.0%, and for the last 12 months is 12.5%. Over the same period the benchmark SPY performance was 6.3% and 21.1% respectively. Over the previous week the market value of Best(SPY-SH) gained 0.25% at a time when SPY gained 0.25%. A starting capital of $100,000 at inception on 1/2/2009 would have grown to $494,481 which includes $44 cash and excludes $15,358 spent on fees and slippage. |
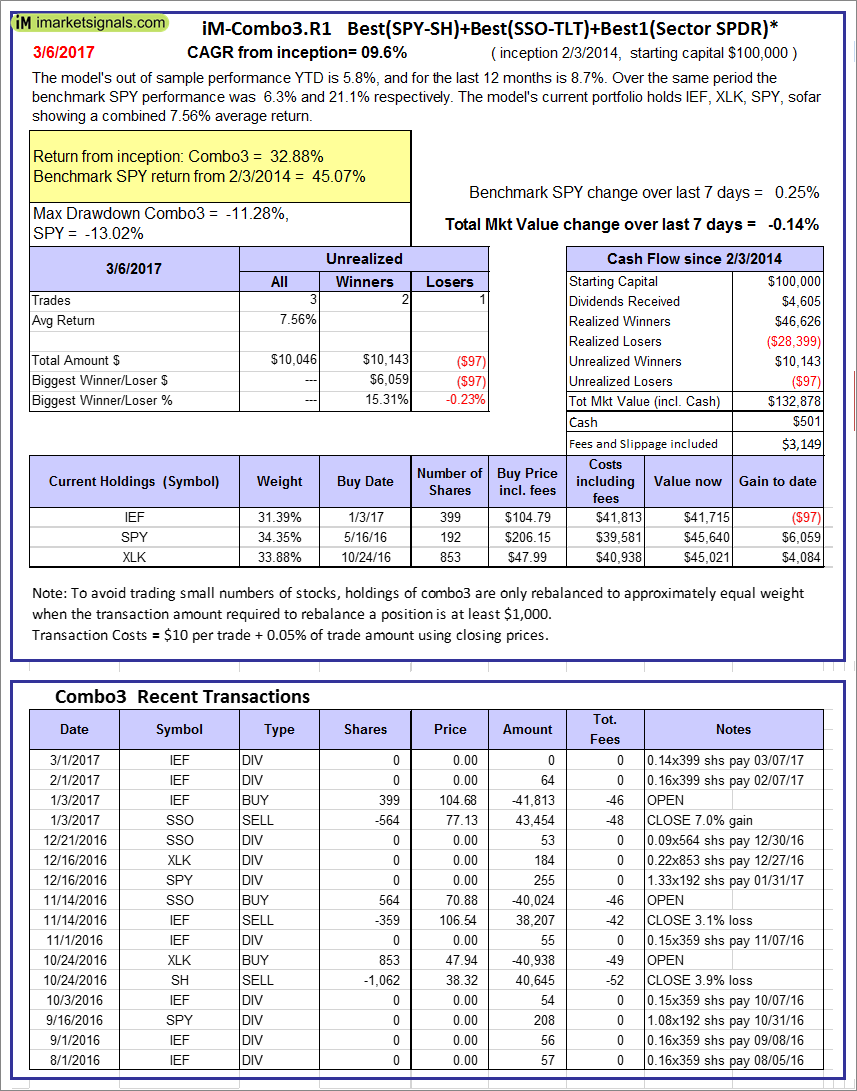 |
iM-Combo3.R1: The model’s out of sample performance YTD is 5.8%, and for the last 12 months is 8.7%. Over the same period the benchmark SPY performance was 6.3% and 21.1% respectively. Over the previous week the market value of iM-Combo3.R1 gained -0.14% at a time when SPY gained 0.25%. A starting capital of $100,000 at inception on 2/3/2014 would have grown to $132,878 which includes $501 cash and excludes $3,149 spent on fees and slippage. |
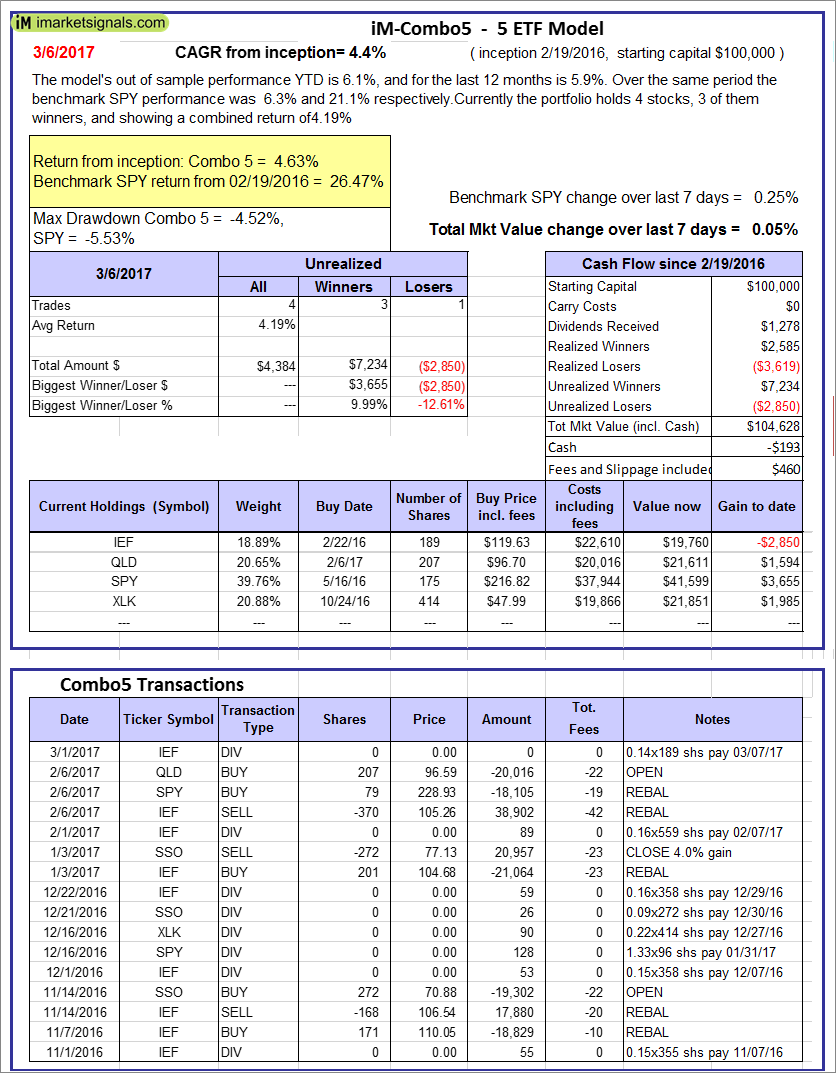 |
iM-Combo5: The model’s out of sample performance YTD is 6.1%, and for the last 12 months is 5.9%. Over the same period the benchmark SPY performance was 6.3% and 21.1% respectively. Over the previous week the market value of iM-Combo5 gained 0.05% at a time when SPY gained 0.25%. A starting capital of $100,000 at inception on 2/22/2016 would have grown to $104,628 which includes -$193 cash and excludes $460 spent on fees and slippage. |
 |
The iM-Best8(S&P500 Min Vol)Tax-Efficient The model’s out of sample performance YTD is 4.6%, and for the last 12 months is -11.9%. Over the same period the benchmark SPY performance was 6.3% and 21.1% respectively. Over the previous week the market value of iM-Best8(S&P 500)Tax-Eff. gained 1.14% at a time when SPY gained 0.25%. A starting capital of $100,000 at inception on 1/2/2009 would have grown to $411,580 which includes $28,635 cash and excludes $8,323 spent on fees and slippage. |
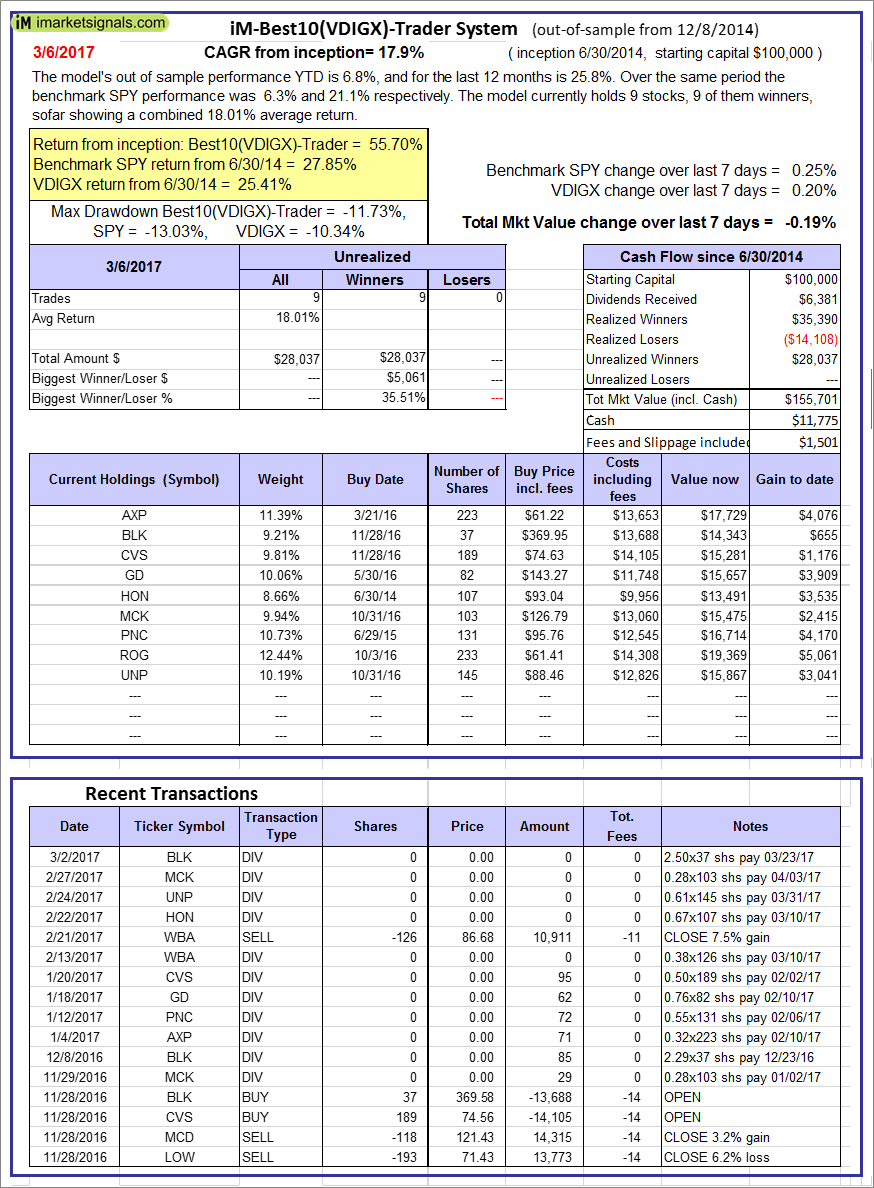  |
iM-Best10(VDIGX)-Trader: The model’s out of sample performance YTD is 6.8%, and for the last 12 months is 25.8%. Over the same period the benchmark SPY performance was 6.3% and 21.1% respectively. Since inception, on 7/1/2014, the model gained 55.70% while the benchmark SPY gained 27.85% and VDIGX gained 25.41% over the same period. Over the previous week the market value of iM-Best10(VDIGX) gained -0.19% at a time when SPY gained 0.25%. A starting capital of $100,000 at inception on 7/1/2014 would have grown to $155,701 which includes $11,775 cash and excludes $1,501 spent on fees and slippage. |
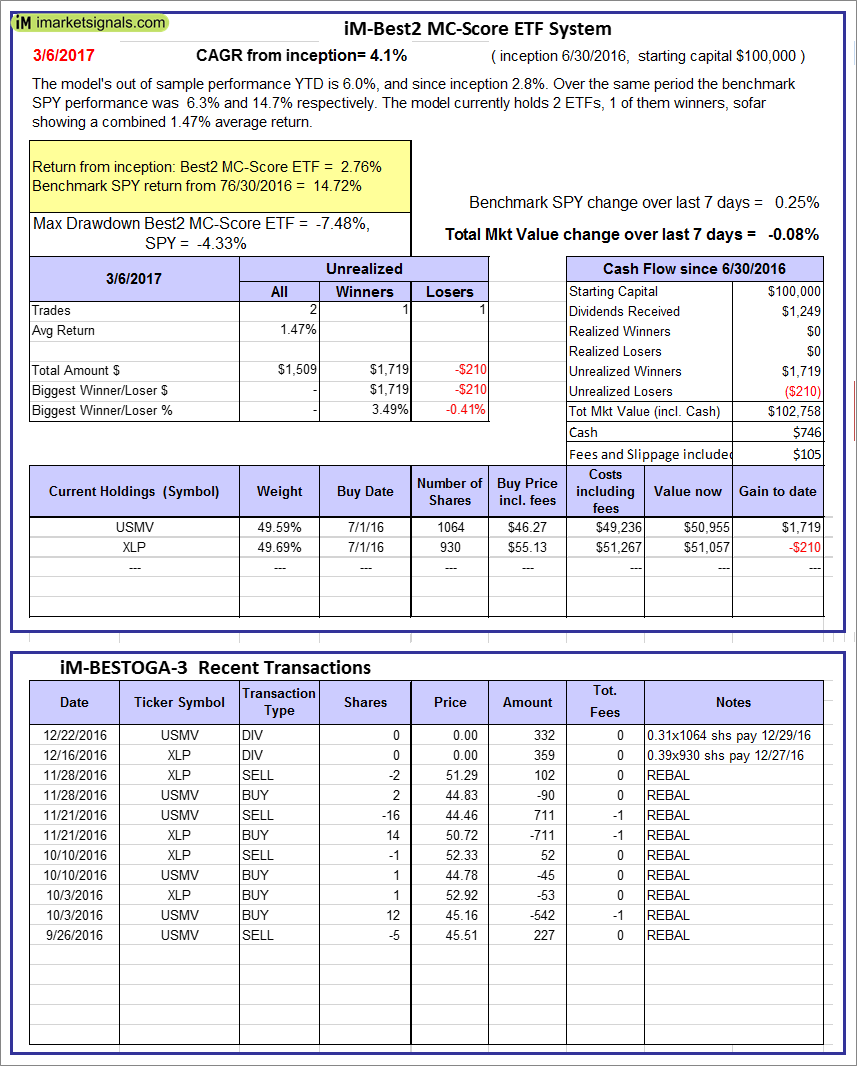 |
iM-Best2 MC-Score ETF System: The model’s out of sample performance YTD is 6.0%, and since inception 2.8%. Over the same period the benchmark SPY performance was 6.3% and 14.7% respectively. Over the previous week the market value of iM-BESTOGA-3 gained -0.08% at a time when SPY gained 0.25%. A starting capital of $100,000 at inception on 6/30/2016 would have grown to $746 which includes $105 cash and excludes Gain to date spent on fees and slippage. |
 |
iM-BESTOGA-3: The model’s out of sample performance YTD is 8.6%, and for the last 12 months is 16.1%. Over the same period the benchmark SPY performance was 6.3% and 21.1% respectively. Over the previous week the market value of iM-BESTOGA-3 gained 0.17% at a time when SPY gained 0.25%. A starting capital of $100,000 at inception on 2/3/2014 would have grown to $219,727 which includes $21,406 cash and excludes $767 spent on fees and slippage. |
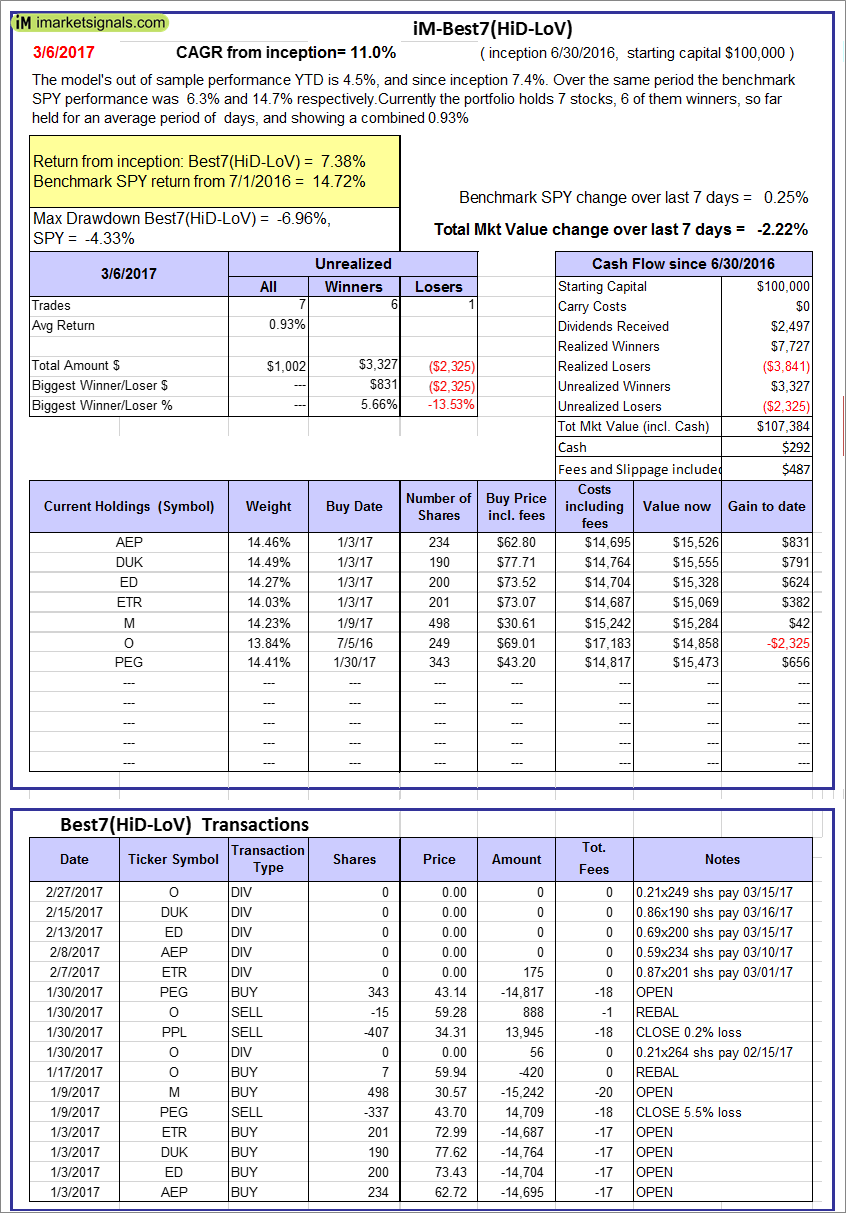 |
iM-Best7(HiD-LoV): The model’s out of sample performance YTD is 4.5%, and since inception 7.4%. Over the same period the benchmark SPY performance was 6.3% and 14.7% respectively. Over the previous week the market value of iM-BESTOGA-3 gained -2.22% at a time when SPY gained 0.25%. A starting capital of $100,000 at inception on 6/30/2016 would have grown to $107,384 which includes $292 cash and excludes $487 spent on fees and slippage. |
 |
iM-Best10(Short Russell3000): The model’s performance YTD is -7.3%, and for the last 12 months is -41.5%. Over the same period the benchmark SPY performance was 6.3% and 21.1% respectively. Over the previous week the market value of iM-Best10(Short Russell3000) gained -0.19% at a time when SPY gained 0.25%. Over the period 2/3/2014 to 3/6/2017 the starting capital of $100,000 would have grown to $7,929 which includes $13,249 cash and excludes $1,712 spent on fees and slippage. |
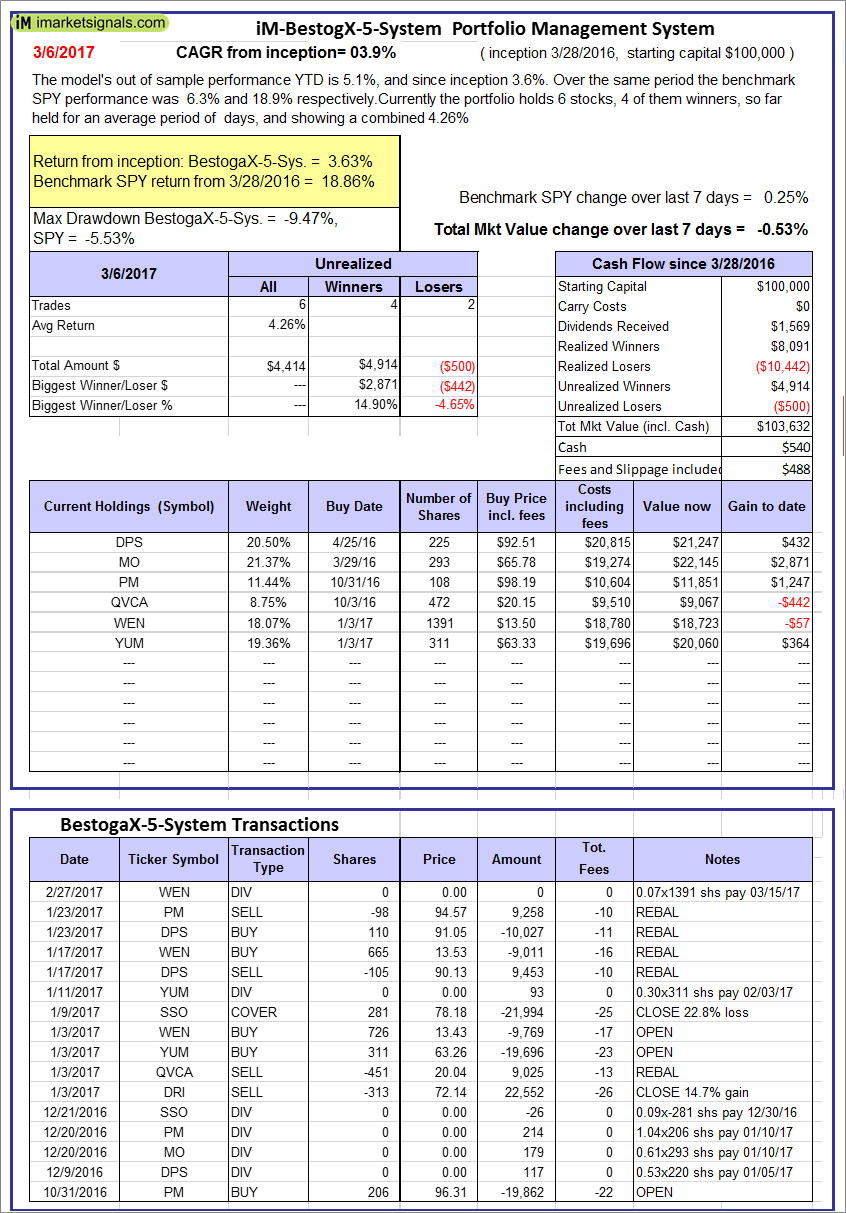 |
iM-BestogaX5-System: The model’s out of sample performance YTD is 5.1%, and since inception 3.6%. Over the same period the benchmark SPY performance was 6.3% and 18.9% respectively. Over the previous week the market value of iM-Best8(S&P 500)Tax-Eff. gained -0.53% at a time when SPY gained 0.25%. A starting capital of $100,000 at inception on 3/28/2016 would have grown to $103,632 which includes $540 cash and excludes $488 spent on fees and slippage. |
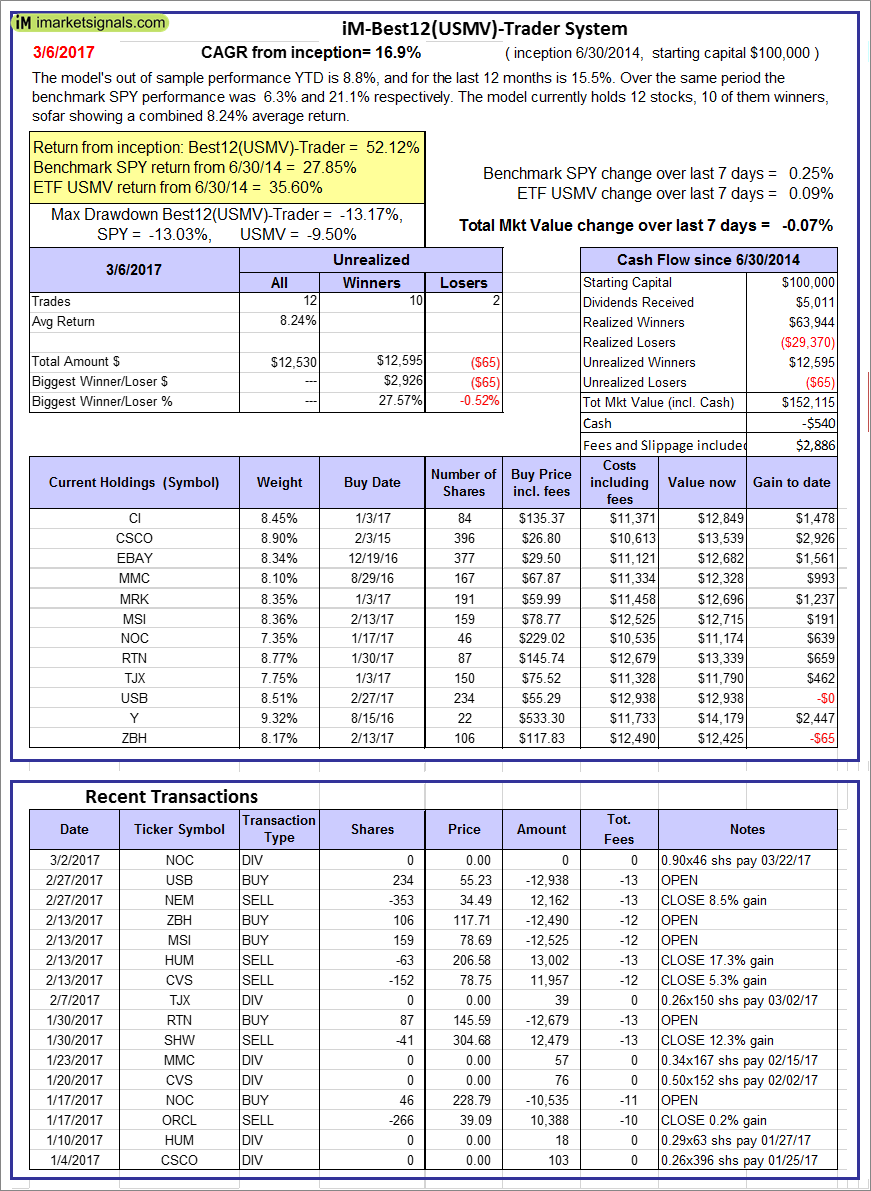 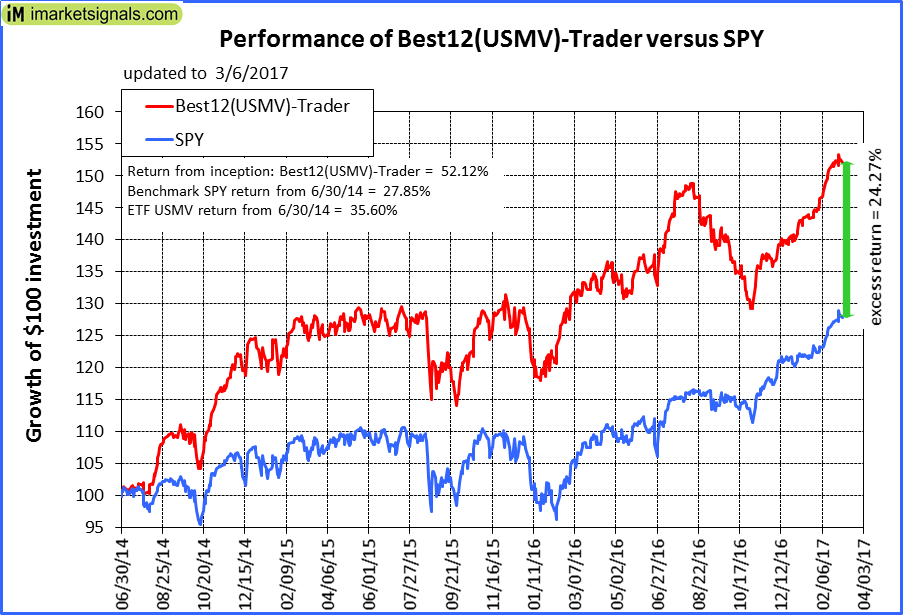 |
iM-Best12(USMV)-Trader: The model’s out of sample performance YTD is 8.8%, and for the last 12 months is 15.5%. Over the same period the benchmark SPY performance was 6.3% and 21.1% respectively. Since inception, on 7/1/2014, the model gained 52.12% while the benchmark SPY gained 27.85% and the ETF USMV gained 35.60% over the same period. Over the previous week the market value of iM-Best12(USMV)-Trader gained -0.07% at a time when SPY gained 0.25%. A starting capital of $100,000 at inception on 7/1/2014 would have grown to $152,115 which includes -$540 cash and excludes $2,886 spent on fees and slippage. |
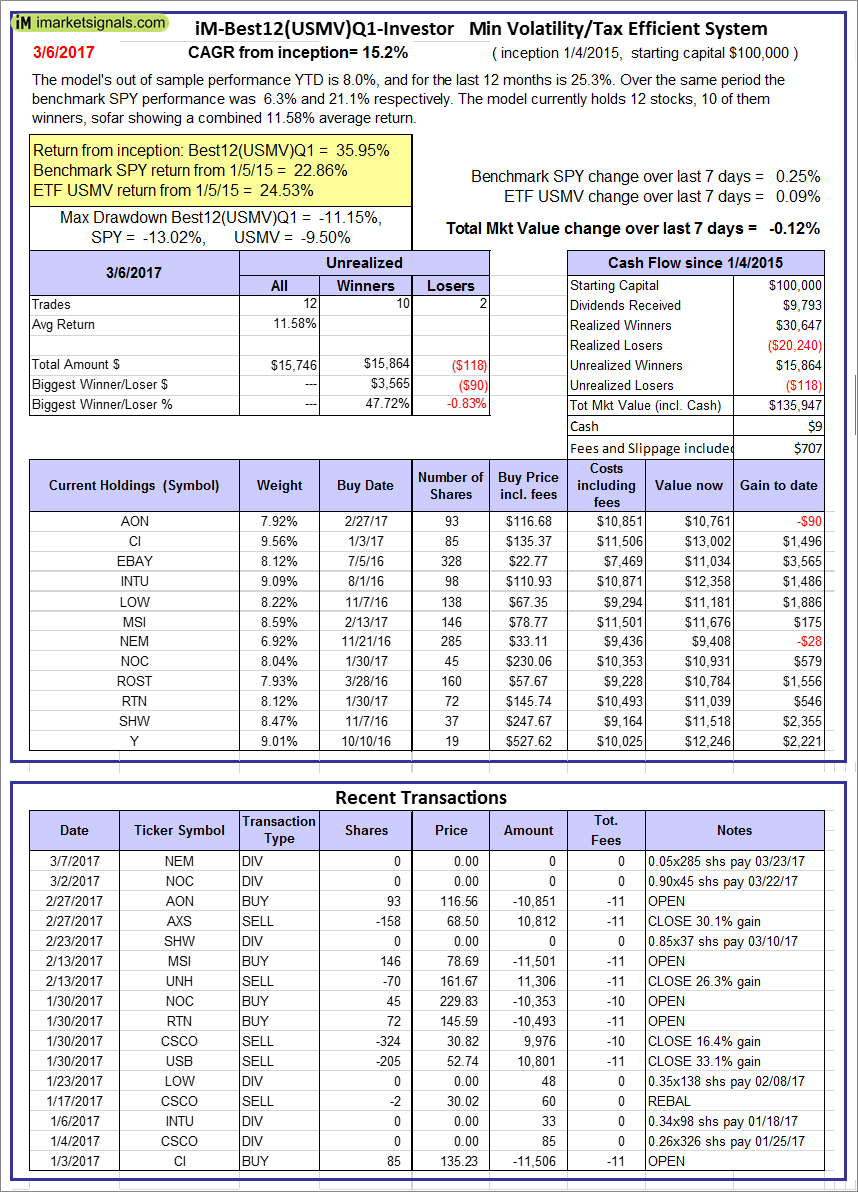 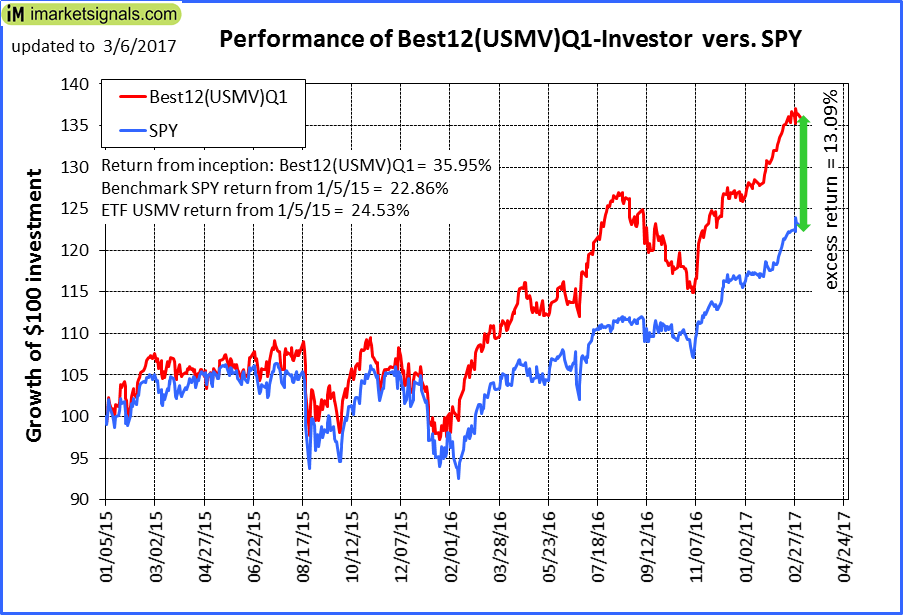 |
iM-Best12(USMV)Q1-Investor: The model’s out of sample performance YTD is 8.0%, and for the last 12 months is 25.3%. Over the same period the benchmark SPY performance was 6.3% and 21.1% respectively. Since inception, on 1/5/2015, the model gained 35.95% while the benchmark SPY gained 22.86% and the ETF USMV gained 24.53% over the same period. Over the previous week the market value of iM-Best12(USMV)Q1 gained -0.12% at a time when SPY gained 0.25%. A starting capital of $100,000 at inception on 1/5/2015 would have grown to $135,947 which includes $9 cash and excludes $707 spent on fees and slippage. |
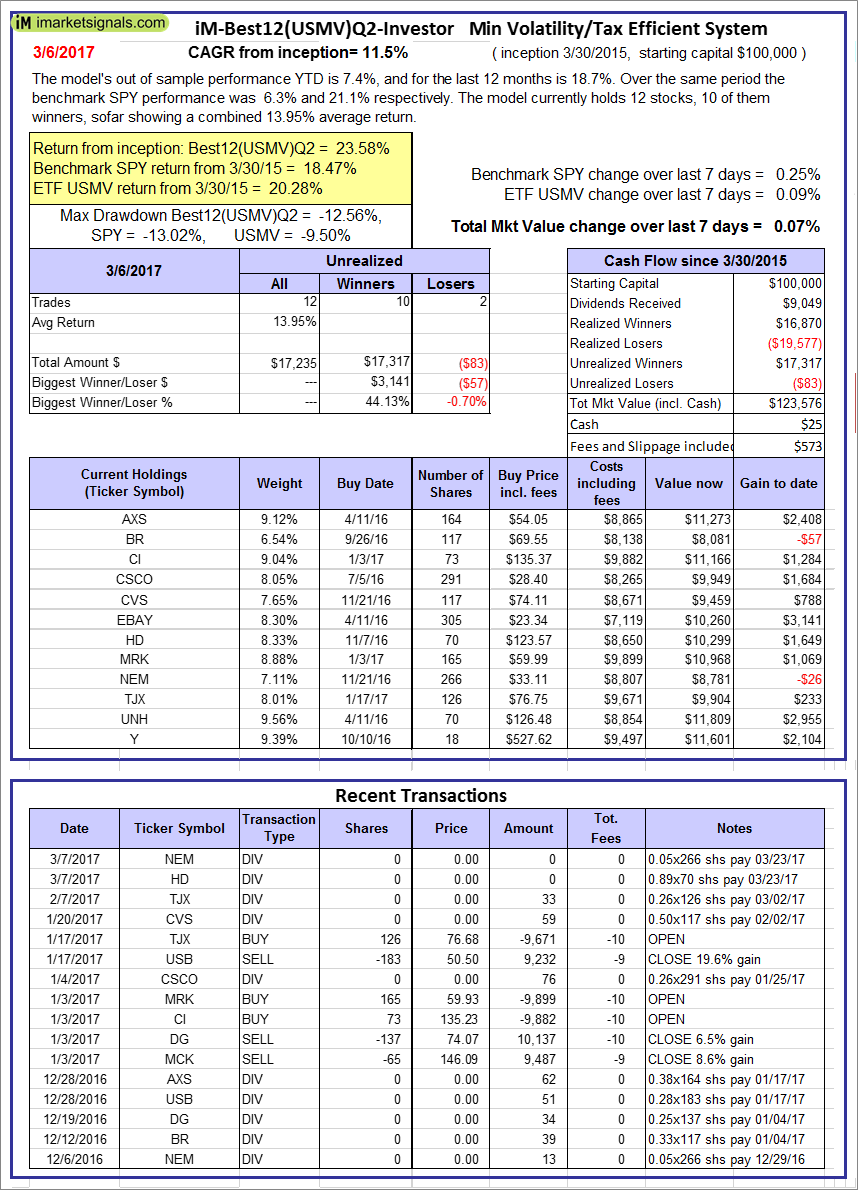 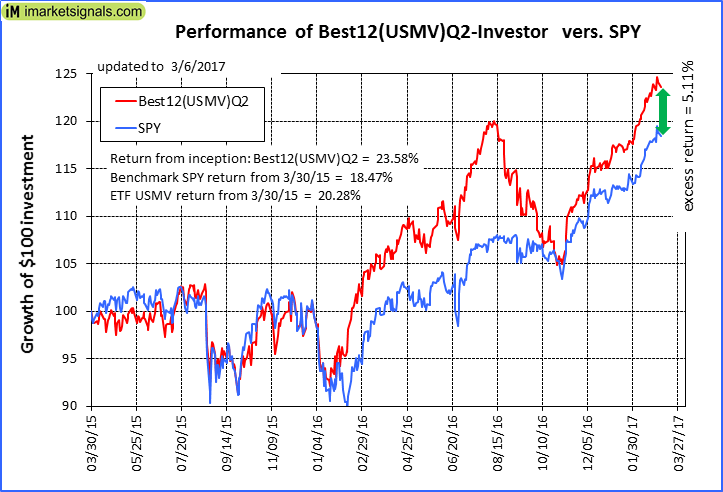 |
iM-Best12(USMV)Q2-Investor: The model’s out of sample performance YTD is 7.4%, and for the last 12 months is 18.7%. Over the same period the benchmark SPY performance was 6.3% and 21.1% respectively. Since inception, on 3/31/2015, the model gained 23.58% while the benchmark SPY gained 18.47% and the ETF USMV gained 20.28% over the same period. Over the previous week the market value of iM-Best12(USMV)Q2 gained 0.07% at a time when SPY gained 0.25%. A starting capital of $100,000 at inception on 3/31/2015 would have grown to $123,576 which includes $25 cash and excludes $573 spent on fees and slippage. |
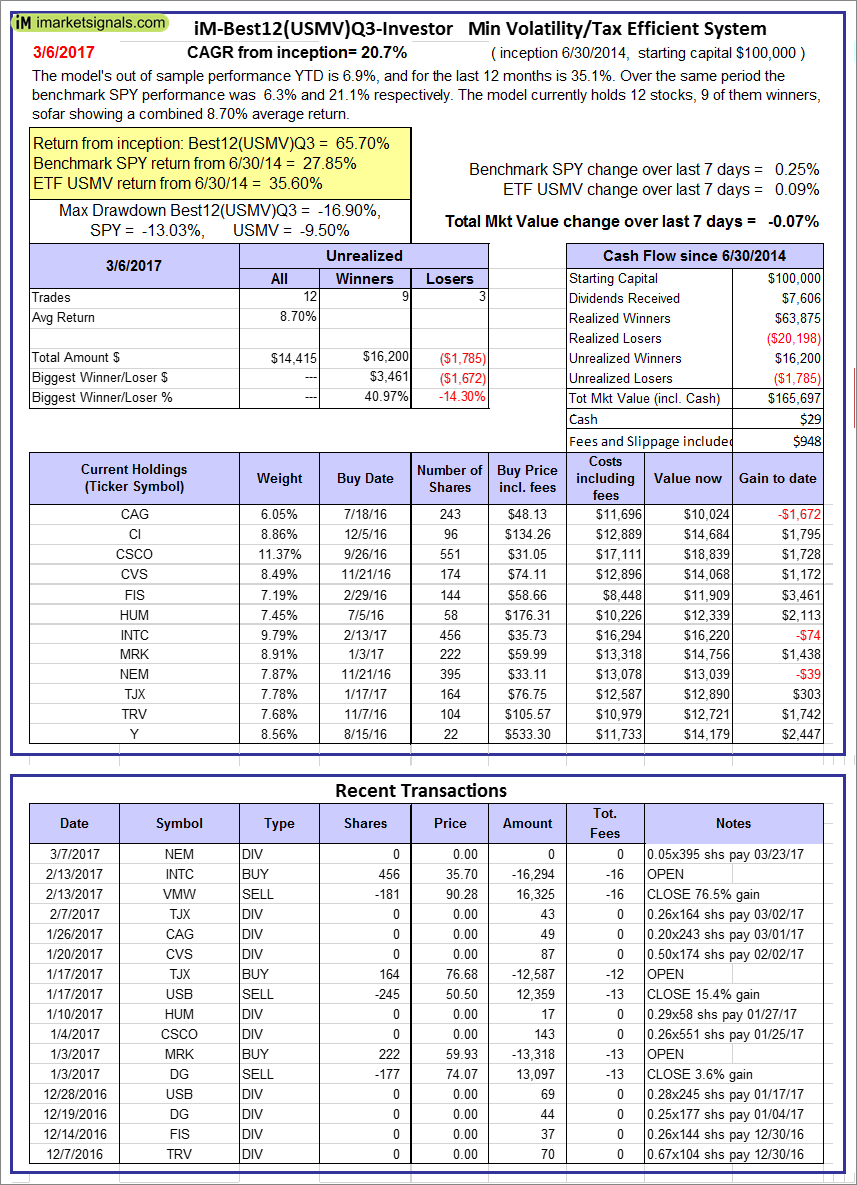 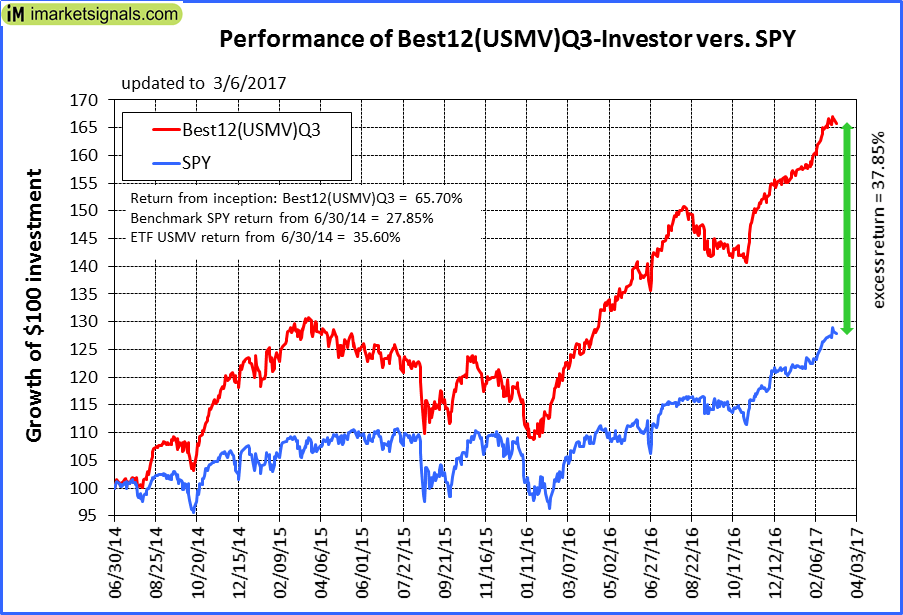 |
iM-Best12(USMV)Q3-Investor: The model’s out of sample performance YTD is 6.9%, and for the last 12 months is 35.1%. Over the same period the benchmark SPY performance was 6.3% and 21.1% respectively. Since inception, on 7/1/2014, the model gained 65.70% while the benchmark SPY gained 27.85% and the ETF USMV gained 35.60% over the same period. Over the previous week the market value of iM-Best12(USMV)Q3 gained -0.07% at a time when SPY gained 0.25%. A starting capital of $100,000 at inception on 7/1/2014 would have grown to $165,697 which includes $29 cash and excludes $948 spent on fees and slippage. |
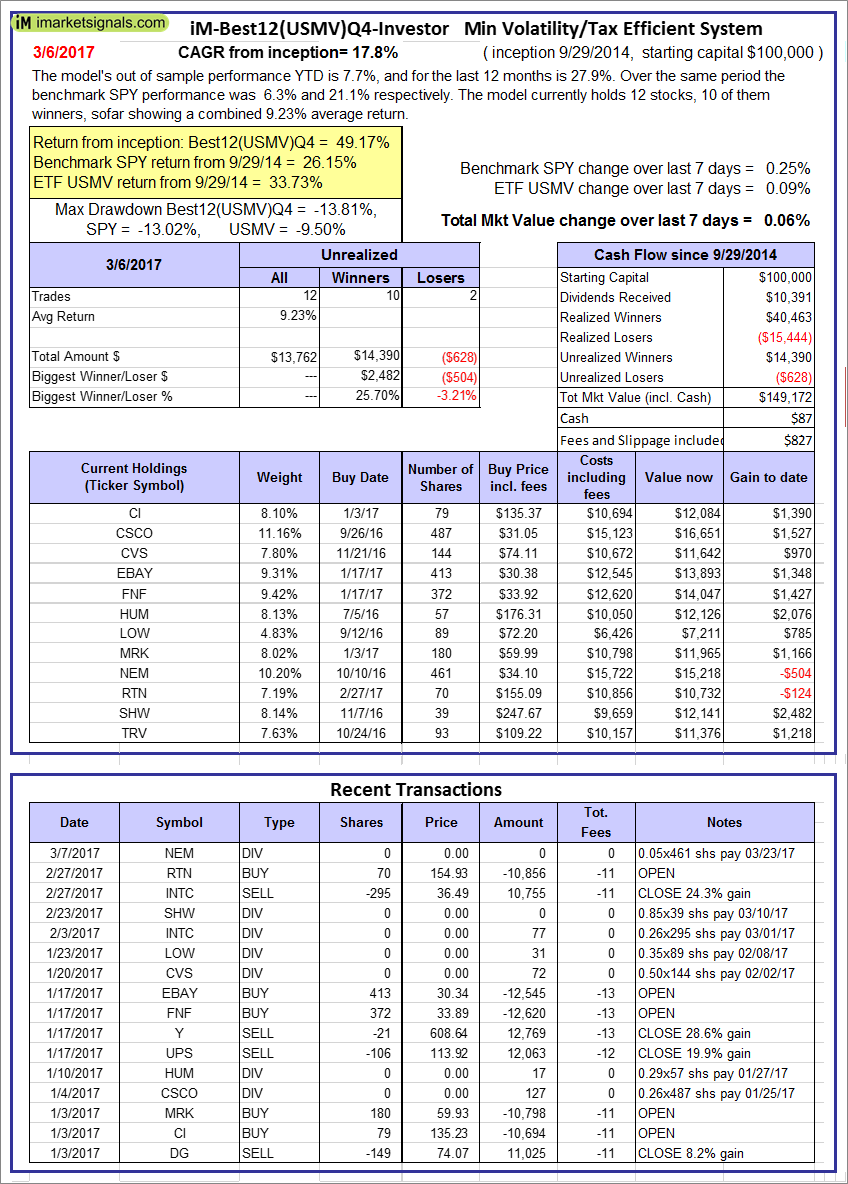  |
iM-Best12(USMV)Q4-Investor: Since inception, on 9/30/2014, the model gained 49.17% while the benchmark SPY gained 26.15% and the ETF USMV gained 33.73% over the same period. Over the previous week the market value of iM-Best12(USMV)Q4 gained 0.06% at a time when SPY gained 0.25%. A starting capital of $100,000 at inception on 9/30/2014 would have grown to $149,172 which includes $87 cash and excludes $827 spent on fees and slippage. |
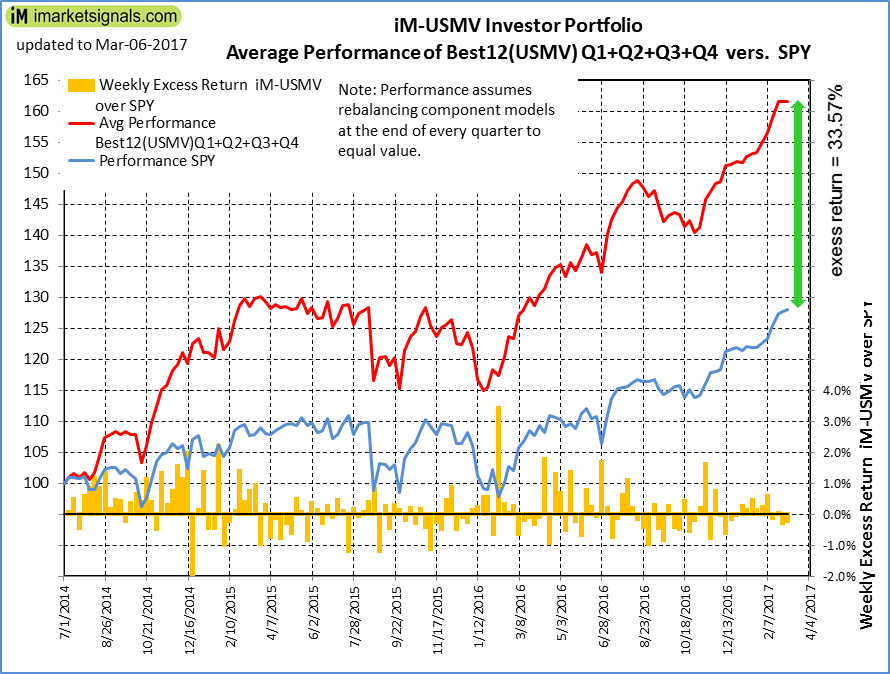 |
Average Performance of iM-Best12(USMV)Q1+Q2+Q3+Q4-Investor resulted in an excess return of 33.57% over SPY. (see iM-USMV Investor Portfolio) |
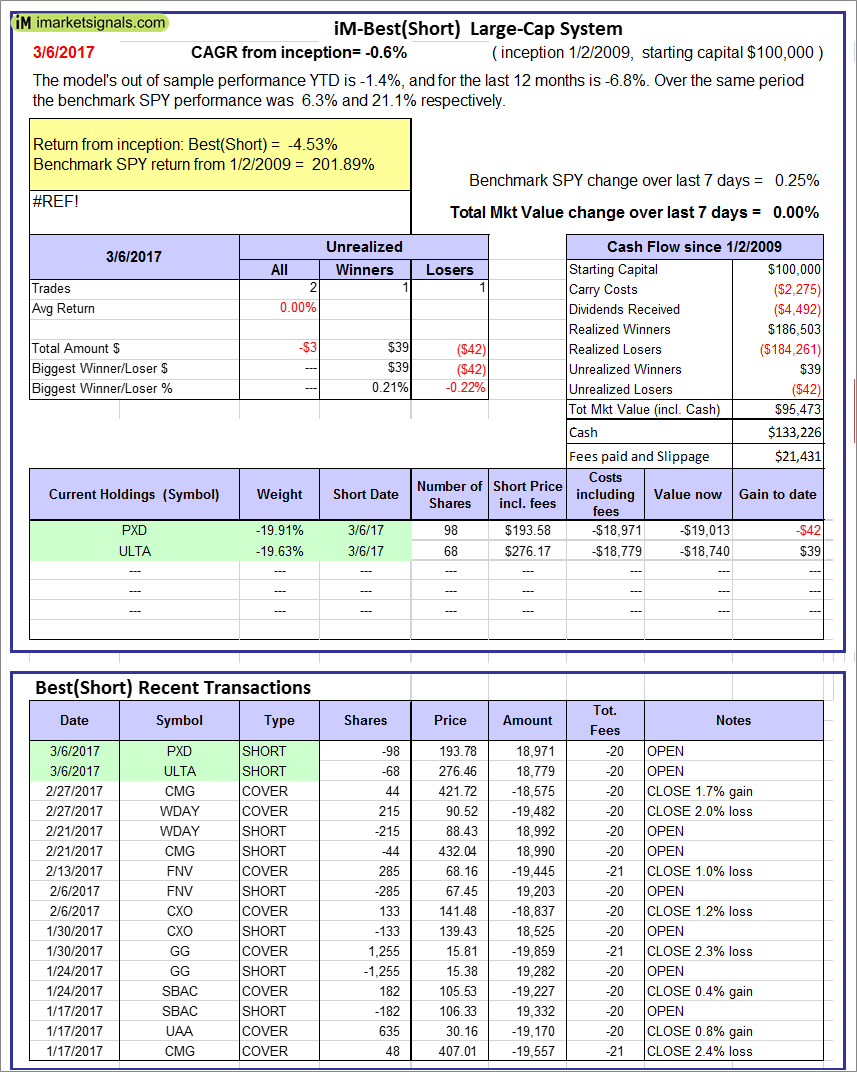 |
iM-Best(Short): The model’s out of sample performance YTD is -1.4%, and for the last 12 months is -6.8%. Over the same period the benchmark SPY performance was 6.3% and 21.1% respectively. Over the previous week the market value of iM-Best(Short) gained 0.00% at a time when SPY gained 0.25%. Over the period 1/2/2009 to 3/6/2017 the starting capital of $100,000 would have grown to $95,473 which includes $133,226 cash and excludes $21,431 spent on fees and slippage. |
iM-Best Reports – 3/6/2017
Posted in pmp SPY-SH
Leave a Reply
You must be logged in to post a comment.