
  |
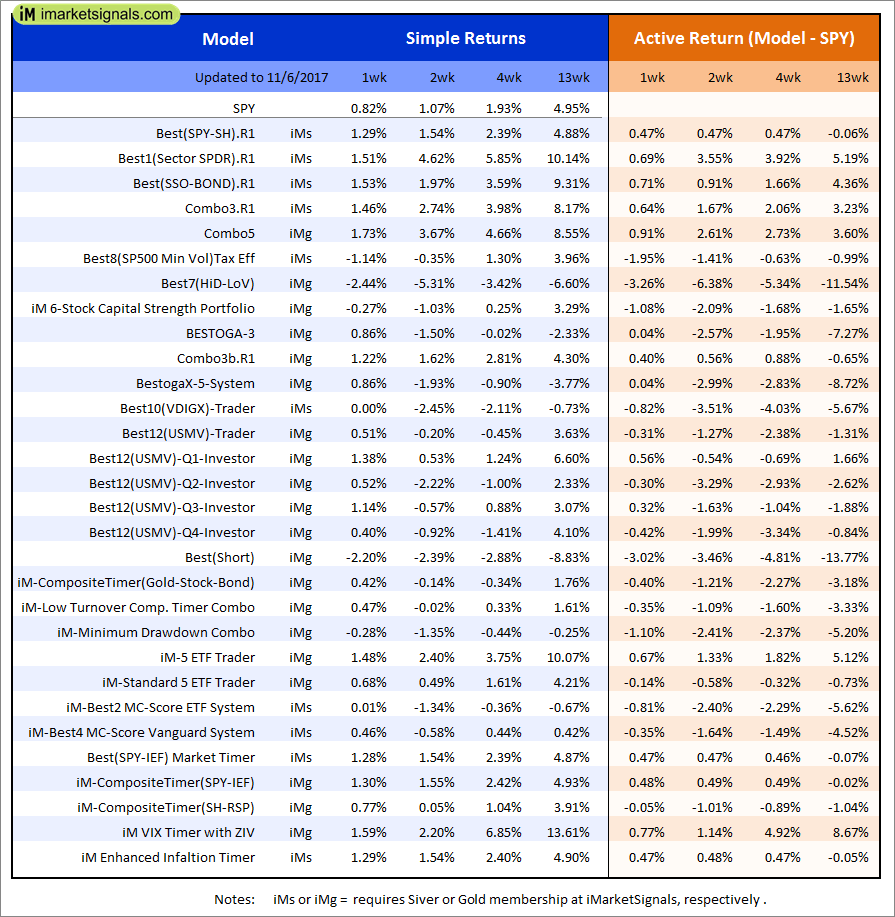
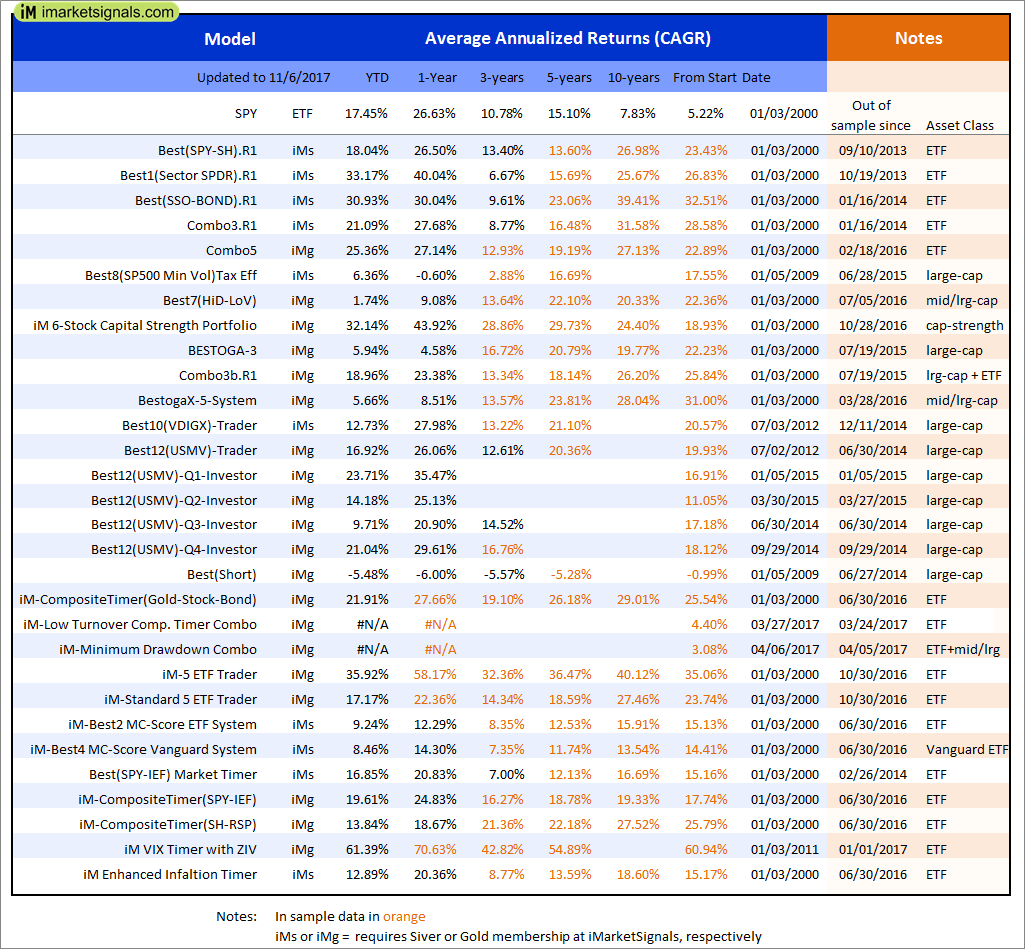
Out of sample performance summary of our models for the past 1, 2, 4 and 13 week periods. The active active return indicates how the models over- or underperformed the benchmark ETF SPY. Also the YTD, and the 1-, 3-, 5- and 10-year annualized returns are shown in the second table |
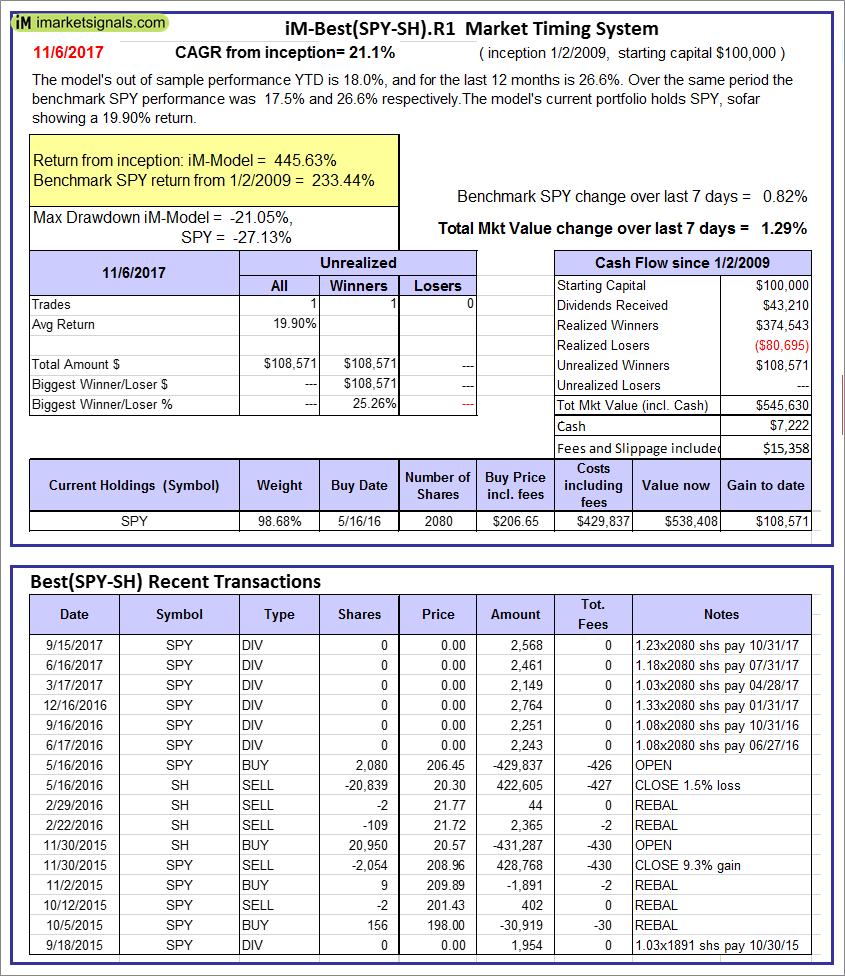 |
iM-Best(SPY-SH).R1: The model’s out of sample performance YTD is 18.0%, and for the last 12 months is 26.6%. Over the same period the benchmark SPY performance was 17.5% and 26.6% respectively. Over the previous week the market value of Best(SPY-SH) gained 1.29% at a time when SPY gained 0.82%. A starting capital of $100,000 at inception on 1/2/2009 would have grown to $545,630 which includes $7,222 cash and excludes $15,358 spent on fees and slippage. |
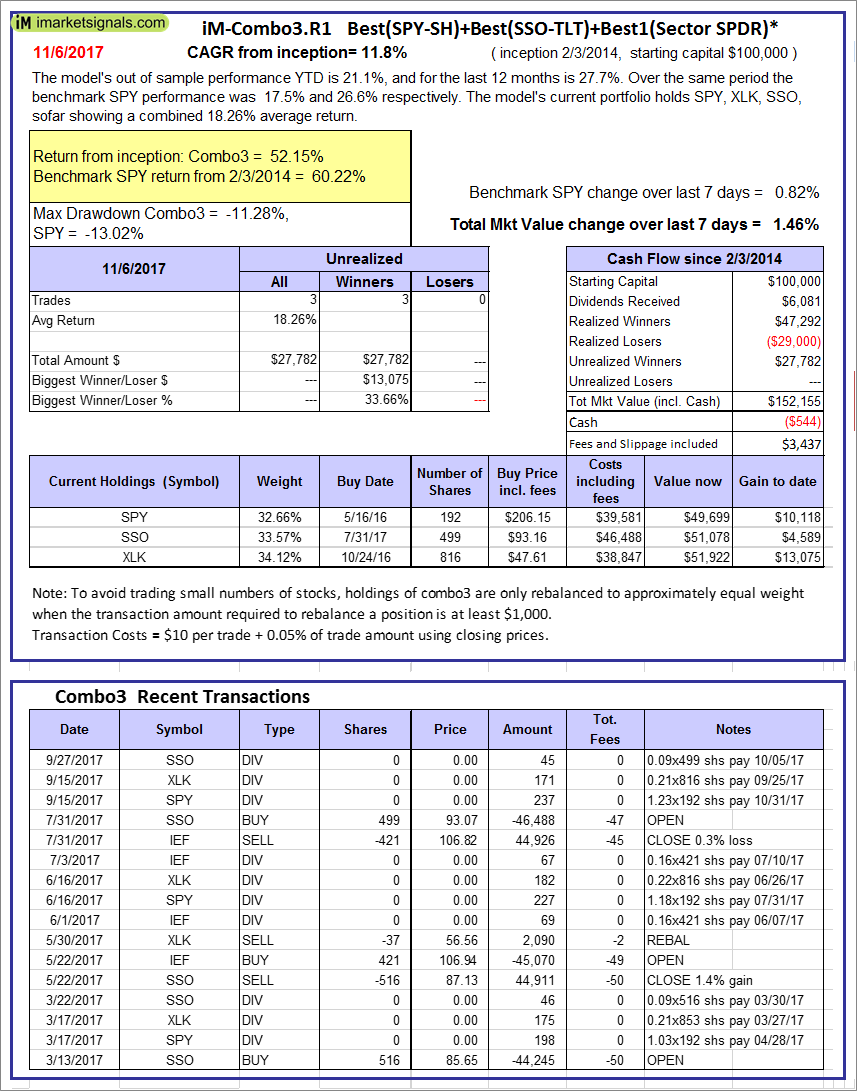 |
iM-Combo3.R1: The model’s out of sample performance YTD is 21.1%, and for the last 12 months is 27.7%. Over the same period the benchmark SPY performance was 17.5% and 26.6% respectively. Over the previous week the market value of iM-Combo3.R1 gained 1.46% at a time when SPY gained 0.82%. A starting capital of $100,000 at inception on 2/3/2014 would have grown to $152,155 which includes -$544 cash and excludes $3,437 spent on fees and slippage. |
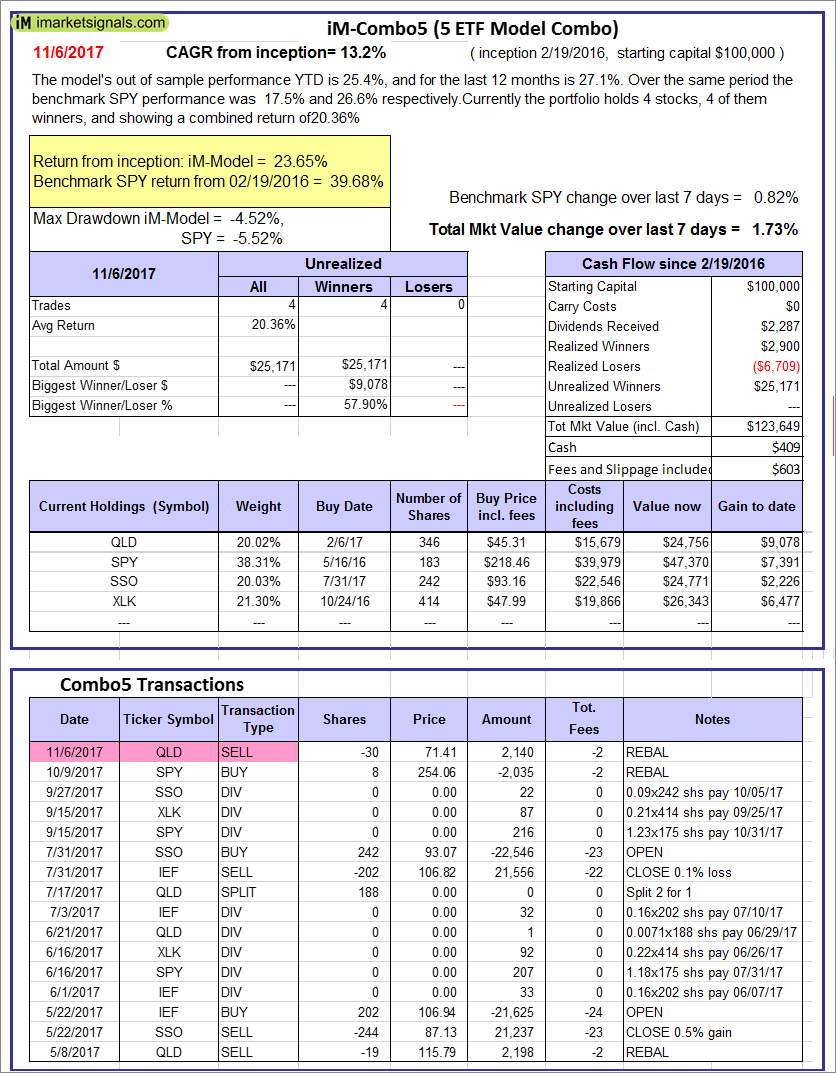 |
iM-Combo5: The model’s out of sample performance YTD is 25.4%, and for the last 12 months is 27.1%. Over the same period the benchmark SPY performance was 17.5% and 26.6% respectively. Over the previous week the market value of iM-Combo5 gained 1.73% at a time when SPY gained 0.82%. A starting capital of $100,000 at inception on 2/22/2016 would have grown to $123,649 which includes $409 cash and excludes $603 spent on fees and slippage. |
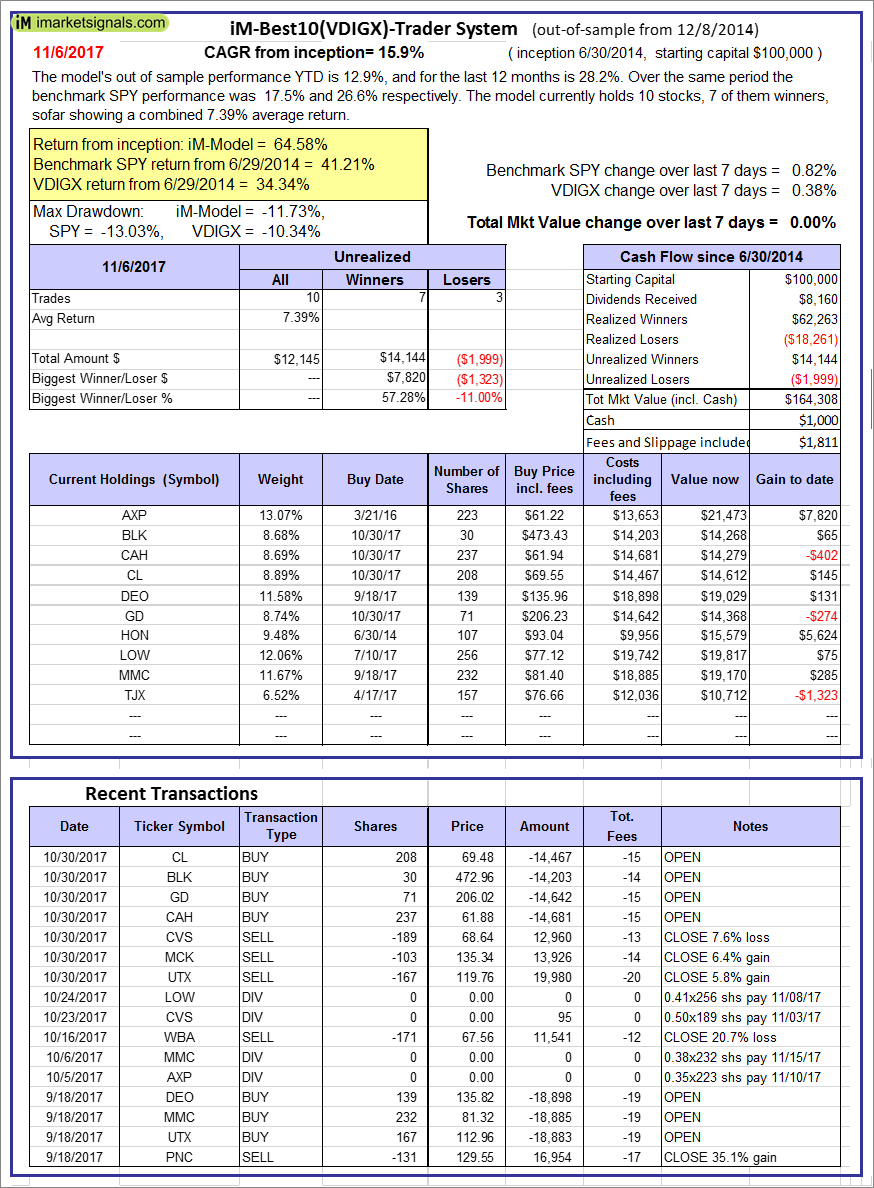 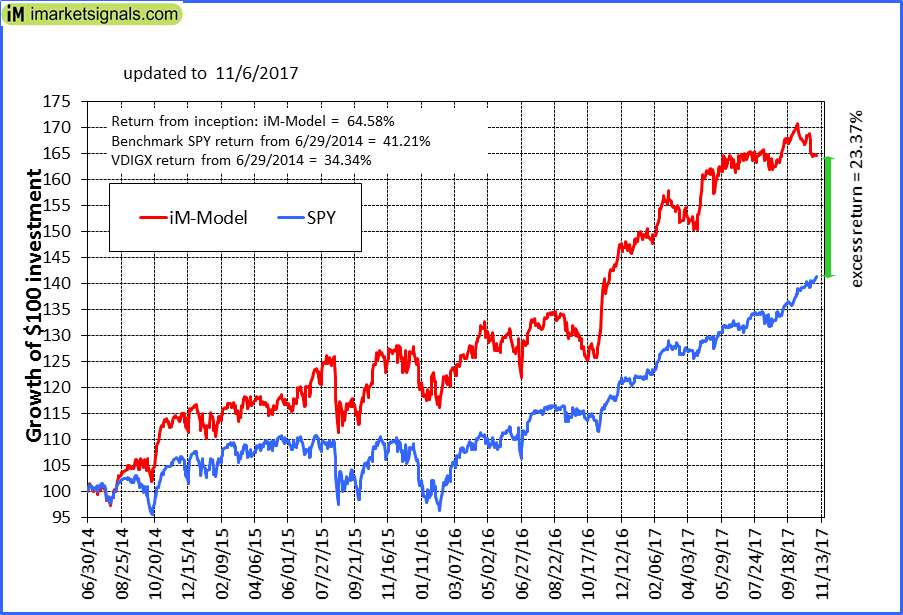 |
iM-Best10(VDIGX)-Trader: The model’s out of sample performance YTD is 12.9%, and for the last 12 months is 28.2%. Over the same period the benchmark SPY performance was 17.5% and 26.6% respectively. Since inception, on 7/1/2014, the model gained 64.58% while the benchmark SPY gained 41.21% and VDIGX gained 34.34% over the same period. Over the previous week the market value of iM-Best10(VDIGX) gained 0.00% at a time when SPY gained 0.82%. A starting capital of $100,000 at inception on 7/1/2014 would have grown to $164,308 which includes $1,000 cash and excludes $1,811 spent on fees and slippage. |
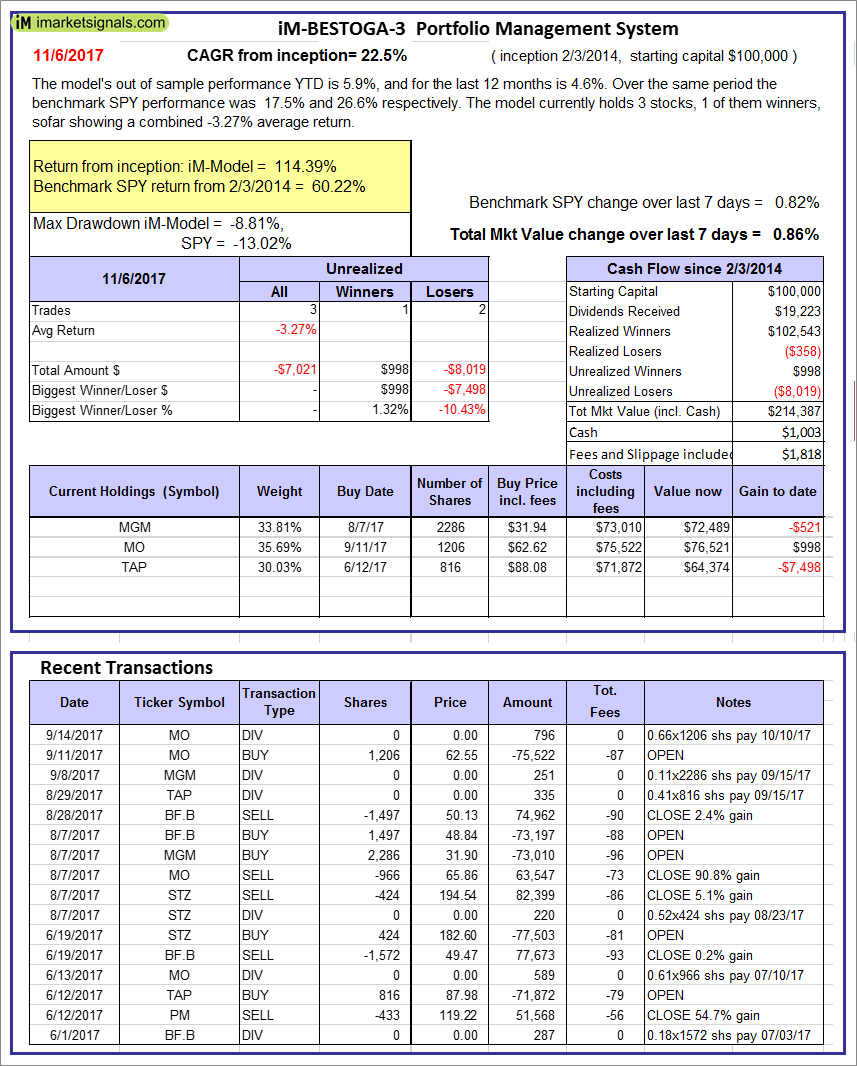 |
iM-BESTOGA-3: The model’s out of sample performance YTD is 5.9%, and for the last 12 months is 4.6%. Over the same period the benchmark SPY performance was 17.5% and 26.6% respectively. Over the previous week the market value of iM-BESTOGA-3 gained 0.86% at a time when SPY gained 0.82%. A starting capital of $100,000 at inception on 2/3/2014 would have grown to $214,387 which includes $1,003 cash and excludes $1,818 spent on fees and slippage. |
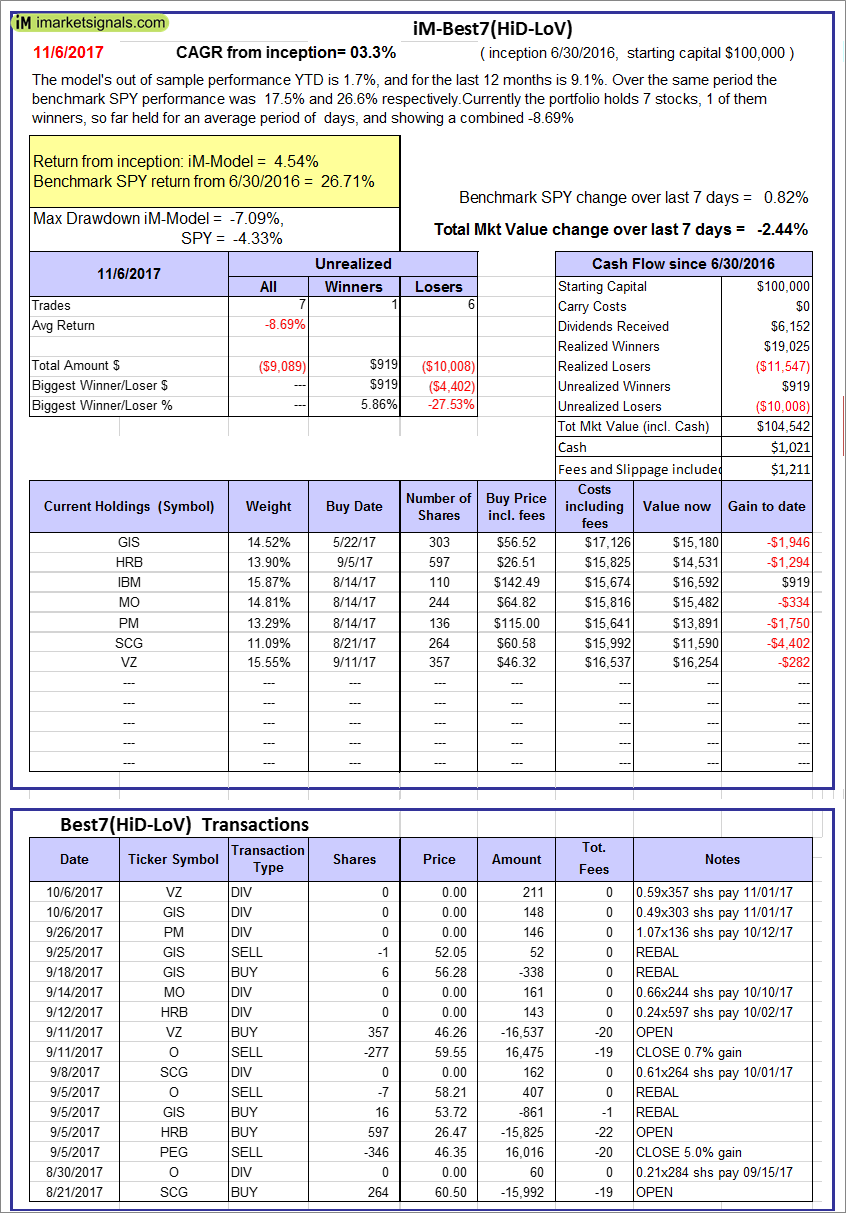 |
iM-Best7(HiD-LoV): The model’s out of sample performance YTD is 1.7%, and for the last 12 months is 9.1%. Over the same period the benchmark SPY performance was 17.5% and 26.6% respectively. Over the previous week the market value of iM-BESTOGA-3 gained -2.44% at a time when SPY gained 0.82%. A starting capital of $100,000 at inception on 6/30/2016 would have grown to $104,542 which includes $1,021 cash and excludes $1,211 spent on fees and slippage. |
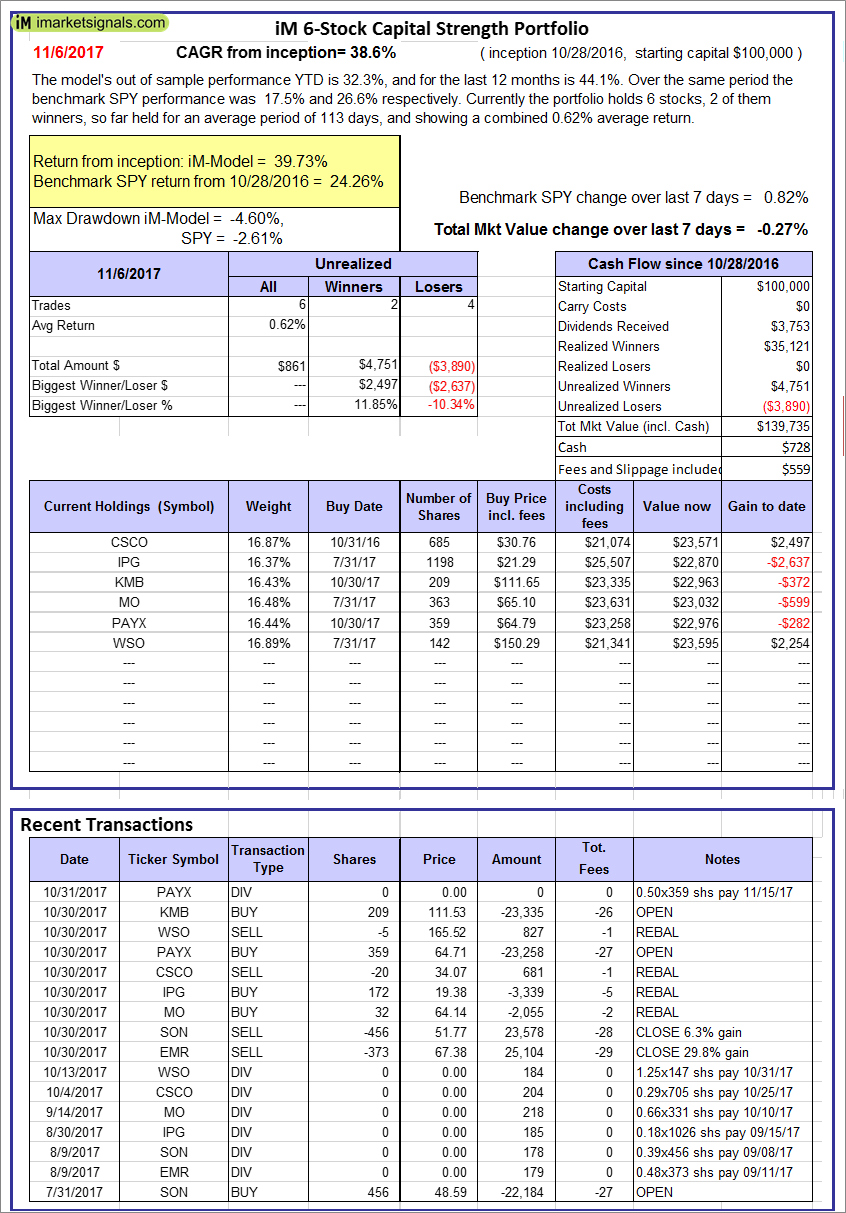 |
iM 6-Stock Capital Strength Portfolio: The model’s out of sample performance YTD is 32.3%, and for the last 12 months is 44.1%. Over the same period the benchmark SPY performance was 17.5% and 26.6% respectively. Over the previous week the market value of the iM 6-Stock Capital Strength Portfolio gained -0.27% at a time when SPY gained 0.82%. A starting capital of $100,000 at inception on 10/28/2016 would have grown to $139,735 which includes $728 cash and excludes $559 spent on fees and slippage. |
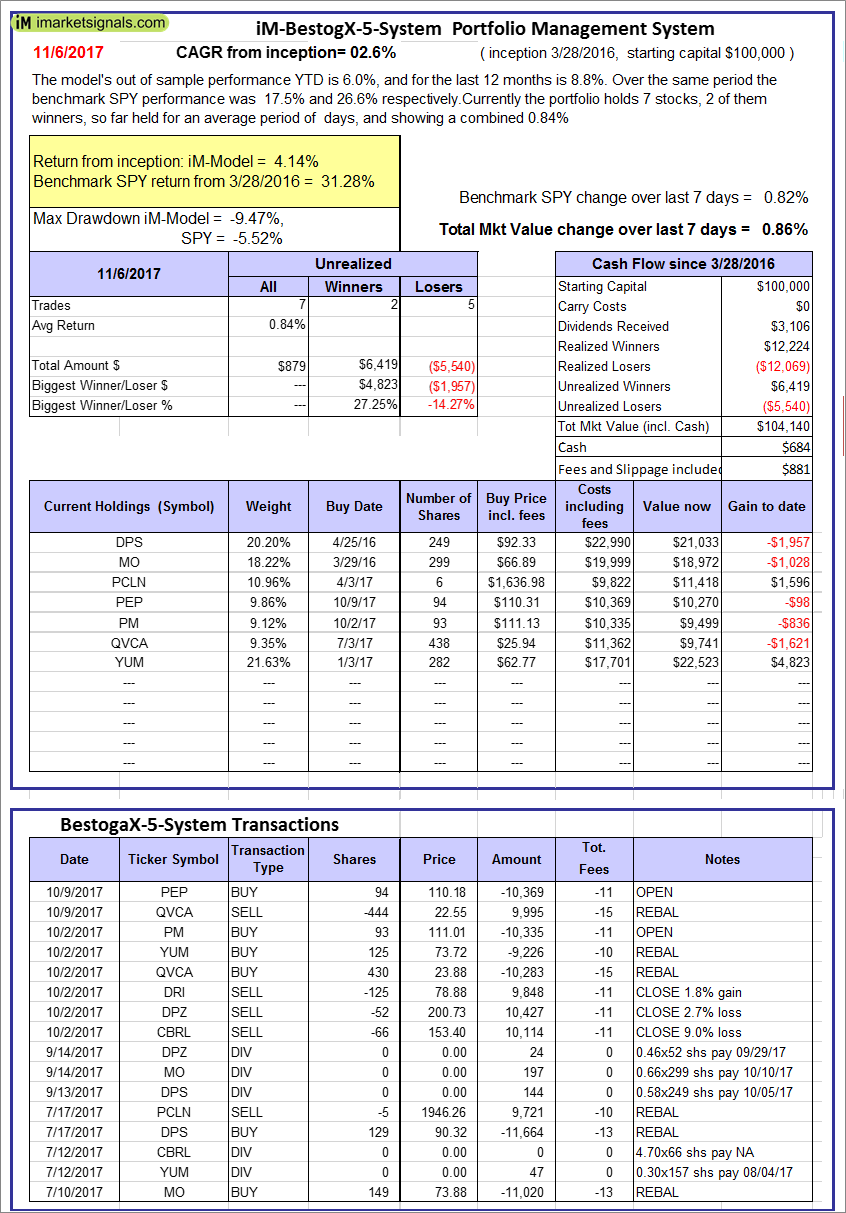 |
iM-BestogaX5-System: The model’s out of sample performance YTD is 6.0%, and for the last 12 months is 8.8%. Over the same period the benchmark SPY performance was 17.5% and 26.6% respectively. Over the previous week the market value of iM-Best8(S&P 500)Tax-Eff. gained 0.86% at a time when SPY gained 0.82%. A starting capital of $100,000 at inception on 3/28/2016 would have grown to $104,140 which includes $684 cash and excludes $881 spent on fees and slippage. |
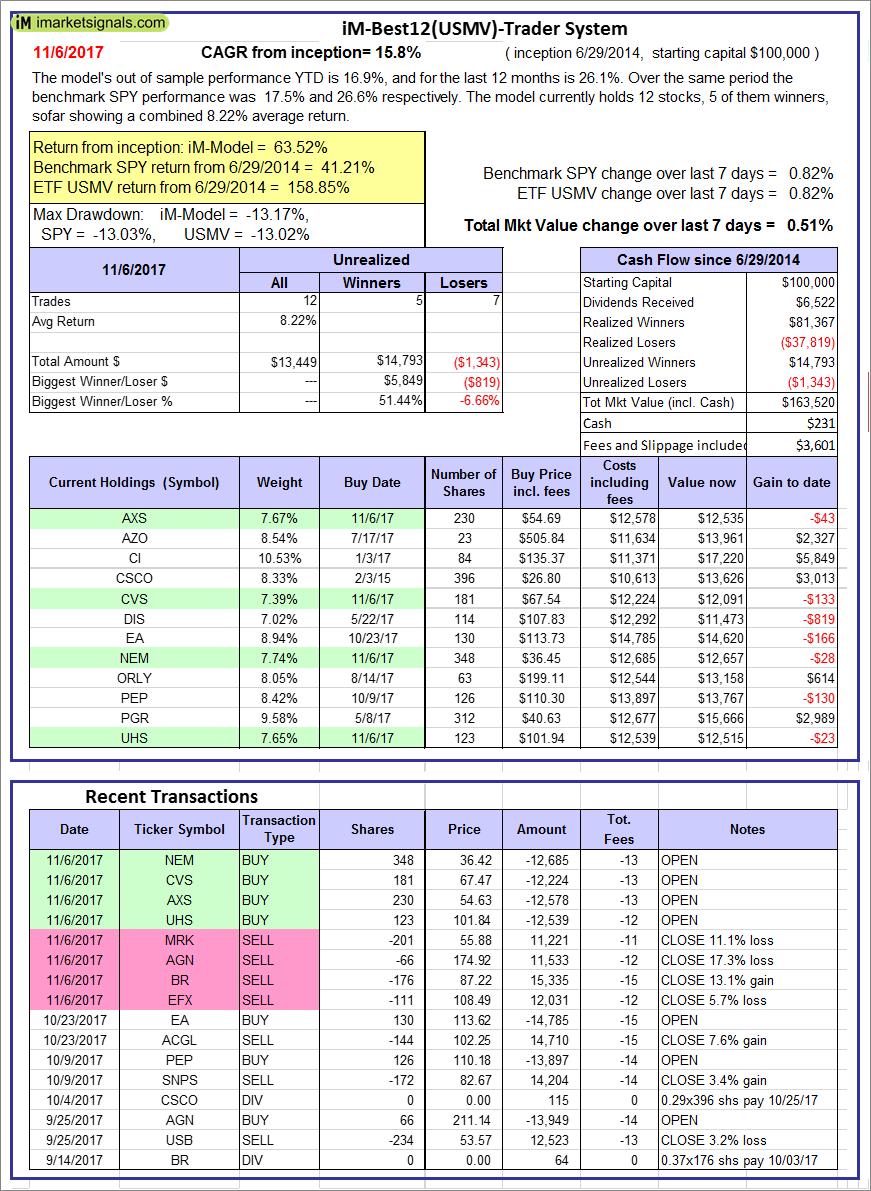 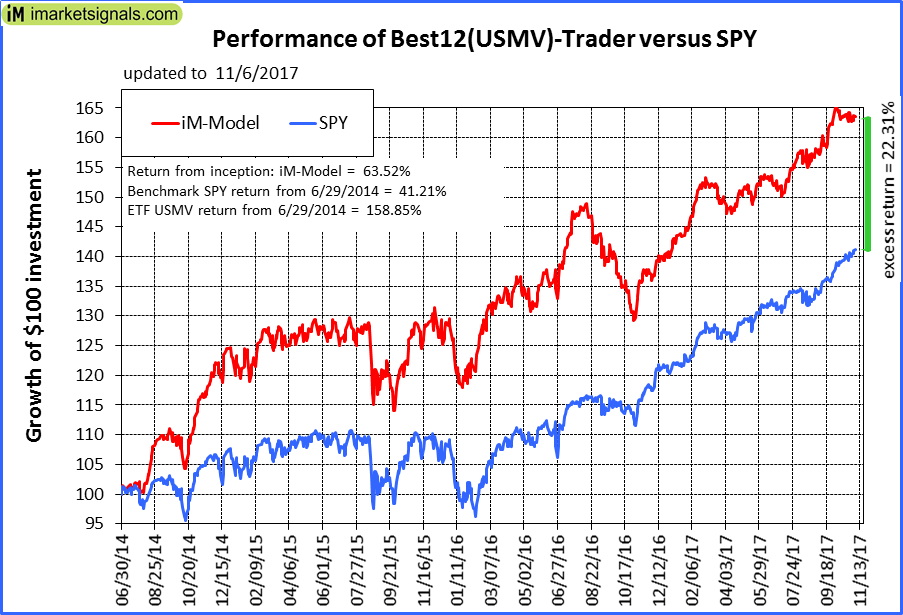 |
iM-Best12(USMV)-Trader: The model’s out of sample performance YTD is 16.9%, and for the last 12 months is 26.1%. Over the same period the benchmark SPY performance was 17.5% and 26.6% respectively. Since inception, on 6/30/2014, the model gained 63.52% while the benchmark SPY gained 41.21% and the ETF USMV gained 158.85% over the same period. Over the previous week the market value of iM-Best12(USMV)-Trader gained 0.51% at a time when SPY gained 0.82%. A starting capital of $100,000 at inception on 6/30/2014 would have grown to $163,520 which includes $231 cash and excludes $3,601 spent on fees and slippage. |
 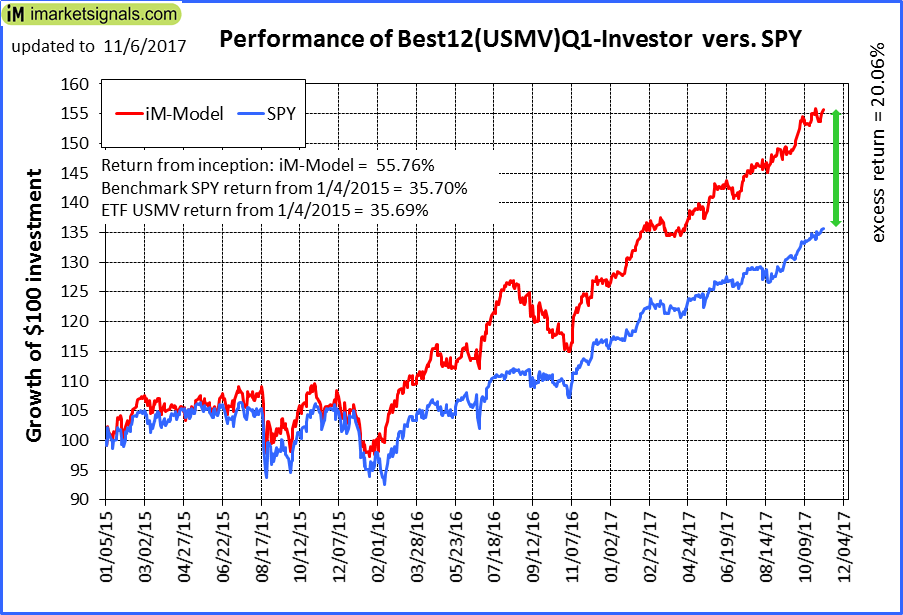 |
iM-Best12(USMV)Q1-Investor: The model’s out of sample performance YTD is 23.8%, and for the last 12 months is 35.5%. Over the same period the benchmark SPY performance was 17.5% and 26.6% respectively. Since inception, on 1/5/2015, the model gained 55.76% while the benchmark SPY gained 35.70% and the ETF USMV gained 35.69% over the same period. Over the previous week the market value of iM-Best12(USMV)Q1 gained 1.32% at a time when SPY gained 0.82%. A starting capital of $100,000 at inception on 1/5/2015 would have grown to $155,667 which includes -$2 cash and excludes $821 spent on fees and slippage. |
 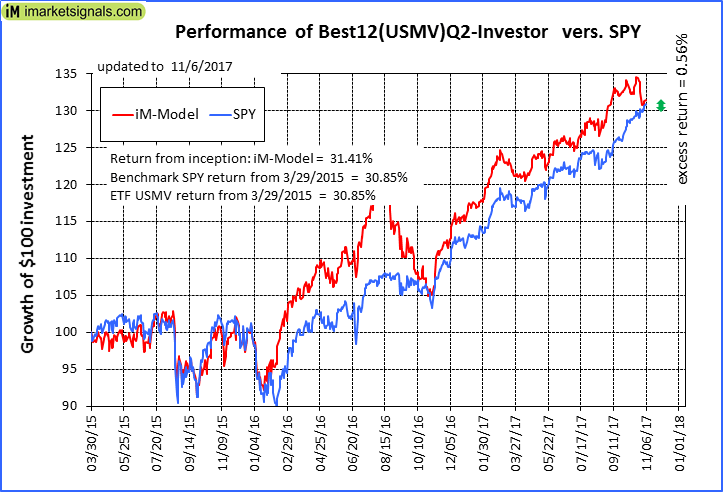 |
iM-Best12(USMV)Q2-Investor: The model’s out of sample performance YTD is 14.2%, and for the last 12 months is 25.2%. Over the same period the benchmark SPY performance was 17.5% and 26.6% respectively. Since inception, on 3/30/2015, the model gained 31.41% while the benchmark SPY gained 30.85% and the ETF USMV gained 30.85% over the same period. Over the previous week the market value of iM-Best12(USMV)Q2 gained 0.50% at a time when SPY gained 0.82%. A starting capital of $100,000 at inception on 3/30/2015 would have grown to $131,381 which includes $44 cash and excludes $724 spent on fees and slippage. |
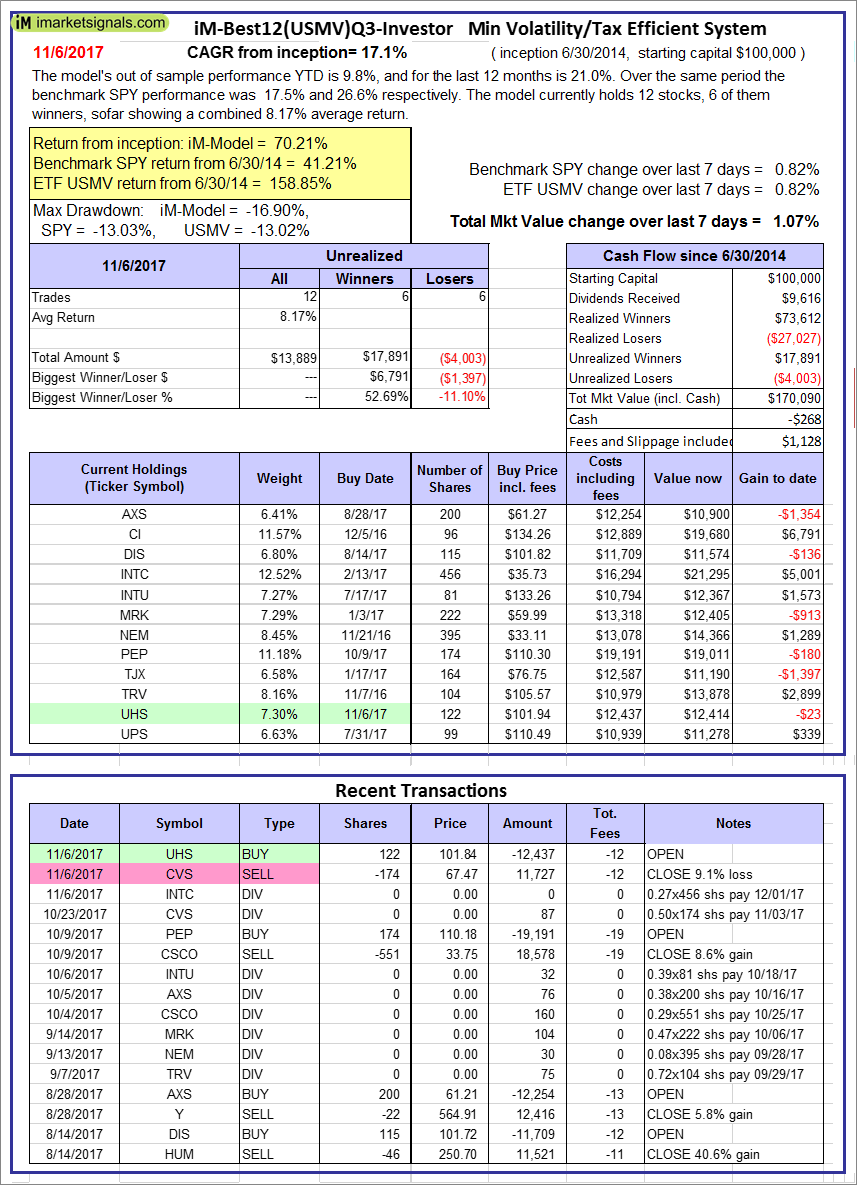  |
iM-Best12(USMV)Q3-Investor: The model’s out of sample performance YTD is 9.8%, and for the last 12 months is 21.0%. Over the same period the benchmark SPY performance was 17.5% and 26.6% respectively. Since inception, on 7/1/2014, the model gained 70.21% while the benchmark SPY gained 41.21% and the ETF USMV gained 158.85% over the same period. Over the previous week the market value of iM-Best12(USMV)Q3 gained 1.07% at a time when SPY gained 0.82%. A starting capital of $100,000 at inception on 7/1/2014 would have grown to $170,090 which includes -$268 cash and excludes $1,128 spent on fees and slippage. |
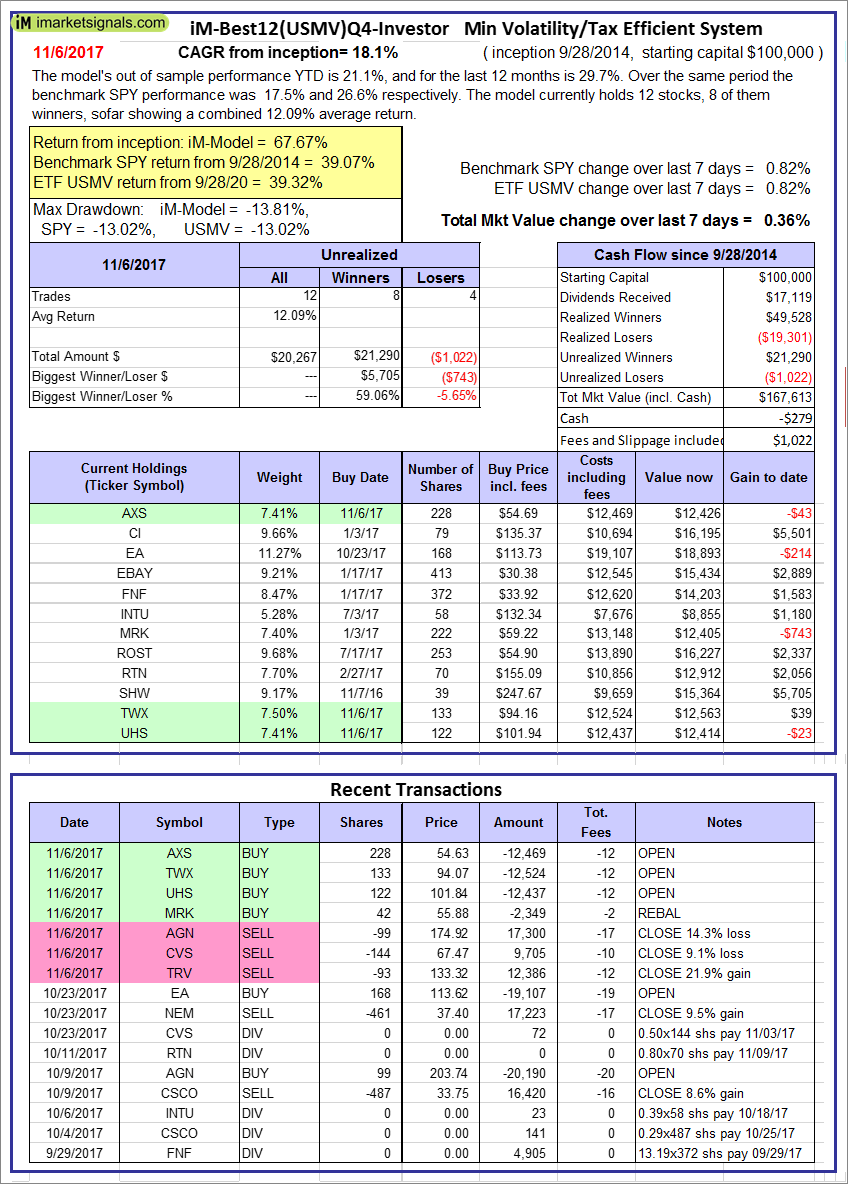 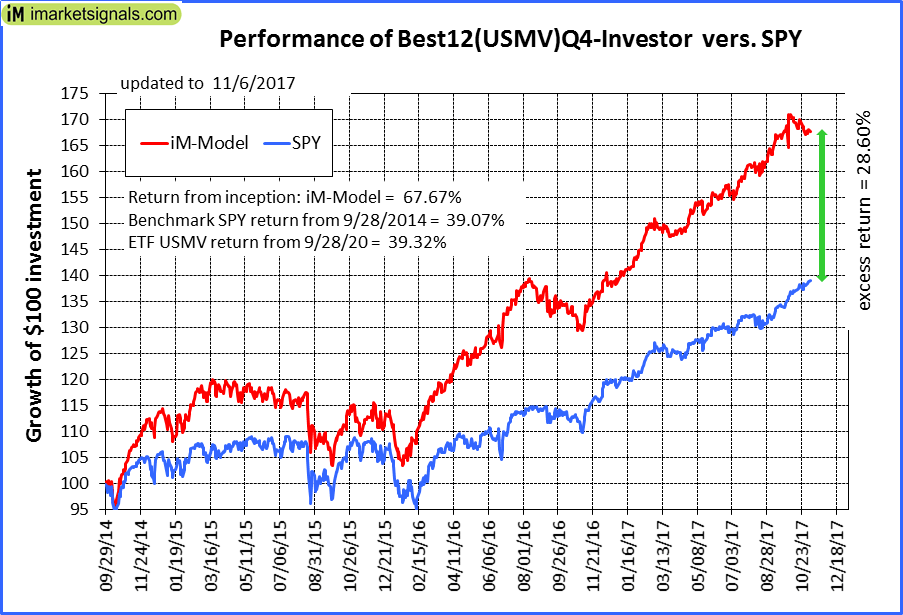 |
iM-Best12(USMV)Q4-Investor: Since inception, on 9/29/2014, the model gained 67.67% while the benchmark SPY gained 39.07% and the ETF USMV gained 39.32% over the same period. Over the previous week the market value of iM-Best12(USMV)Q4 gained 0.36% at a time when SPY gained 0.82%. A starting capital of $100,000 at inception on 9/29/2014 would have grown to $167,613 which includes -$279 cash and excludes $1,022 spent on fees and slippage. |
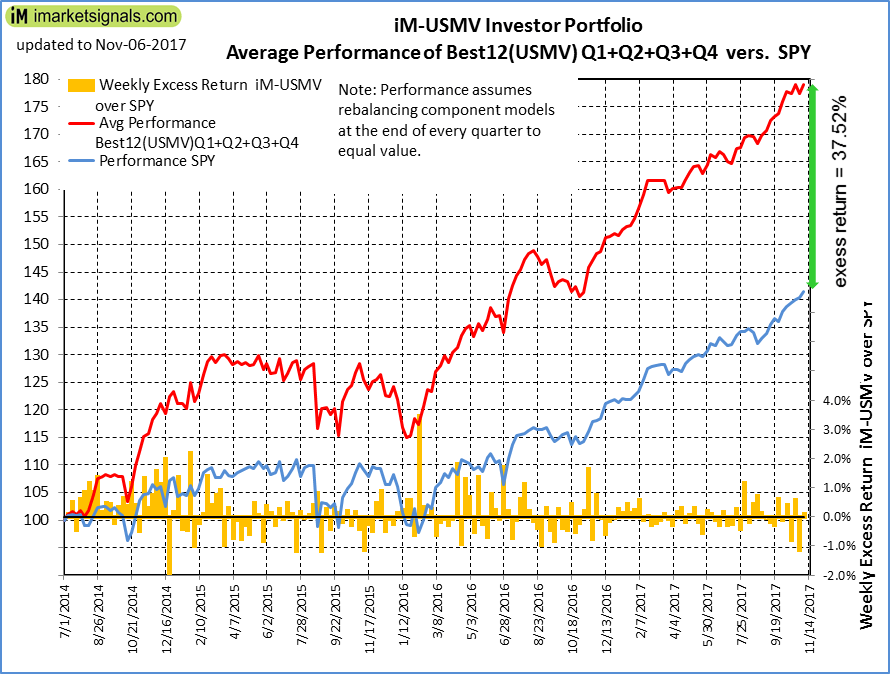 |
Average Performance of iM-Best12(USMV)Q1+Q2+Q3+Q4-Investor resulted in an excess return of 37.52% over SPY. (see iM-USMV Investor Portfolio) |
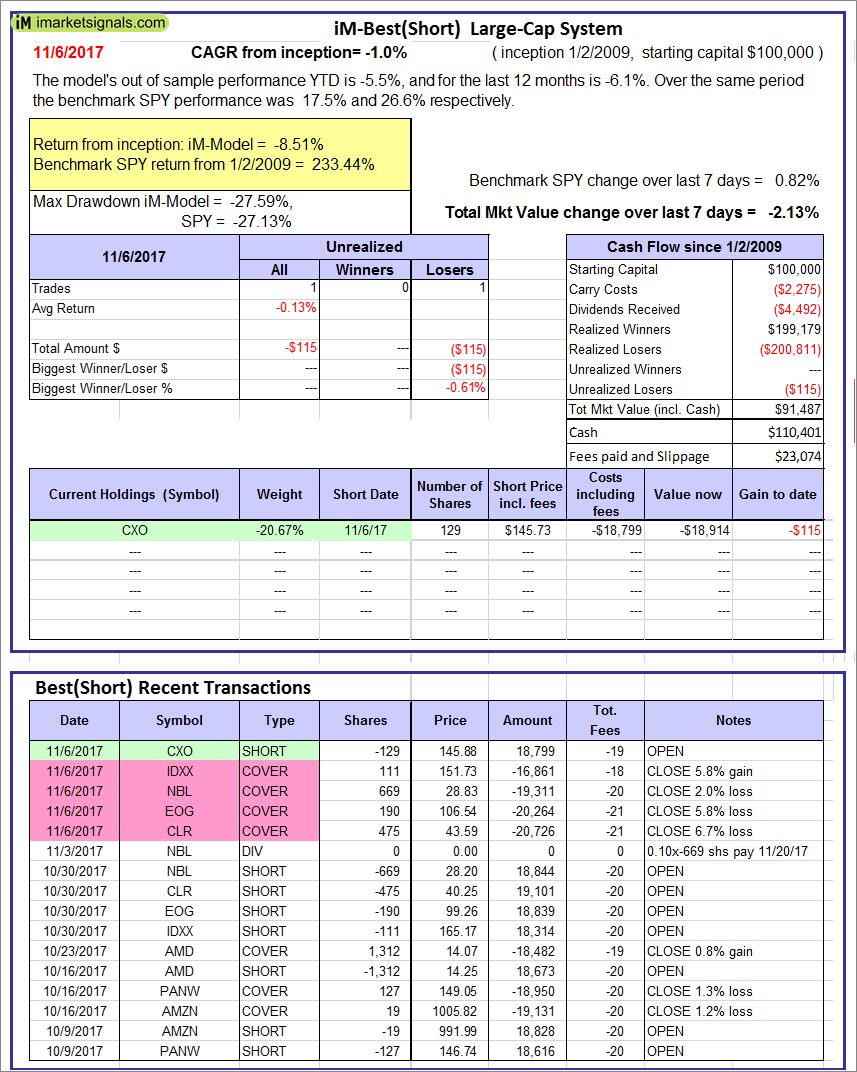 |
iM-Best(Short): The model’s out of sample performance YTD is -5.5%, and for the last 12 months is -6.1%. Over the same period the benchmark SPY performance was 17.5% and 26.6% respectively. Over the previous week the market value of iM-Best(Short) gained -2.13% at a time when SPY gained 0.82%. Over the period 1/2/2009 to 11/6/2017 the starting capital of $100,000 would have grown to $91,487 which includes $110,401 cash and excludes $23,074 spent on fees and slippage. |
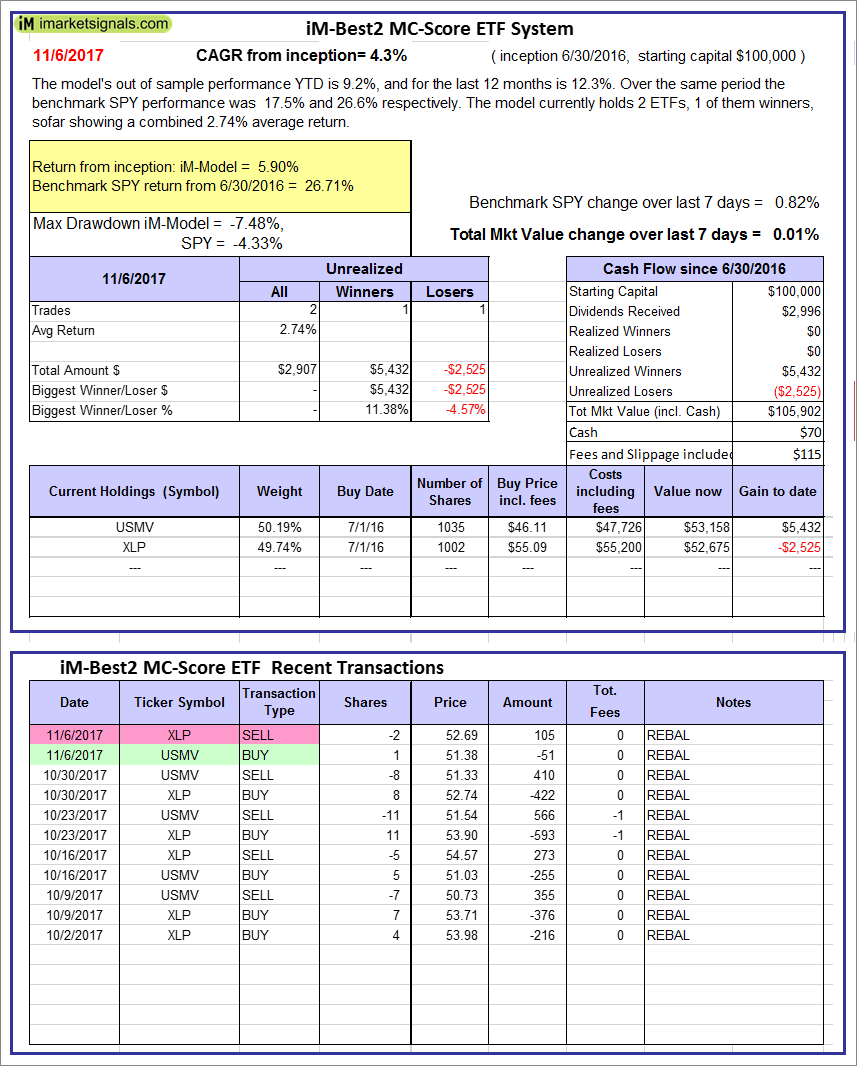 |
iM-Best2 MC-Score ETF System: The model’s out of sample performance YTD is 9.2%, and for the last 12 months is 12.3%. Over the same period the benchmark SPY performance was 17.5% and 26.6% respectively. Over the previous week the market value of the iM-Best2 MC-Score ETF System gained 0.01% at a time when SPY gained 0.82%. A starting capital of $100,000 at inception on 6/30/2016 would have grown to $105,902 which includes $70 cash and excludes $115 spent on fees and slippage. |
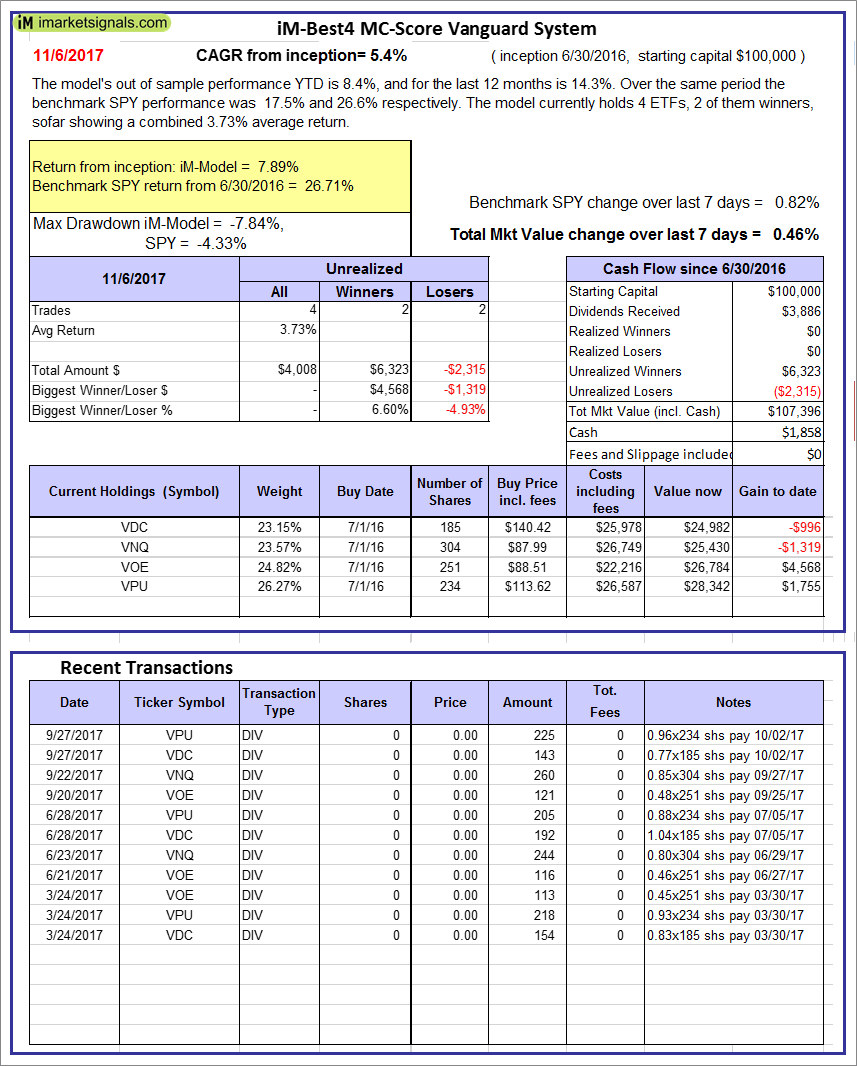 |
iM-Best4 MC-Score Vanguard System: The model’s out of sample performance YTD is 8.4%, and for the last 12 months is 14.3%. Over the same period the benchmark SPY performance was 17.5% and 26.6% respectively. Over the previous week the market value of the iM-Best4 MC-Score Vanguard System gained 0.46% at a time when SPY gained 0.82%. A starting capital of $100,000 at inception on 6/30/2016 would have grown to $107,396 which includes $1,858 cash and excludes $00 spent on fees and slippage. |
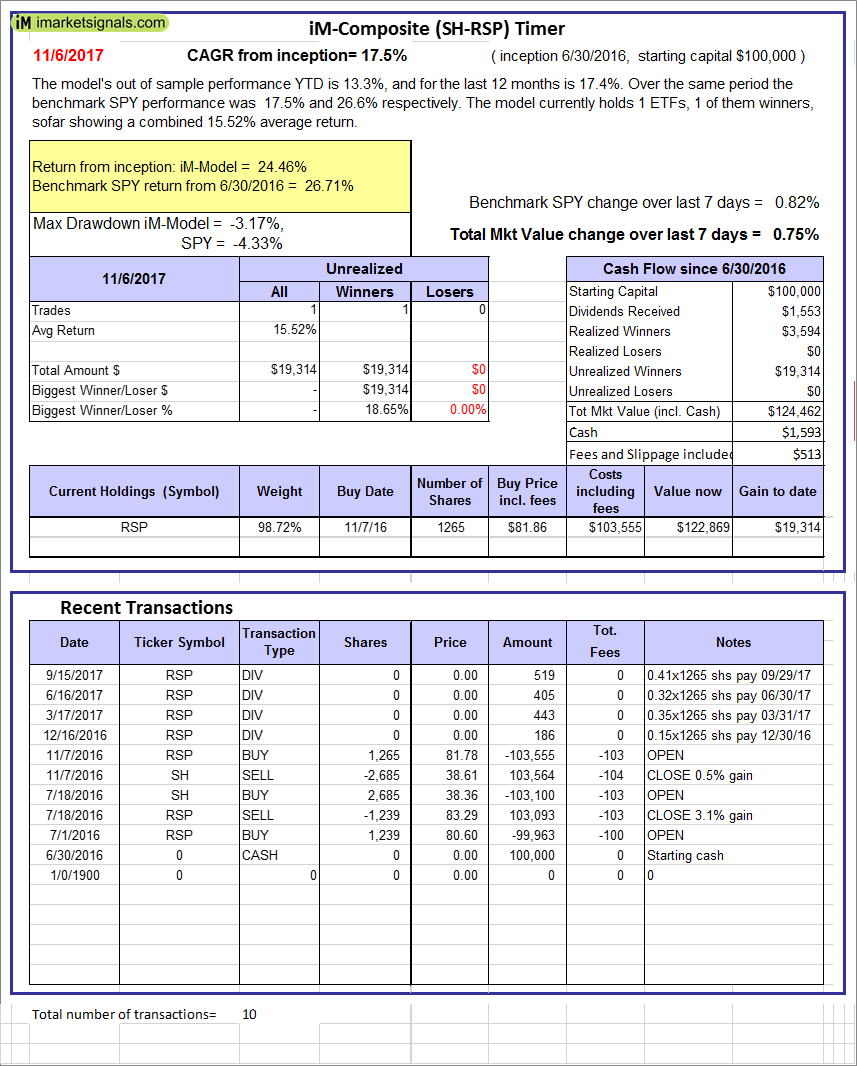 |
iM-Composite (SH-RSP) Timer: The model’s out of sample performance YTD is 13.3%, and for the last 12 months is 17.4%. Over the same period the benchmark SPY performance was 17.5% and 26.6% respectively. Over the previous week the market value of the iM-Composite (SH-RSP) Timer gained 0.75% at a time when SPY gained 0.82%. A starting capital of $100,000 at inception on 6/30/2016 would have grown to $124,462 which includes $1,593 cash and excludes $513 spent on fees and slippage. |
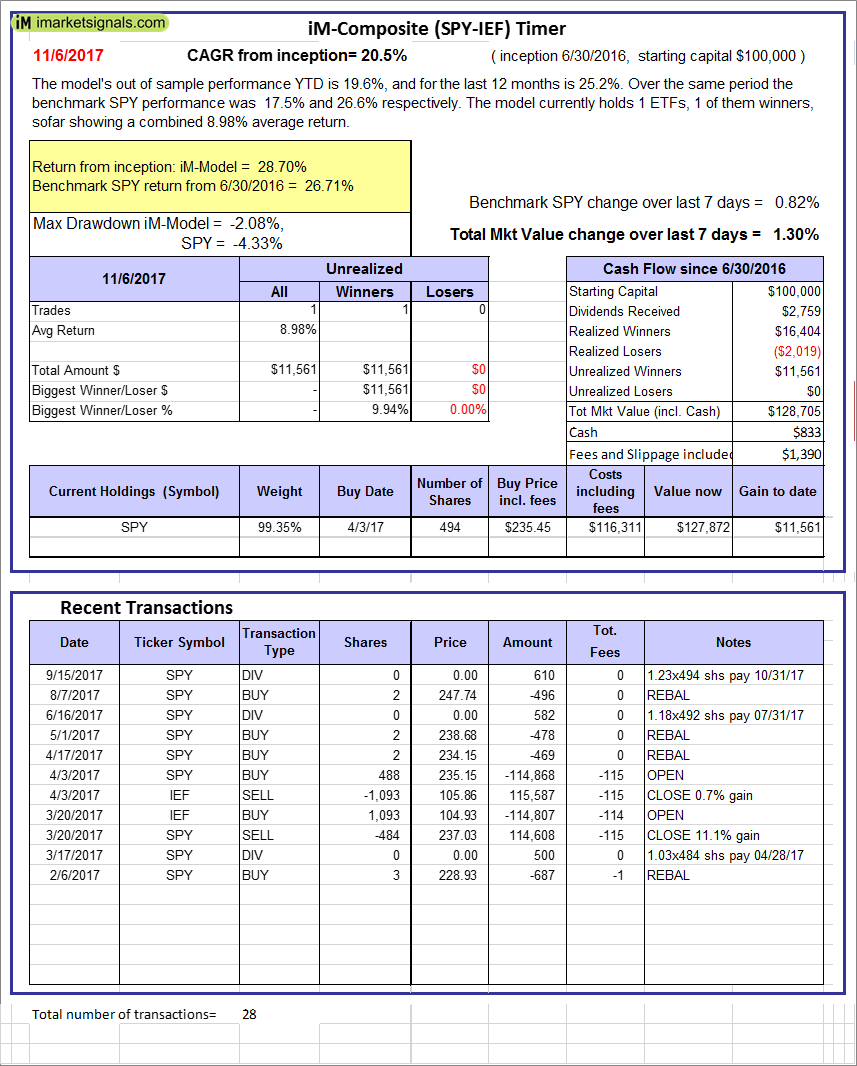 |
iM-Composite (SPY-IEF) Timer: The model’s out of sample performance YTD is 19.6%, and for the last 12 months is 25.2%. Over the same period the benchmark SPY performance was 17.5% and 26.6% respectively. Over the previous week the market value of the iM-Composite (SPY-IEF) Timer gained 1.30% at a time when SPY gained 0.82%. A starting capital of $100,000 at inception on 6/30/2016 would have grown to $128,705 which includes $833 cash and excludes $1,390 spent on fees and slippage. |
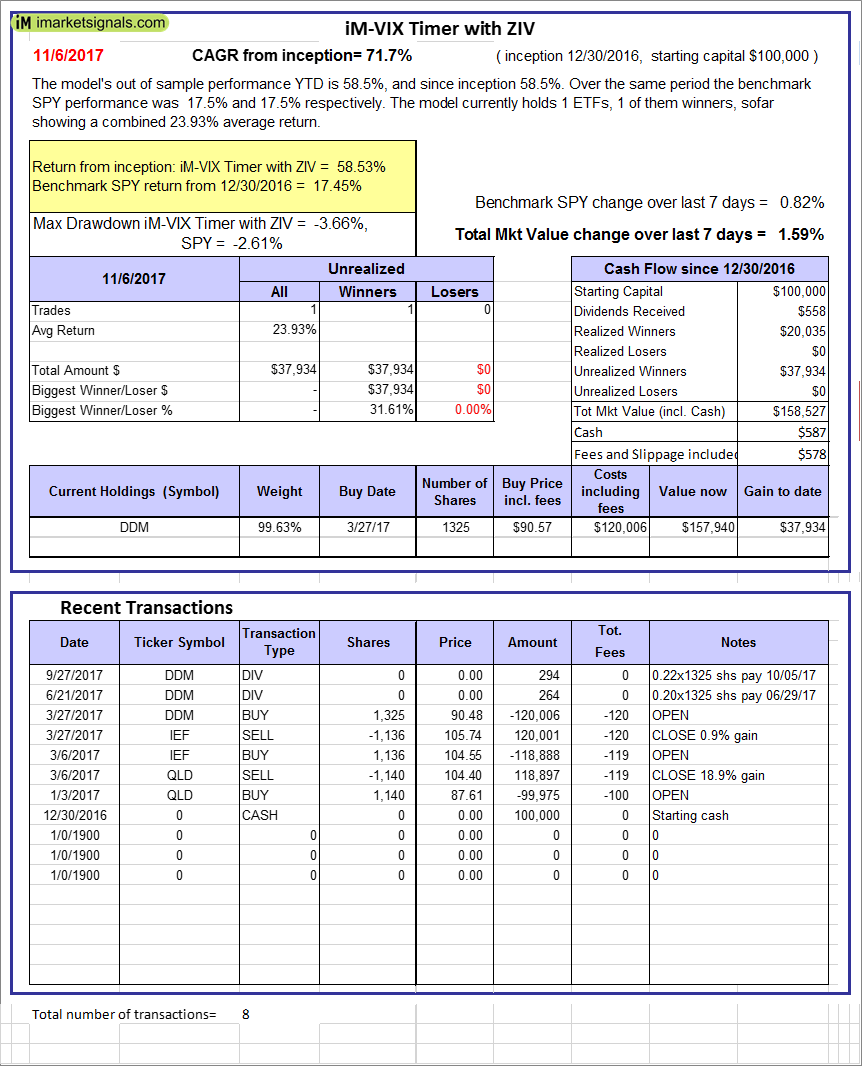 |
iM-VIX Timer with ZIV: The model’s out of sample performance YTD is 58.5%, and since inception 58.5%. Over the same period the benchmark SPY performance was 17.5% and 17.5% respectively. Over the previous week the market value of the iM-VIX Timer with ZIV gained 1.59% at a time when SPY gained 0.82%. A starting capital of $100,000 at inception on 6/30/2016 would have grown to $158,527 which includes $587 cash and excludes $578 spent on fees and slippage. |
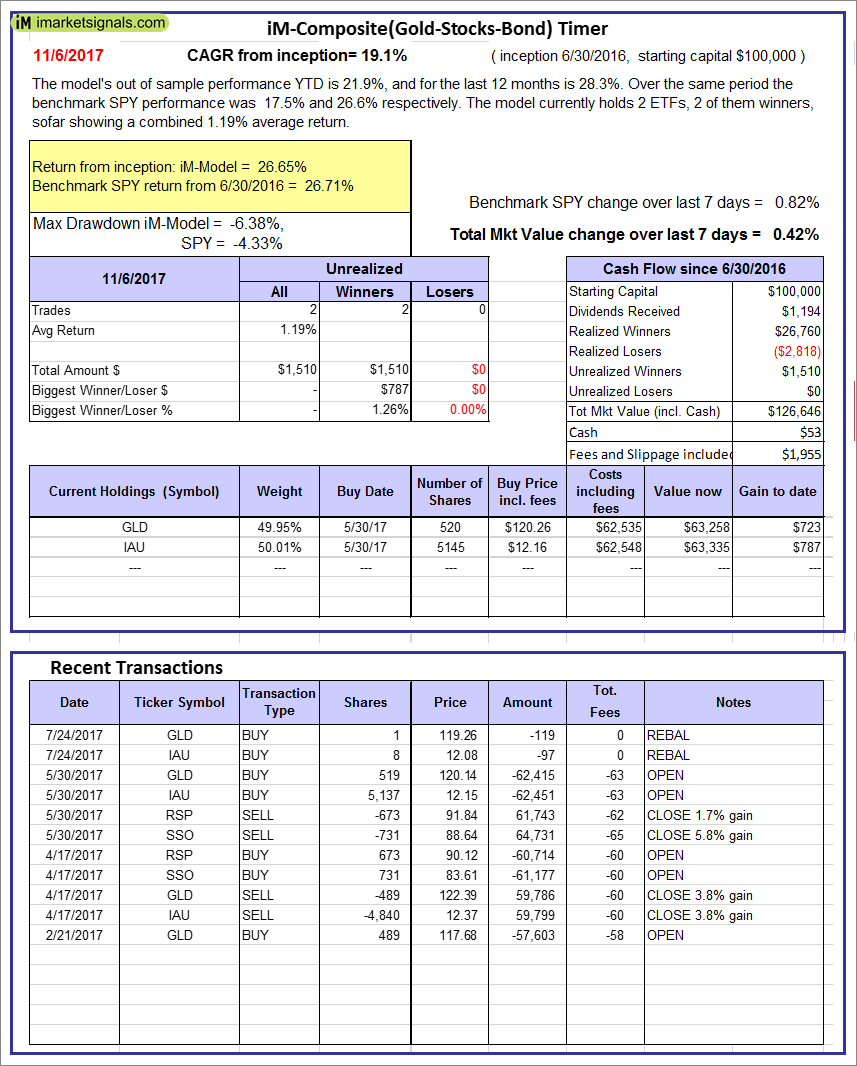 |
iM-Composite(Gold-Stocks-Bond) Timer: The model’s out of sample performance YTD is 21.9%, and for the last 12 months is 28.3%. Over the same period the benchmark SPY performance was 17.5% and 26.6% respectively. Over the previous week the market value of the iM-Composite(Gold-Stocks-Bond) Timer gained 0.42% at a time when SPY gained 0.82%. A starting capital of $100,000 at inception on 6/30/2016 would have grown to $126,646 which includes $53 cash and excludes $1,955 spent on fees and slippage. |
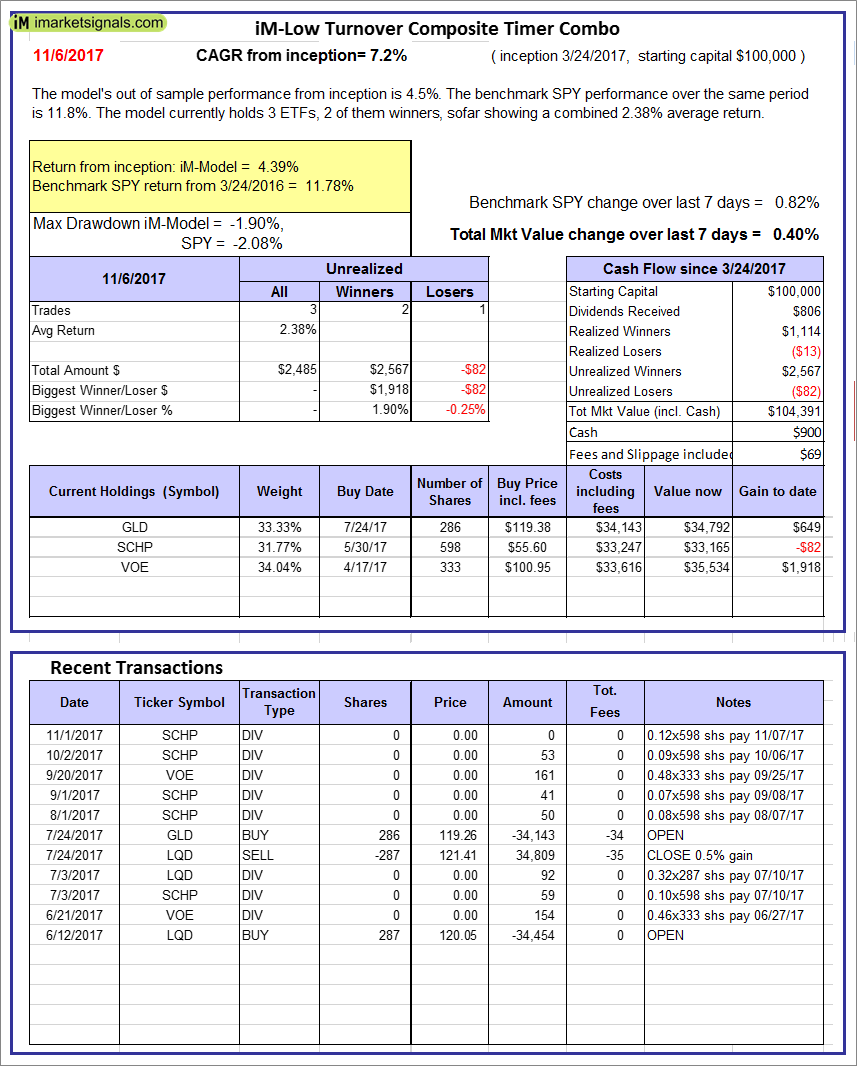 |
iM-Low Turnover Composite Timer Combo: The model’s out of sample performance from inception is 4.5%. The benchmark SPY performance over the same period is 11.8%. Over the previous week the market value of the iM-Low Turnover Composite Timer Combo gained 0.40% at a time when SPY gained 0.82%. A starting capital of $100,000 at inception on 3/24/27 would have grown to $104,391 which includes $900 cash and excludes $69 spent on fees and slippage. |
 |
iM-Min Drawdown Combo: The model’s out of sample performance from inception is 3.2%. The benchmark SPY performance over the same period is 11.3%. Over the previous week the market value of the iM-Min Drawdown Combo gained -0.31% at a time when SPY gained 0.82%. A starting capital of $100,000 at inception on 4/5/2017 would have grown to $103,150 which includes $1,404 cash and excludes $103 spent on fees and slippage. |
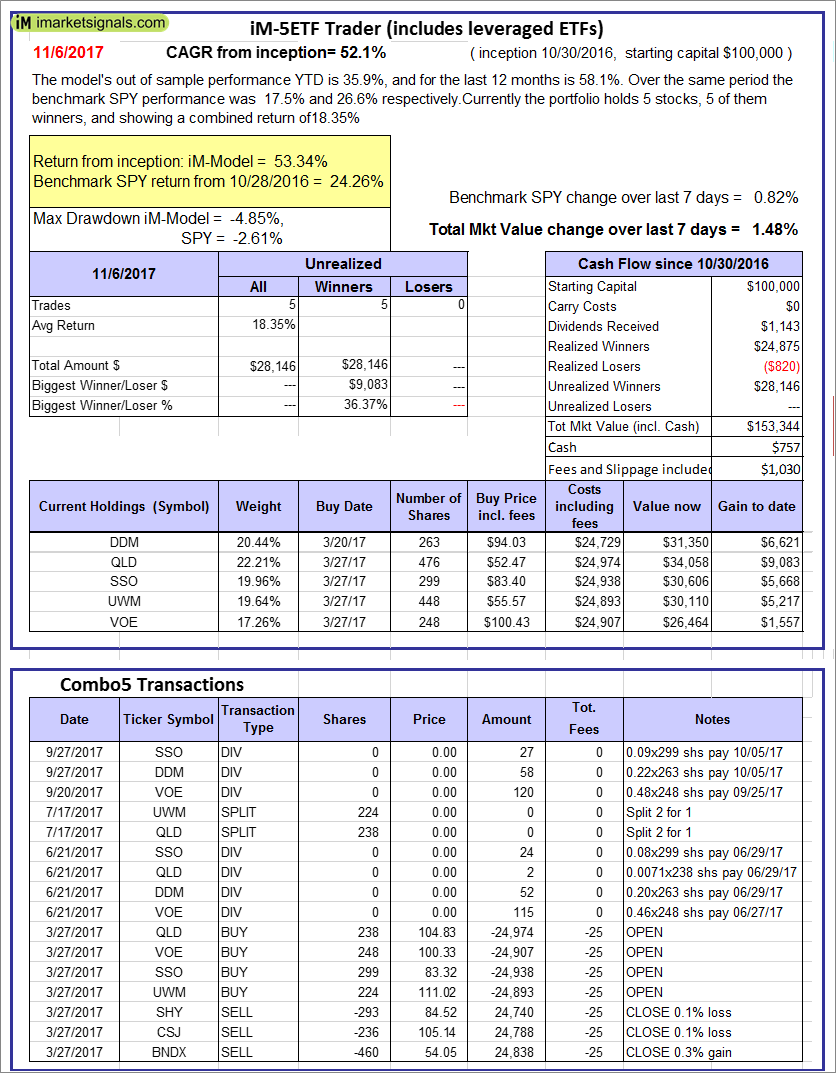 |
iM-5ETF Trader (includes leveraged ETFs): The model’s out of sample performance YTD is 35.9%, and for the last 12 months is 58.1%. Over the same period the benchmark SPY performance was 17.5% and 26.6% respectively. Over the previous week the market value of the iM-5ETF Trader (includes leveraged ETFs) gained 1.48% at a time when SPY gained 0.82%. A starting capital of $100,000 at inception on 10/30/2016 would have grown to $153,344 which includes $757 cash and excludes $1,030 spent on fees and slippage. |
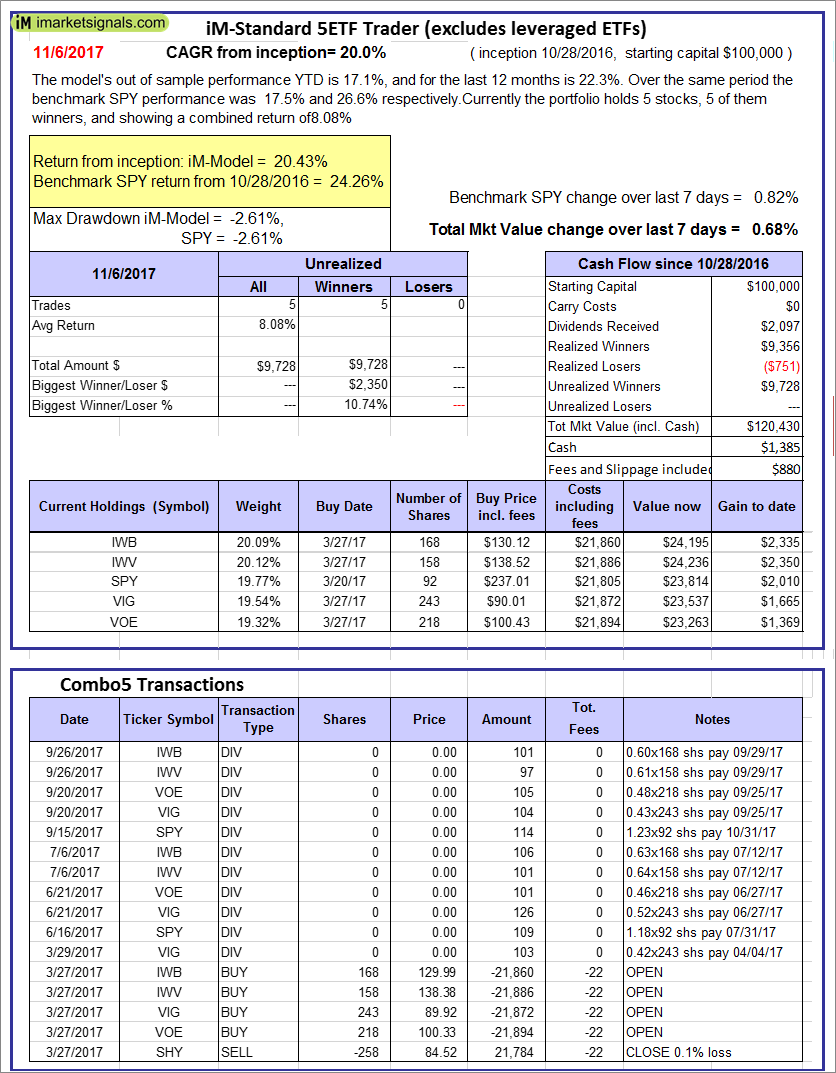 |
iM-Standard 5ETF Trader (excludes leveraged ETFs): The model’s out of sample performance YTD is 17.1%, and for the last 12 months is 22.3%. Over the same period the benchmark SPY performance was 17.5% and 26.6% respectively. Over the previous week the market value of the iM-Standard 5ETF Trader (excludes leveraged ETFs) gained 0.68% at a time when SPY gained 0.82%. A starting capital of $100,000 at inception on 10/30/2016 would have grown to $120,430 which includes $1,385 cash and excludes $880 spent on fees and slippage. |
iM-Best Reports – 11/6/2017
Posted in pmp SPY-SH
Leave a Reply
You must be logged in to post a comment.