  |
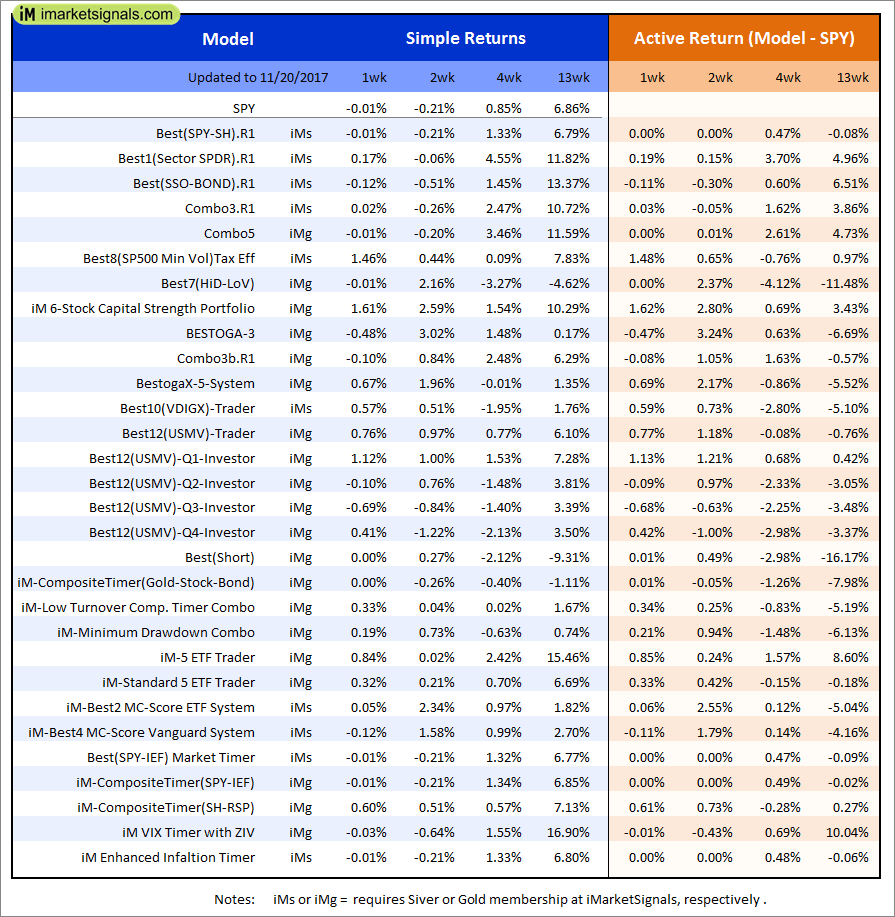
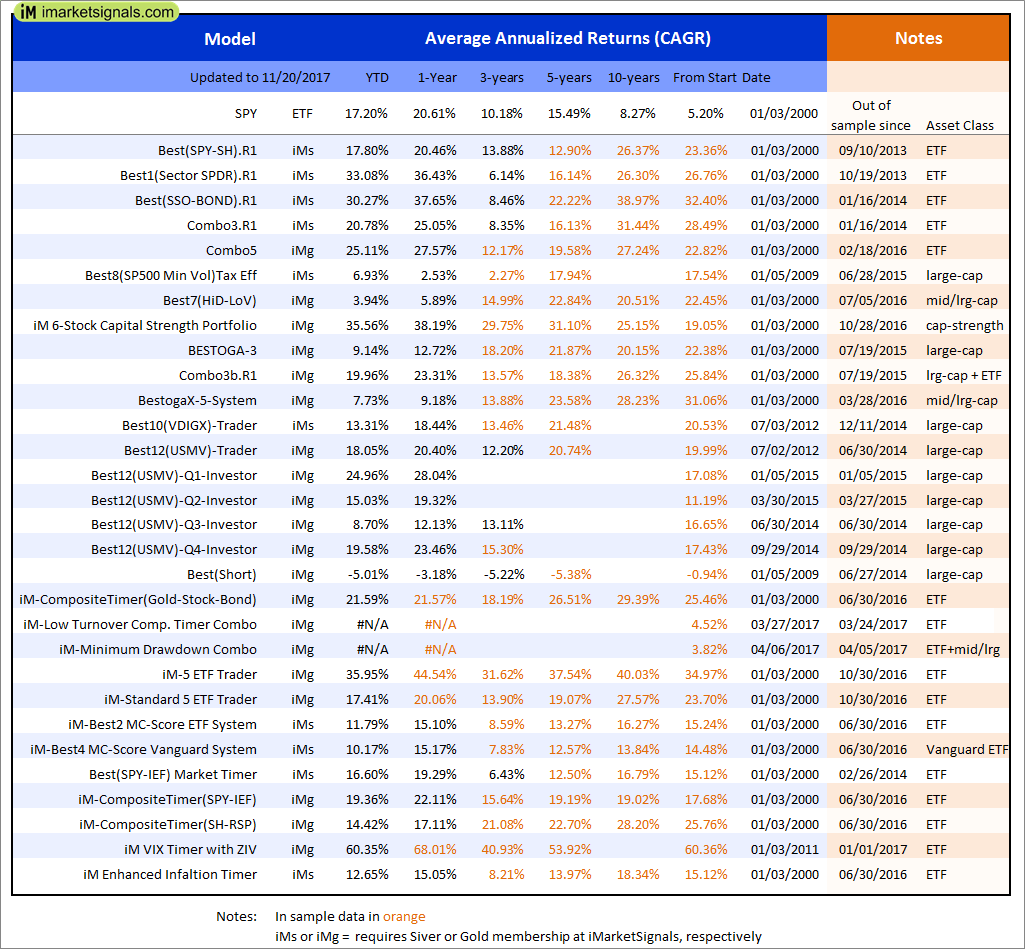
Out of sample performance summary of our models for the past 1, 2, 4 and 13 week periods. The active active return indicates how the models over- or underperformed the benchmark ETF SPY. Also the YTD, and the 1-, 3-, 5- and 10-year annualized returns are shown in the second table |
|
|
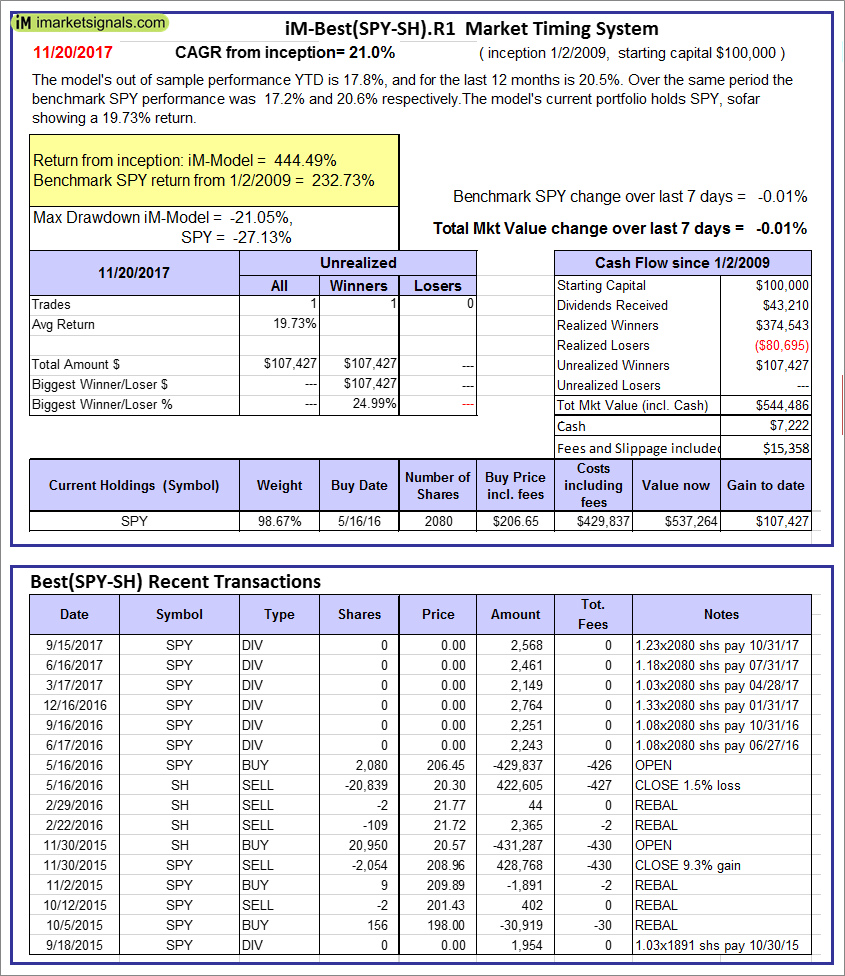
iM-Best(SPY-SH).R1: The model’s out of sample performance YTD is 17.8%, and for the last 12 months is 20.5%. Over the same period the benchmark SPY performance was 17.2% and 20.6% respectively. Over the previous week the market value of Best(SPY-SH) gained -0.01% at a time when SPY gained -0.01%. A starting capital of $100,000 at inception on 1/2/2009 would have grown to $544,486 which includes $7,222 cash and excludes $15,358 spent on fees and slippage. |
|
|
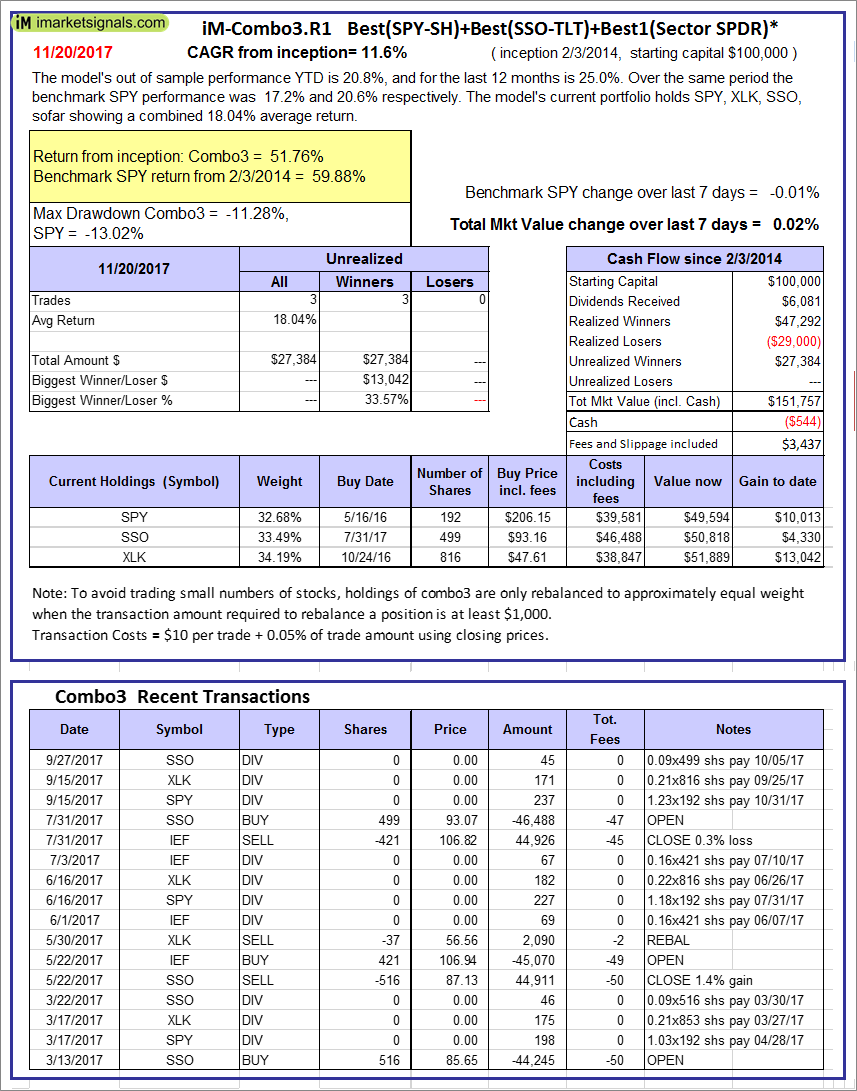
iM-Combo3.R1: The model’s out of sample performance YTD is 20.8%, and for the last 12 months is 25.0%. Over the same period the benchmark SPY performance was 17.2% and 20.6% respectively. Over the previous week the market value of iM-Combo3.R1 gained 0.02% at a time when SPY gained -0.01%. A starting capital of $100,000 at inception on 2/3/2014 would have grown to $151,757 which includes -$544 cash and excludes $3,437 spent on fees and slippage. |
|
|
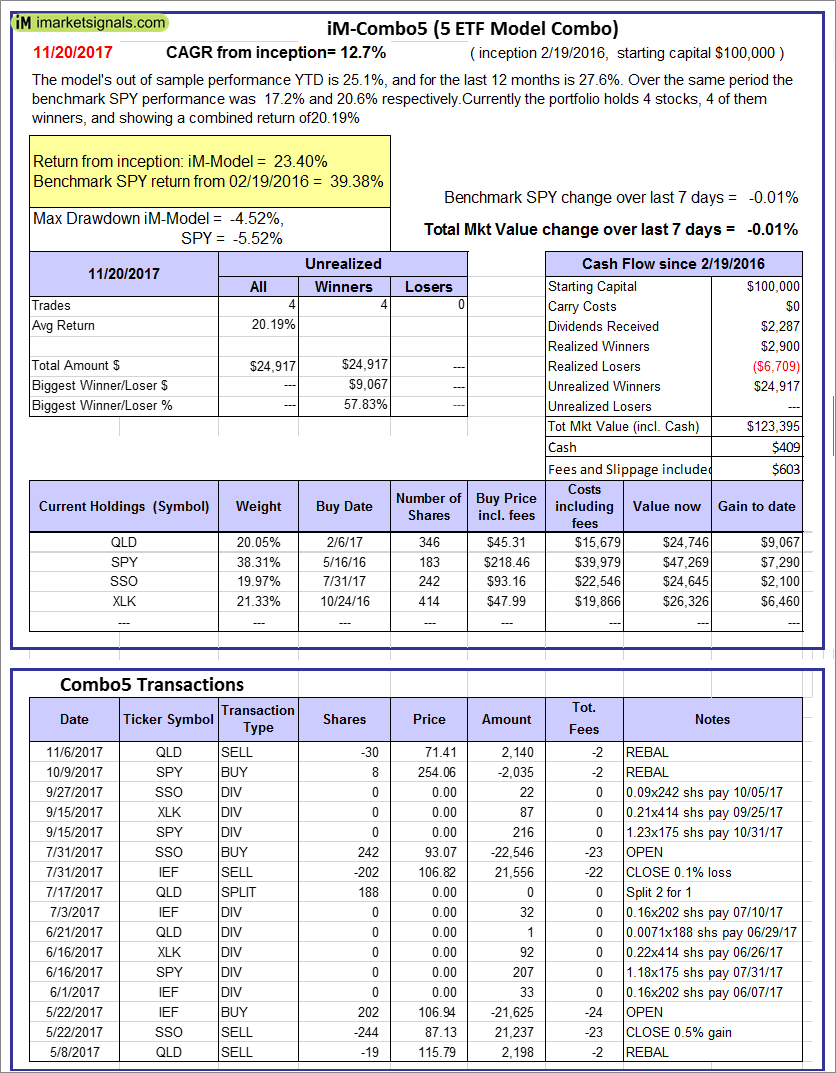
iM-Combo5: The model’s out of sample performance YTD is 25.1%, and for the last 12 months is 27.6%. Over the same period the benchmark SPY performance was 17.2% and 20.6% respectively. Over the previous week the market value of iM-Combo5 gained -0.01% at a time when SPY gained -0.01%. A starting capital of $100,000 at inception on 2/22/2016 would have grown to $123,395 which includes $409 cash and excludes $603 spent on fees and slippage. |
|
|
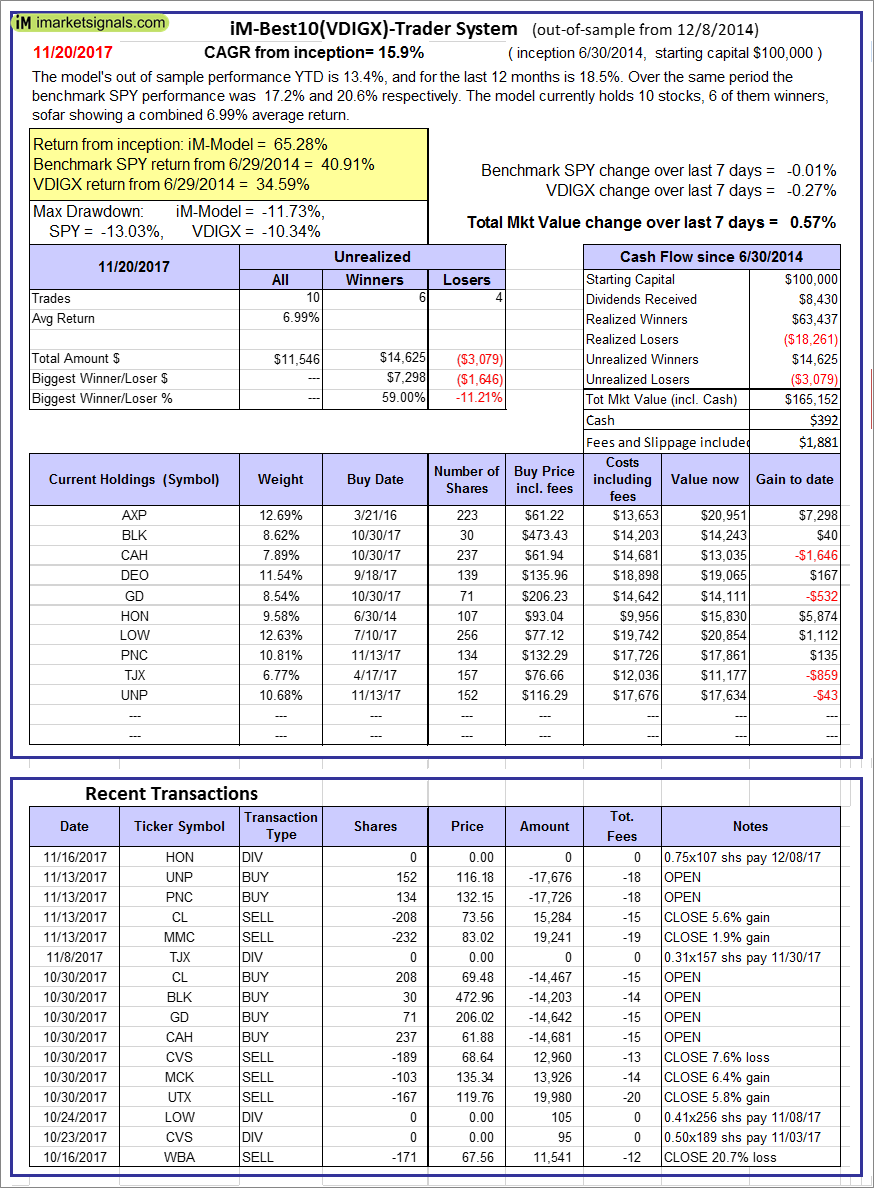
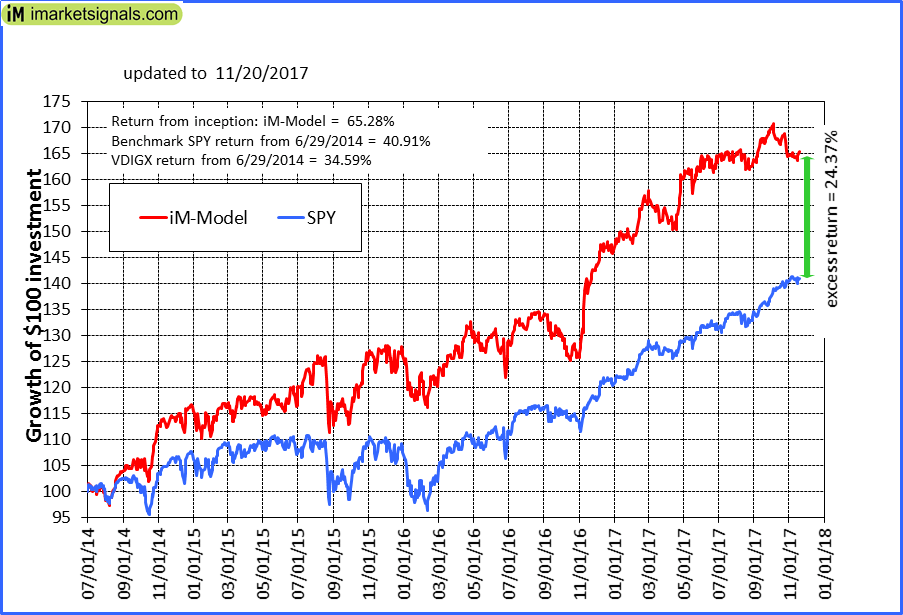
iM-Best10(VDIGX)-Trader: The model’s out of sample performance YTD is 13.4%, and for the last 12 months is 18.5%. Over the same period the benchmark SPY performance was 17.2% and 20.6% respectively. Since inception, on 7/1/2014, the model gained 65.28% while the benchmark SPY gained 40.91% and VDIGX gained 34.59% over the same period. Over the previous week the market value of iM-Best10(VDIGX) gained 0.57% at a time when SPY gained -0.01%. A starting capital of $100,000 at inception on 7/1/2014 would have grown to $165,152 which includes $392 cash and excludes $1,881 spent on fees and slippage. |
|
|
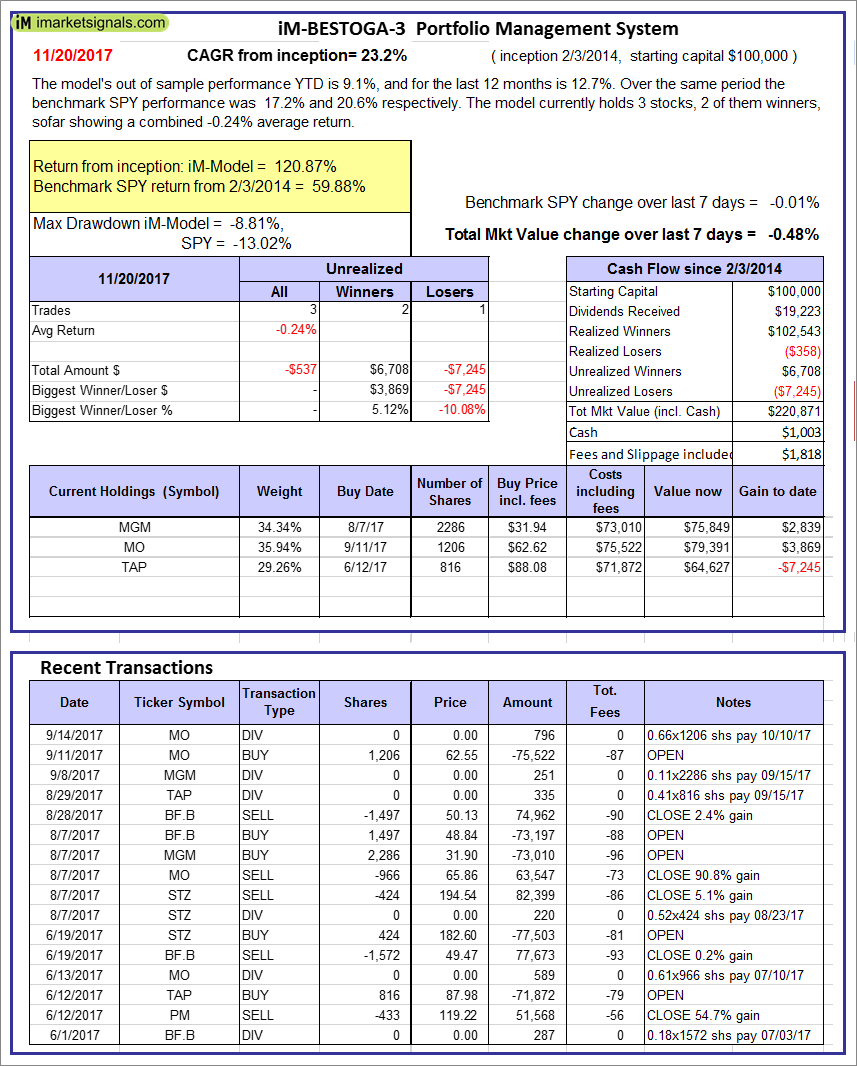
iM-BESTOGA-3: The model’s out of sample performance YTD is 9.1%, and for the last 12 months is 12.7%. Over the same period the benchmark SPY performance was 17.2% and 20.6% respectively. Over the previous week the market value of iM-BESTOGA-3 gained -0.48% at a time when SPY gained -0.01%. A starting capital of $100,000 at inception on 2/3/2014 would have grown to $220,871 which includes $1,003 cash and excludes $1,818 spent on fees and slippage. |
|
|
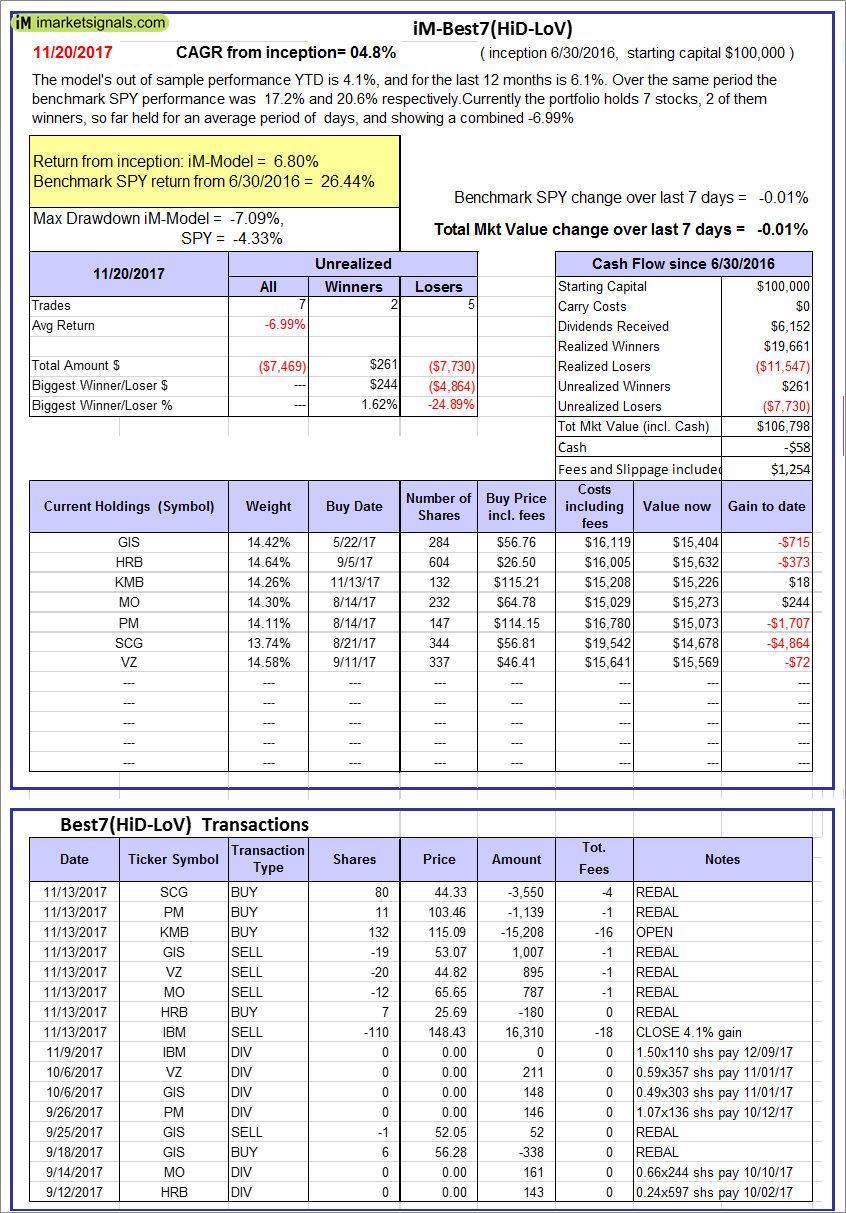
iM-Best7(HiD-LoV): The model’s out of sample performance YTD is 4.1%, and for the last 12 months is 6.1%. Over the same period the benchmark SPY performance was 17.2% and 20.6% respectively. Over the previous week the market value of iM-BESTOGA-3 gained -0.01% at a time when SPY gained -0.01%. A starting capital of $100,000 at inception on 6/30/2016 would have grown to $106,798 which includes -$58 cash and excludes $1,254 spent on fees and slippage. |
|
|
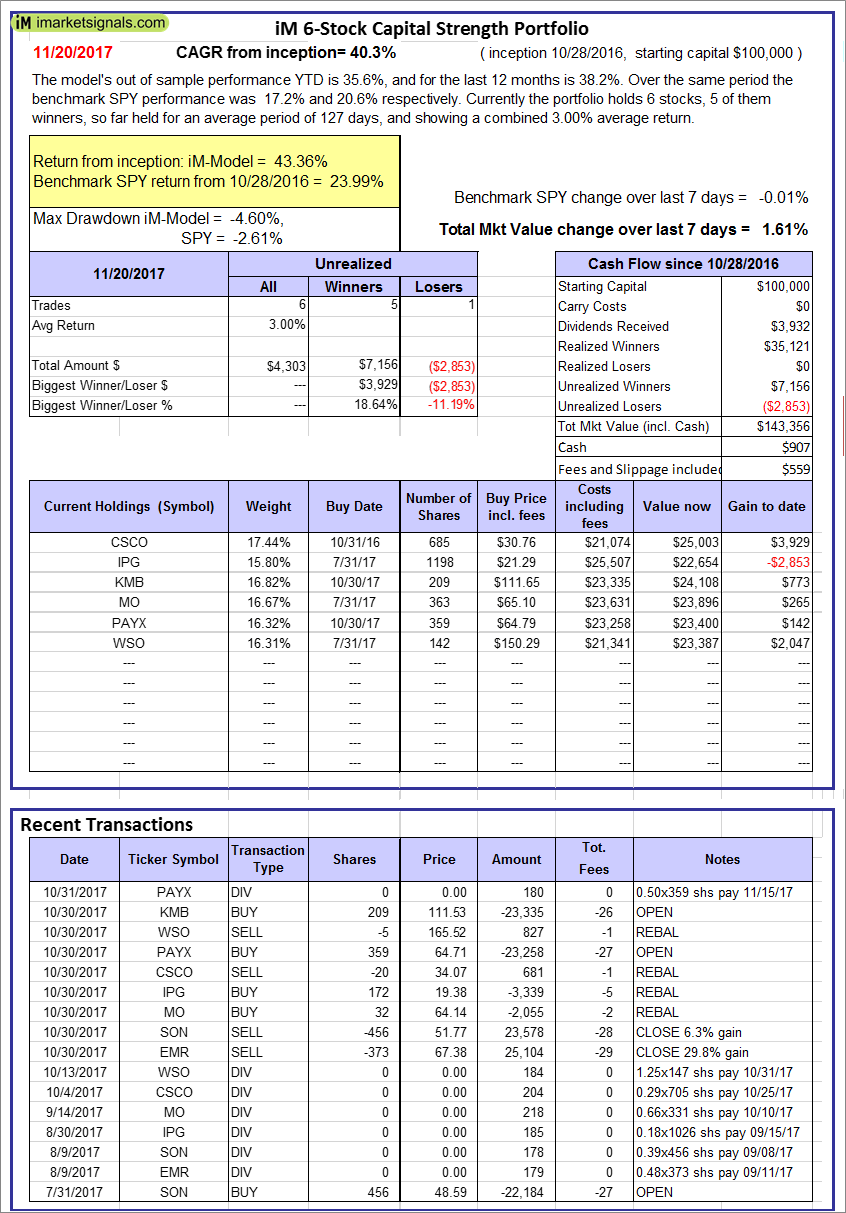
iM 6-Stock Capital Strength Portfolio: The model’s out of sample performance YTD is 35.6%, and for the last 12 months is 38.2%. Over the same period the benchmark SPY performance was 17.2% and 20.6% respectively. Over the previous week the market value of the iM 6-Stock Capital Strength Portfolio gained 1.61% at a time when SPY gained -0.01%. A starting capital of $100,000 at inception on 10/28/2016 would have grown to $143,356 which includes $907 cash and excludes $559 spent on fees and slippage. |
|
|
iM-BestogaX5-System: The model’s out of sample performance YTD is 8.1%, and for the last 12 months is 9.6%. Over the same period the benchmark SPY performance was 17.2% and 20.6% respectively. Over the previous week the market value of iM-Best8(S&P 500)Tax-Eff. gained 0.67% at a time when SPY gained -0.01%. A starting capital of $100,000 at inception on 3/28/2016 would have grown to $106,179 which includes $684 cash and excludes $881 spent on fees and slippage. |
|
|
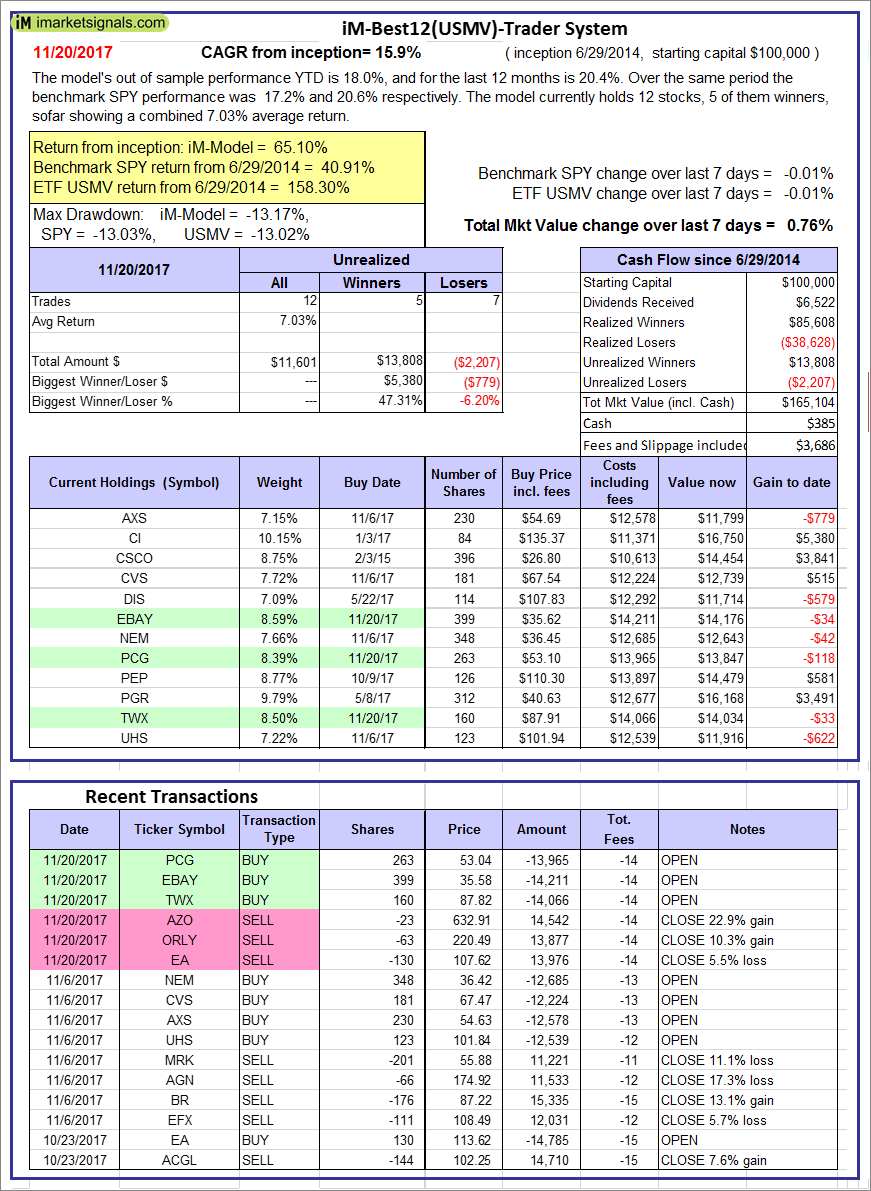
iM-Best12(USMV)-Trader: The model’s out of sample performance YTD is 18.0%, and for the last 12 months is 20.4%. Over the same period the benchmark SPY performance was 17.2% and 20.6% respectively. Since inception, on 6/30/2014, the model gained 65.10% while the benchmark SPY gained 40.91% and the ETF USMV gained 158.30% over the same period. Over the previous week the market value of iM-Best12(USMV)-Trader gained 0.76% at a time when SPY gained -0.01%. A starting capital of $100,000 at inception on 6/30/2014 would have grown to $165,104 which includes $385 cash and excludes $3,686 spent on fees and slippage. |
|
|
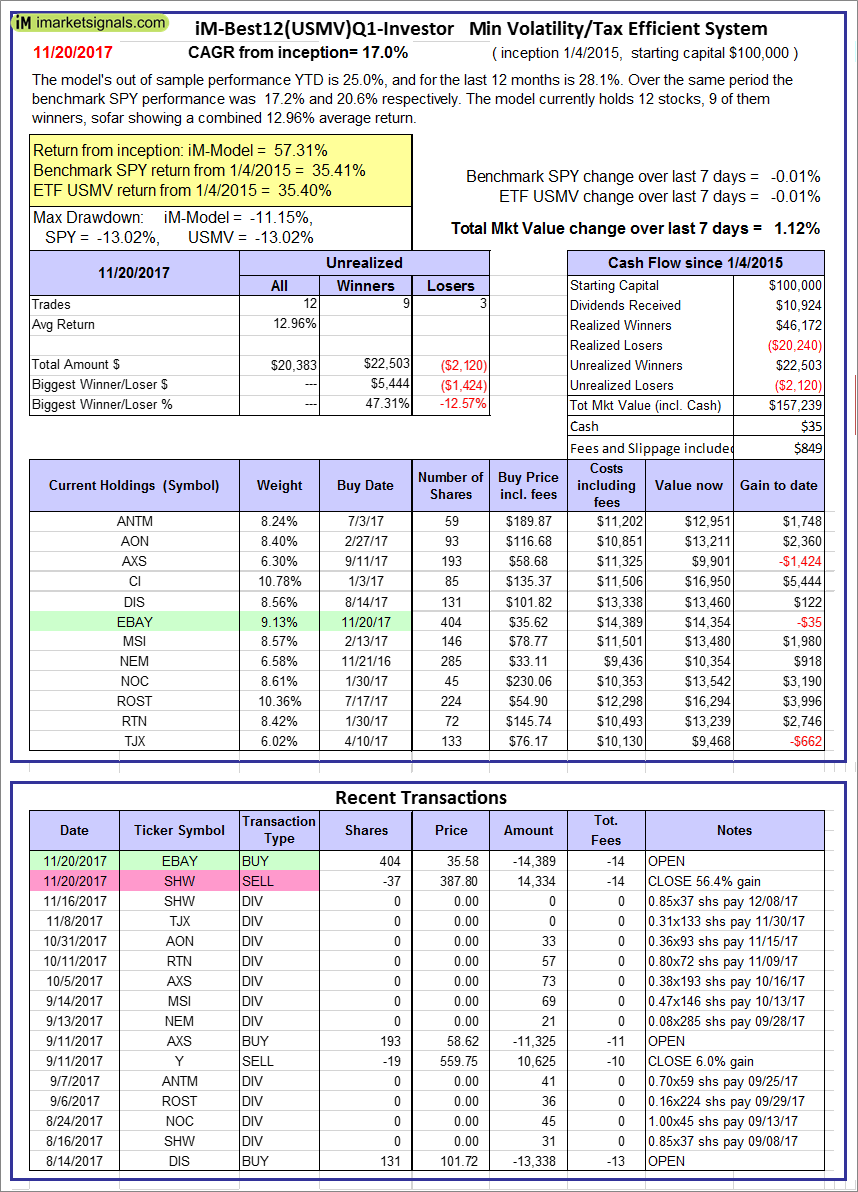
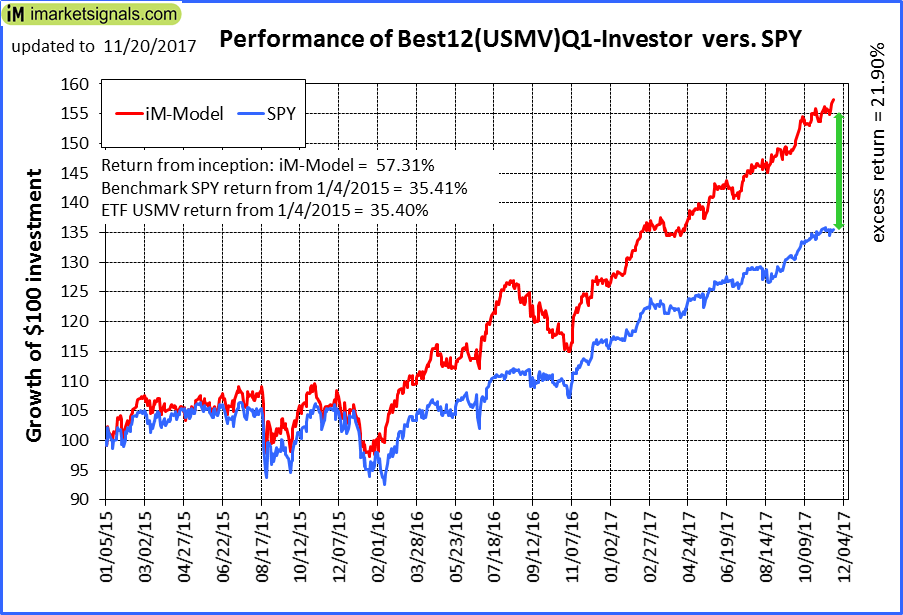
iM-Best12(USMV)Q1-Investor: The model’s out of sample performance YTD is 25.0%, and for the last 12 months is 28.1%. Over the same period the benchmark SPY performance was 17.2% and 20.6% respectively. Since inception, on 1/5/2015, the model gained 57.31% while the benchmark SPY gained 35.41% and the ETF USMV gained 35.40% over the same period. Over the previous week the market value of iM-Best12(USMV)Q1 gained 1.12% at a time when SPY gained -0.01%. A starting capital of $100,000 at inception on 1/5/2015 would have grown to $157,239 which includes $35 cash and excludes $849 spent on fees and slippage. |
|
|
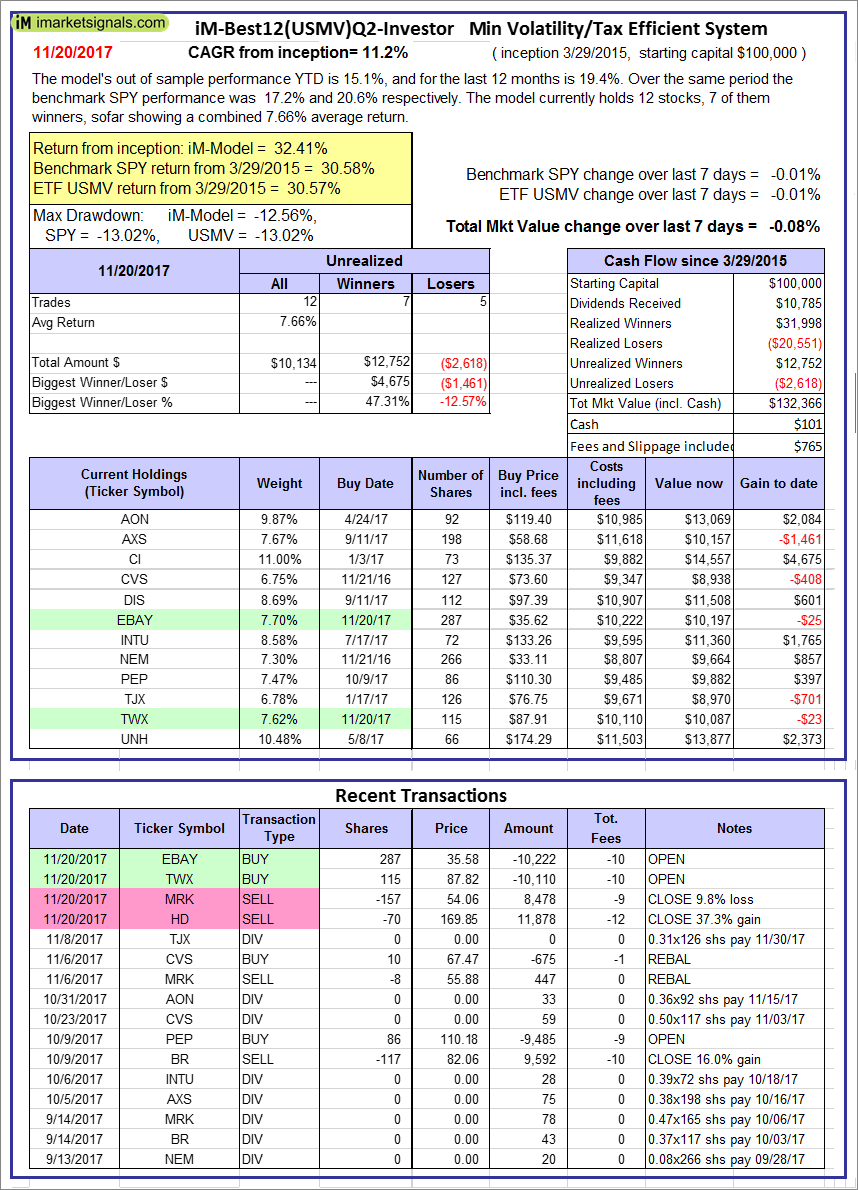
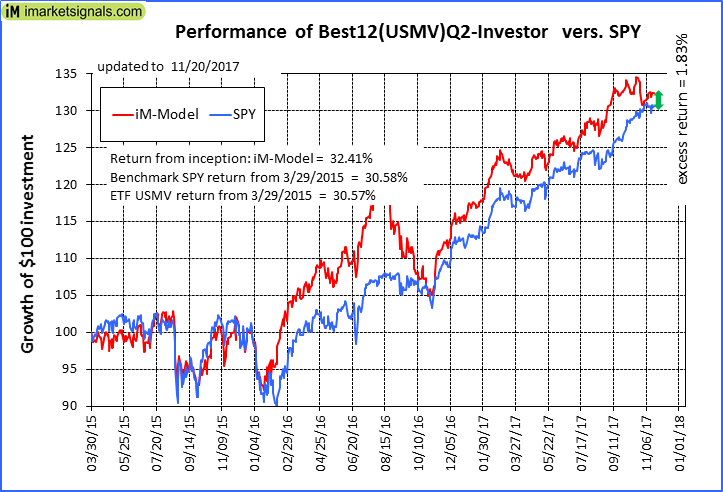
iM-Best12(USMV)Q2-Investor: The model’s out of sample performance YTD is 15.1%, and for the last 12 months is 19.4%. Over the same period the benchmark SPY performance was 17.2% and 20.6% respectively. Since inception, on 3/30/2015, the model gained 32.41% while the benchmark SPY gained 30.58% and the ETF USMV gained 30.57% over the same period. Over the previous week the market value of iM-Best12(USMV)Q2 gained -0.08% at a time when SPY gained -0.01%. A starting capital of $100,000 at inception on 3/30/2015 would have grown to $132,366 which includes $101 cash and excludes $765 spent on fees and slippage. |
|
|
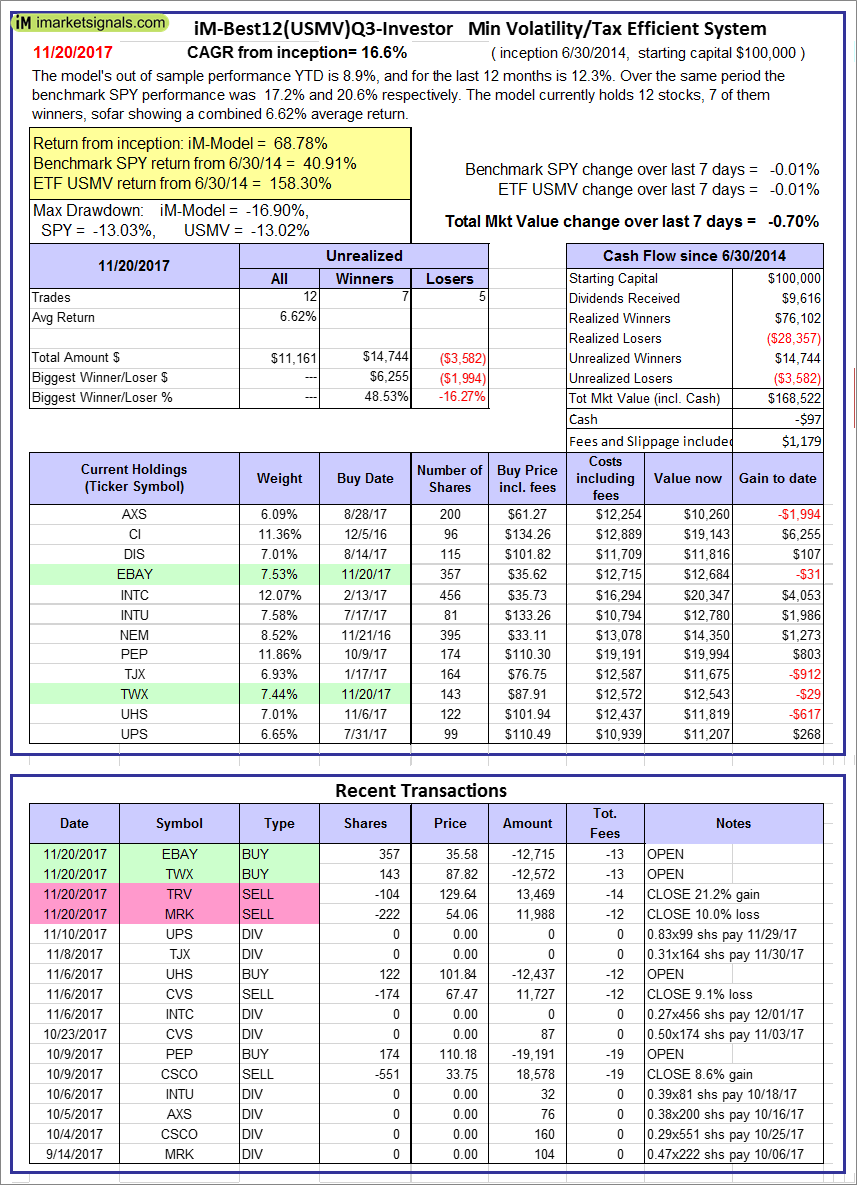
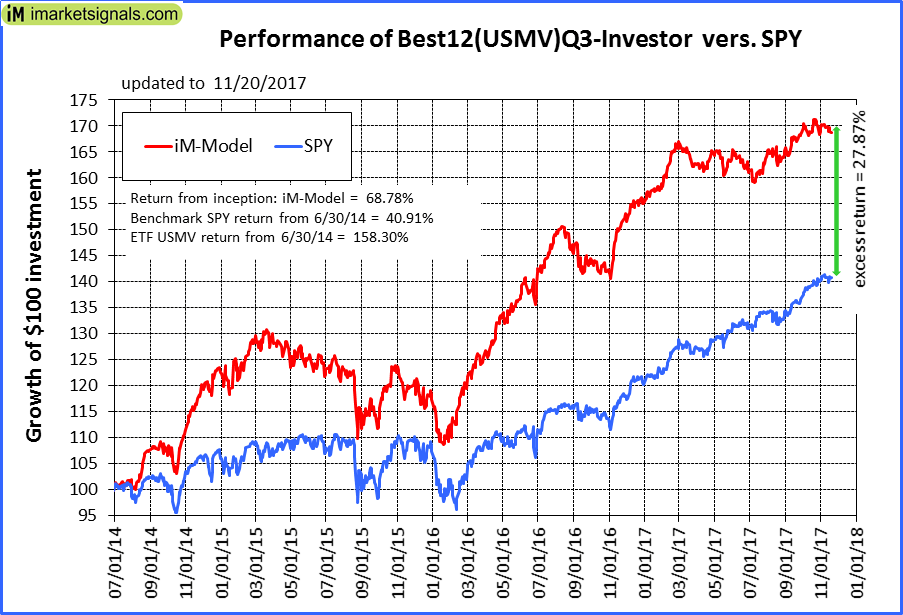
iM-Best12(USMV)Q3-Investor: The model’s out of sample performance YTD is 8.9%, and for the last 12 months is 12.3%. Over the same period the benchmark SPY performance was 17.2% and 20.6% respectively. Since inception, on 7/1/2014, the model gained 68.78% while the benchmark SPY gained 40.91% and the ETF USMV gained 158.30% over the same period. Over the previous week the market value of iM-Best12(USMV)Q3 gained -0.70% at a time when SPY gained -0.01%. A starting capital of $100,000 at inception on 7/1/2014 would have grown to $168,522 which includes -$97 cash and excludes $1,179 spent on fees and slippage. |
|
|
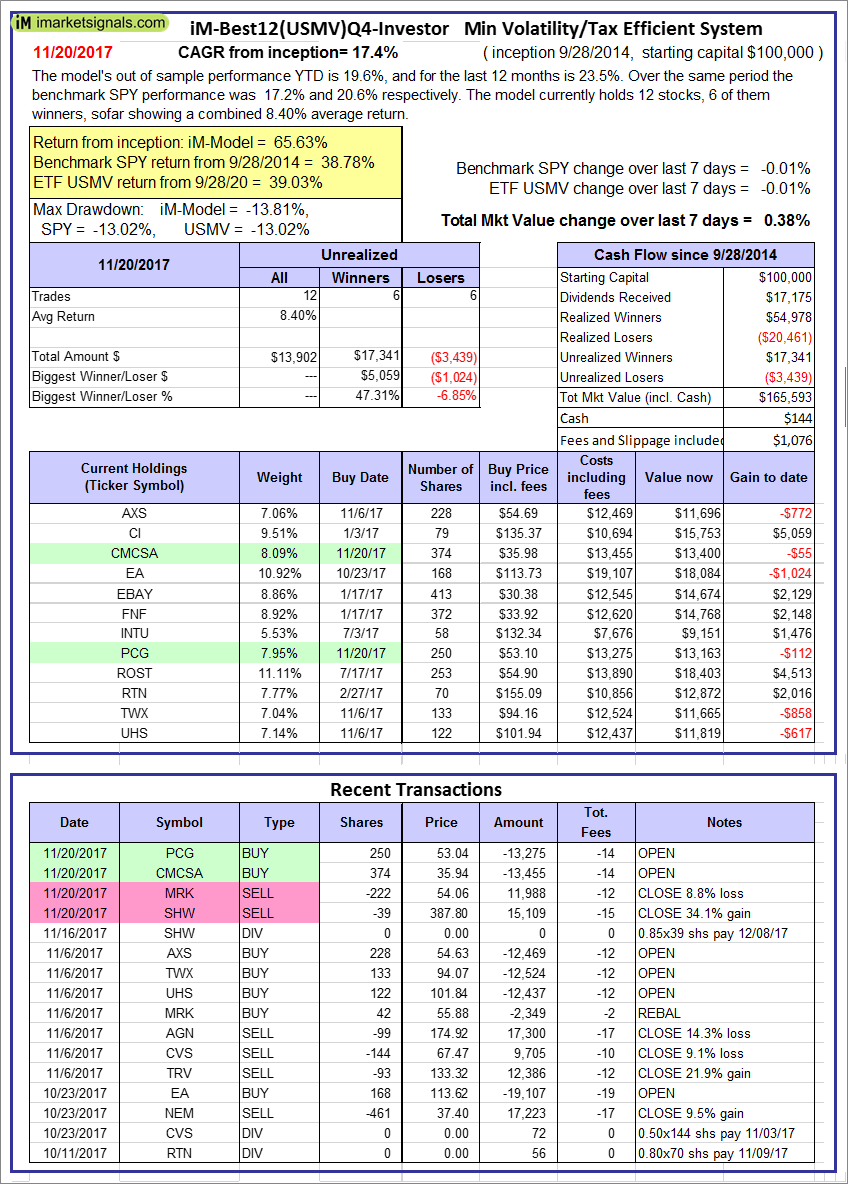
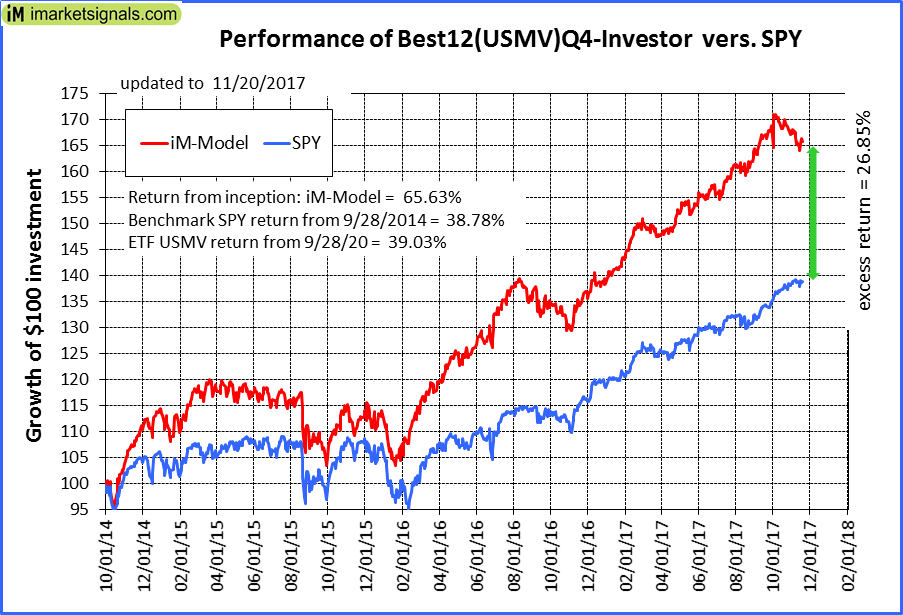
iM-Best12(USMV)Q4-Investor: Since inception, on 9/29/2014, the model gained 65.63% while the benchmark SPY gained 38.78% and the ETF USMV gained 39.03% over the same period. Over the previous week the market value of iM-Best12(USMV)Q4 gained 0.38% at a time when SPY gained -0.01%. A starting capital of $100,000 at inception on 9/29/2014 would have grown to $165,593 which includes $144 cash and excludes $1,076 spent on fees and slippage. |
|
|
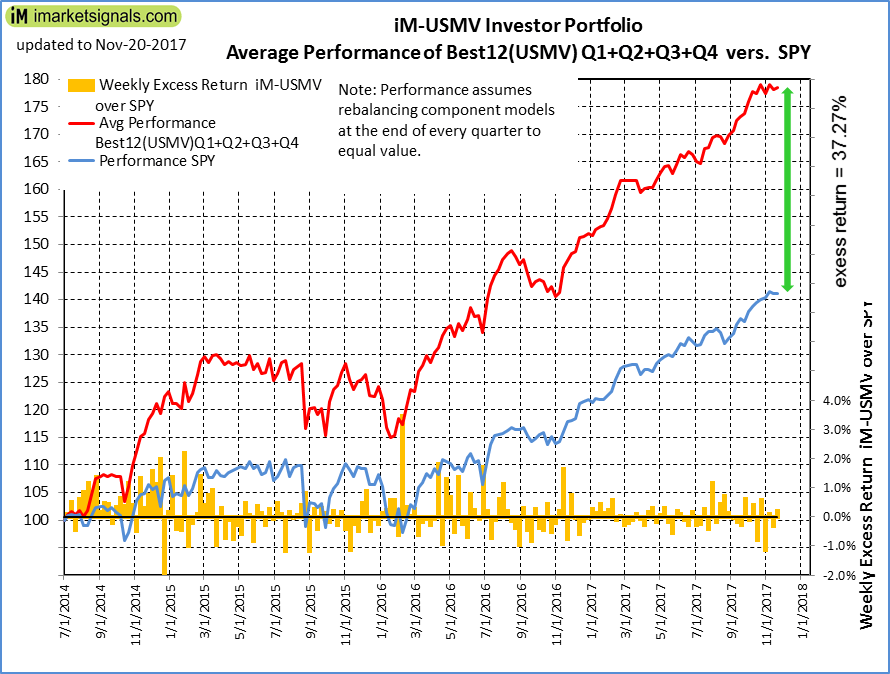
Average Performance of iM-Best12(USMV)Q1+Q2+Q3+Q4-Investor resulted in an excess return of 37.27% over SPY. (see iM-USMV Investor Portfolio) |
|
|
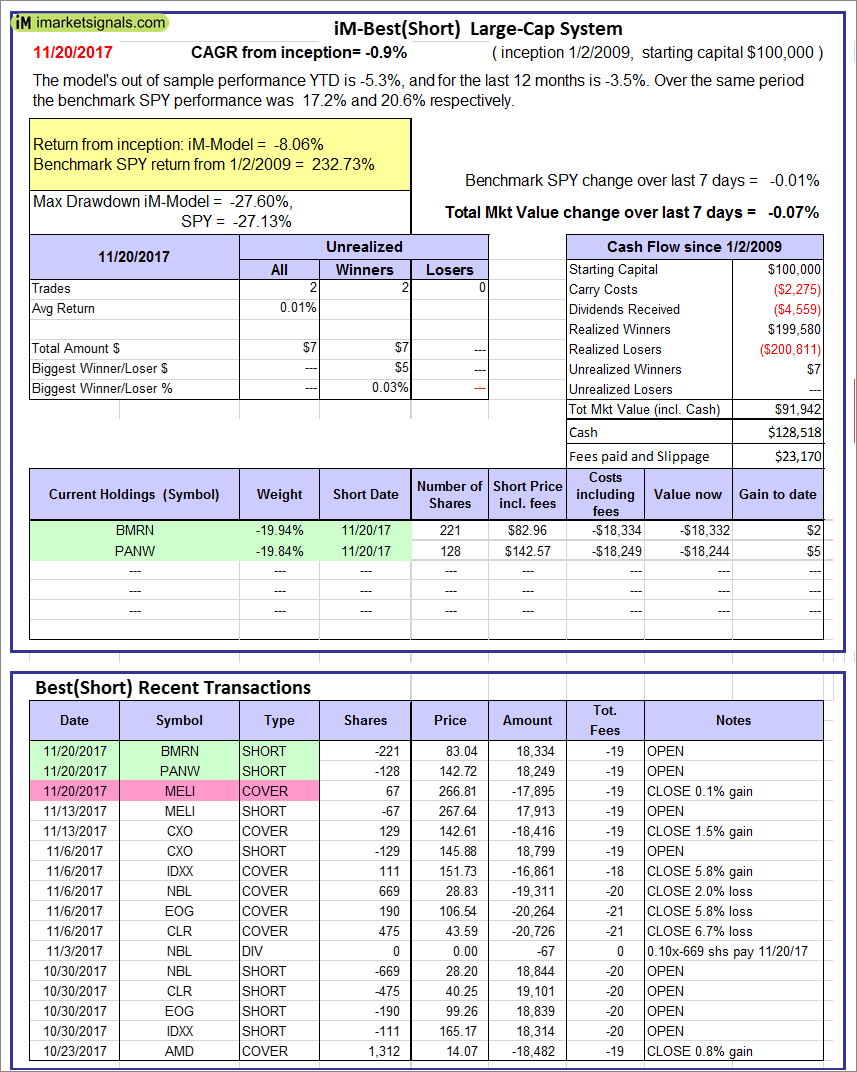
iM-Best(Short): The model’s out of sample performance YTD is -5.3%, and for the last 12 months is -3.5%. Over the same period the benchmark SPY performance was 17.2% and 20.6% respectively. Over the previous week the market value of iM-Best(Short) gained -0.07% at a time when SPY gained -0.01%. Over the period 1/2/2009 to 11/20/2017 the starting capital of $100,000 would have grown to $91,942 which includes $128,518 cash and excludes $23,170 spent on fees and slippage. |
|
|
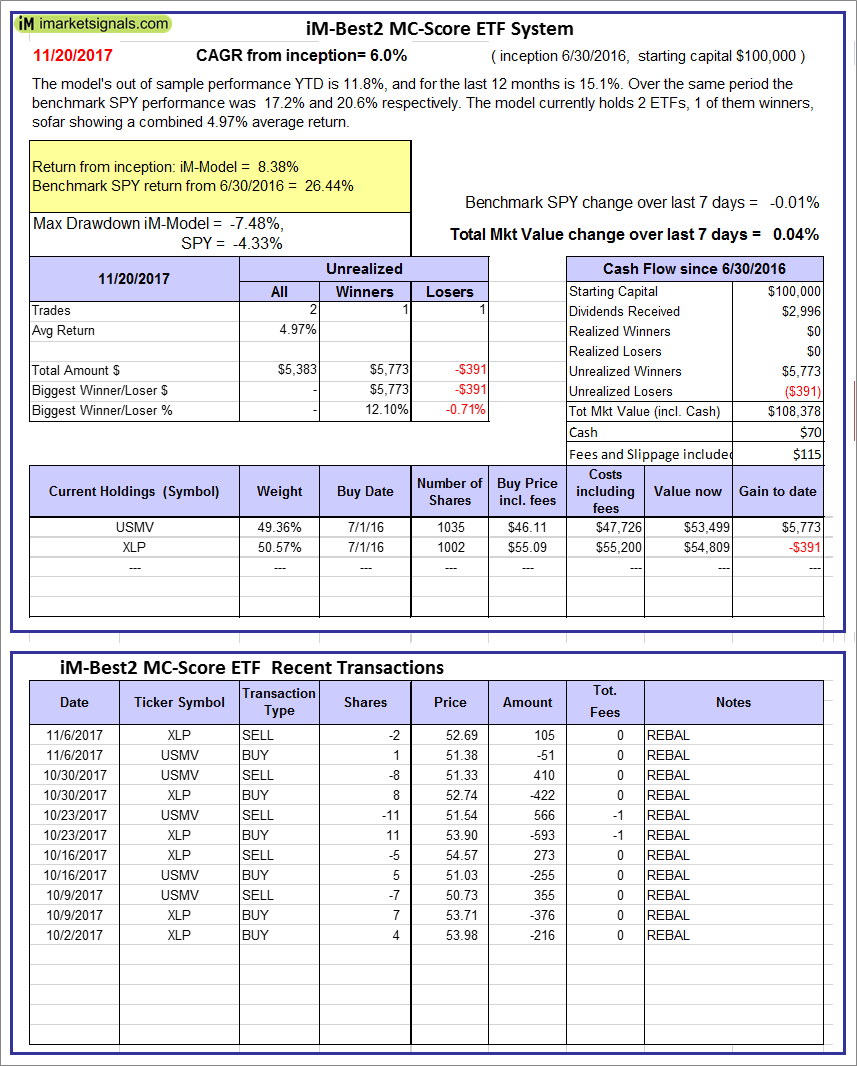
iM-Best2 MC-Score ETF System: The model’s out of sample performance YTD is 11.8%, and for the last 12 months is 15.1%. Over the same period the benchmark SPY performance was 17.2% and 20.6% respectively. Over the previous week the market value of the iM-Best2 MC-Score ETF System gained 0.04% at a time when SPY gained -0.01%. A starting capital of $100,000 at inception on 6/30/2016 would have grown to $108,378 which includes $70 cash and excludes $115 spent on fees and slippage. |
|
|
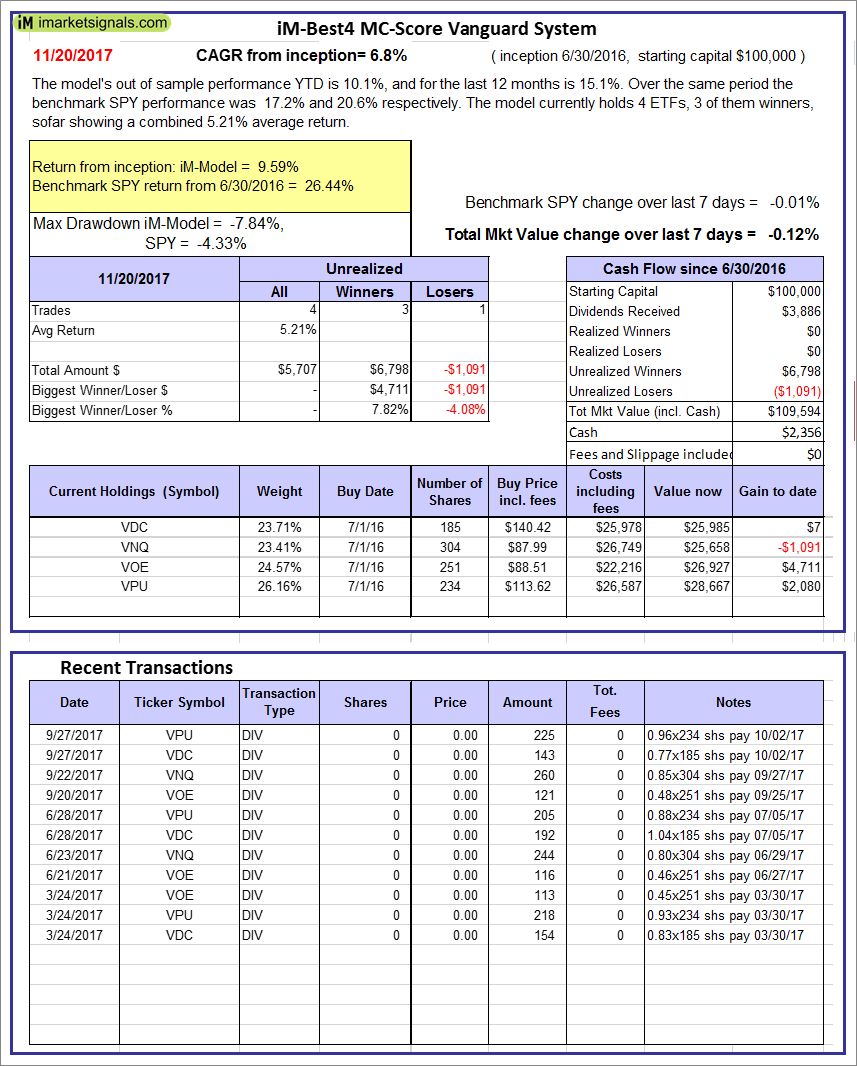
iM-Best4 MC-Score Vanguard System: The model’s out of sample performance YTD is 10.1%, and for the last 12 months is 15.1%. Over the same period the benchmark SPY performance was 17.2% and 20.6% respectively. Over the previous week the market value of the iM-Best4 MC-Score Vanguard System gained -0.12% at a time when SPY gained -0.01%. A starting capital of $100,000 at inception on 6/30/2016 would have grown to $109,594 which includes $2,356 cash and excludes $00 spent on fees and slippage. |
|
|
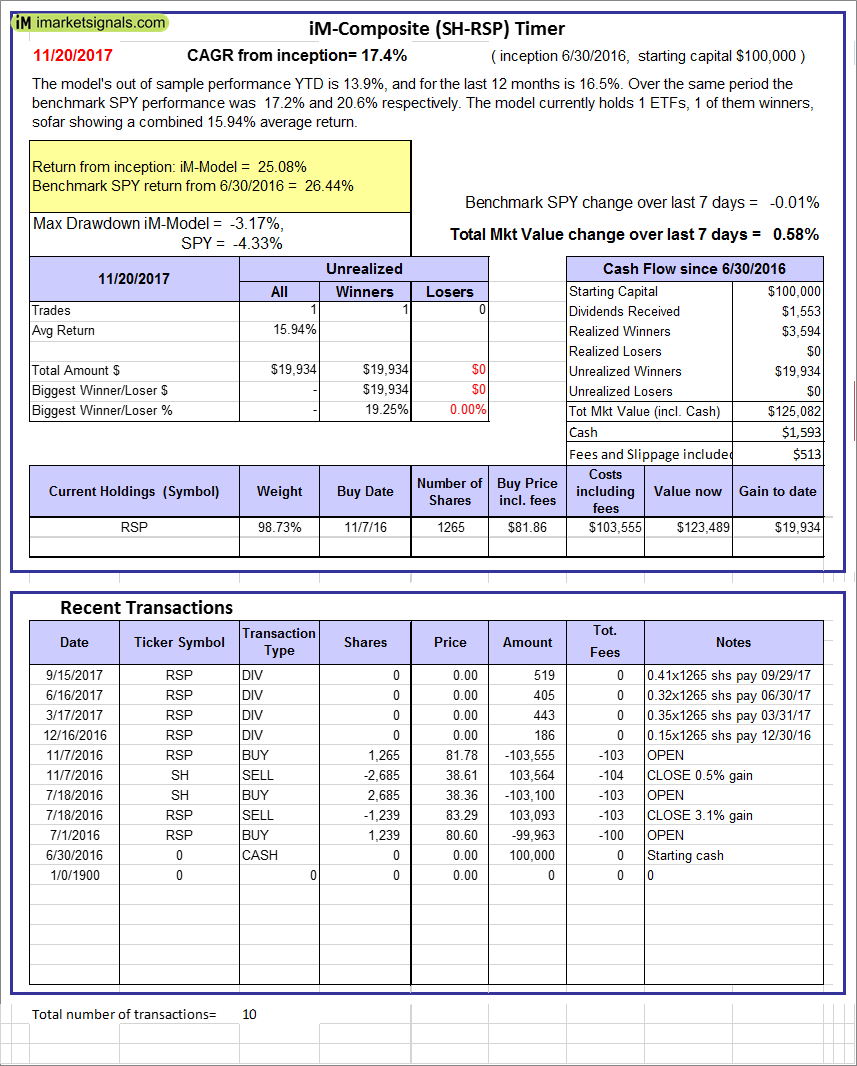
iM-Composite (SH-RSP) Timer: The model’s out of sample performance YTD is 13.9%, and for the last 12 months is 16.5%. Over the same period the benchmark SPY performance was 17.2% and 20.6% respectively. Over the previous week the market value of the iM-Composite (SH-RSP) Timer gained 0.58% at a time when SPY gained -0.01%. A starting capital of $100,000 at inception on 6/30/2016 would have grown to $125,082 which includes $1,593 cash and excludes $513 spent on fees and slippage. |
|
|
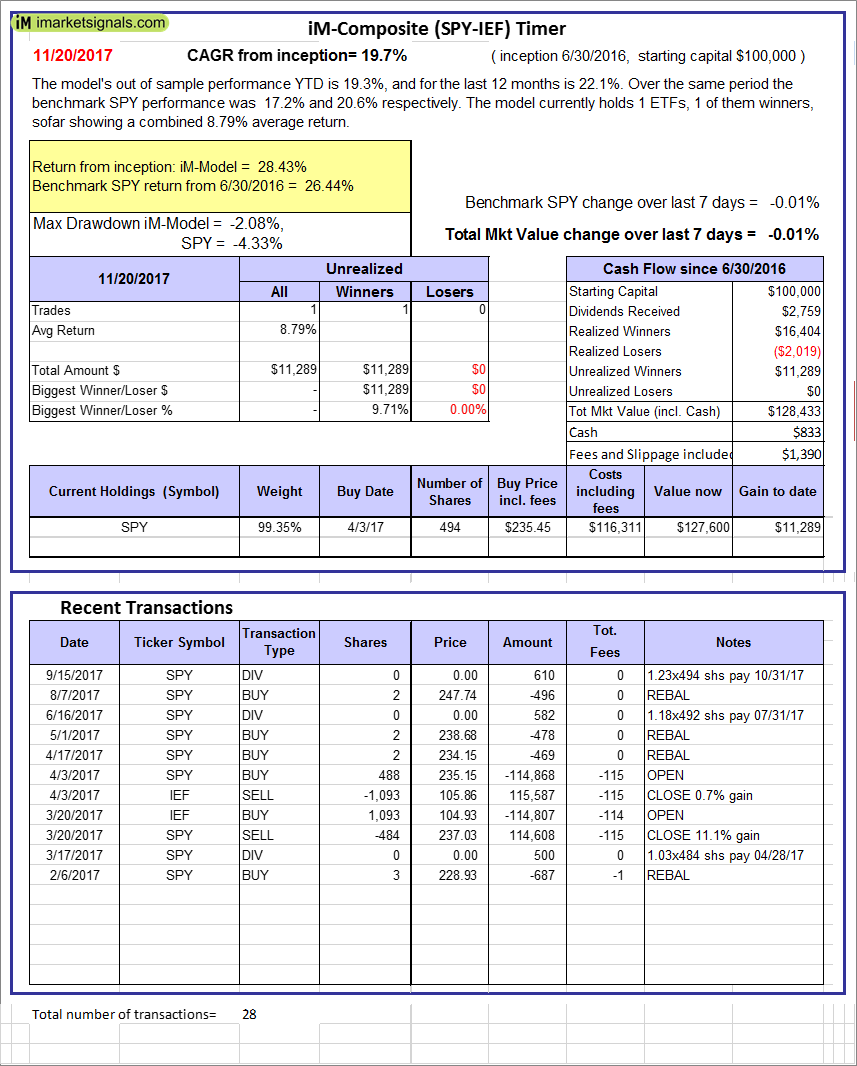
iM-Composite (SPY-IEF) Timer: The model’s out of sample performance YTD is 19.3%, and for the last 12 months is 22.1%. Over the same period the benchmark SPY performance was 17.2% and 20.6% respectively. Over the previous week the market value of the iM-Composite (SPY-IEF) Timer gained -0.01% at a time when SPY gained -0.01%. A starting capital of $100,000 at inception on 6/30/2016 would have grown to $128,433 which includes $833 cash and excludes $1,390 spent on fees and slippage. |
|
|
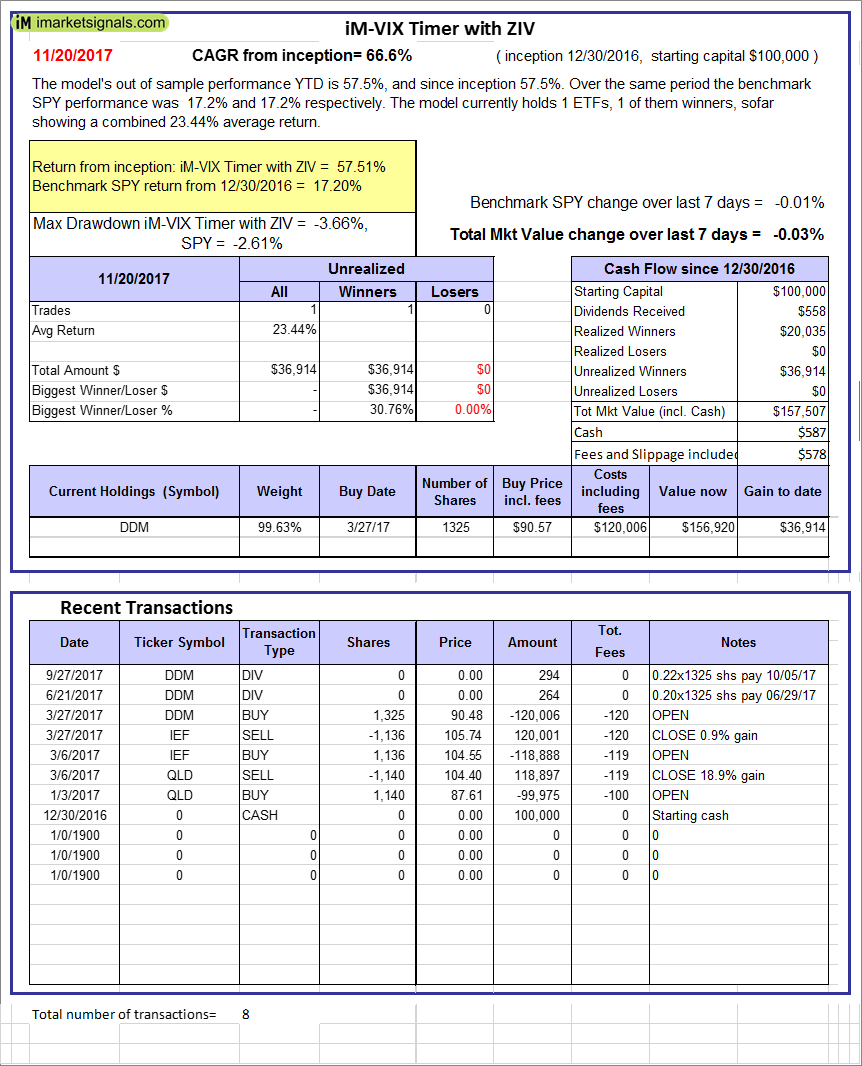
iM-VIX Timer with ZIV: The model’s out of sample performance YTD is 57.5%, and since inception 57.5%. Over the same period the benchmark SPY performance was 17.2% and 17.2% respectively. Over the previous week the market value of the iM-VIX Timer with ZIV gained -0.03% at a time when SPY gained -0.01%. A starting capital of $100,000 at inception on 6/30/2016 would have grown to $157,507 which includes $587 cash and excludes $578 spent on fees and slippage. |
|
|
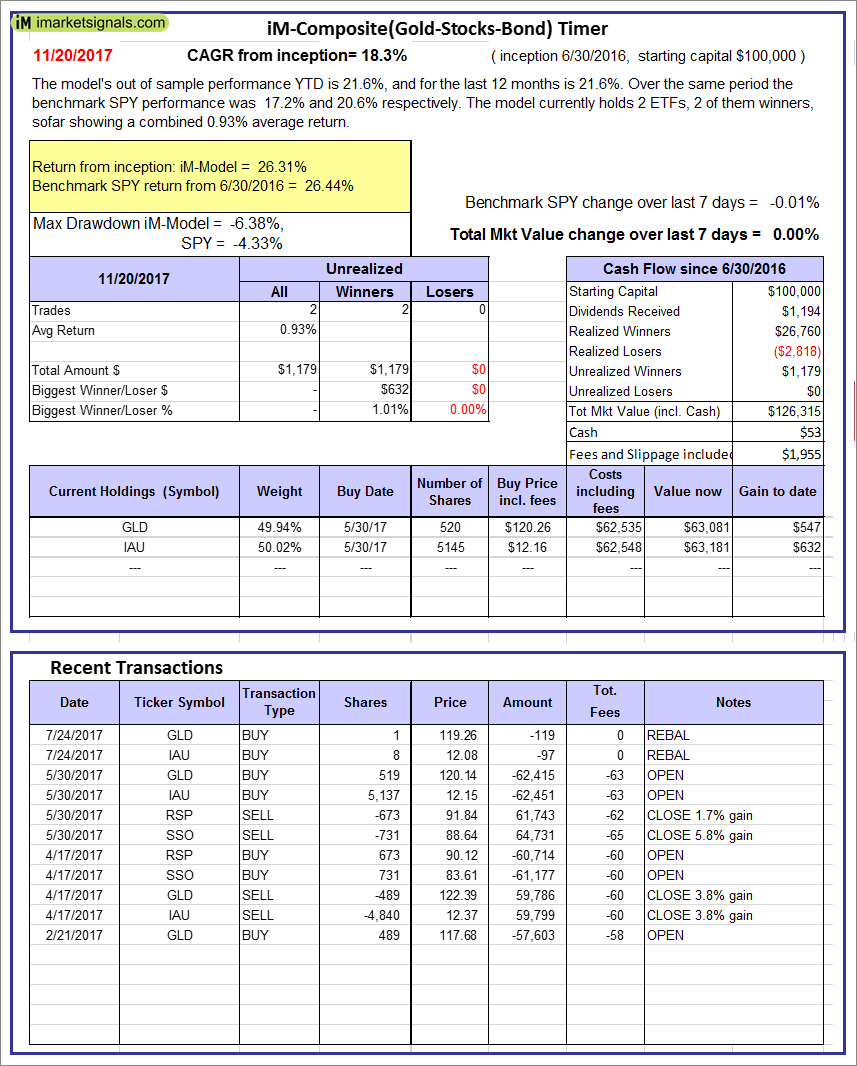
iM-Composite(Gold-Stocks-Bond) Timer: The model’s out of sample performance YTD is 21.6%, and for the last 12 months is 21.6%. Over the same period the benchmark SPY performance was 17.2% and 20.6% respectively. Over the previous week the market value of the iM-Composite(Gold-Stocks-Bond) Timer gained 0.00% at a time when SPY gained -0.01%. A starting capital of $100,000 at inception on 6/30/2016 would have grown to $126,315 which includes $53 cash and excludes $1,955 spent on fees and slippage. |
|
|
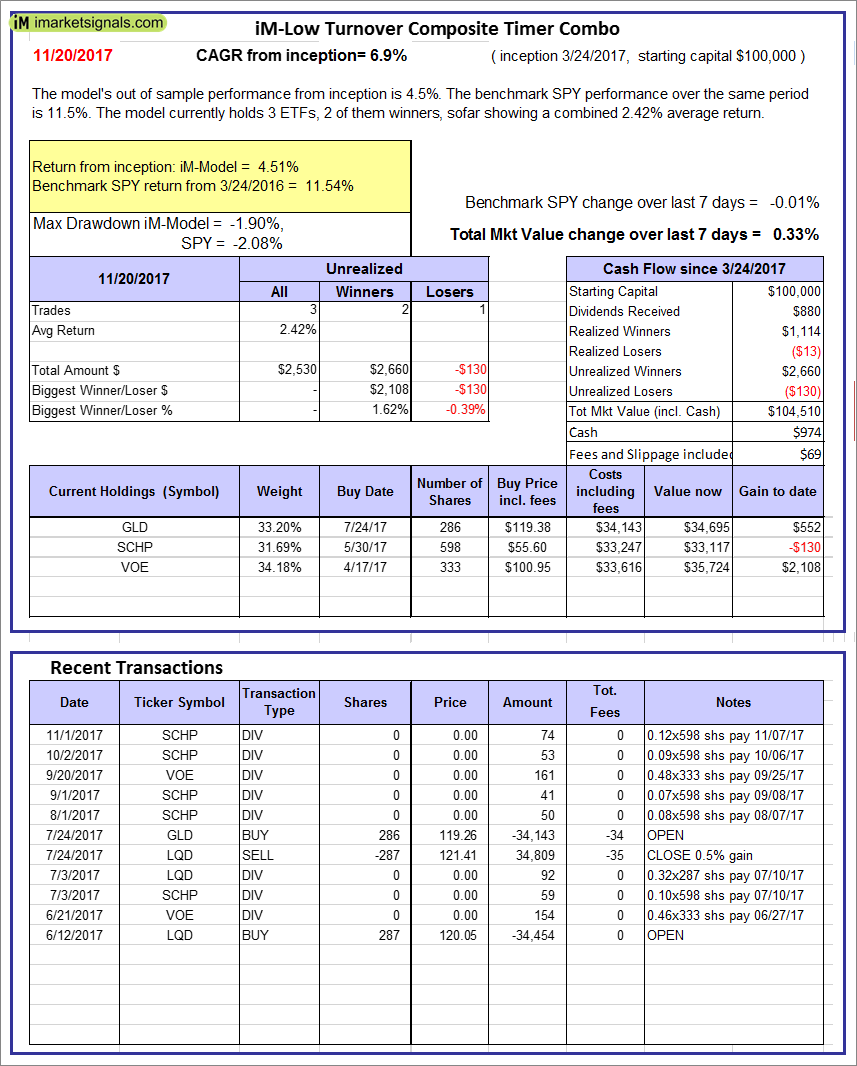
iM-Low Turnover Composite Timer Combo: The model’s out of sample performance from inception is 4.5%. The benchmark SPY performance over the same period is 11.5%. Over the previous week the market value of the iM-Low Turnover Composite Timer Combo gained 0.33% at a time when SPY gained -0.01%. A starting capital of $100,000 at inception on 3/24/27 would have grown to $104,510 which includes $974 cash and excludes $69 spent on fees and slippage. |
|
|
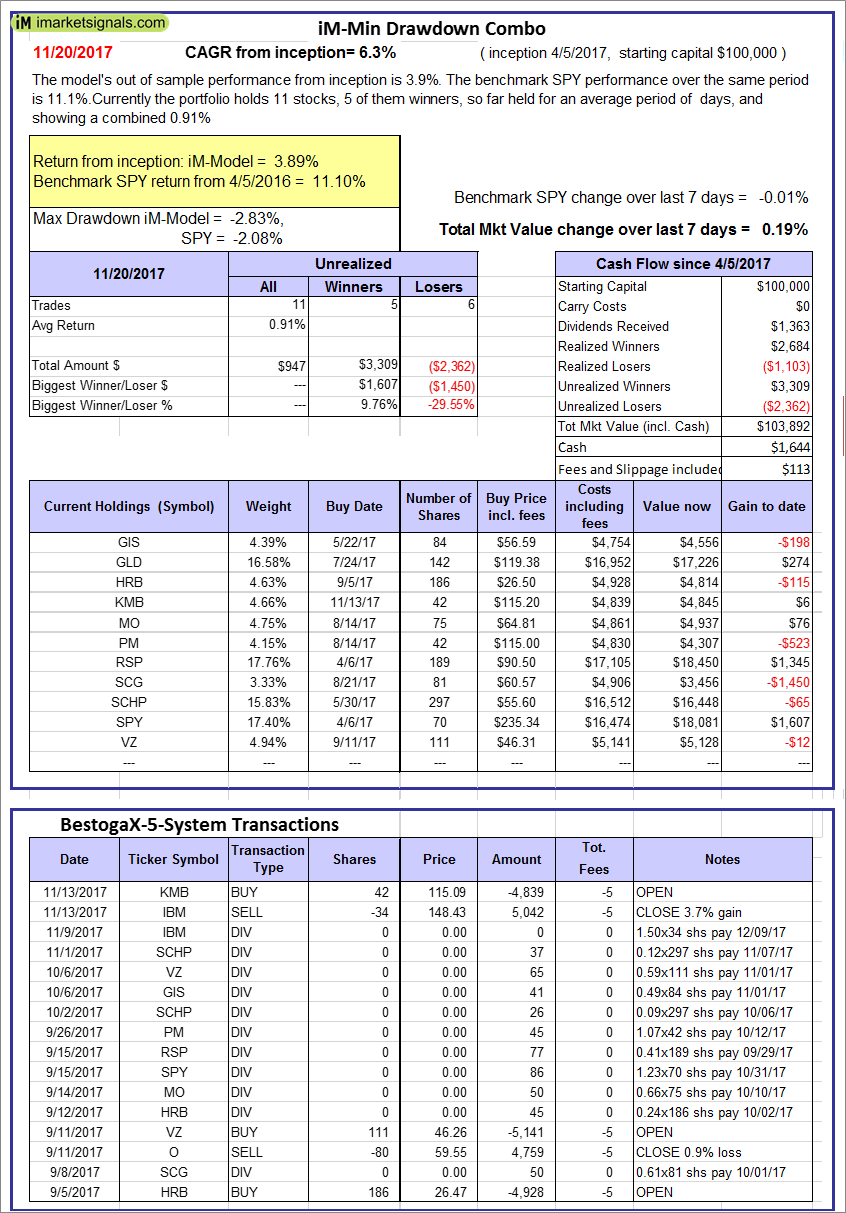
iM-Min Drawdown Combo: The model’s out of sample performance from inception is 3.9%. The benchmark SPY performance over the same period is 11.1%. Over the previous week the market value of the iM-Min Drawdown Combo gained 0.19% at a time when SPY gained -0.01%. A starting capital of $100,000 at inception on 4/5/2017 would have grown to $103,892 which includes $1,644 cash and excludes $113 spent on fees and slippage. |
|
|
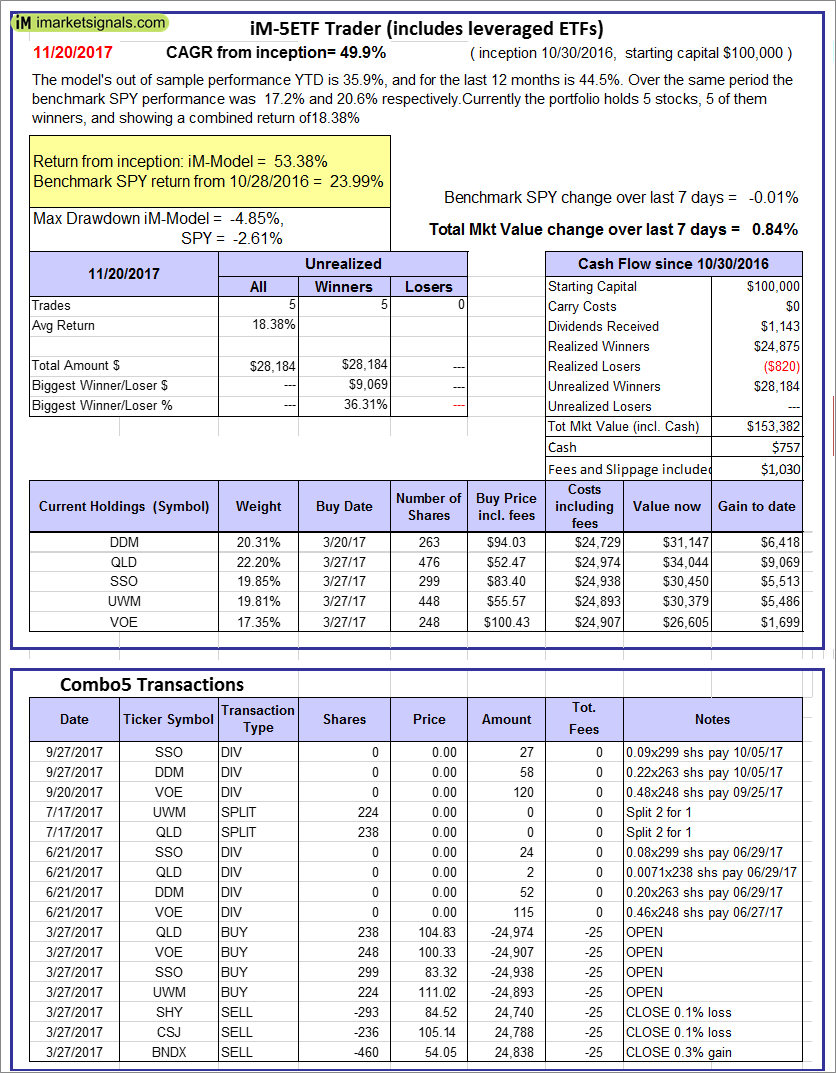
iM-5ETF Trader (includes leveraged ETFs): The model’s out of sample performance YTD is 35.9%, and for the last 12 months is 44.5%. Over the same period the benchmark SPY performance was 17.2% and 20.6% respectively. Over the previous week the market value of the iM-5ETF Trader (includes leveraged ETFs) gained 0.84% at a time when SPY gained -0.01%. A starting capital of $100,000 at inception on 10/30/2016 would have grown to $153,382 which includes $757 cash and excludes $1,030 spent on fees and slippage. |
|
|
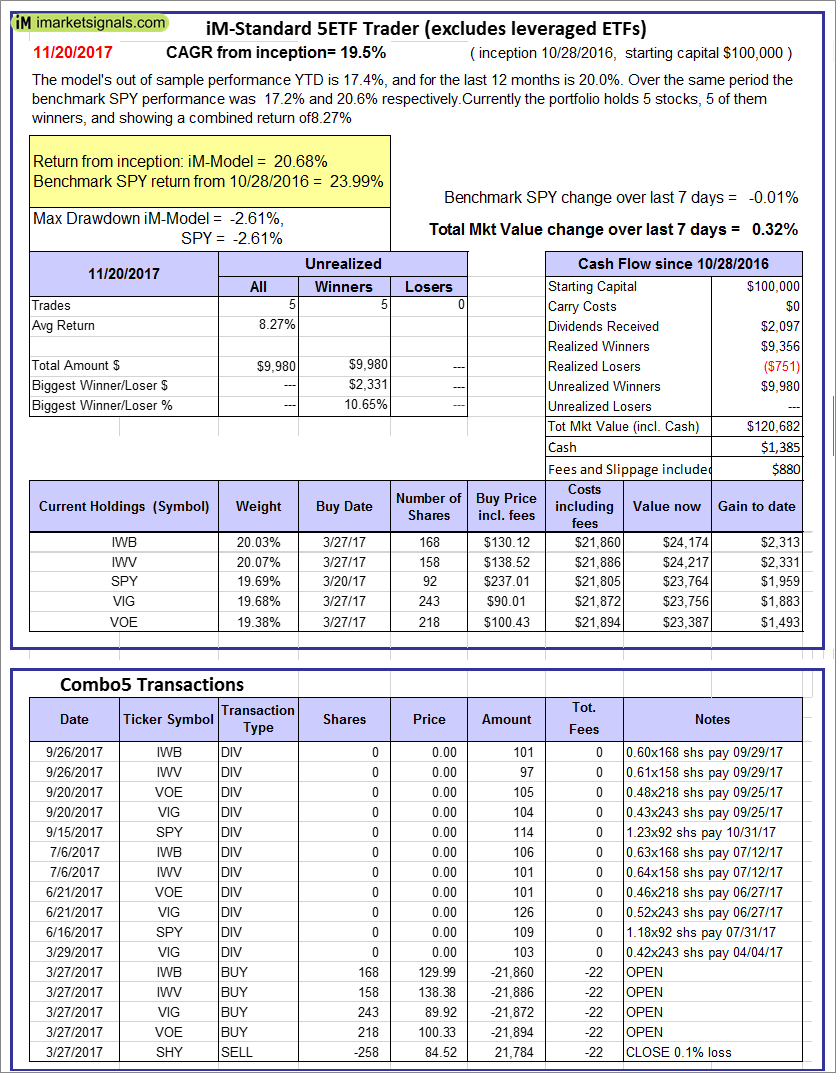
iM-Standard 5ETF Trader (excludes leveraged ETFs): The model’s out of sample performance YTD is 17.4%, and for the last 12 months is 20.0%. Over the same period the benchmark SPY performance was 17.2% and 20.6% respectively. Over the previous week the market value of the iM-Standard 5ETF Trader (excludes leveraged ETFs) gained 0.32% at a time when SPY gained -0.01%. A starting capital of $100,000 at inception on 10/30/2016 would have grown to $120,682 which includes $1,385 cash and excludes $880 spent on fees and slippage. |


Leave a Reply
You must be logged in to post a comment.