
  |
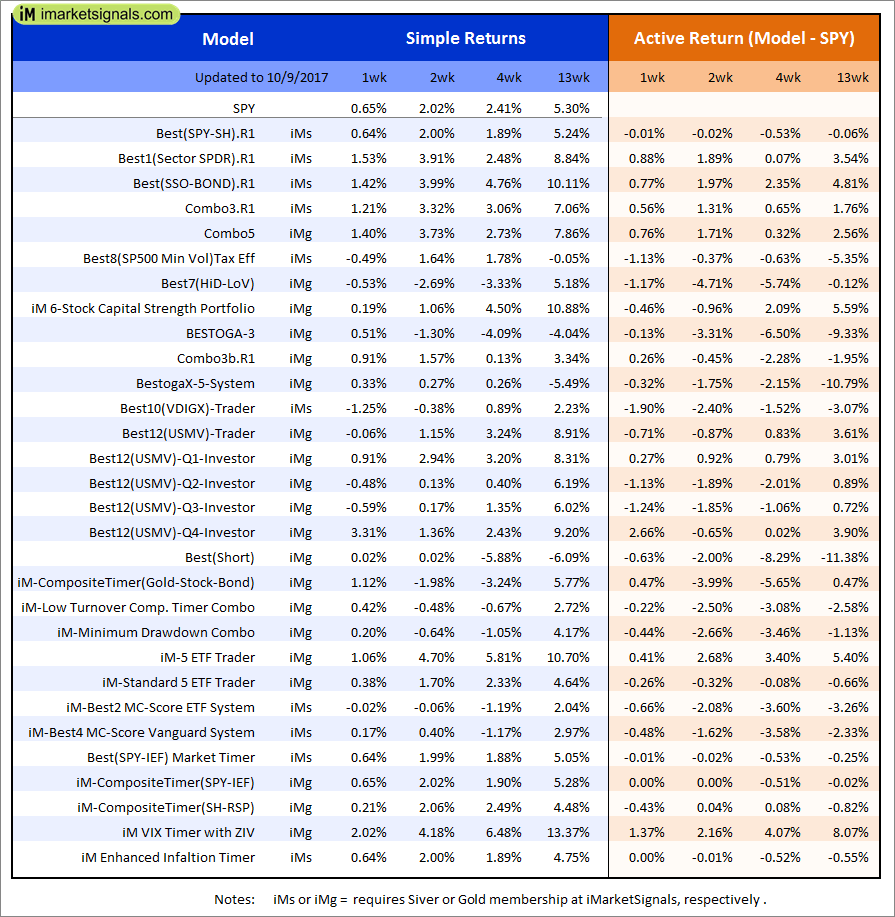
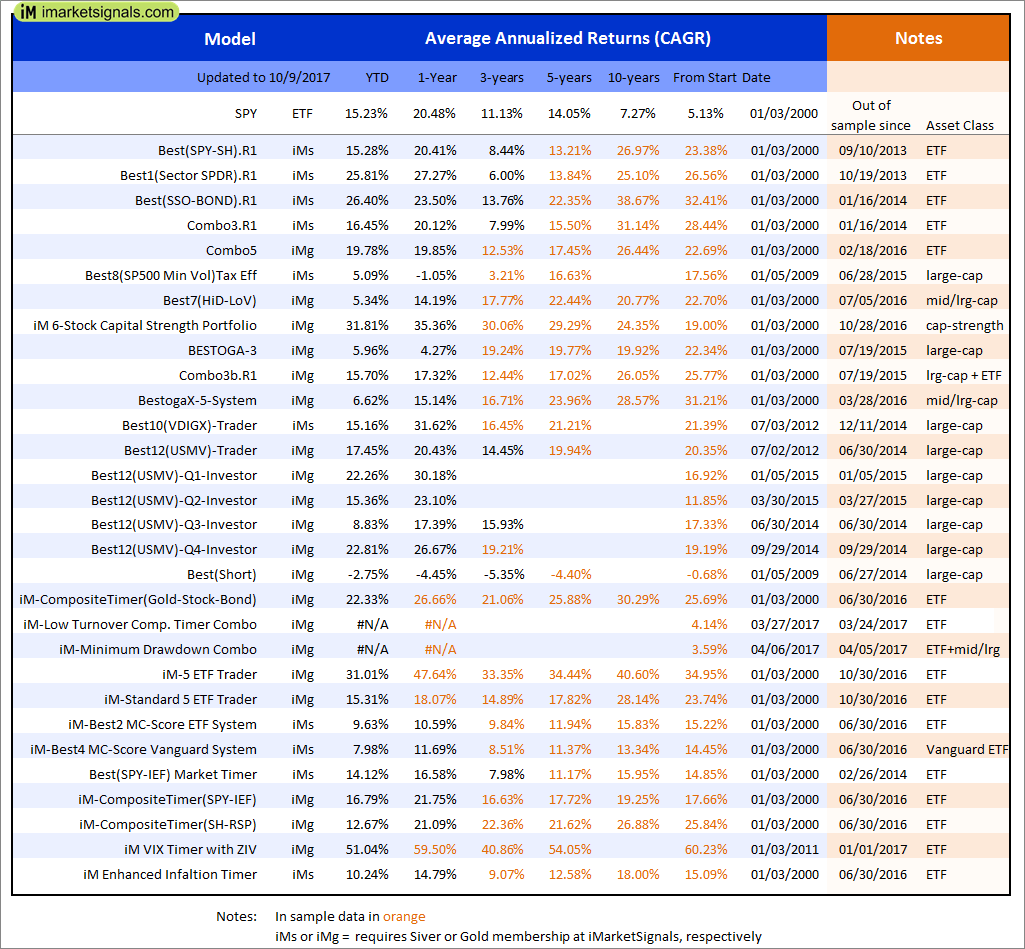
Out of sample performance summary of our models for the past 1, 2, 4 and 13 week periods. The active active return indicates how the models over- or underperformed the benchmark ETF SPY. Also the YTD, and the 1-, 3-, 5- and 10-year annualized returns are shown in the second table |
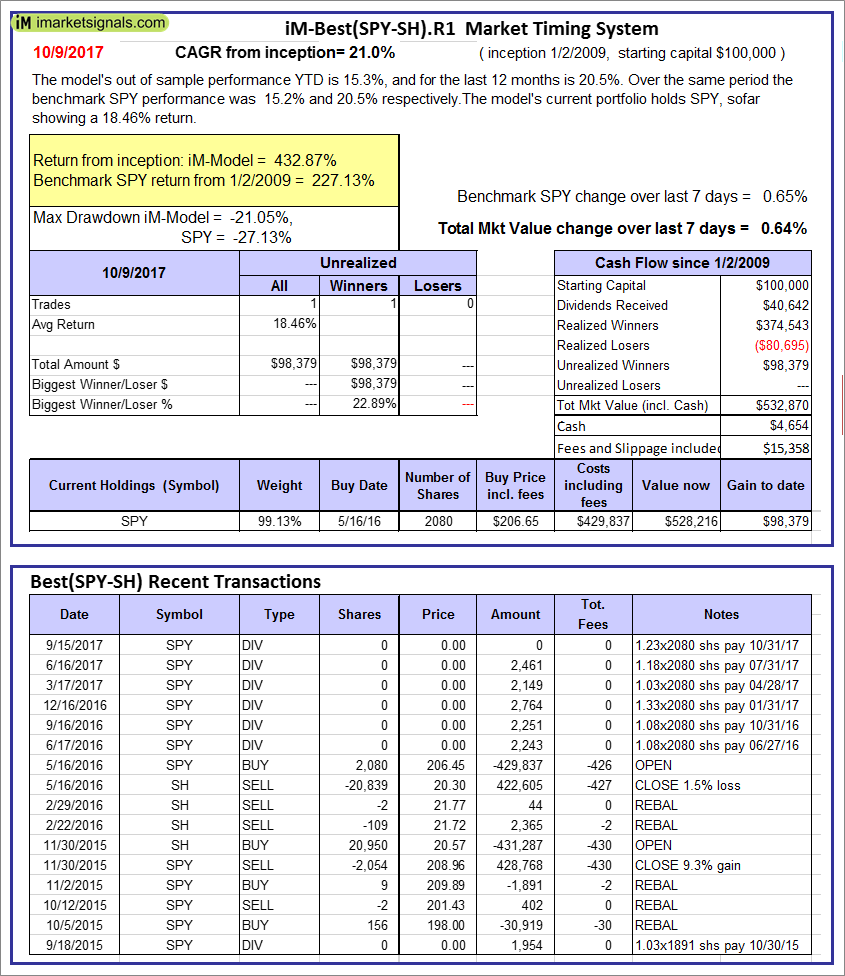 |
iM-Best(SPY-SH).R1: The model’s out of sample performance YTD is 15.3%, and for the last 12 months is 20.5%. Over the same period the benchmark SPY performance was 15.2% and 20.5% respectively. Over the previous week the market value of Best(SPY-SH) gained 0.64% at a time when SPY gained 0.65%. A starting capital of $100,000 at inception on 1/2/2009 would have grown to $532,870 which includes $4,654 cash and excludes $15,358 spent on fees and slippage. |
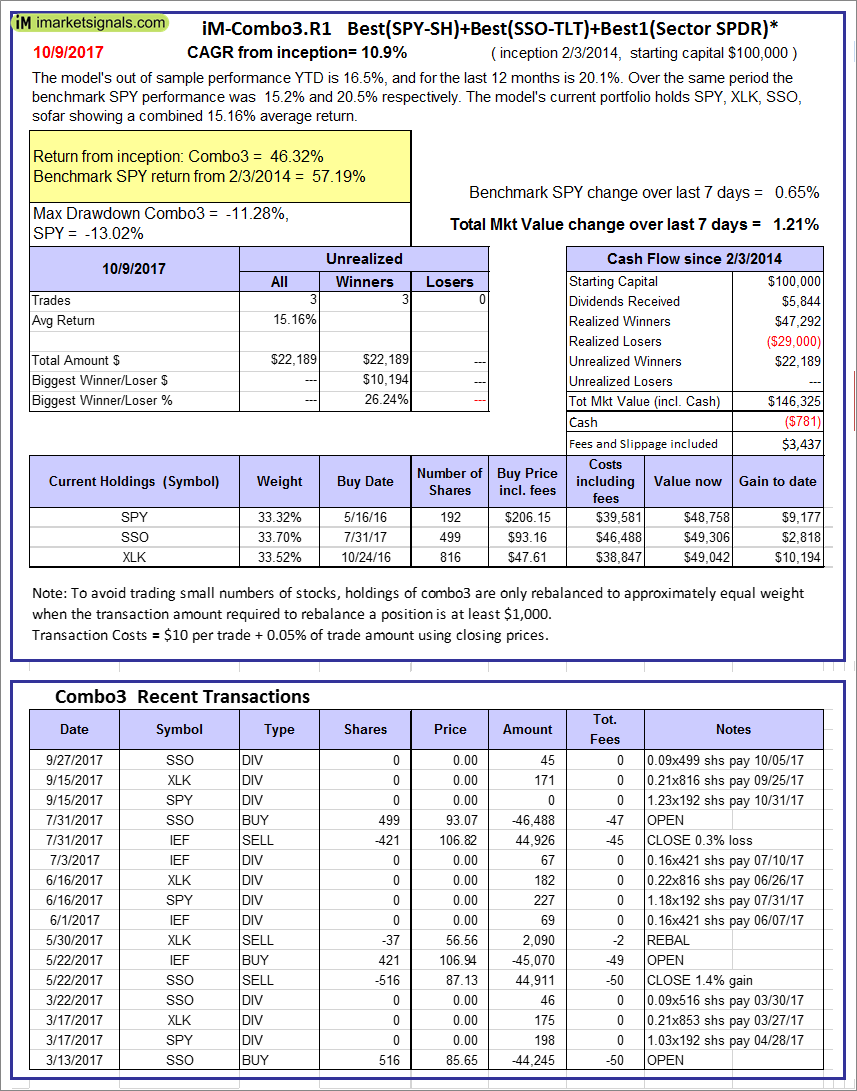 |
iM-Combo3.R1: The model’s out of sample performance YTD is 16.5%, and for the last 12 months is 20.1%. Over the same period the benchmark SPY performance was 15.2% and 20.5% respectively. Over the previous week the market value of iM-Combo3.R1 gained 1.21% at a time when SPY gained 0.65%. A starting capital of $100,000 at inception on 2/3/2014 would have grown to $146,325 which includes -$781 cash and excludes $3,437 spent on fees and slippage. |
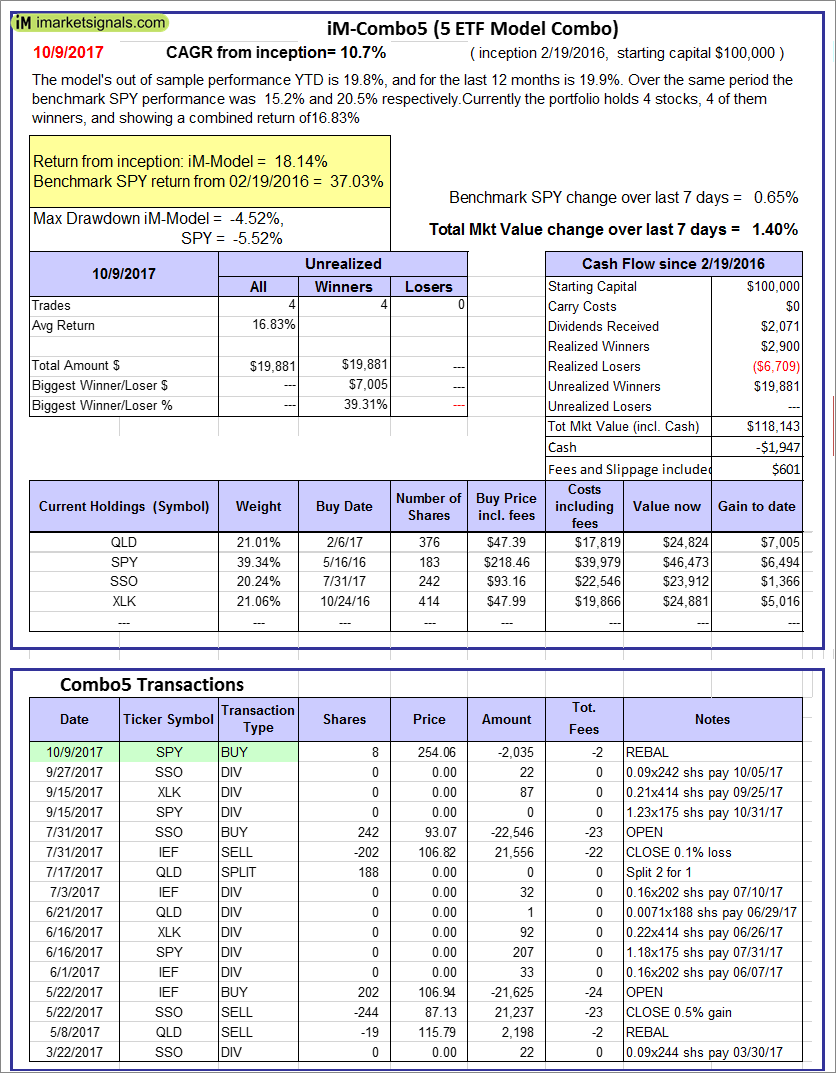 |
iM-Combo5: The model’s out of sample performance YTD is 19.8%, and for the last 12 months is 19.9%. Over the same period the benchmark SPY performance was 15.2% and 20.5% respectively. Over the previous week the market value of iM-Combo5 gained 1.40% at a time when SPY gained 0.65%. A starting capital of $100,000 at inception on 2/22/2016 would have grown to $118,143 which includes -$1,947 cash and excludes $601 spent on fees and slippage. |
 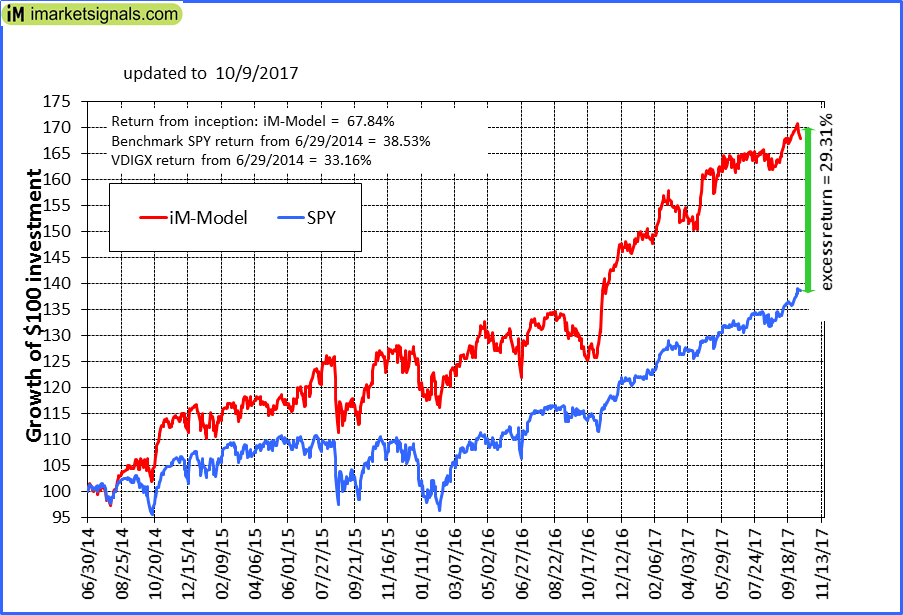 |
iM-Best10(VDIGX)-Trader: The model’s out of sample performance YTD is 15.2%, and for the last 12 months is 31.6%. Over the same period the benchmark SPY performance was 15.2% and 20.5% respectively. Since inception, on 7/1/2014, the model gained 67.84% while the benchmark SPY gained 38.53% and VDIGX gained 33.16% over the same period. Over the previous week the market value of iM-Best10(VDIGX) gained -1.25% at a time when SPY gained 0.65%. A starting capital of $100,000 at inception on 7/1/2014 would have grown to $167,841 which includes $491 cash and excludes $1,694 spent on fees and slippage. |
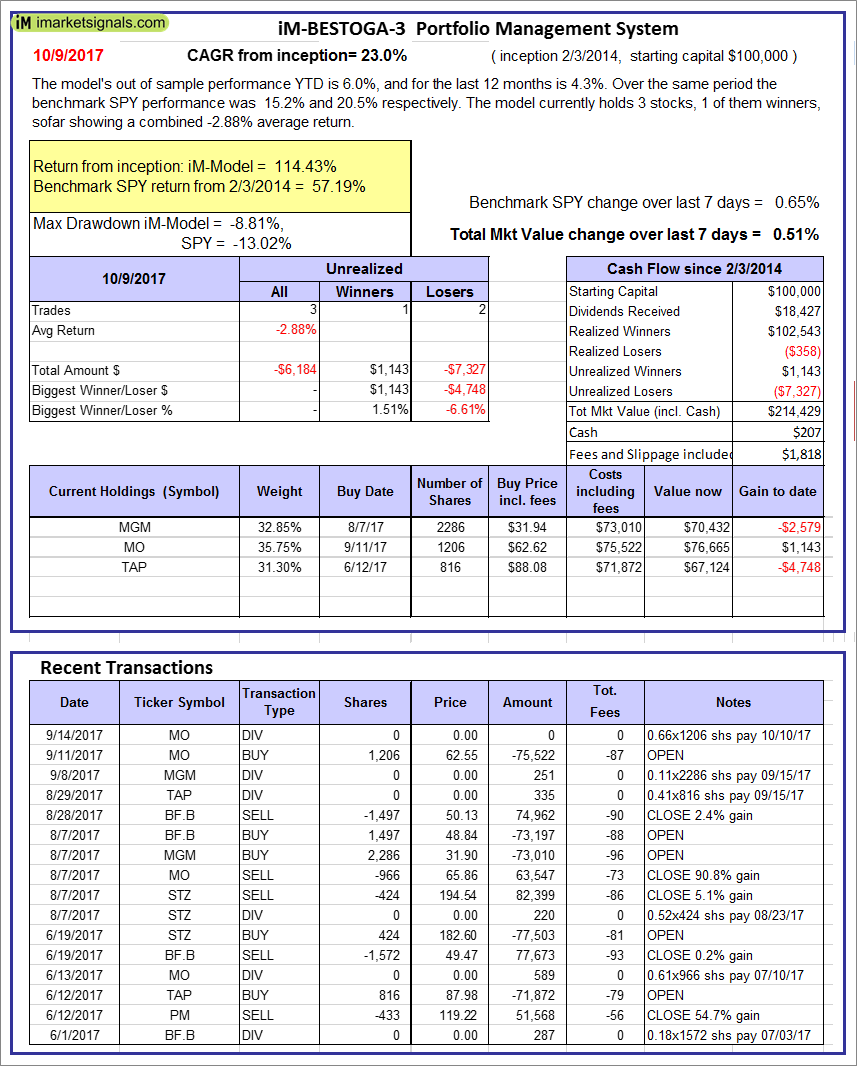 |
iM-BESTOGA-3: The model’s out of sample performance YTD is 6.0%, and for the last 12 months is 4.3%. Over the same period the benchmark SPY performance was 15.2% and 20.5% respectively. Over the previous week the market value of iM-BESTOGA-3 gained 0.51% at a time when SPY gained 0.65%. A starting capital of $100,000 at inception on 2/3/2014 would have grown to $214,429 which includes $207 cash and excludes $1,818 spent on fees and slippage. |
 |
iM-Best7(HiD-LoV): The model’s out of sample performance YTD is 5.3%, and for the last 12 months is 14.2%. Over the same period the benchmark SPY performance was 15.2% and 20.5% respectively. Over the previous week the market value of iM-BESTOGA-3 gained -0.53% at a time when SPY gained 0.65%. A starting capital of $100,000 at inception on 6/30/2016 would have grown to $108,240 which includes $356 cash and excludes $1,211 spent on fees and slippage. |
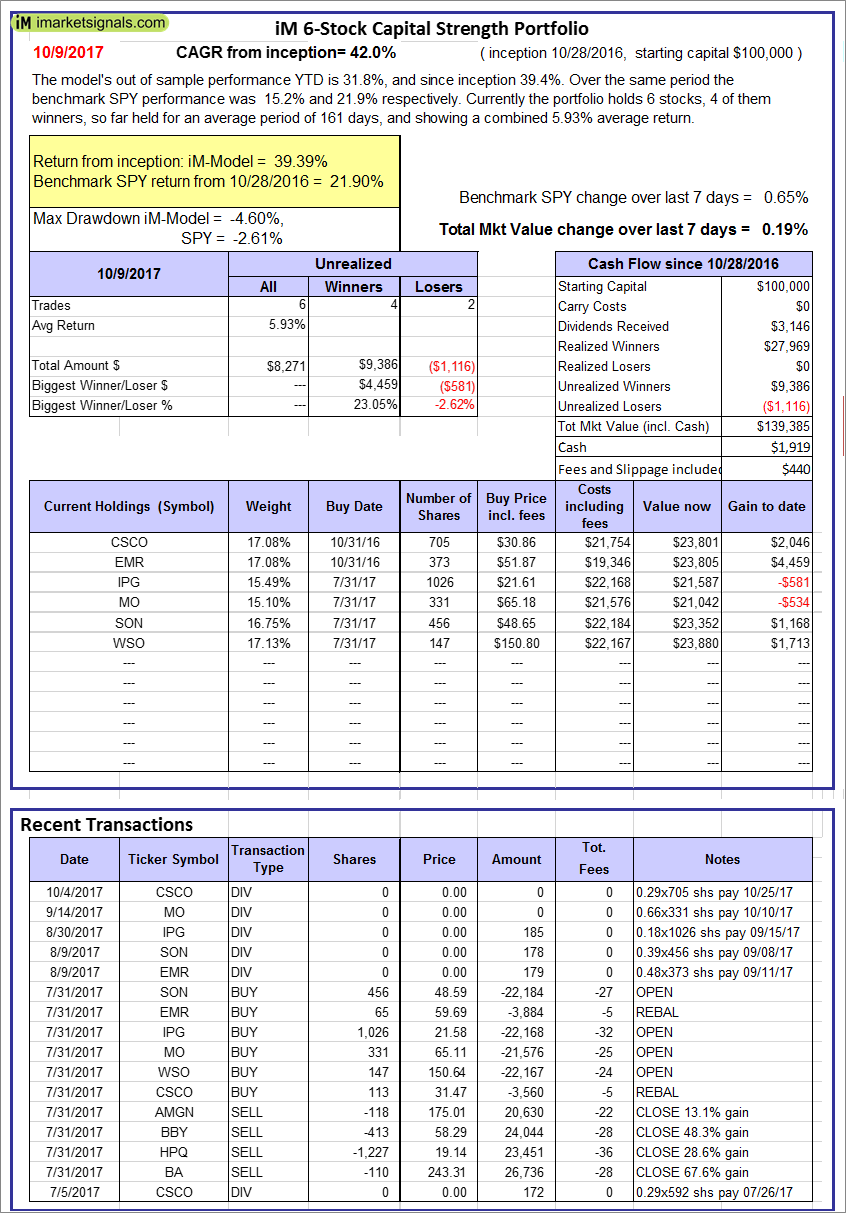 |
iM 6-Stock Capital Strength Portfolio: The model’s out of sample performance YTD is 31.8%, and since inception 39.4%. Over the same period the benchmark SPY performance was 15.2% and 21.9% respectively. Over the previous week the market value of the iM 6-Stock Capital Strength Portfolio gained 0.19% at a time when SPY gained 0.65%. A starting capital of $100,000 at inception on 10/28/2016 would have grown to $139,385 which includes $1,919 cash and excludes $440 spent on fees and slippage. |
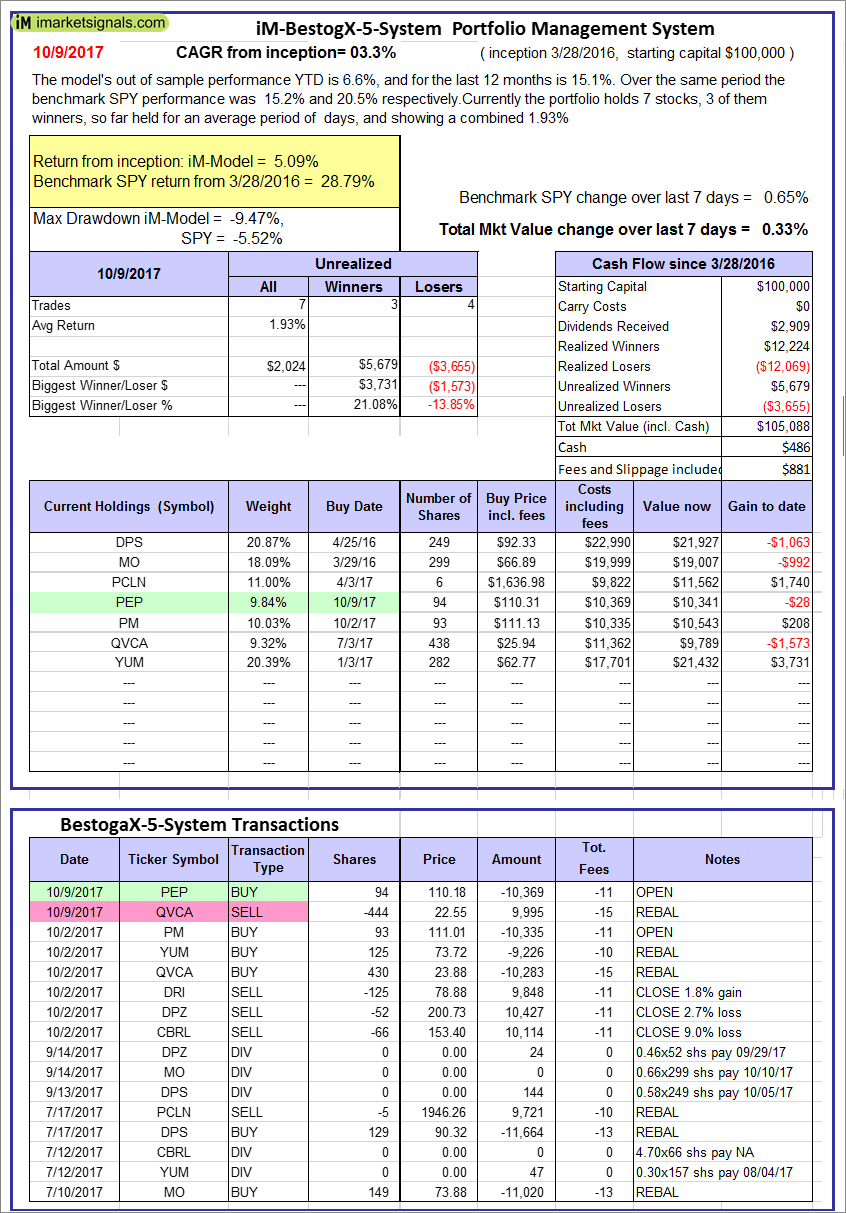 |
iM-BestogaX5-System: The model’s out of sample performance YTD is 6.6%, and for the last 12 months is 15.1%. Over the same period the benchmark SPY performance was 15.2% and 20.5% respectively. Over the previous week the market value of iM-Best8(S&P 500)Tax-Eff. gained 0.33% at a time when SPY gained 0.65%. A starting capital of $100,000 at inception on 3/28/2016 would have grown to $105,088 which includes $486 cash and excludes $881 spent on fees and slippage. |
 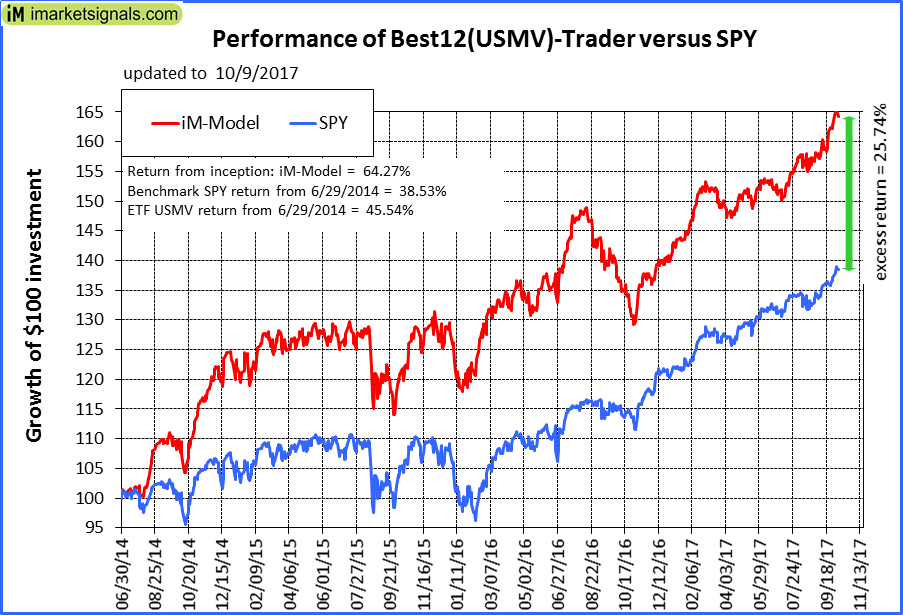 |
iM-Best12(USMV)-Trader: The model’s out of sample performance YTD is 17.5%, and for the last 12 months is 20.4%. Over the same period the benchmark SPY performance was 15.2% and 20.5% respectively. Since inception, on 6/30/2014, the model gained 64.27% while the benchmark SPY gained 38.53% and the ETF USMV gained 45.54% over the same period. Over the previous week the market value of iM-Best12(USMV)-Trader gained -0.06% at a time when SPY gained 0.65%. A starting capital of $100,000 at inception on 6/30/2014 would have grown to $164,265 which includes $98 cash and excludes $3,471 spent on fees and slippage. |
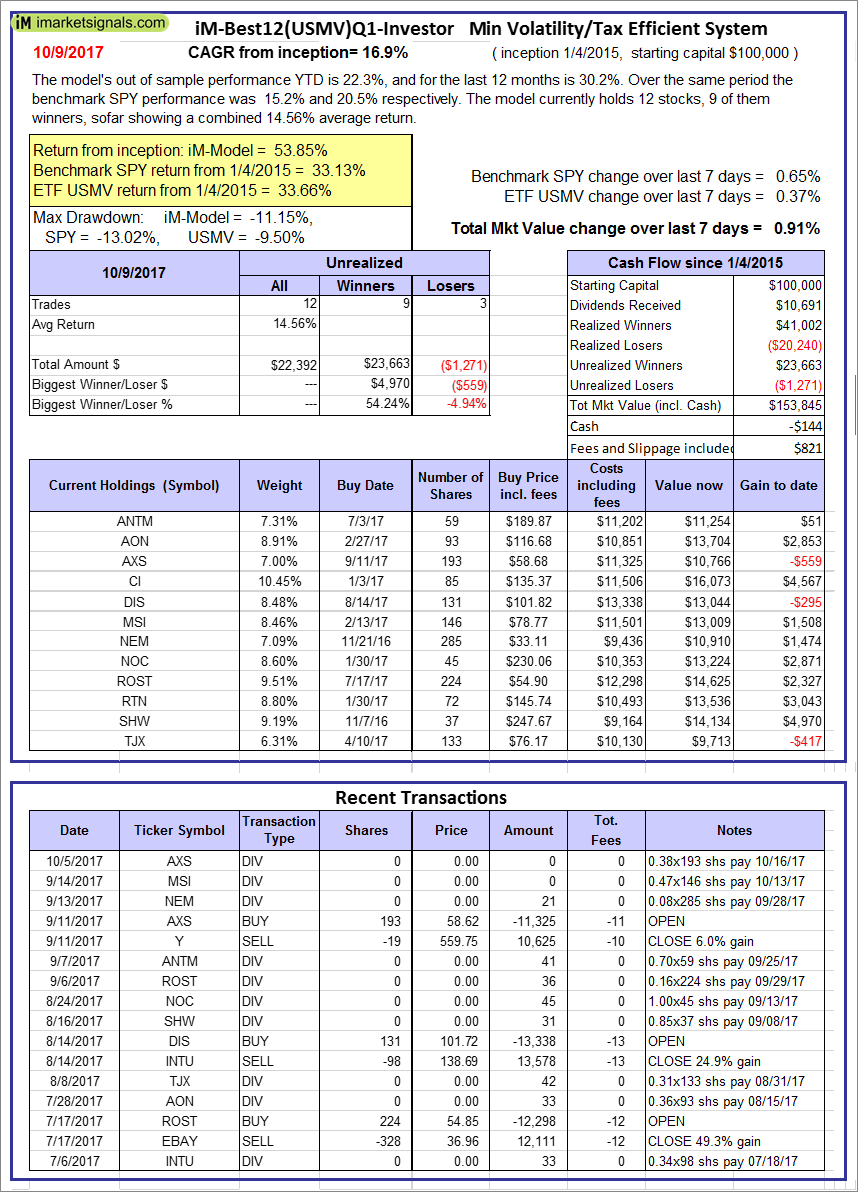 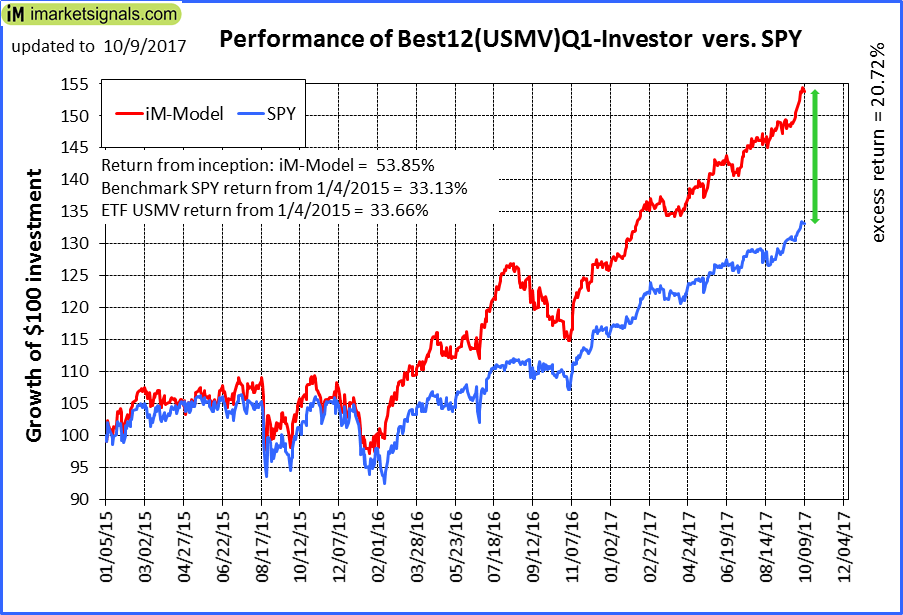 |
iM-Best12(USMV)Q1-Investor: The model’s out of sample performance YTD is 22.3%, and for the last 12 months is 30.2%. Over the same period the benchmark SPY performance was 15.2% and 20.5% respectively. Since inception, on 1/5/2015, the model gained 53.85% while the benchmark SPY gained 33.13% and the ETF USMV gained 33.66% over the same period. Over the previous week the market value of iM-Best12(USMV)Q1 gained 0.91% at a time when SPY gained 0.65%. A starting capital of $100,000 at inception on 1/5/2015 would have grown to $153,845 which includes -$144 cash and excludes $821 spent on fees and slippage. |
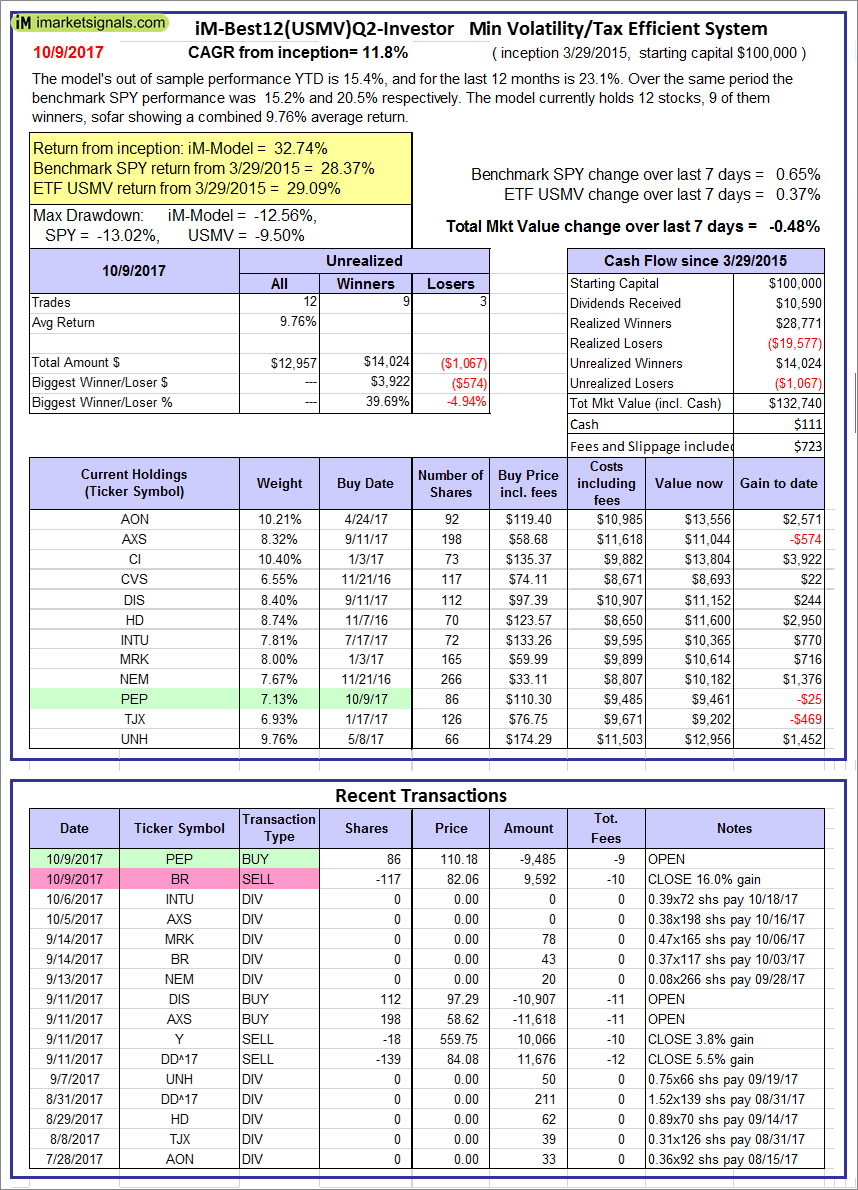 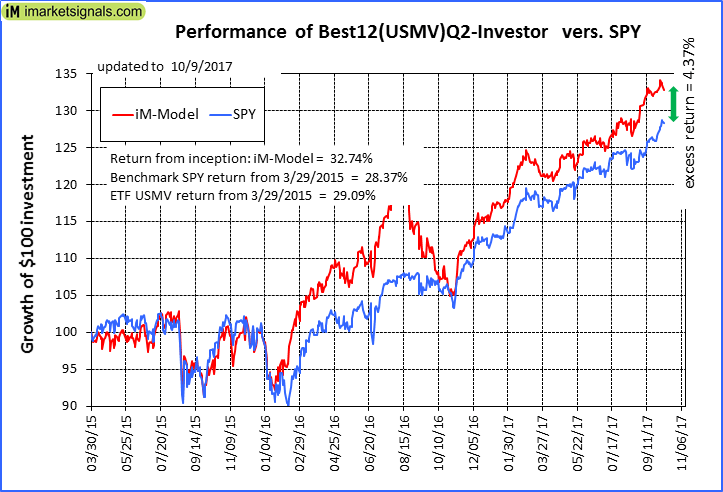 |
iM-Best12(USMV)Q2-Investor: The model’s out of sample performance YTD is 15.4%, and for the last 12 months is 23.1%. Over the same period the benchmark SPY performance was 15.2% and 20.5% respectively. Since inception, on 3/30/2015, the model gained 32.74% while the benchmark SPY gained 28.37% and the ETF USMV gained 29.09% over the same period. Over the previous week the market value of iM-Best12(USMV)Q2 gained -0.48% at a time when SPY gained 0.65%. A starting capital of $100,000 at inception on 3/30/2015 would have grown to $132,740 which includes $111 cash and excludes $723 spent on fees and slippage. |
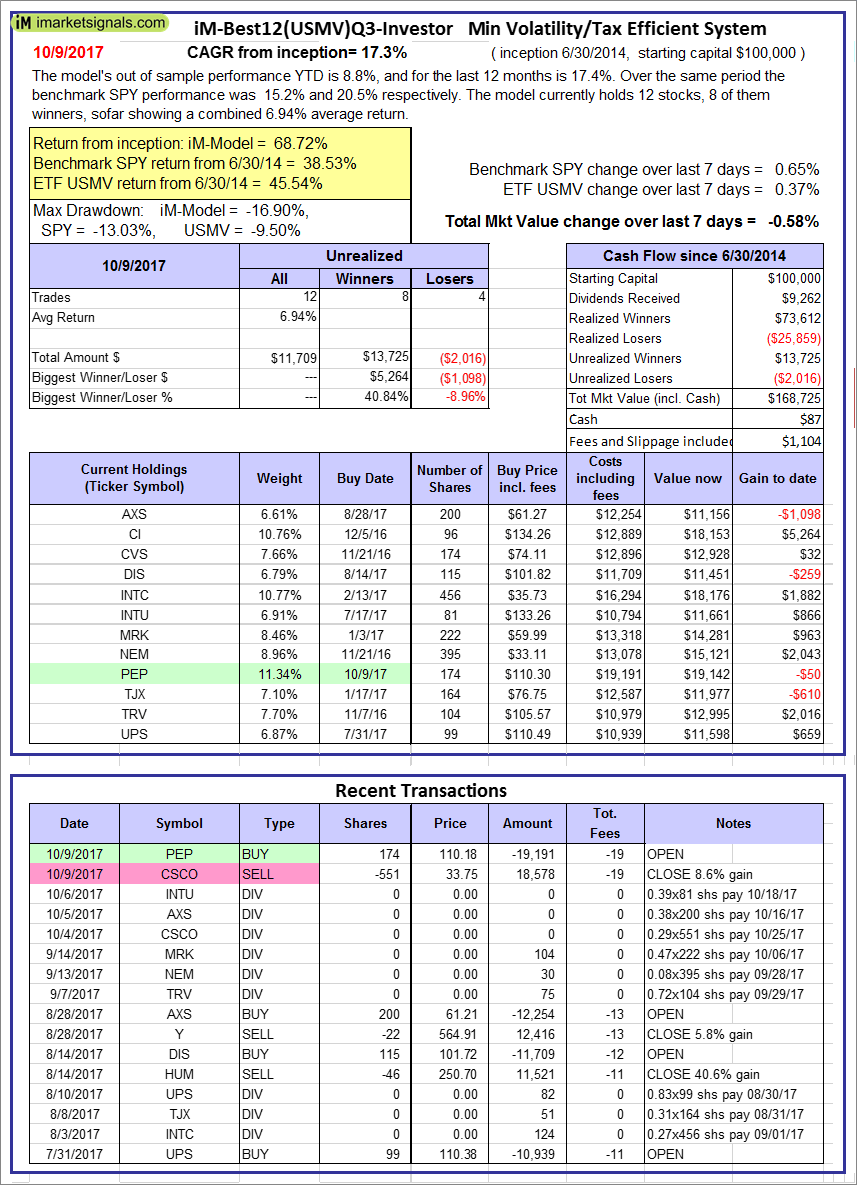 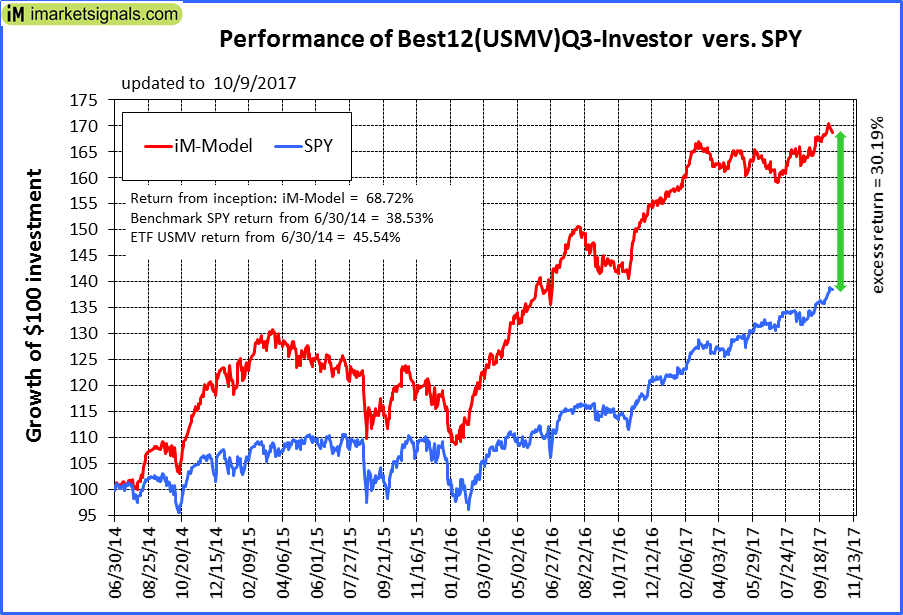 |
iM-Best12(USMV)Q3-Investor: The model’s out of sample performance YTD is 8.8%, and for the last 12 months is 17.4%. Over the same period the benchmark SPY performance was 15.2% and 20.5% respectively. Since inception, on 7/1/2014, the model gained 68.72% while the benchmark SPY gained 38.53% and the ETF USMV gained 45.54% over the same period. Over the previous week the market value of iM-Best12(USMV)Q3 gained -0.58% at a time when SPY gained 0.65%. A starting capital of $100,000 at inception on 7/1/2014 would have grown to $168,725 which includes $87 cash and excludes $1,104 spent on fees and slippage. |
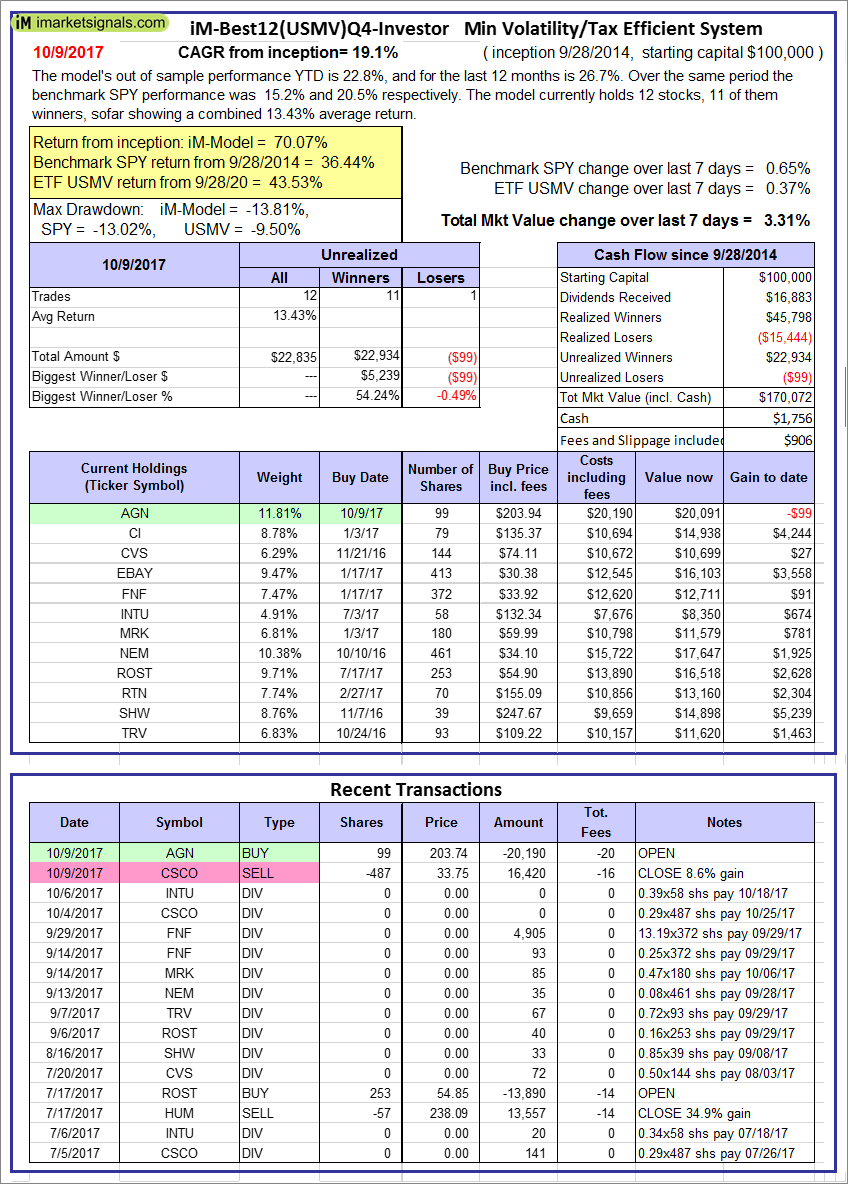 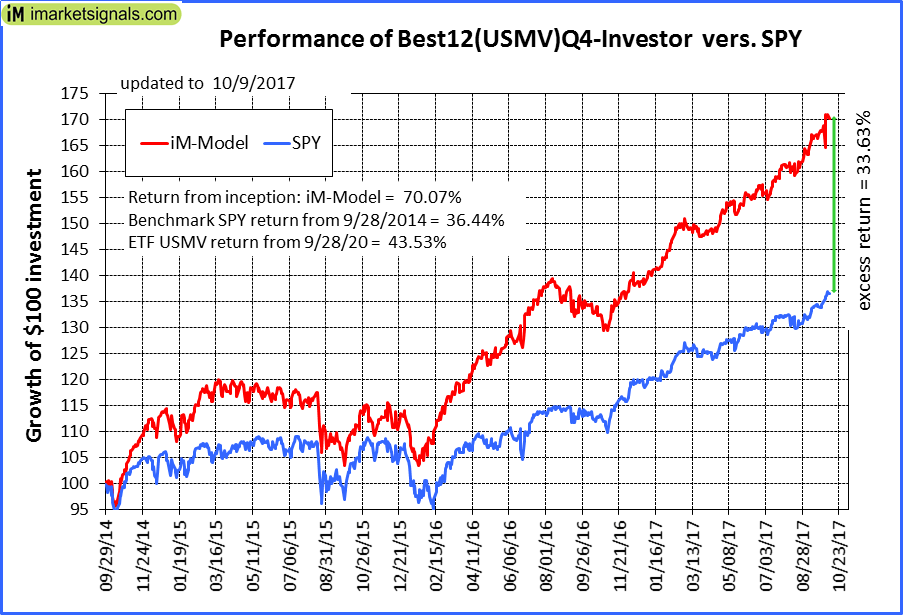 |
iM-Best12(USMV)Q4-Investor: Since inception, on 9/29/2014, the model gained 70.07% while the benchmark SPY gained 36.44% and the ETF USMV gained 43.53% over the same period. Over the previous week the market value of iM-Best12(USMV)Q4 gained 3.31% at a time when SPY gained 0.65%. A starting capital of $100,000 at inception on 9/29/2014 would have grown to $170,072 which includes $1,756 cash and excludes $906 spent on fees and slippage. |
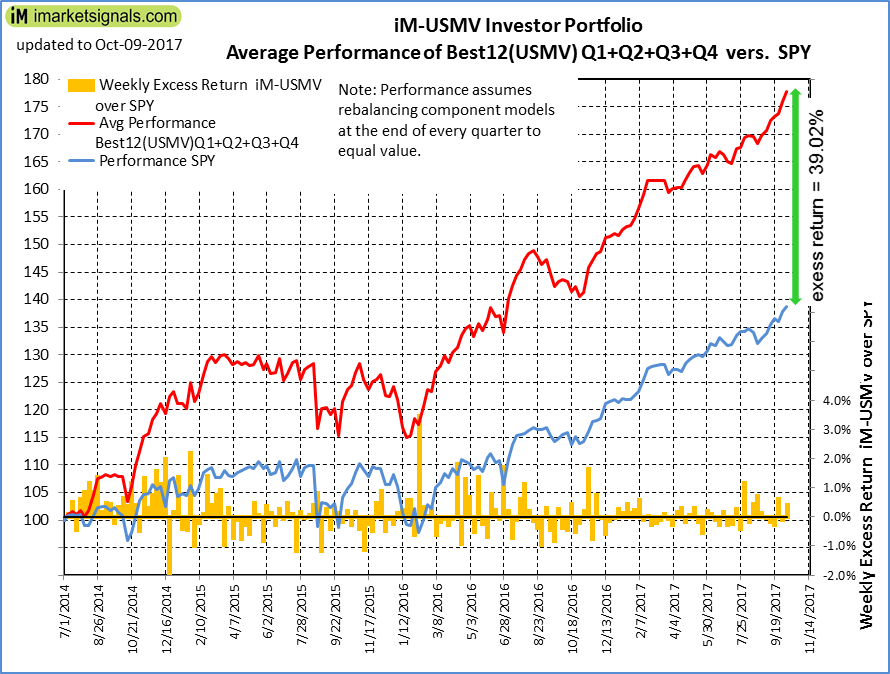 |
Average Performance of iM-Best12(USMV)Q1+Q2+Q3+Q4-Investor resulted in an excess return of 39.02% over SPY. (see iM-USMV Investor Portfolio) |
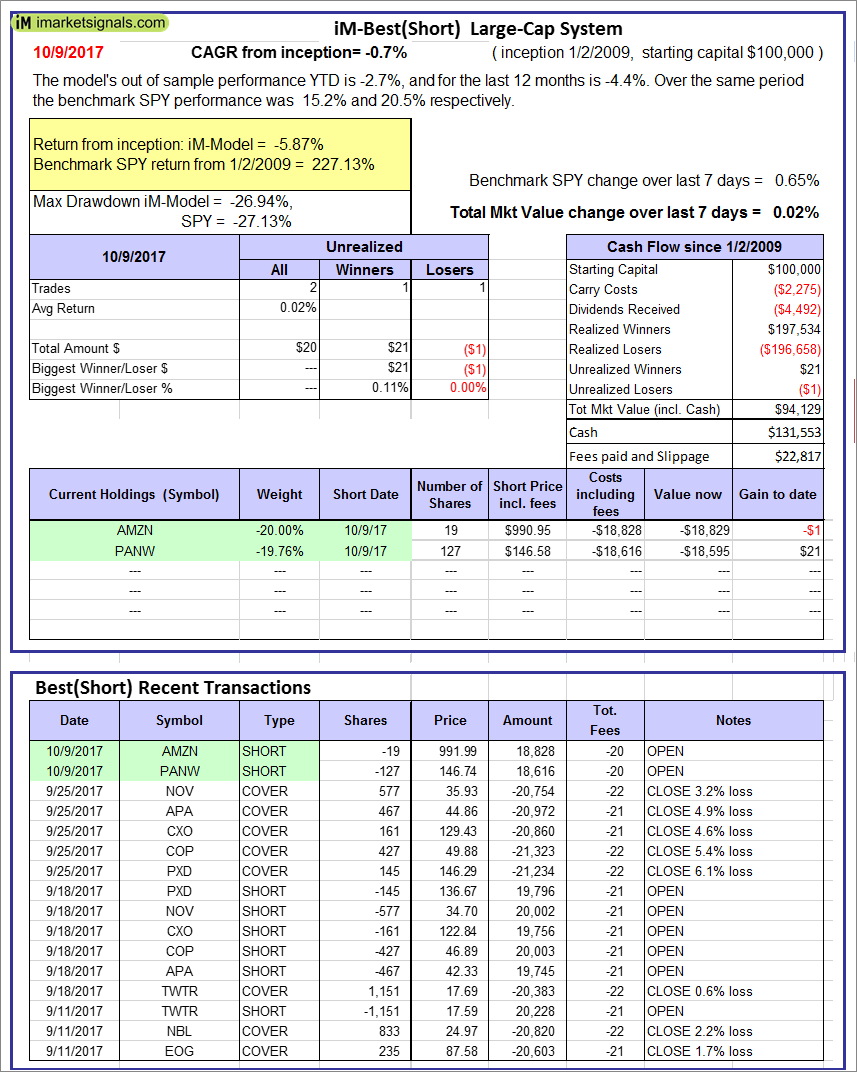 |
iM-Best(Short): The model’s out of sample performance YTD is -2.7%, and for the last 12 months is -4.4%. Over the same period the benchmark SPY performance was 15.2% and 20.5% respectively. Over the previous week the market value of iM-Best(Short) gained 0.02% at a time when SPY gained 0.65%. Over the period 1/2/2009 to 10/9/2017 the starting capital of $100,000 would have grown to $94,129 which includes $131,553 cash and excludes $22,817 spent on fees and slippage. |
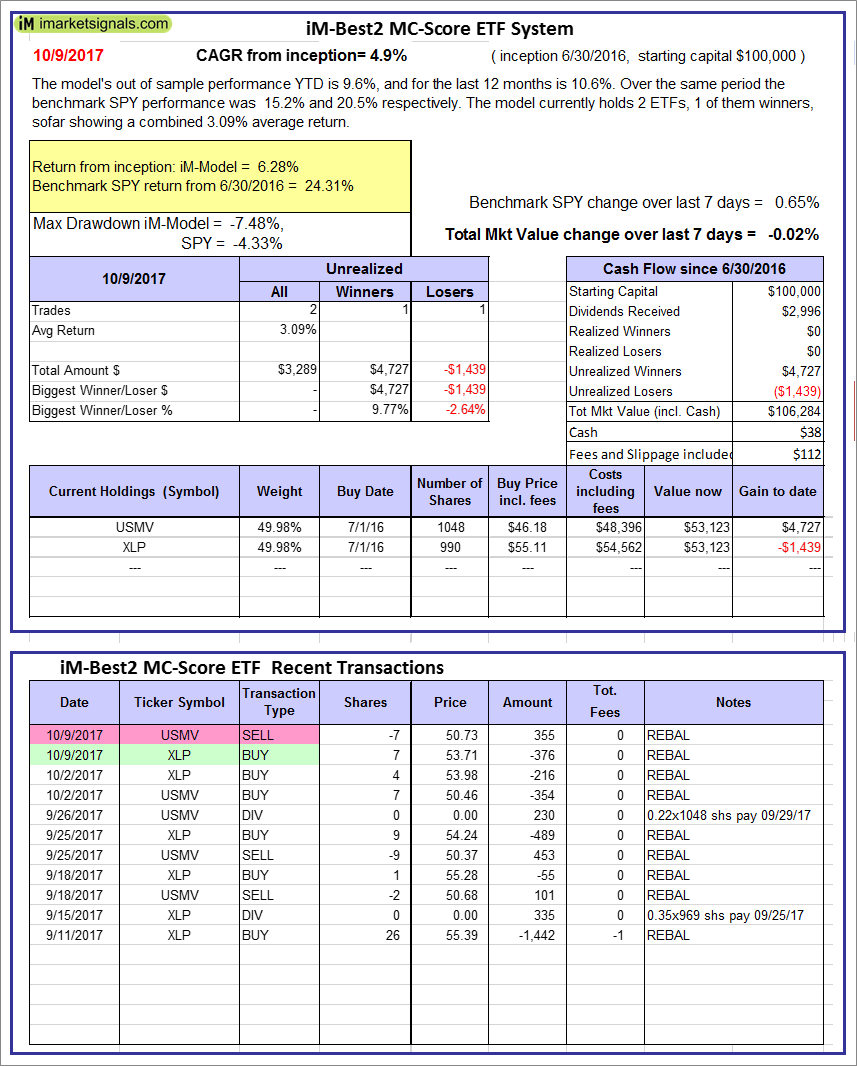 |
iM-Best2 MC-Score ETF System: The model’s out of sample performance YTD is 9.6%, and for the last 12 months is 10.6%. Over the same period the benchmark SPY performance was 15.2% and 20.5% respectively. Over the previous week the market value of the iM-Best2 MC-Score ETF System gained -0.02% at a time when SPY gained 0.65%. A starting capital of $100,000 at inception on 6/30/2016 would have grown to $106,284 which includes $38 cash and excludes $112 spent on fees and slippage. |
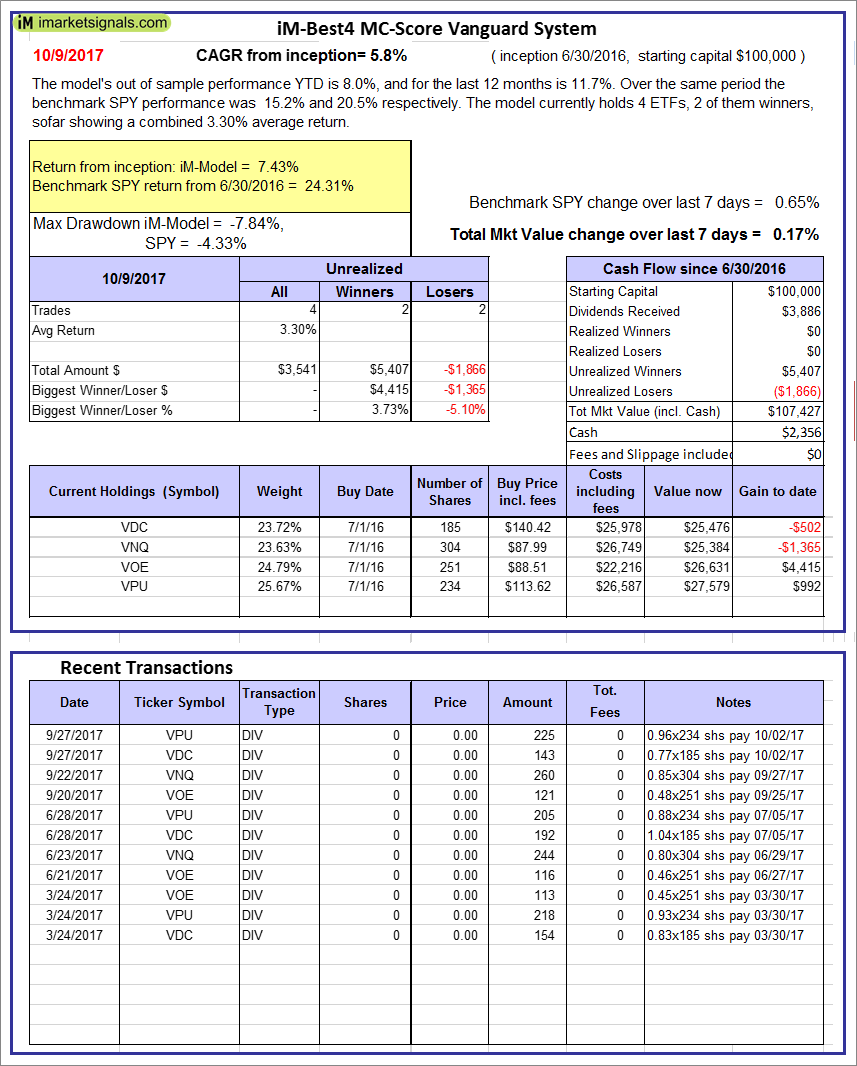 |
iM-Best4 MC-Score Vanguard System: The model’s out of sample performance YTD is 8.0%, and for the last 12 months is 11.7%. Over the same period the benchmark SPY performance was 15.2% and 20.5% respectively. Over the previous week the market value of the iM-Best4 MC-Score Vanguard System gained 0.17% at a time when SPY gained 0.65%. A starting capital of $100,000 at inception on 6/30/2016 would have grown to $107,427 which includes $2,356 cash and excludes $00 spent on fees and slippage. |
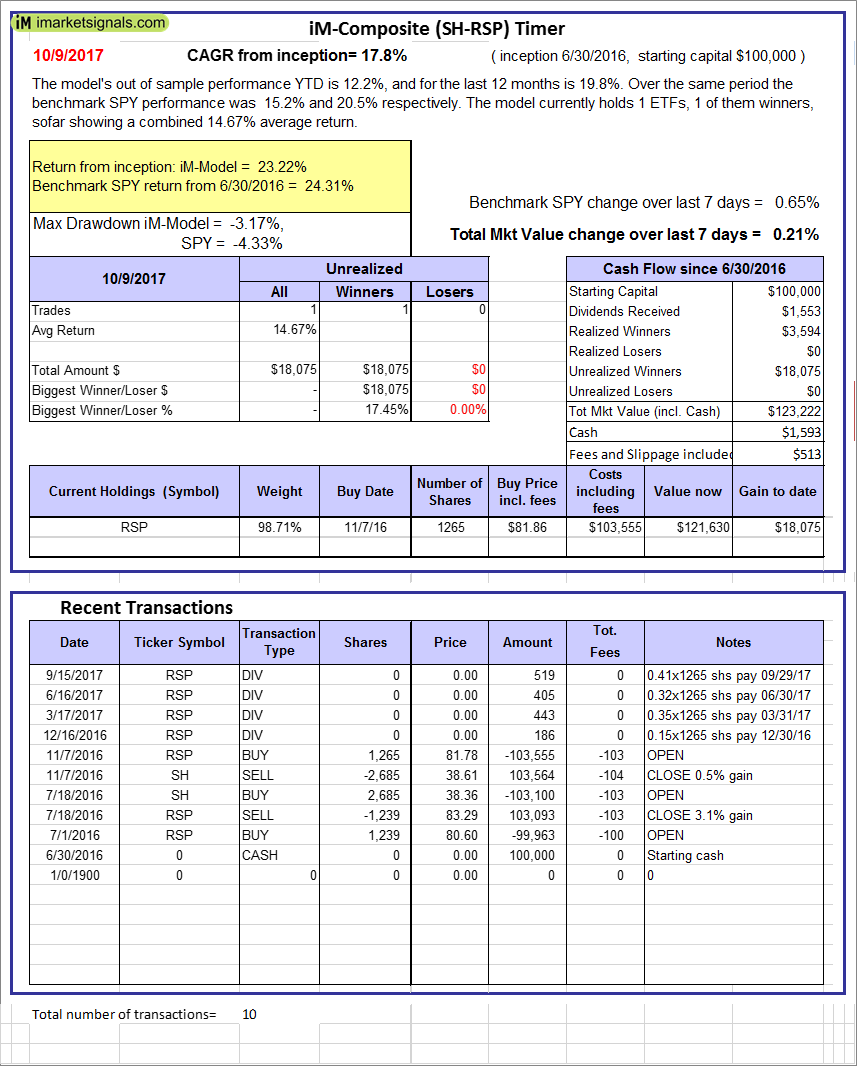 |
iM-Composite (SH-RSP) Timer: The model’s out of sample performance YTD is 12.2%, and for the last 12 months is 19.8%. Over the same period the benchmark SPY performance was 15.2% and 20.5% respectively. Over the previous week the market value of the iM-Composite (SH-RSP) Timer gained 0.21% at a time when SPY gained 0.65%. A starting capital of $100,000 at inception on 6/30/2016 would have grown to $123,222 which includes $1,593 cash and excludes $513 spent on fees and slippage. |
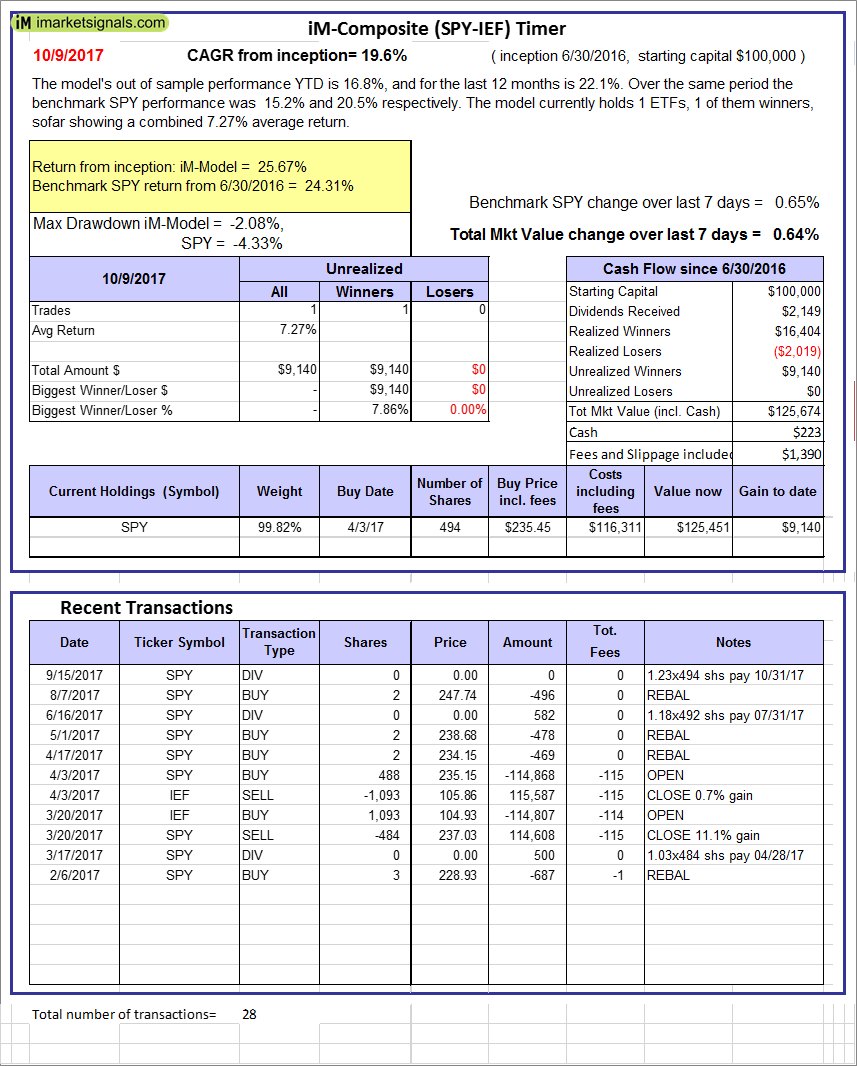 |
iM-Composite (SPY-IEF) Timer: The model’s out of sample performance YTD is 16.8%, and for the last 12 months is 22.1%. Over the same period the benchmark SPY performance was 15.2% and 20.5% respectively. Over the previous week the market value of the iM-Composite (SPY-IEF) Timer gained 0.64% at a time when SPY gained 0.65%. A starting capital of $100,000 at inception on 6/30/2016 would have grown to $125,674 which includes $223 cash and excludes $1,390 spent on fees and slippage. |
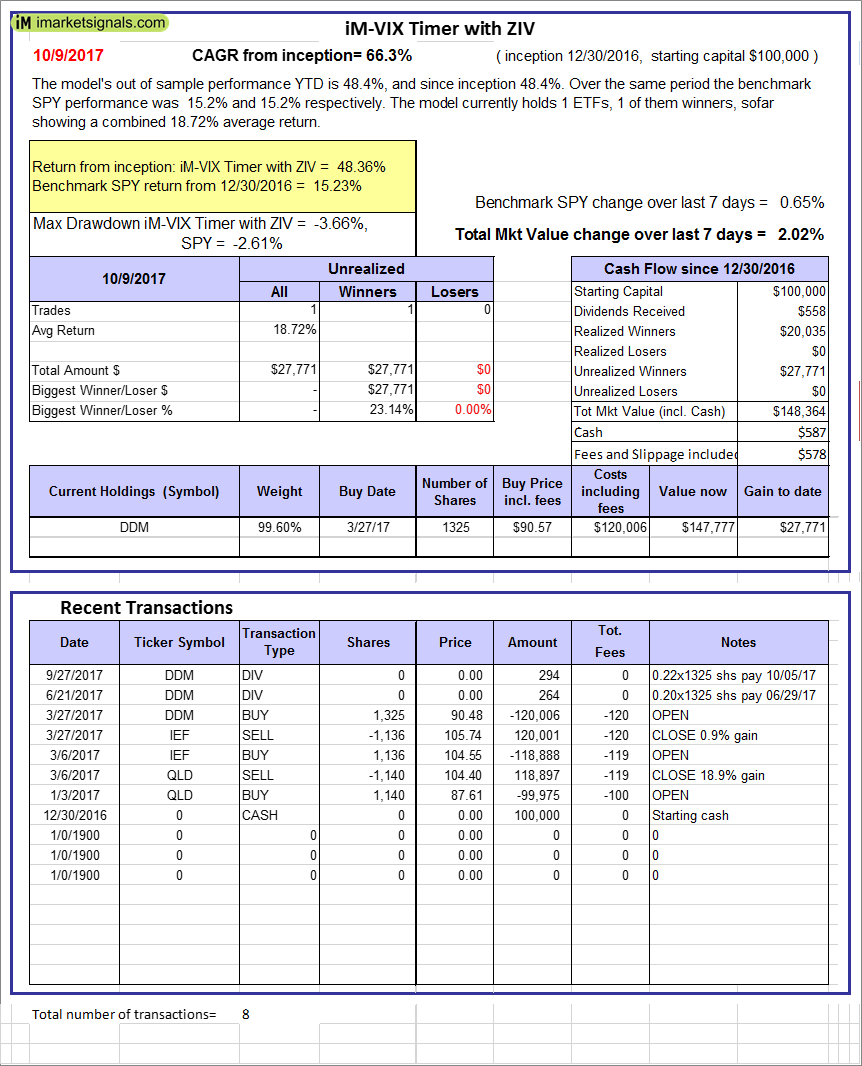 |
iM-VIX Timer with ZIV: The model’s out of sample performance YTD is 48.4%, and since inception 48.4%. Over the same period the benchmark SPY performance was 15.2% and 15.2% respectively. Over the previous week the market value of the iM-VIX Timer with ZIV gained 2.02% at a time when SPY gained 0.65%. A starting capital of $100,000 at inception on 6/30/2016 would have grown to $148,364 which includes $587 cash and excludes $578 spent on fees and slippage. |
 |
iM-Composite(Gold-Stocks-Bond) Timer: The model’s out of sample performance YTD is 22.3%, and for the last 12 months is 29.1%. Over the same period the benchmark SPY performance was 15.2% and 20.5% respectively. Over the previous week the market value of the iM-Composite(Gold-Stocks-Bond) Timer gained 1.12% at a time when SPY gained 0.65%. A starting capital of $100,000 at inception on 6/30/2016 would have grown to $127,075 which includes $53 cash and excludes $1,955 spent on fees and slippage. |
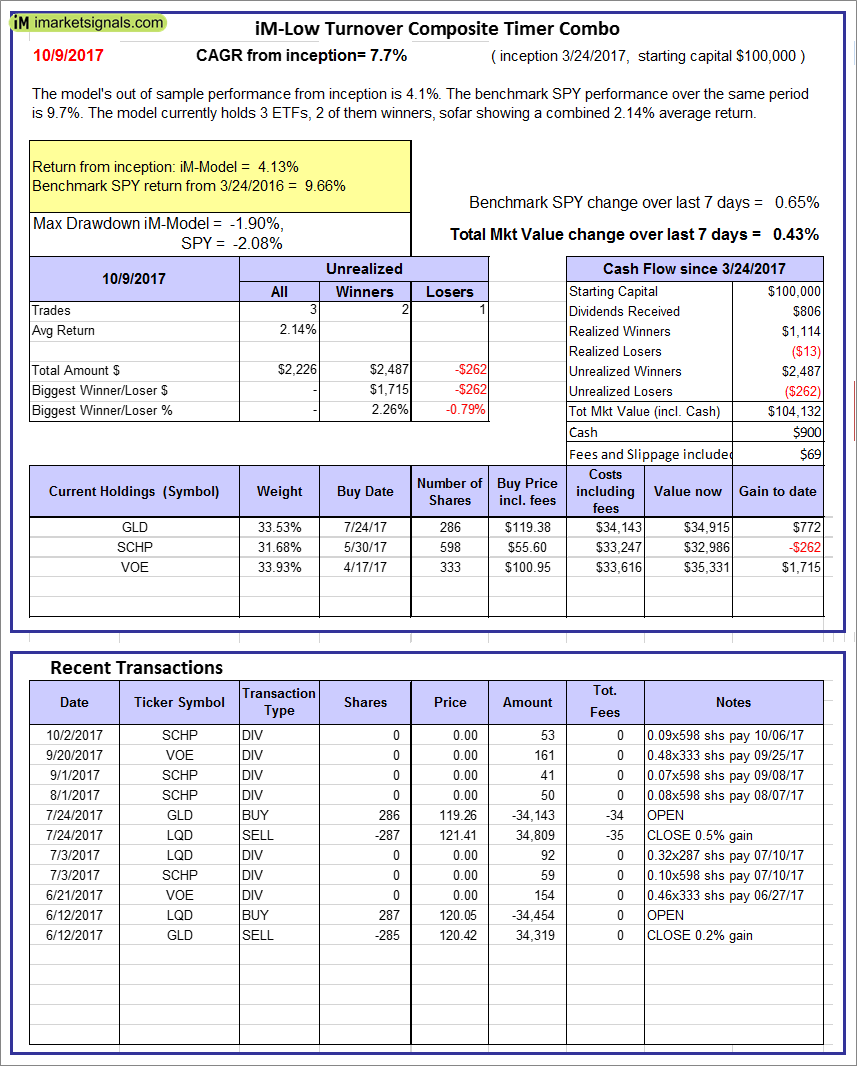 |
iM-Low Turnover Composite Timer Combo: The model’s out of sample performance from inception is 4.1%. The benchmark SPY performance over the same period is 9.7%. Over the previous week the market value of the iM-Low Turnover Composite Timer Combo gained 0.43% at a time when SPY gained 0.65%. A starting capital of $100,000 at inception on 3/24/27 would have grown to $104,132 which includes $900 cash and excludes $69 spent on fees and slippage. |
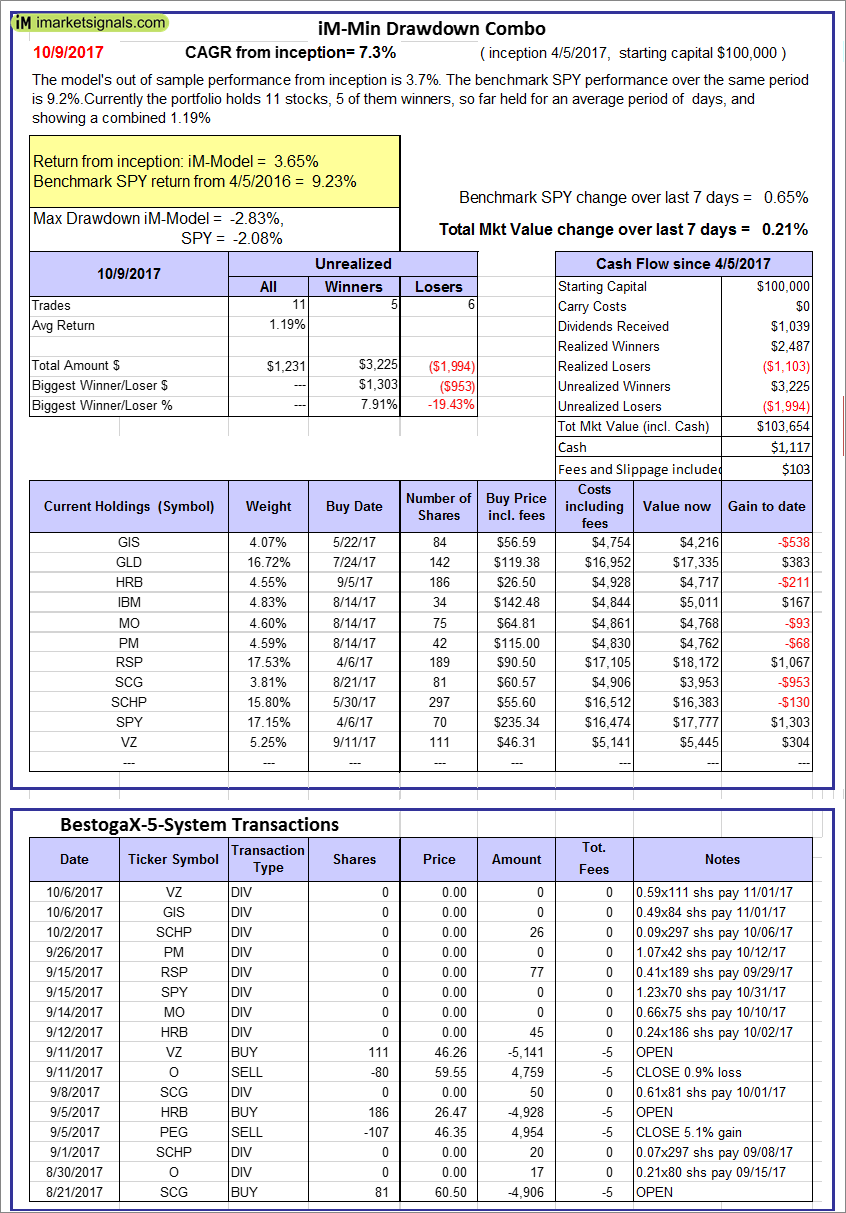 |
iM-Min Drawdown Combo: The model’s out of sample performance from inception is 3.7%. The benchmark SPY performance over the same period is 9.2%. Over the previous week the market value of the iM-Min Drawdown Combo gained 0.21% at a time when SPY gained 0.65%. A starting capital of $100,000 at inception on 4/5/2017 would have grown to $103,654 which includes $1,117 cash and excludes $103 spent on fees and slippage. |
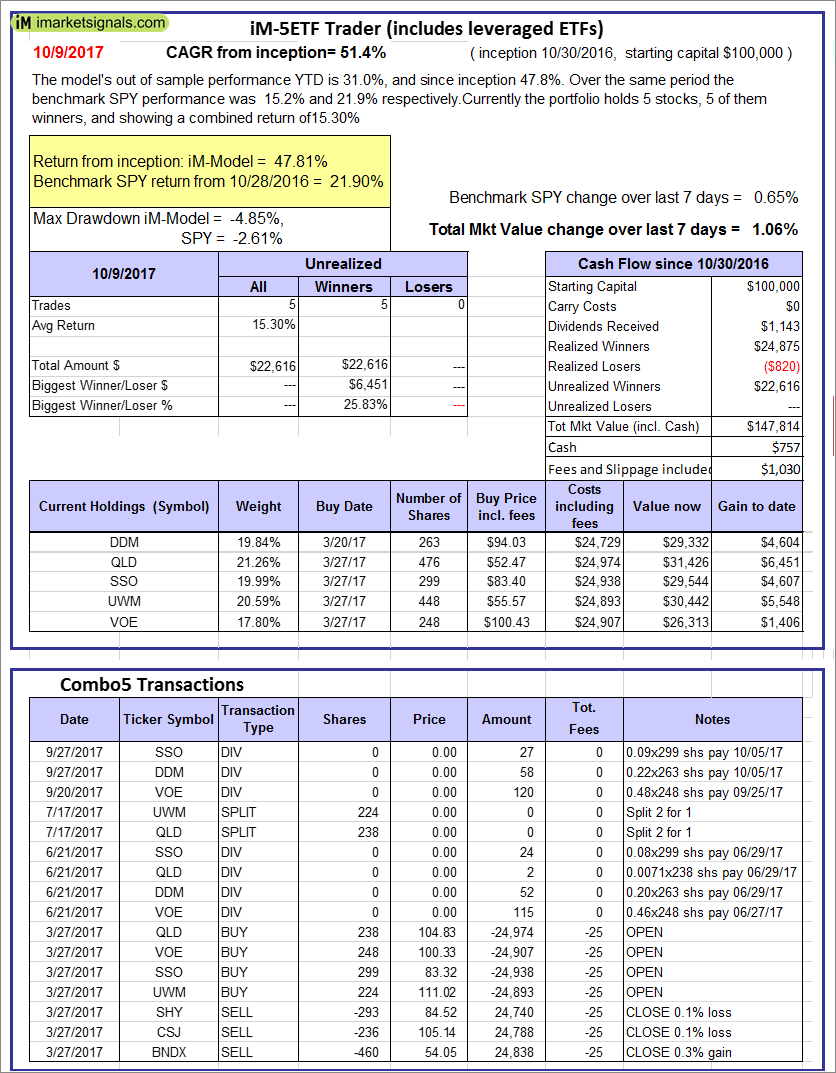 |
iM-5ETF Trader (includes leveraged ETFs): The model’s out of sample performance YTD is 31.0%, and since inception 47.8%. Over the same period the benchmark SPY performance was 15.2% and 21.9% respectively. Over the previous week the market value of the iM-5ETF Trader (includes leveraged ETFs) gained 1.06% at a time when SPY gained 0.65%. A starting capital of $100,000 at inception on 10/30/2016 would have grown to $147,814 which includes $757 cash and excludes $1,030 spent on fees and slippage. |
 |
iM-Standard 5ETF Trader (excludes leveraged ETFs): The model’s out of sample performance YTD is 15.3%, and since inception 18.5%. Over the same period the benchmark SPY performance was 15.2% and 21.9% respectively. Over the previous week the market value of the iM-Standard 5ETF Trader (excludes leveraged ETFs) gained 0.38% at a time when SPY gained 0.65%. A starting capital of $100,000 at inception on 10/30/2016 would have grown to $118,526 which includes $1,272 cash and excludes $880 spent on fees and slippage. |
iM-Best Reports – 10/9/2017
Posted in pmp SPY-SH
Leave a Reply
You must be logged in to post a comment.