
  |
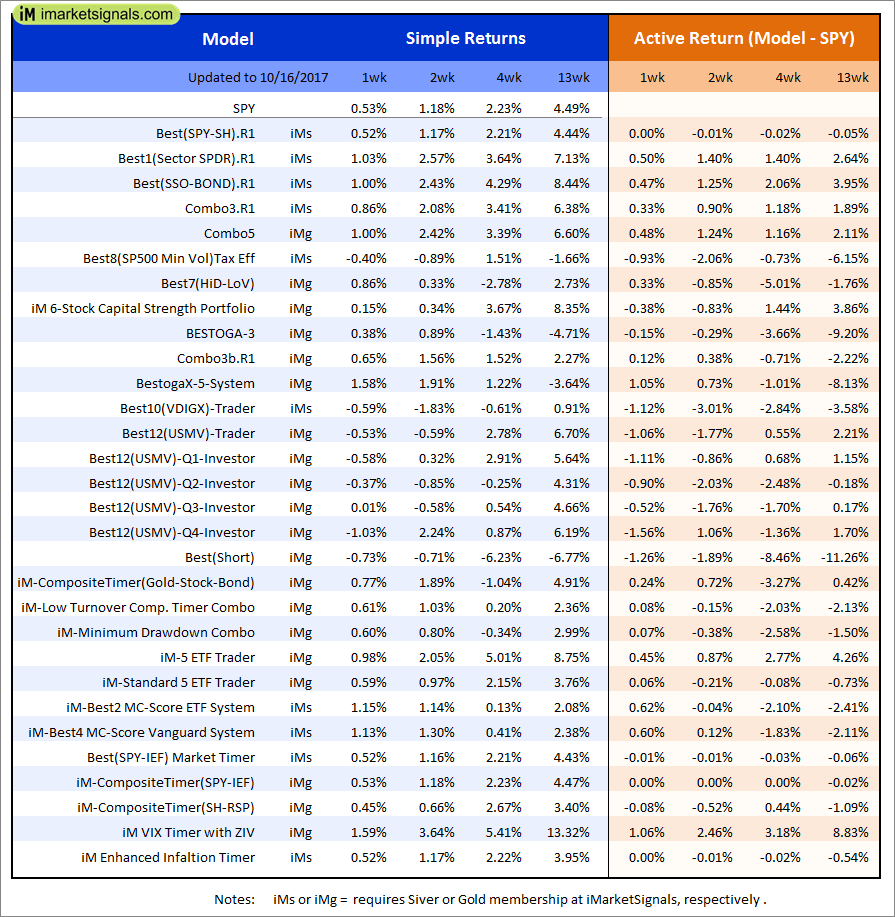
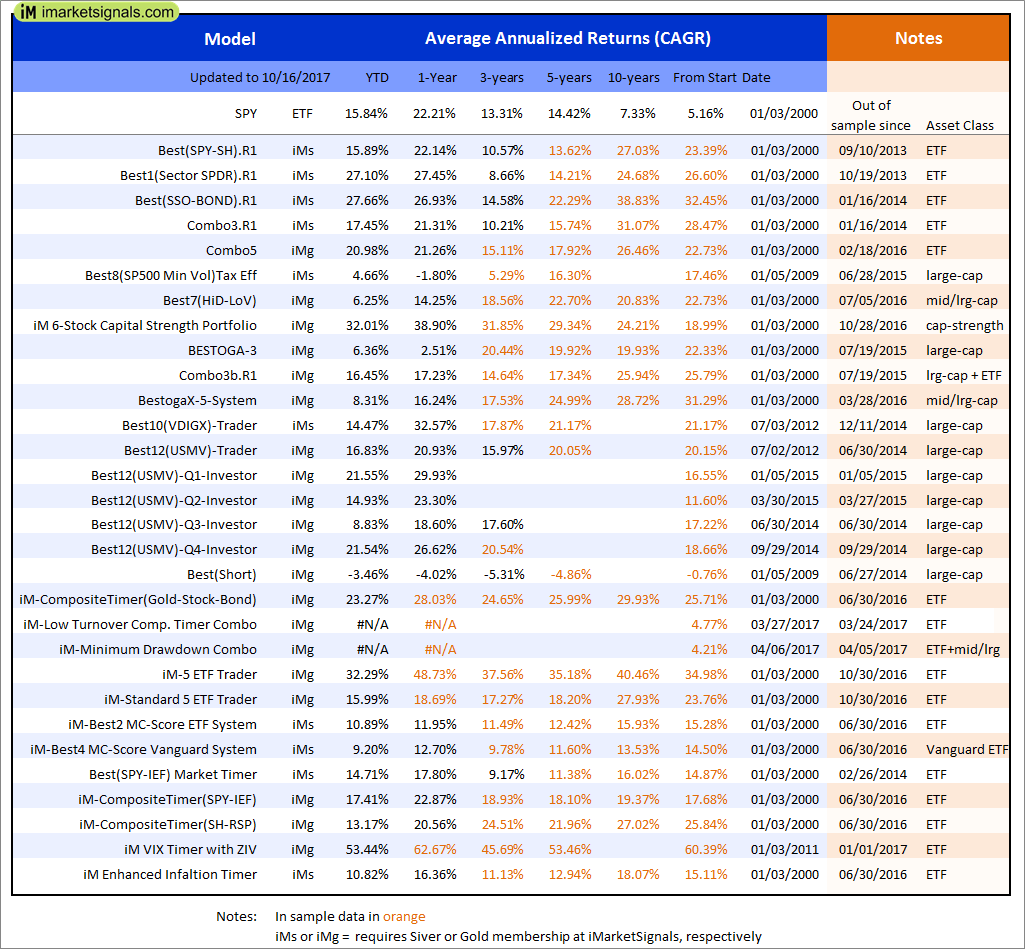
Out of sample performance summary of our models for the past 1, 2, 4 and 13 week periods. The active active return indicates how the models over- or underperformed the benchmark ETF SPY. Also the YTD, and the 1-, 3-, 5- and 10-year annualized returns are shown in the second table |
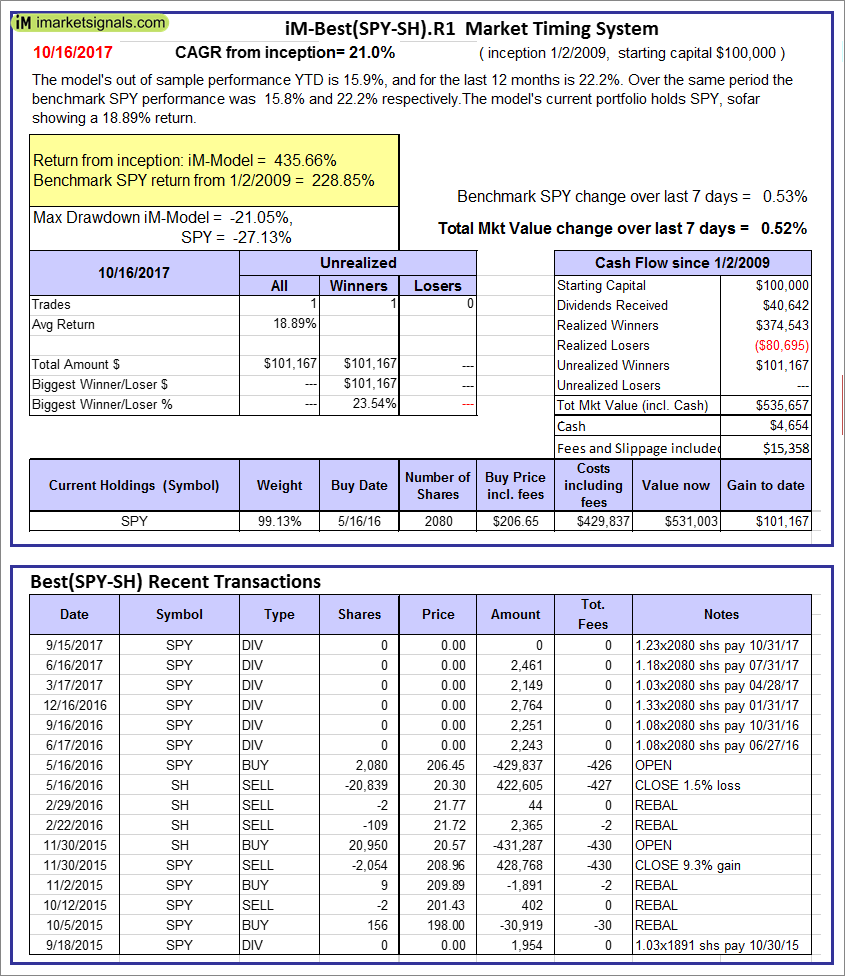 |
iM-Best(SPY-SH).R1: The model’s out of sample performance YTD is 15.9%, and for the last 12 months is 22.2%. Over the same period the benchmark SPY performance was 15.8% and 22.2% respectively. Over the previous week the market value of Best(SPY-SH) gained 0.52% at a time when SPY gained 0.53%. A starting capital of $100,000 at inception on 1/2/2009 would have grown to $535,657 which includes $4,654 cash and excludes $15,358 spent on fees and slippage. |
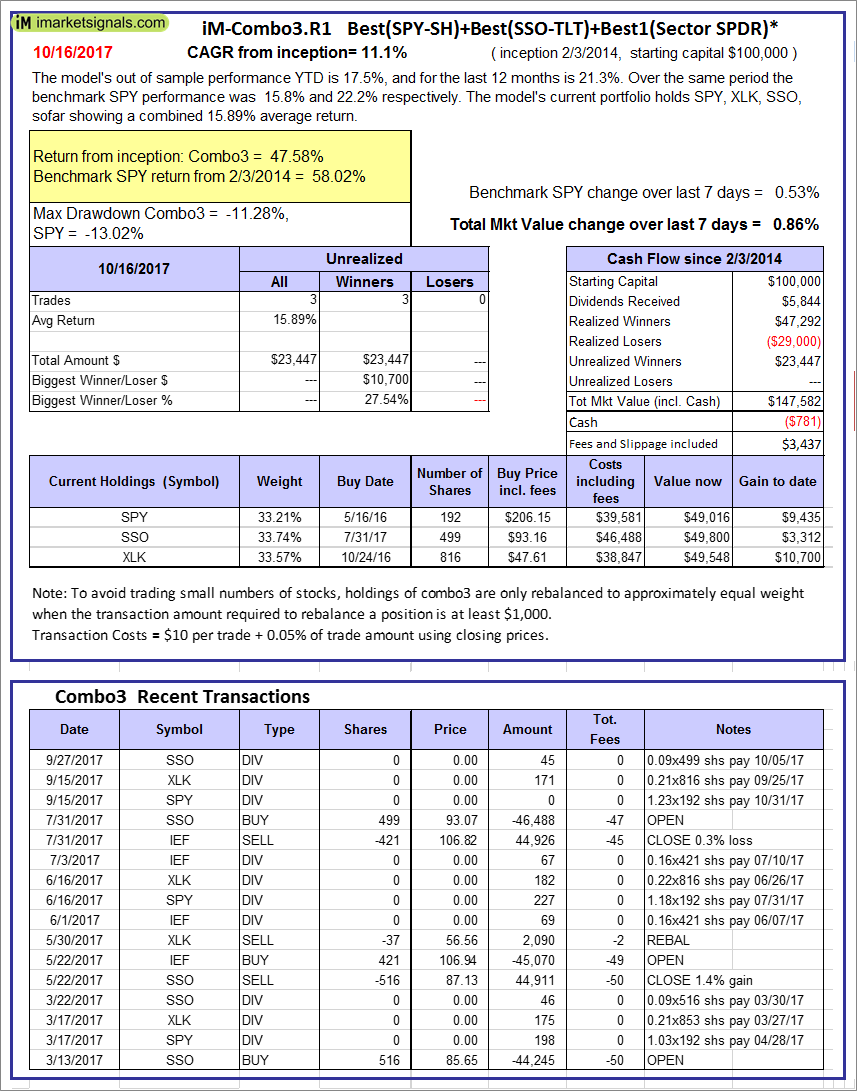 |
iM-Combo3.R1: The model’s out of sample performance YTD is 17.5%, and for the last 12 months is 21.3%. Over the same period the benchmark SPY performance was 15.8% and 22.2% respectively. Over the previous week the market value of iM-Combo3.R1 gained 0.86% at a time when SPY gained 0.53%. A starting capital of $100,000 at inception on 2/3/2014 would have grown to $147,582 which includes -$781 cash and excludes $3,437 spent on fees and slippage. |
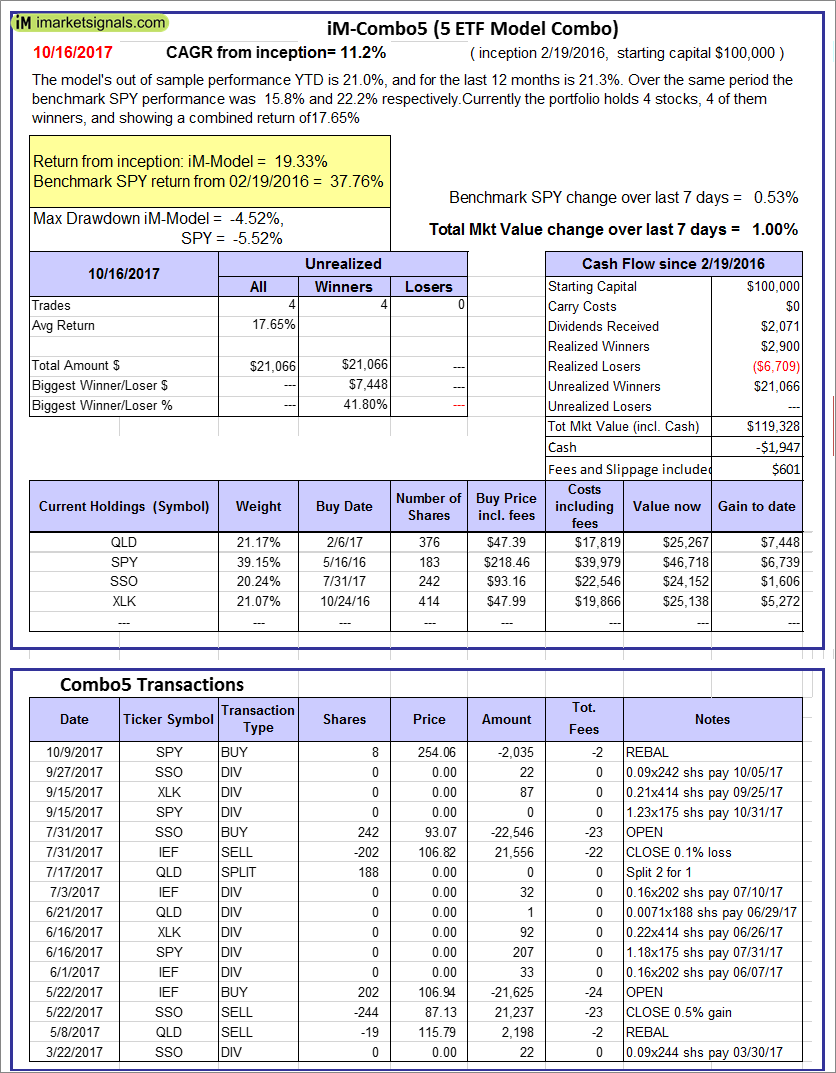 |
iM-Combo5: The model’s out of sample performance YTD is 21.0%, and for the last 12 months is 21.3%. Over the same period the benchmark SPY performance was 15.8% and 22.2% respectively. Over the previous week the market value of iM-Combo5 gained 1.00% at a time when SPY gained 0.53%. A starting capital of $100,000 at inception on 2/22/2016 would have grown to $119,328 which includes -$1,947 cash and excludes $601 spent on fees and slippage. |
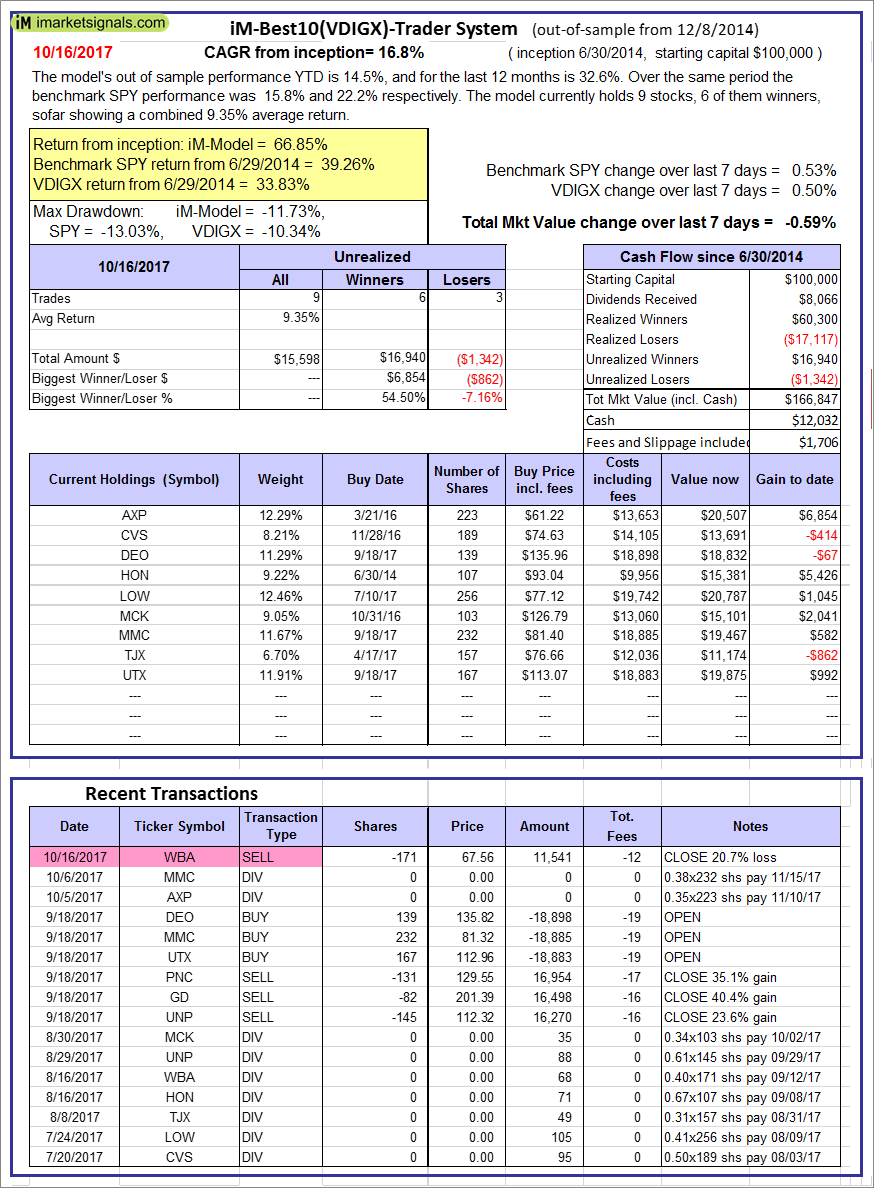 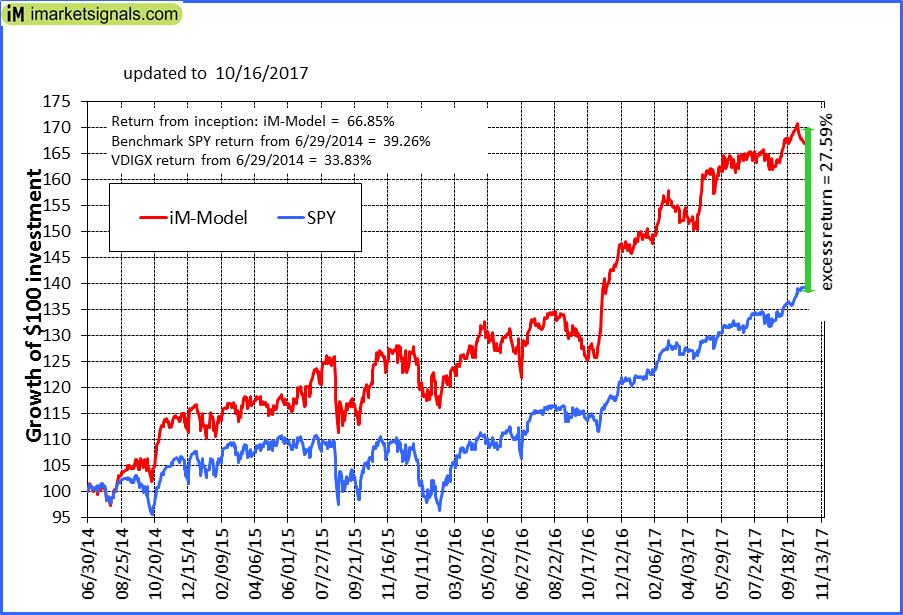 |
iM-Best10(VDIGX)-Trader: The model’s out of sample performance YTD is 14.5%, and for the last 12 months is 32.6%. Over the same period the benchmark SPY performance was 15.8% and 22.2% respectively. Since inception, on 7/1/2014, the model gained 66.85% while the benchmark SPY gained 39.26% and VDIGX gained 33.83% over the same period. Over the previous week the market value of iM-Best10(VDIGX) gained -0.59% at a time when SPY gained 0.53%. A starting capital of $100,000 at inception on 7/1/2014 would have grown to $166,847 which includes $12,032 cash and excludes $1,706 spent on fees and slippage. |
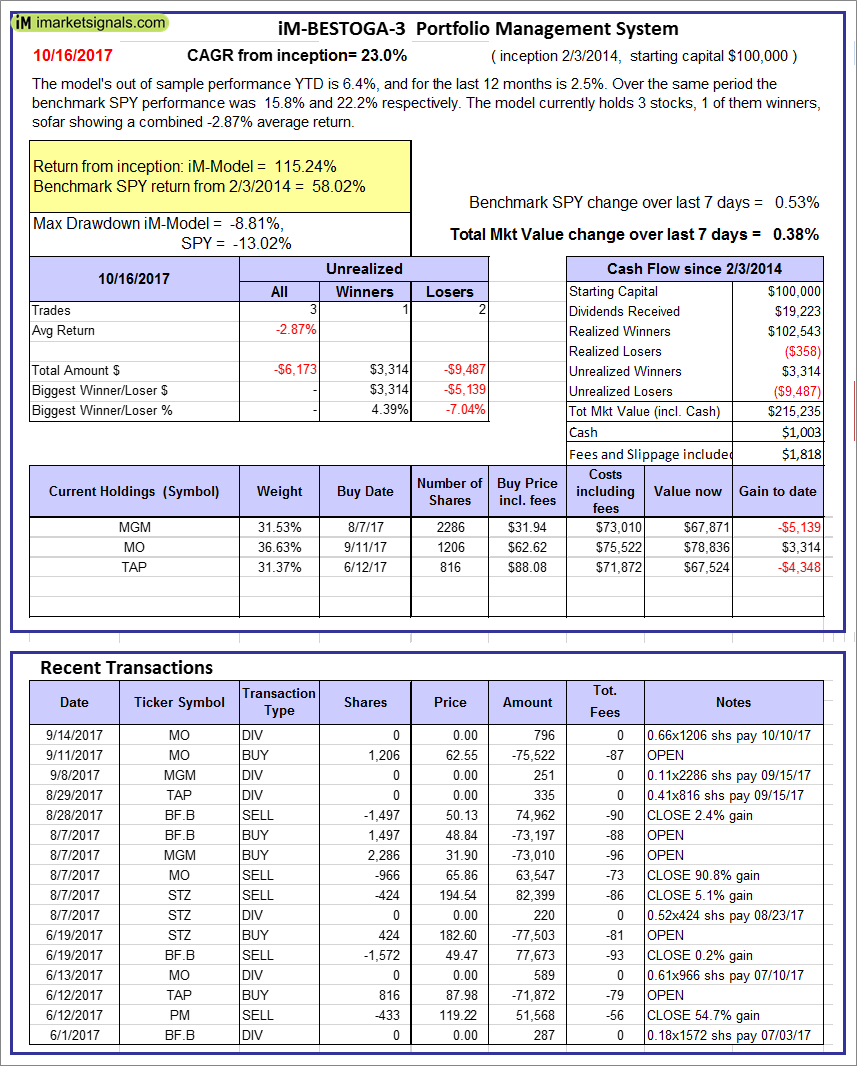 |
iM-BESTOGA-3: The model’s out of sample performance YTD is 6.4%, and for the last 12 months is 2.5%. Over the same period the benchmark SPY performance was 15.8% and 22.2% respectively. Over the previous week the market value of iM-BESTOGA-3 gained 0.38% at a time when SPY gained 0.53%. A starting capital of $100,000 at inception on 2/3/2014 would have grown to $215,235 which includes $1,003 cash and excludes $1,818 spent on fees and slippage. |
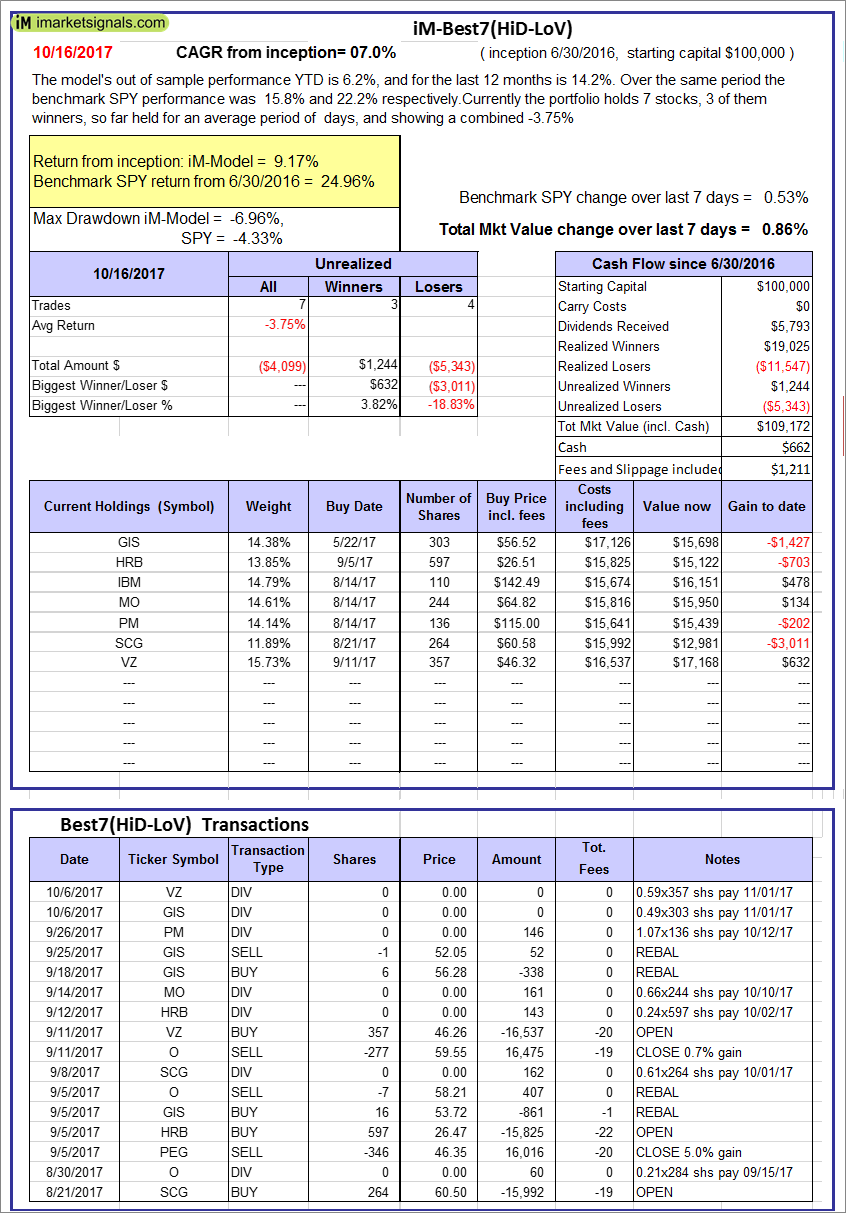 |
iM-Best7(HiD-LoV): The model’s out of sample performance YTD is 6.2%, and for the last 12 months is 14.2%. Over the same period the benchmark SPY performance was 15.8% and 22.2% respectively. Over the previous week the market value of iM-BESTOGA-3 gained 0.86% at a time when SPY gained 0.53%. A starting capital of $100,000 at inception on 6/30/2016 would have grown to $109,172 which includes $662 cash and excludes $1,211 spent on fees and slippage. |
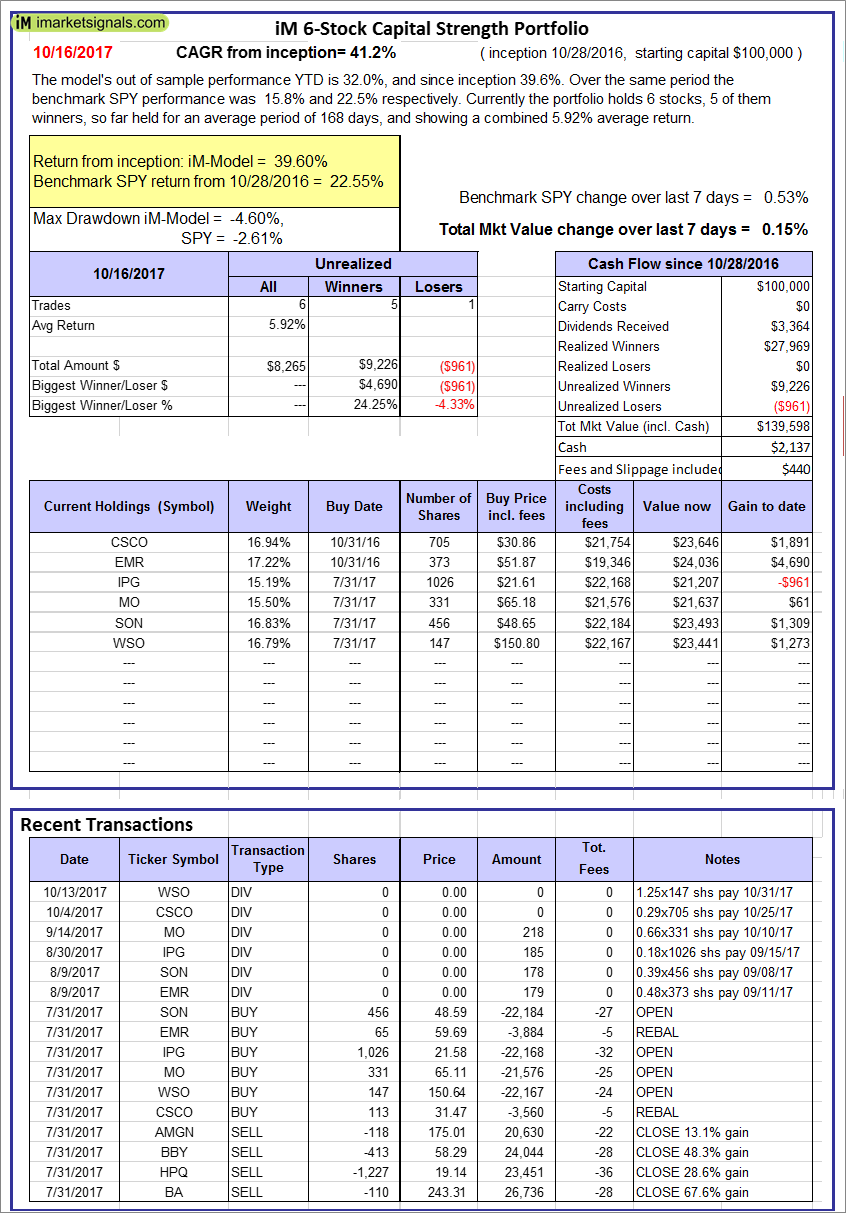 |
iM 6-Stock Capital Strength Portfolio: The model’s out of sample performance YTD is 32.0%, and since inception 39.6%. Over the same period the benchmark SPY performance was 15.8% and 22.5% respectively. Over the previous week the market value of the iM 6-Stock Capital Strength Portfolio gained 0.15% at a time when SPY gained 0.53%. A starting capital of $100,000 at inception on 10/28/2016 would have grown to $139,598 which includes $2,137 cash and excludes $440 spent on fees and slippage. |
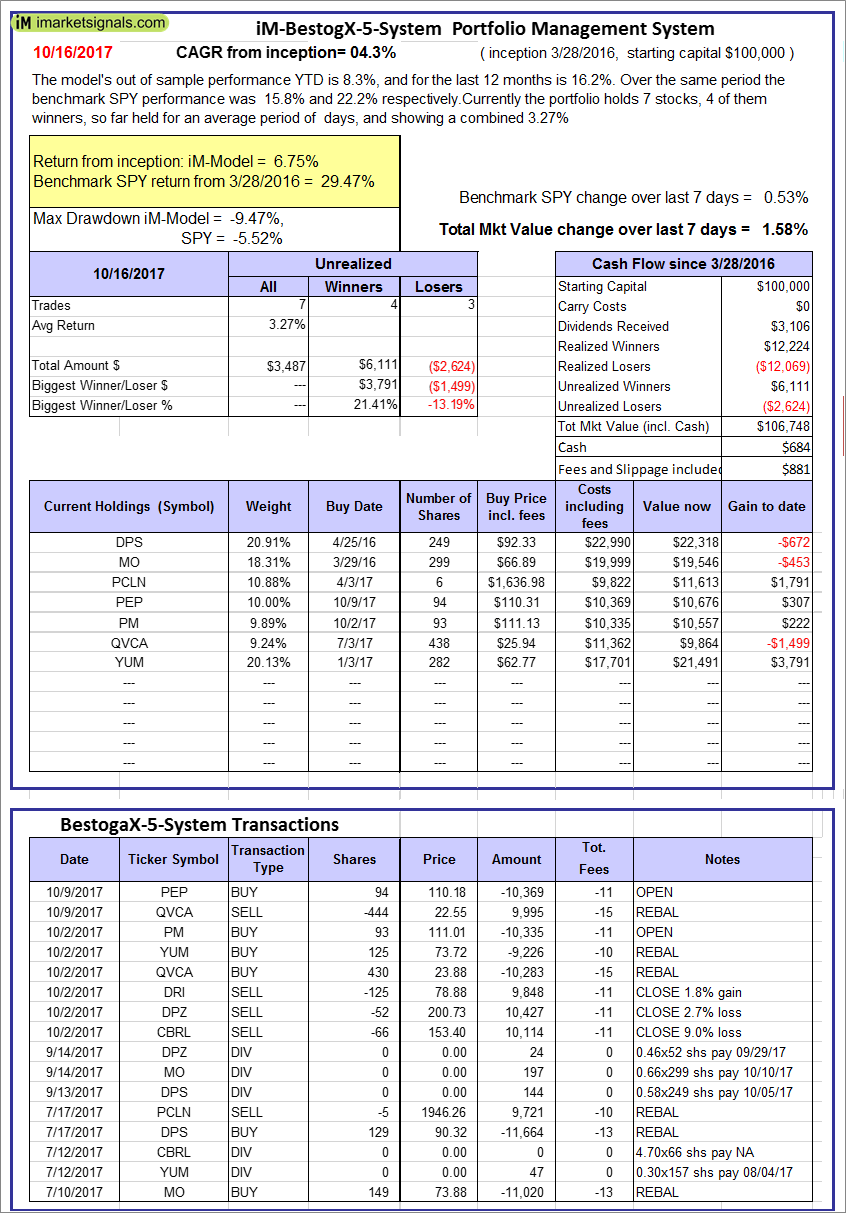 |
iM-BestogaX5-System: The model’s out of sample performance YTD is 8.3%, and for the last 12 months is 16.2%. Over the same period the benchmark SPY performance was 15.8% and 22.2% respectively. Over the previous week the market value of iM-Best8(S&P 500)Tax-Eff. gained 1.58% at a time when SPY gained 0.53%. A starting capital of $100,000 at inception on 3/28/2016 would have grown to $106,748 which includes $684 cash and excludes $881 spent on fees and slippage. |
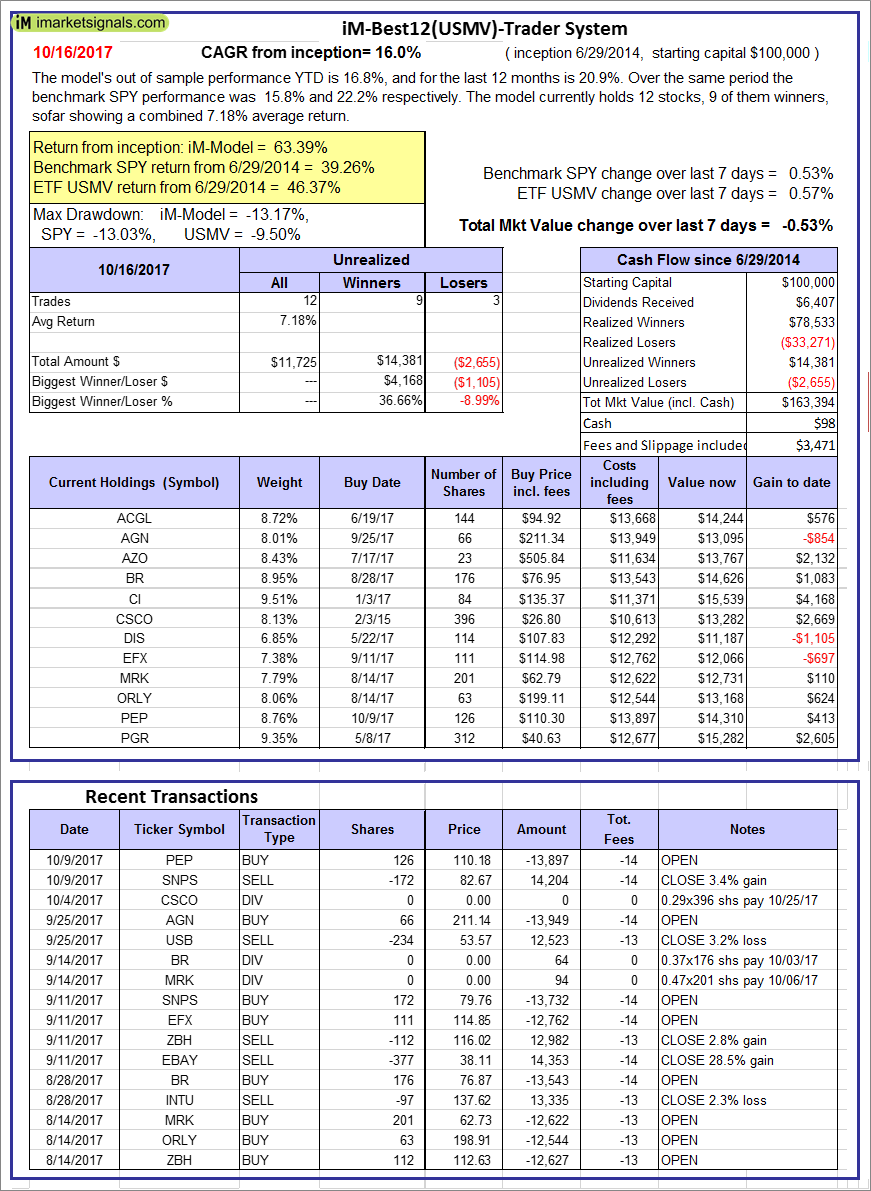  |
iM-Best12(USMV)-Trader: The model’s out of sample performance YTD is 16.8%, and for the last 12 months is 20.9%. Over the same period the benchmark SPY performance was 15.8% and 22.2% respectively. Since inception, on 6/30/2014, the model gained 63.39% while the benchmark SPY gained 39.26% and the ETF USMV gained 46.37% over the same period. Over the previous week the market value of iM-Best12(USMV)-Trader gained -0.53% at a time when SPY gained 0.53%. A starting capital of $100,000 at inception on 6/30/2014 would have grown to $163,394 which includes $98 cash and excludes $3,471 spent on fees and slippage. |
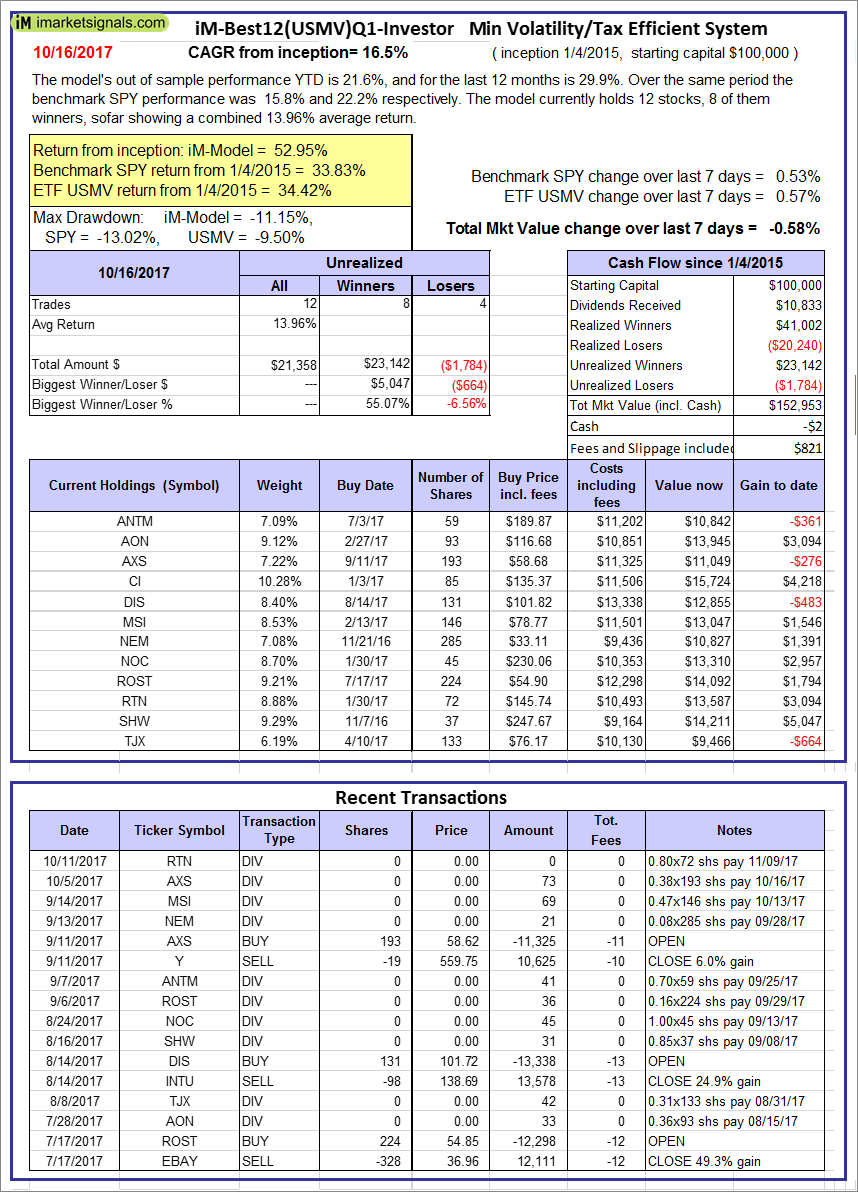 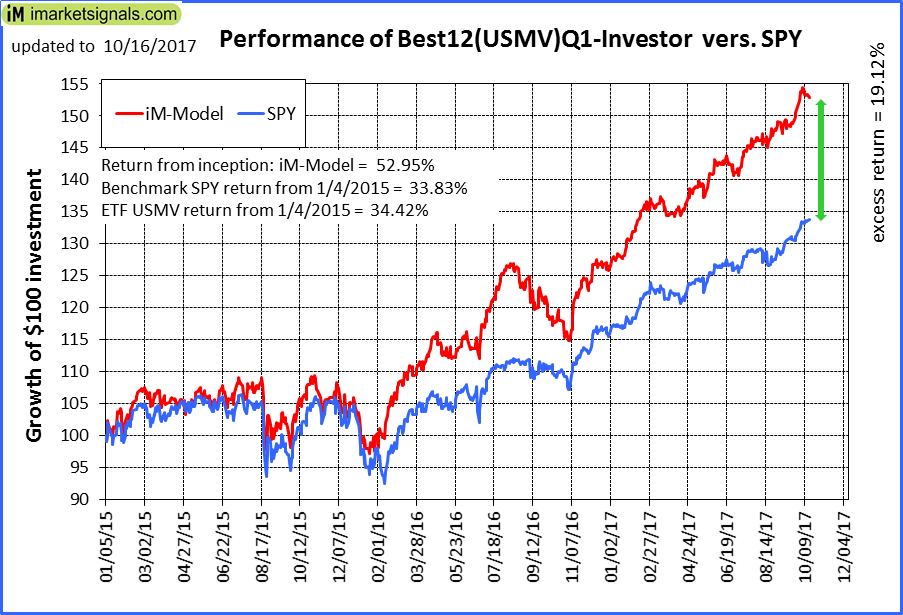 |
iM-Best12(USMV)Q1-Investor: The model’s out of sample performance YTD is 21.6%, and for the last 12 months is 29.9%. Over the same period the benchmark SPY performance was 15.8% and 22.2% respectively. Since inception, on 1/5/2015, the model gained 52.95% while the benchmark SPY gained 33.83% and the ETF USMV gained 34.42% over the same period. Over the previous week the market value of iM-Best12(USMV)Q1 gained -0.58% at a time when SPY gained 0.53%. A starting capital of $100,000 at inception on 1/5/2015 would have grown to $152,953 which includes -$2 cash and excludes $821 spent on fees and slippage. |
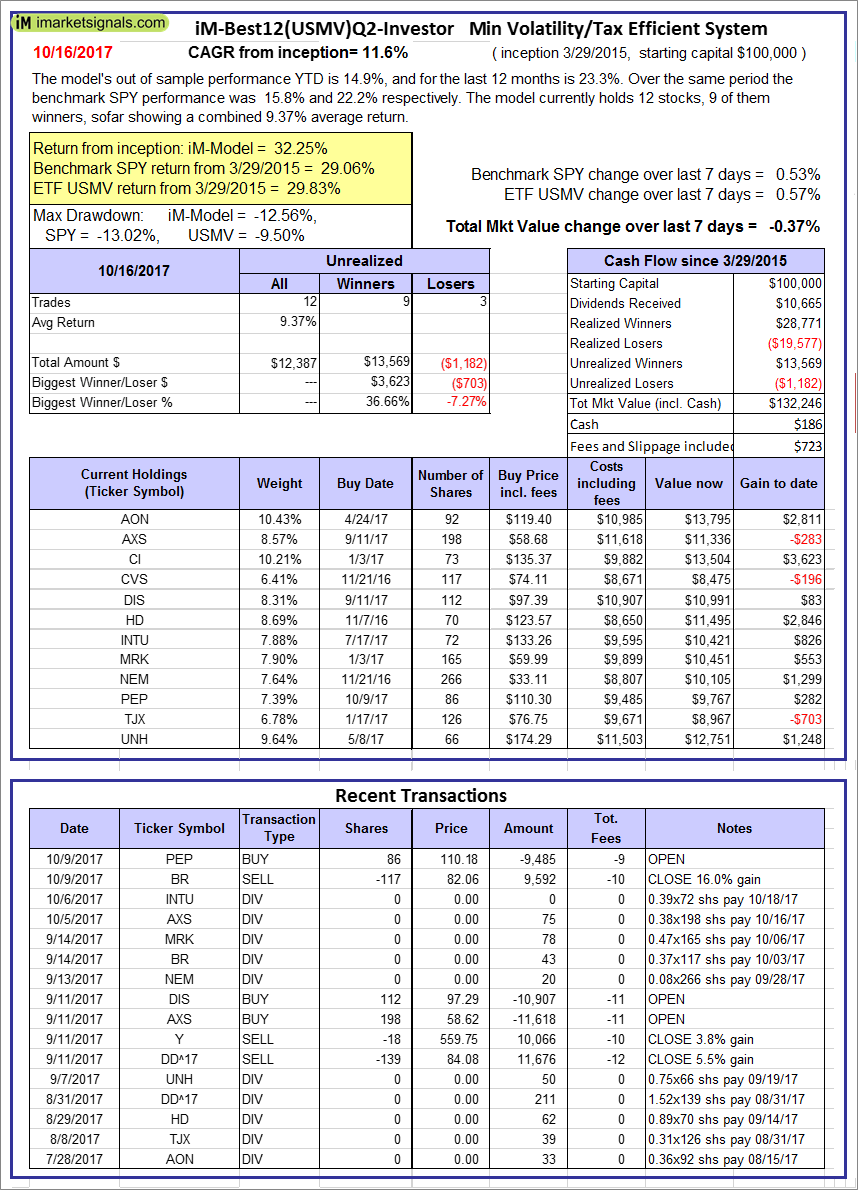 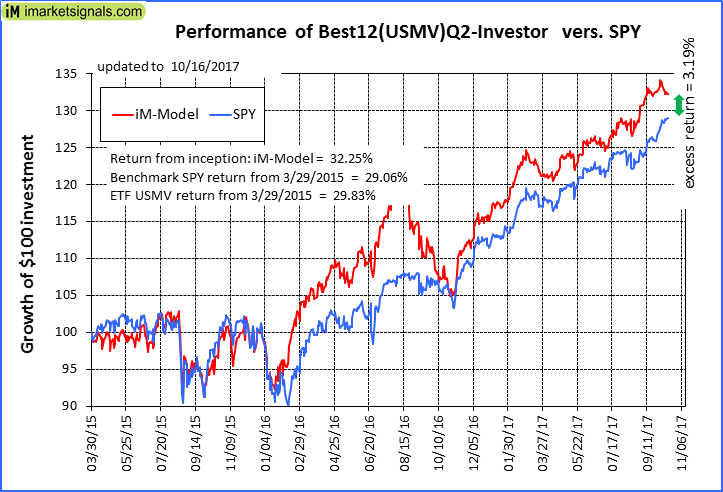 |
iM-Best12(USMV)Q2-Investor: The model’s out of sample performance YTD is 14.9%, and for the last 12 months is 23.3%. Over the same period the benchmark SPY performance was 15.8% and 22.2% respectively. Since inception, on 3/30/2015, the model gained 32.25% while the benchmark SPY gained 29.06% and the ETF USMV gained 29.83% over the same period. Over the previous week the market value of iM-Best12(USMV)Q2 gained -0.37% at a time when SPY gained 0.53%. A starting capital of $100,000 at inception on 3/30/2015 would have grown to $132,246 which includes $186 cash and excludes $723 spent on fees and slippage. |
 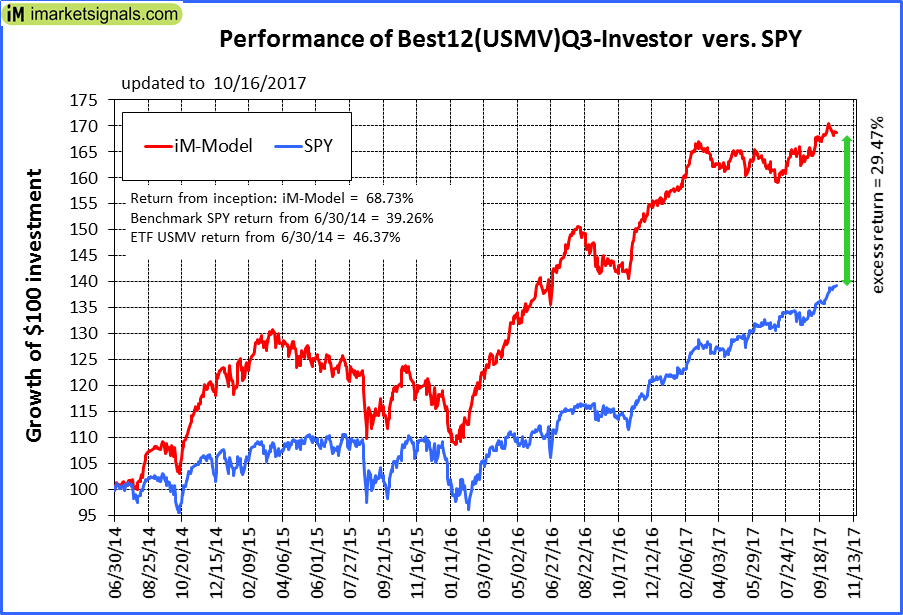 |
iM-Best12(USMV)Q3-Investor: The model’s out of sample performance YTD is 8.8%, and for the last 12 months is 18.6%. Over the same period the benchmark SPY performance was 15.8% and 22.2% respectively. Since inception, on 7/1/2014, the model gained 68.73% while the benchmark SPY gained 39.26% and the ETF USMV gained 46.37% over the same period. Over the previous week the market value of iM-Best12(USMV)Q3 gained 0.00% at a time when SPY gained 0.53%. A starting capital of $100,000 at inception on 7/1/2014 would have grown to $168,730 which includes $163 cash and excludes $1,104 spent on fees and slippage. |
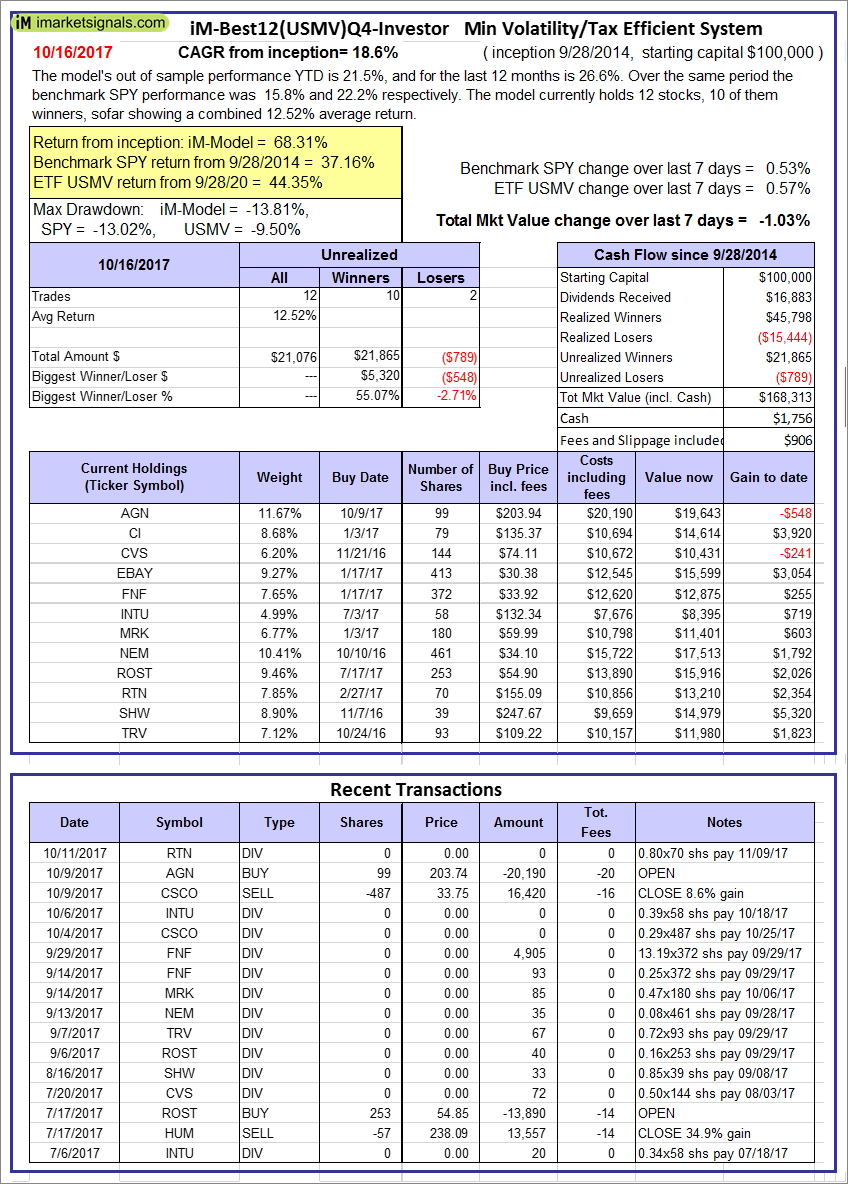 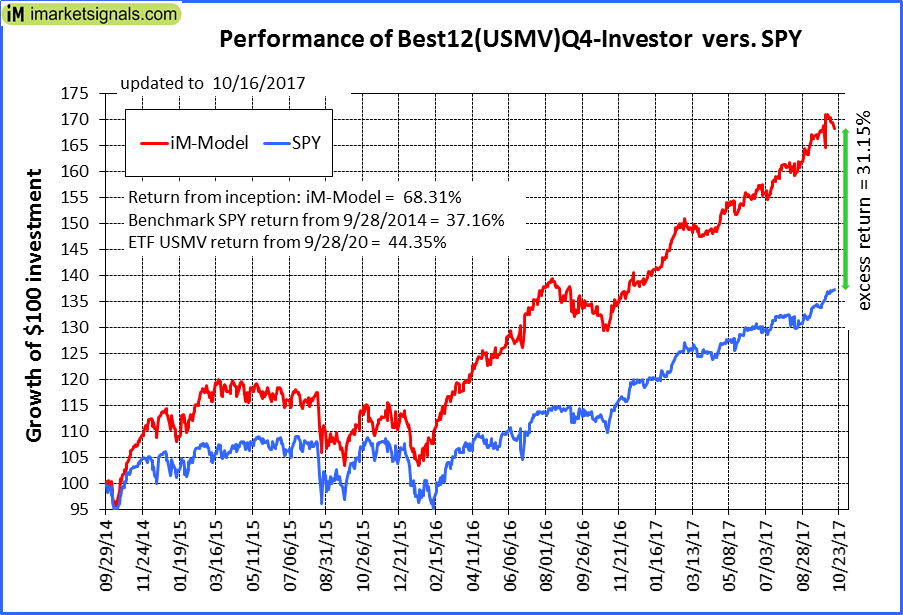 |
iM-Best12(USMV)Q4-Investor: Since inception, on 9/29/2014, the model gained 68.31% while the benchmark SPY gained 37.16% and the ETF USMV gained 44.35% over the same period. Over the previous week the market value of iM-Best12(USMV)Q4 gained -1.03% at a time when SPY gained 0.53%. A starting capital of $100,000 at inception on 9/29/2014 would have grown to $168,313 which includes $1,756 cash and excludes $906 spent on fees and slippage. |
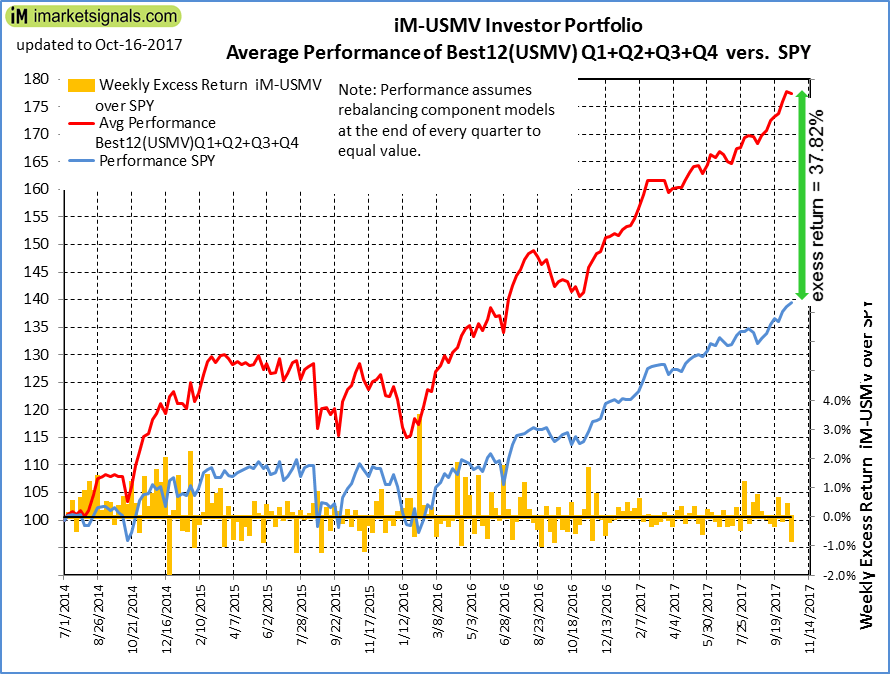 |
Average Performance of iM-Best12(USMV)Q1+Q2+Q3+Q4-Investor resulted in an excess return of 37.82% over SPY. (see iM-USMV Investor Portfolio) |
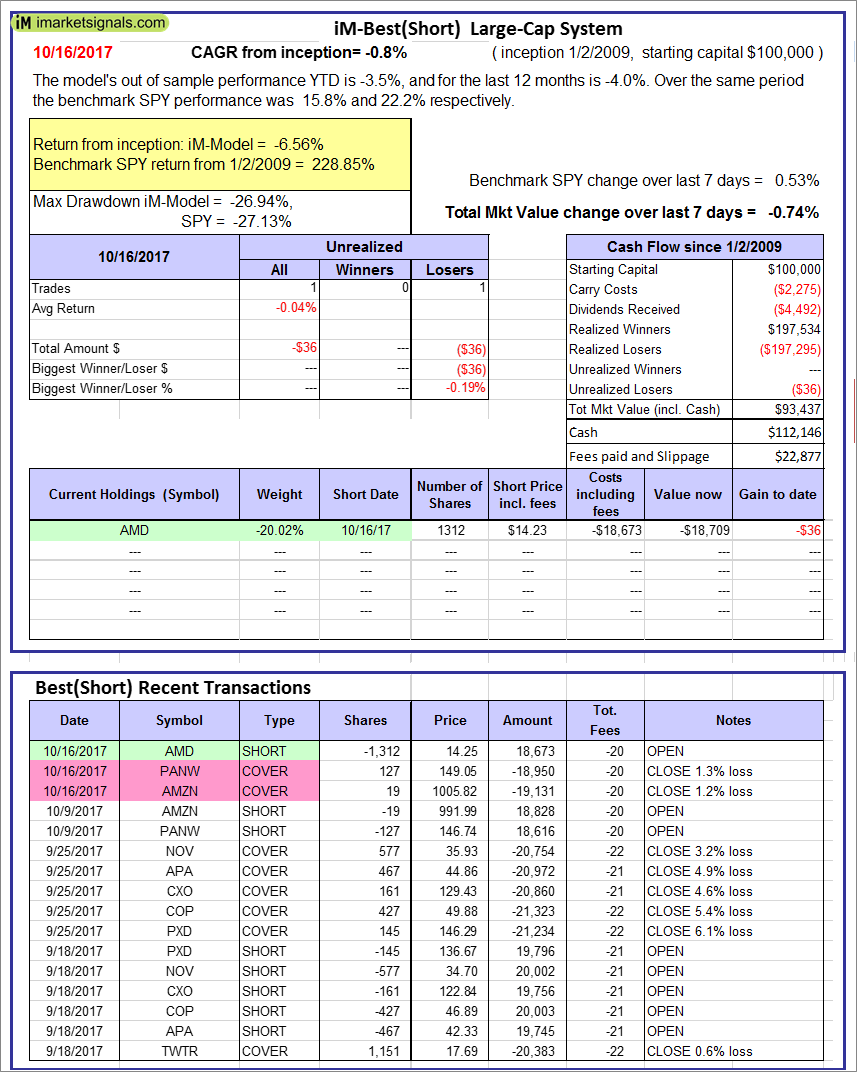 |
iM-Best(Short): The model’s out of sample performance YTD is -3.5%, and for the last 12 months is -4.0%. Over the same period the benchmark SPY performance was 15.8% and 22.2% respectively. Over the previous week the market value of iM-Best(Short) gained -0.74% at a time when SPY gained 0.53%. Over the period 1/2/2009 to 10/16/2017 the starting capital of $100,000 would have grown to $93,437 which includes $112,146 cash and excludes $22,877 spent on fees and slippage. |
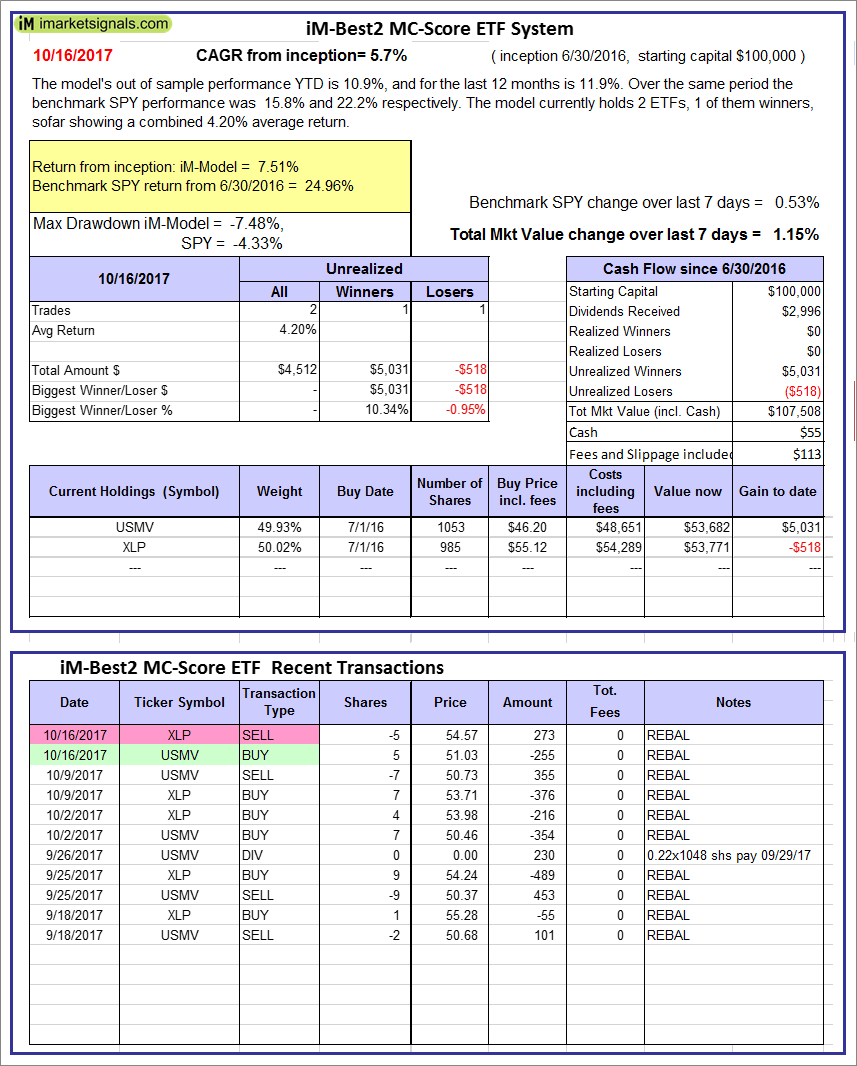 |
iM-Best2 MC-Score ETF System: The model’s out of sample performance YTD is 10.9%, and for the last 12 months is 11.9%. Over the same period the benchmark SPY performance was 15.8% and 22.2% respectively. Over the previous week the market value of the iM-Best2 MC-Score ETF System gained 1.15% at a time when SPY gained 0.53%. A starting capital of $100,000 at inception on 6/30/2016 would have grown to $107,508 which includes $55 cash and excludes $113 spent on fees and slippage. |
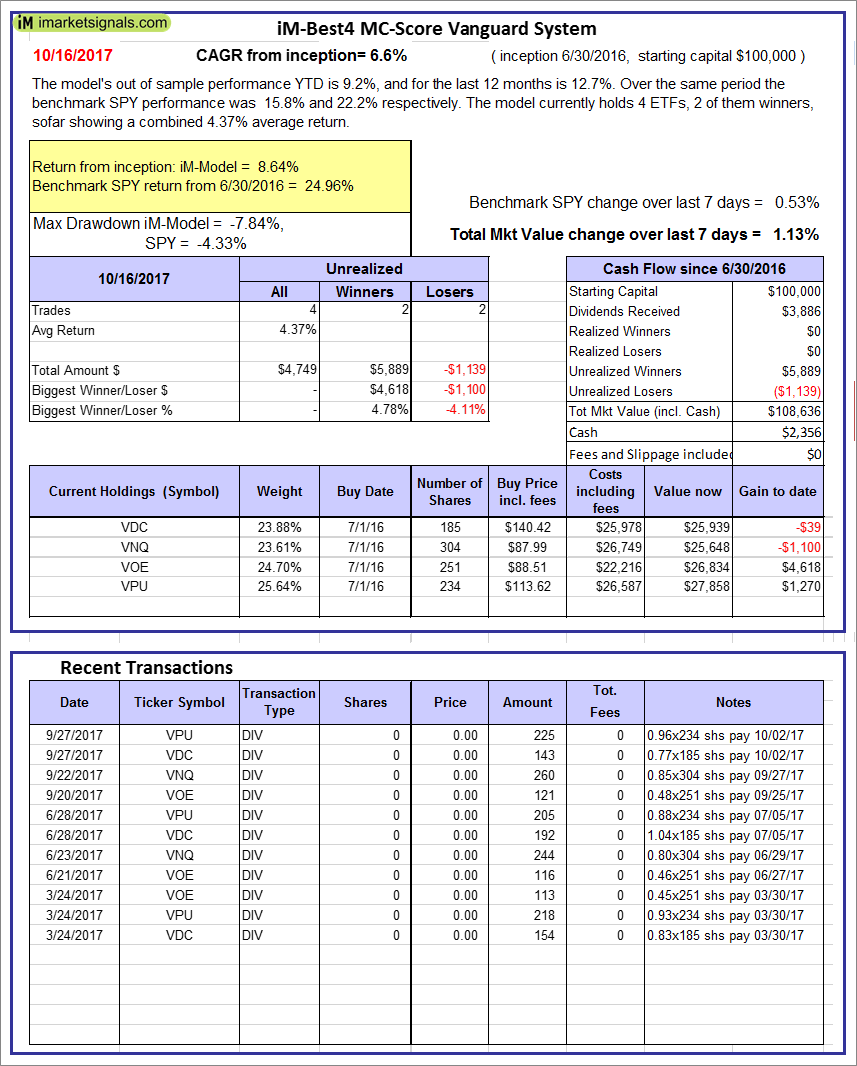 |
iM-Best4 MC-Score Vanguard System: The model’s out of sample performance YTD is 9.2%, and for the last 12 months is 12.7%. Over the same period the benchmark SPY performance was 15.8% and 22.2% respectively. Over the previous week the market value of the iM-Best4 MC-Score Vanguard System gained 1.13% at a time when SPY gained 0.53%. A starting capital of $100,000 at inception on 6/30/2016 would have grown to $108,636 which includes $2,356 cash and excludes $00 spent on fees and slippage. |
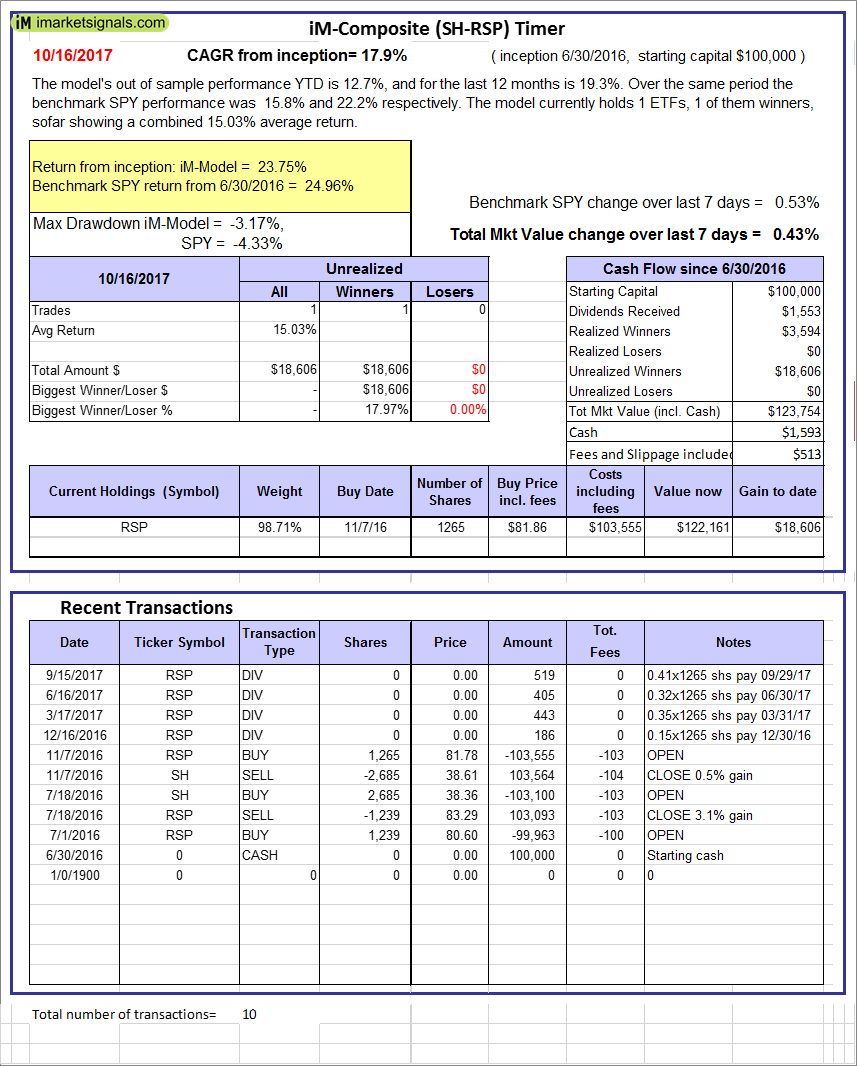 |
iM-Composite (SH-RSP) Timer: The model’s out of sample performance YTD is 12.7%, and for the last 12 months is 19.3%. Over the same period the benchmark SPY performance was 15.8% and 22.2% respectively. Over the previous week the market value of the iM-Composite (SH-RSP) Timer gained 0.43% at a time when SPY gained 0.53%. A starting capital of $100,000 at inception on 6/30/2016 would have grown to $123,754 which includes $1,593 cash and excludes $513 spent on fees and slippage. |
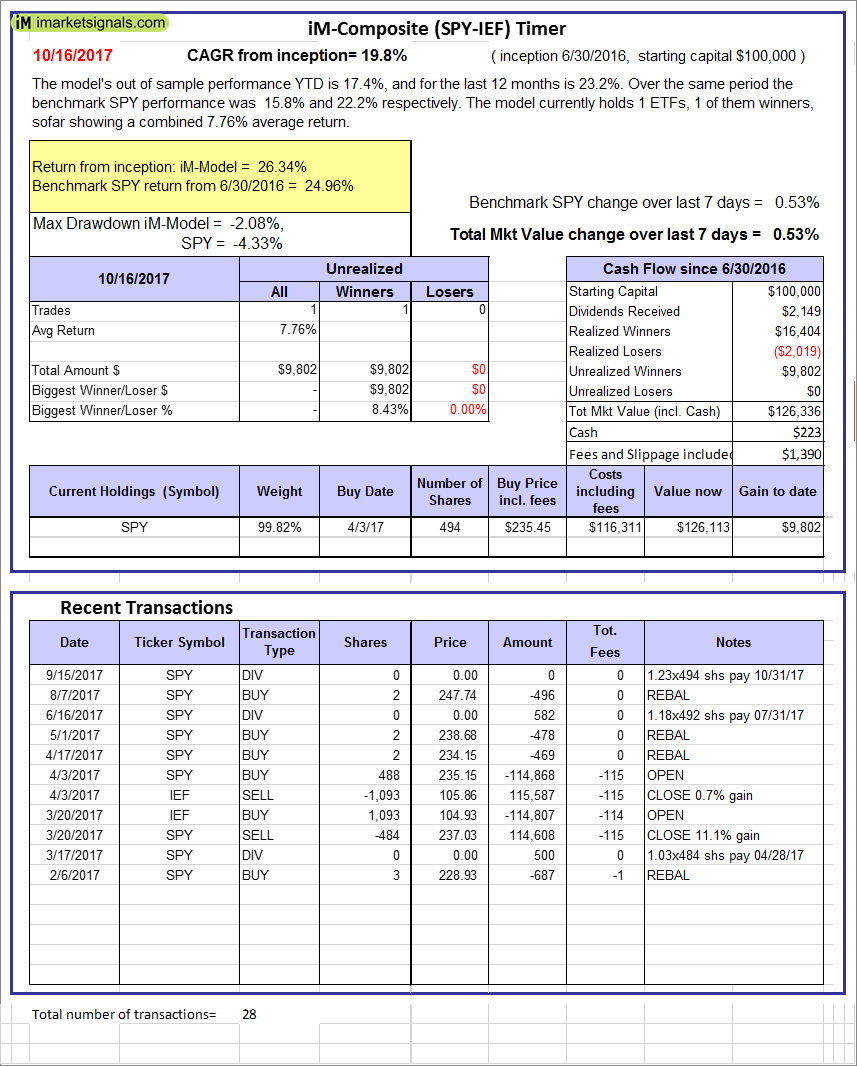 |
iM-Composite (SPY-IEF) Timer: The model’s out of sample performance YTD is 17.4%, and for the last 12 months is 23.2%. Over the same period the benchmark SPY performance was 15.8% and 22.2% respectively. Over the previous week the market value of the iM-Composite (SPY-IEF) Timer gained 0.53% at a time when SPY gained 0.53%. A starting capital of $100,000 at inception on 6/30/2016 would have grown to $126,336 which includes $223 cash and excludes $1,390 spent on fees and slippage. |
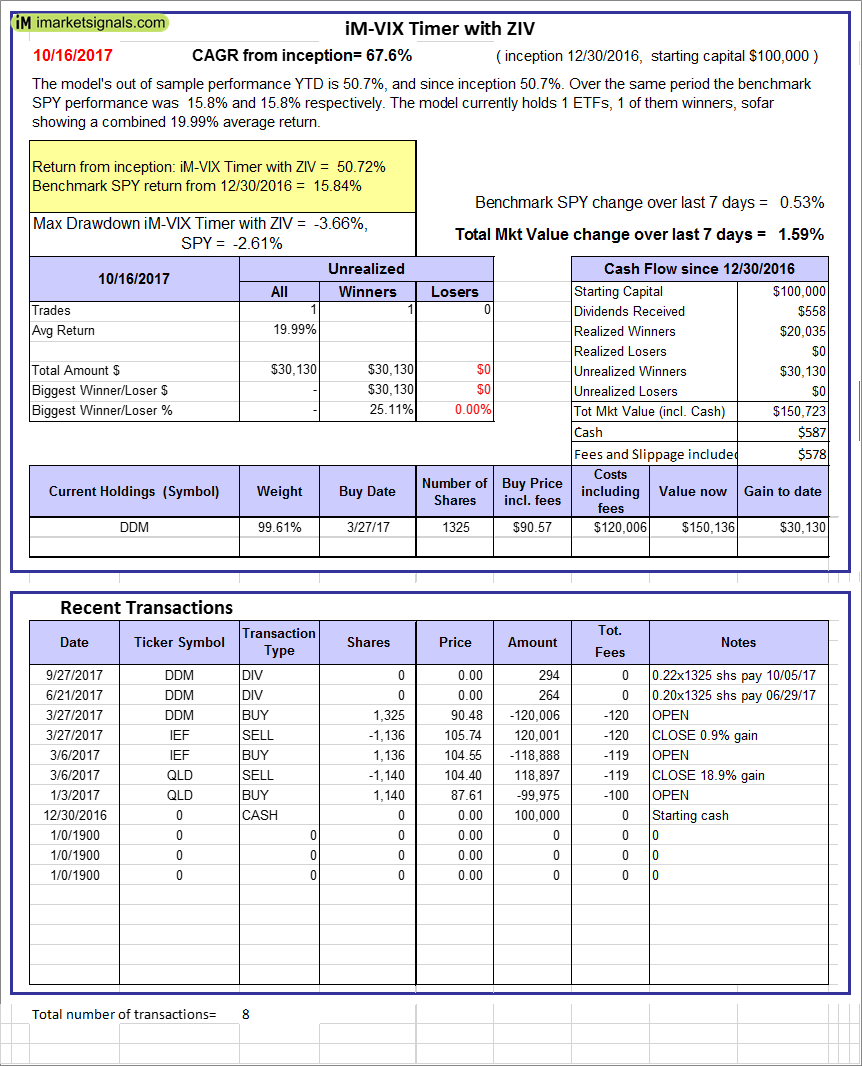 |
iM-VIX Timer with ZIV: The model’s out of sample performance YTD is 50.7%, and since inception 50.7%. Over the same period the benchmark SPY performance was 15.8% and 15.8% respectively. Over the previous week the market value of the iM-VIX Timer with ZIV gained 1.59% at a time when SPY gained 0.53%. A starting capital of $100,000 at inception on 6/30/2016 would have grown to $150,723 which includes $587 cash and excludes $578 spent on fees and slippage. |
 |
iM-Composite(Gold-Stocks-Bond) Timer: The model’s out of sample performance YTD is 23.3%, and for the last 12 months is 29.5%. Over the same period the benchmark SPY performance was 15.8% and 22.2% respectively. Over the previous week the market value of the iM-Composite(Gold-Stocks-Bond) Timer gained 0.77% at a time when SPY gained 0.53%. A starting capital of $100,000 at inception on 6/30/2016 would have grown to $128,052 which includes $53 cash and excludes $1,955 spent on fees and slippage. |
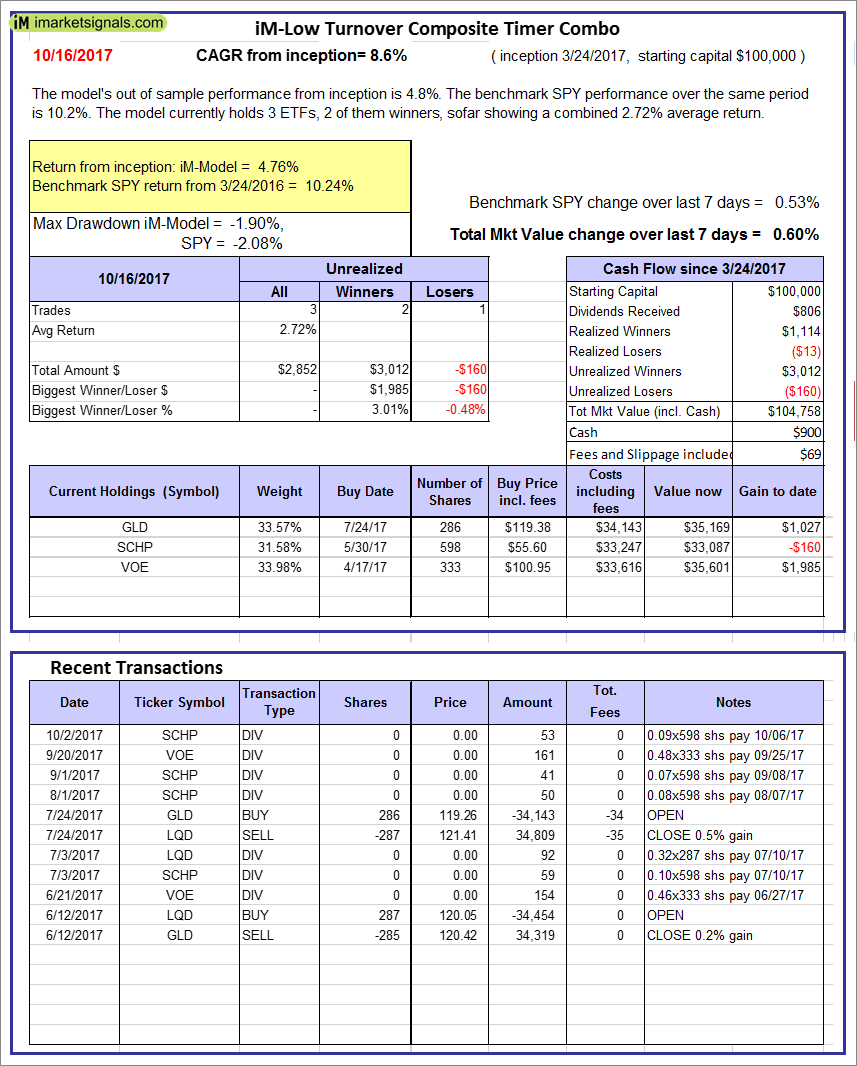 |
iM-Low Turnover Composite Timer Combo: The model’s out of sample performance from inception is 4.8%. The benchmark SPY performance over the same period is 10.2%. Over the previous week the market value of the iM-Low Turnover Composite Timer Combo gained 0.60% at a time when SPY gained 0.53%. A starting capital of $100,000 at inception on 3/24/27 would have grown to $104,758 which includes $900 cash and excludes $69 spent on fees and slippage. |
 |
iM-Min Drawdown Combo: The model’s out of sample performance from inception is 4.3%. The benchmark SPY performance over the same period is 9.8%. Over the previous week the market value of the iM-Min Drawdown Combo gained 0.60% at a time when SPY gained 0.53%. A starting capital of $100,000 at inception on 4/5/2017 would have grown to $104,275 which includes $1,211 cash and excludes $103 spent on fees and slippage. |
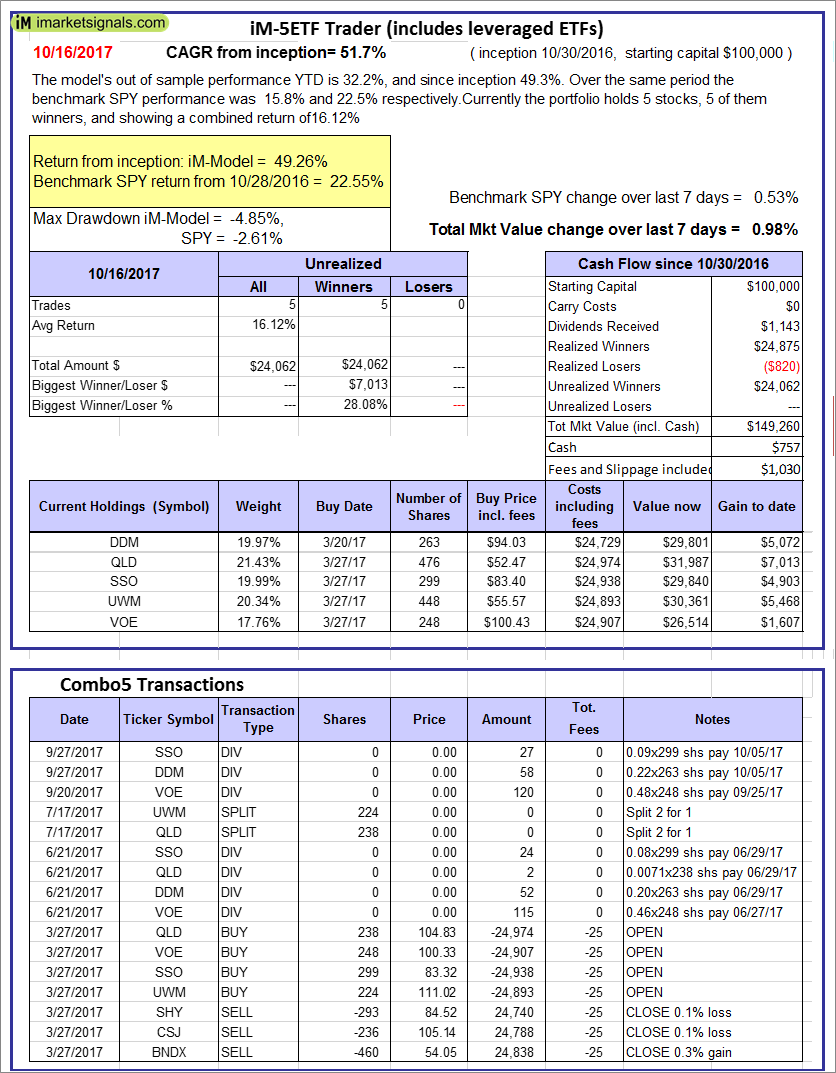 |
iM-5ETF Trader (includes leveraged ETFs): The model’s out of sample performance YTD is 32.2%, and since inception 49.3%. Over the same period the benchmark SPY performance was 15.8% and 22.5% respectively. Over the previous week the market value of the iM-5ETF Trader (includes leveraged ETFs) gained 0.98% at a time when SPY gained 0.53%. A starting capital of $100,000 at inception on 10/30/2016 would have grown to $149,260 which includes $757 cash and excludes $1,030 spent on fees and slippage. |
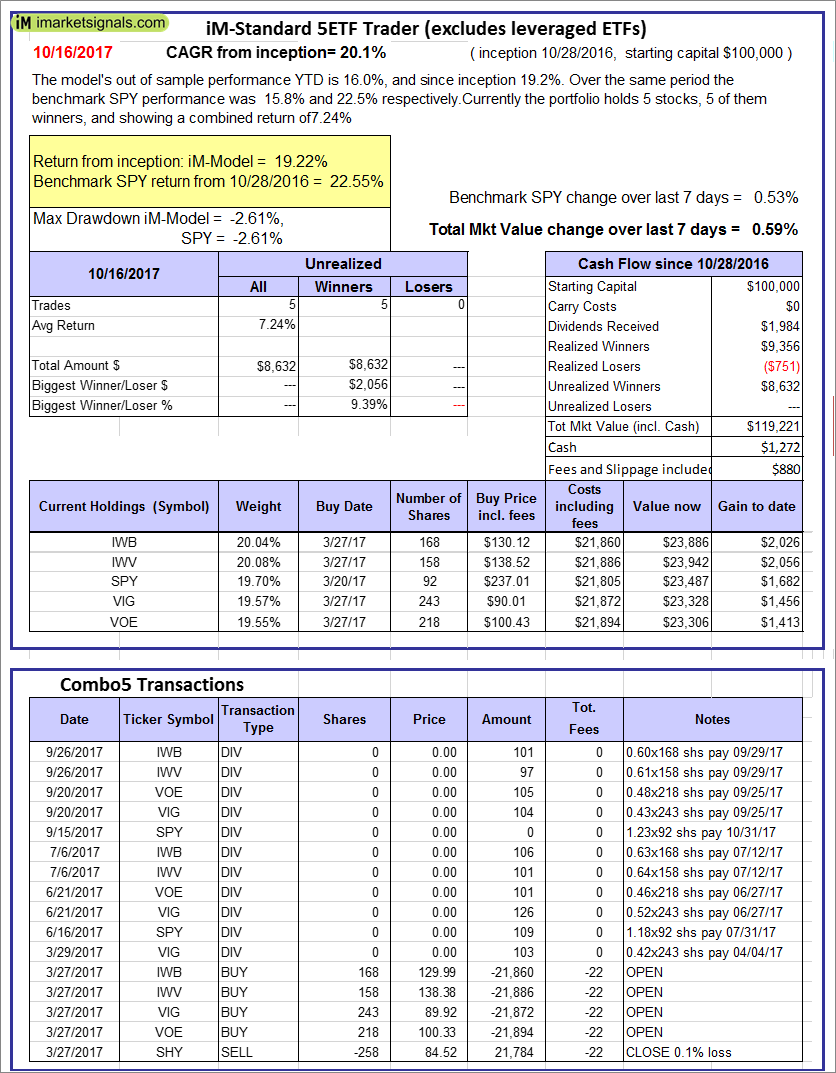 |
iM-Standard 5ETF Trader (excludes leveraged ETFs): The model’s out of sample performance YTD is 16.0%, and since inception 19.2%. Over the same period the benchmark SPY performance was 15.8% and 22.5% respectively. Over the previous week the market value of the iM-Standard 5ETF Trader (excludes leveraged ETFs) gained 0.59% at a time when SPY gained 0.53%. A starting capital of $100,000 at inception on 10/30/2016 would have grown to $119,221 which includes $1,272 cash and excludes $880 spent on fees and slippage. |
iM-Best Reports – 10/17/2017
Posted in pmp SPY-SH
Leave a Reply
You must be logged in to post a comment.