
  |
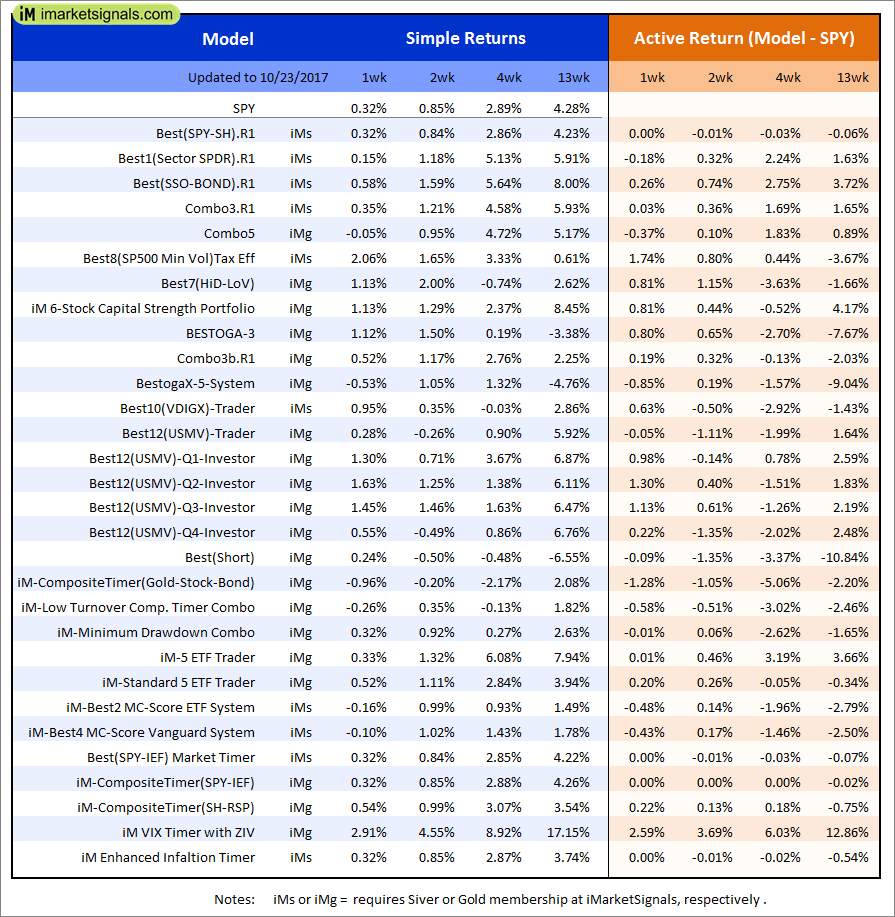
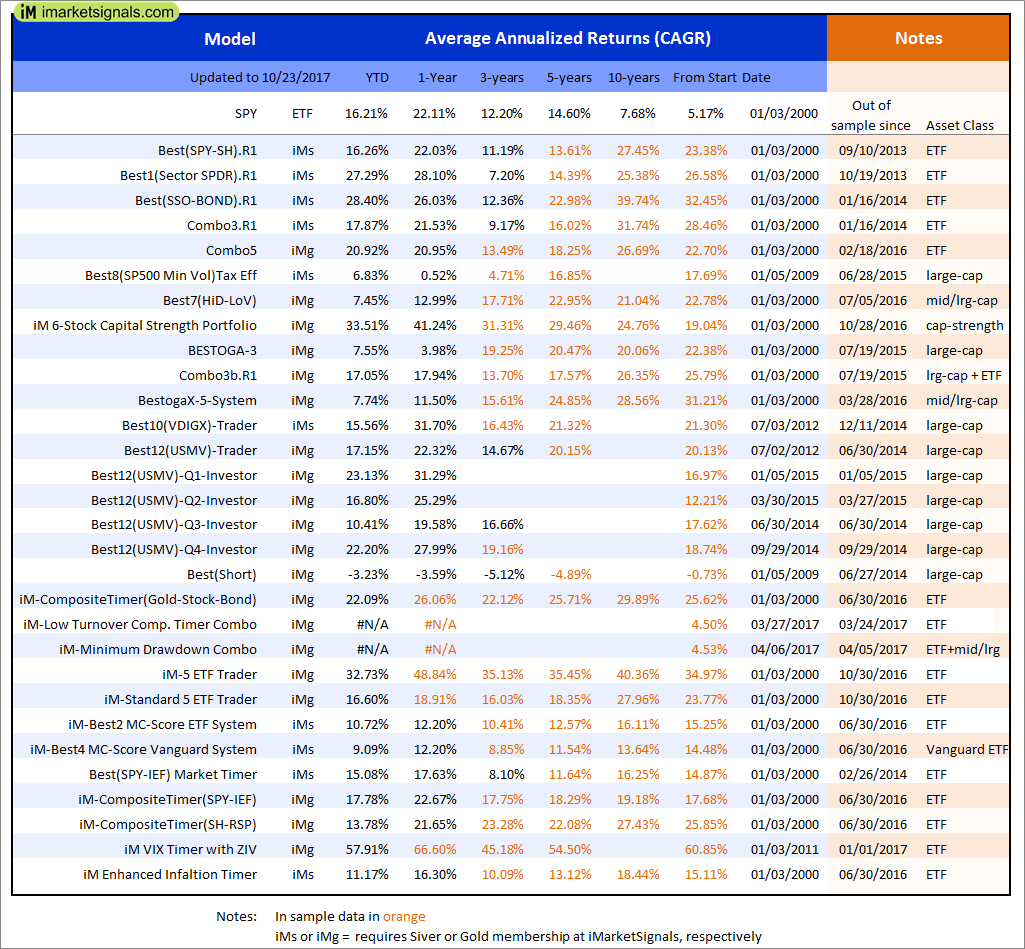
Out of sample performance summary of our models for the past 1, 2, 4 and 13 week periods. The active active return indicates how the models over- or underperformed the benchmark ETF SPY. Also the YTD, and the 1-, 3-, 5- and 10-year annualized returns are shown in the second table |
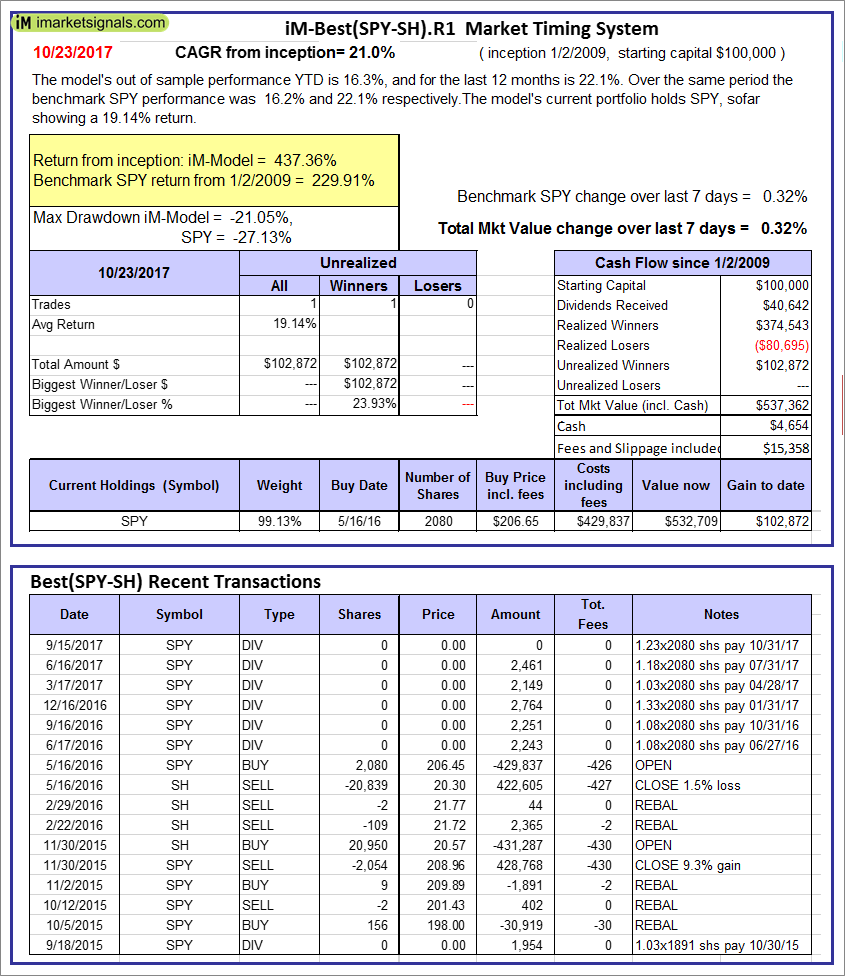 |
iM-Best(SPY-SH).R1: The model’s out of sample performance YTD is 16.3%, and for the last 12 months is 22.1%. Over the same period the benchmark SPY performance was 16.2% and 22.1% respectively. Over the previous week the market value of Best(SPY-SH) gained 0.32% at a time when SPY gained 0.32%. A starting capital of $100,000 at inception on 1/2/2009 would have grown to $537,362 which includes $4,654 cash and excludes $15,358 spent on fees and slippage. |
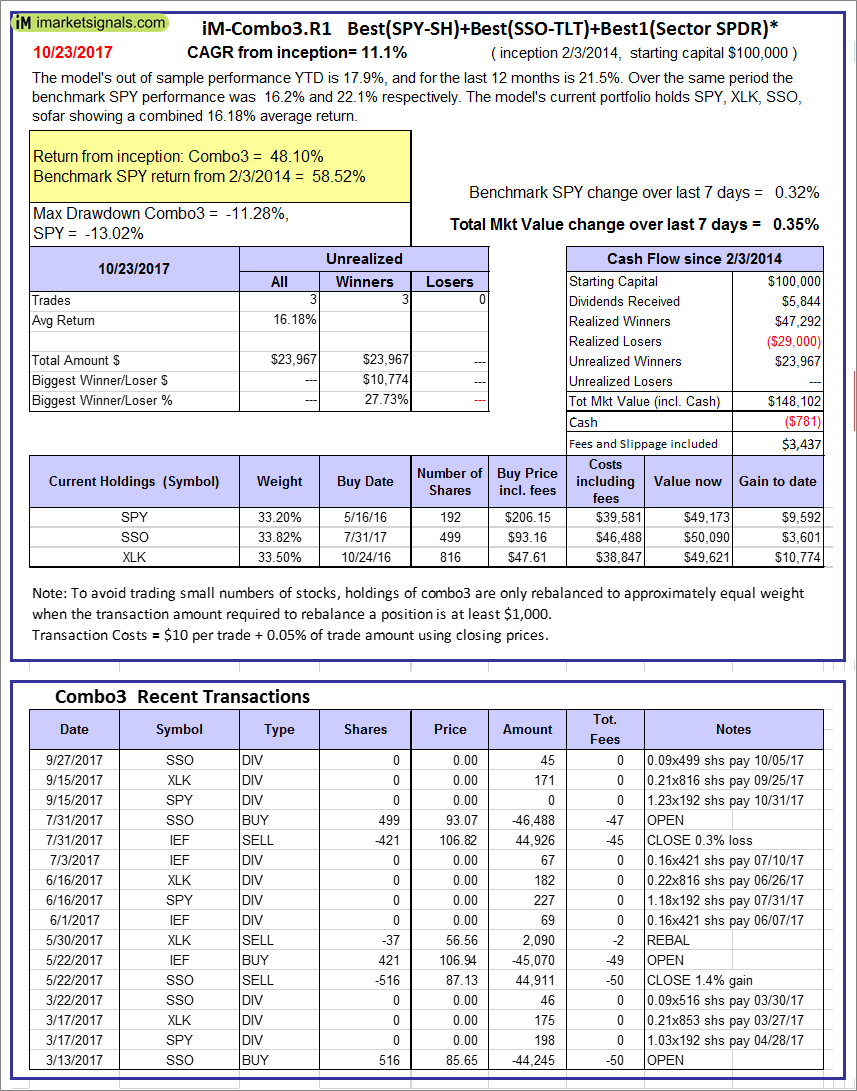 |
iM-Combo3.R1: The model’s out of sample performance YTD is 17.9%, and for the last 12 months is 21.5%. Over the same period the benchmark SPY performance was 16.2% and 22.1% respectively. Over the previous week the market value of iM-Combo3.R1 gained 0.35% at a time when SPY gained 0.32%. A starting capital of $100,000 at inception on 2/3/2014 would have grown to $148,102 which includes -$781 cash and excludes $3,437 spent on fees and slippage. |
 |
iM-Combo5: The model’s out of sample performance YTD is 20.9%, and for the last 12 months is 21.0%. Over the same period the benchmark SPY performance was 16.2% and 22.1% respectively. Over the previous week the market value of iM-Combo5 gained -0.05% at a time when SPY gained 0.32%. A starting capital of $100,000 at inception on 2/22/2016 would have grown to $119,268 which includes -$1,947 cash and excludes $601 spent on fees and slippage. |
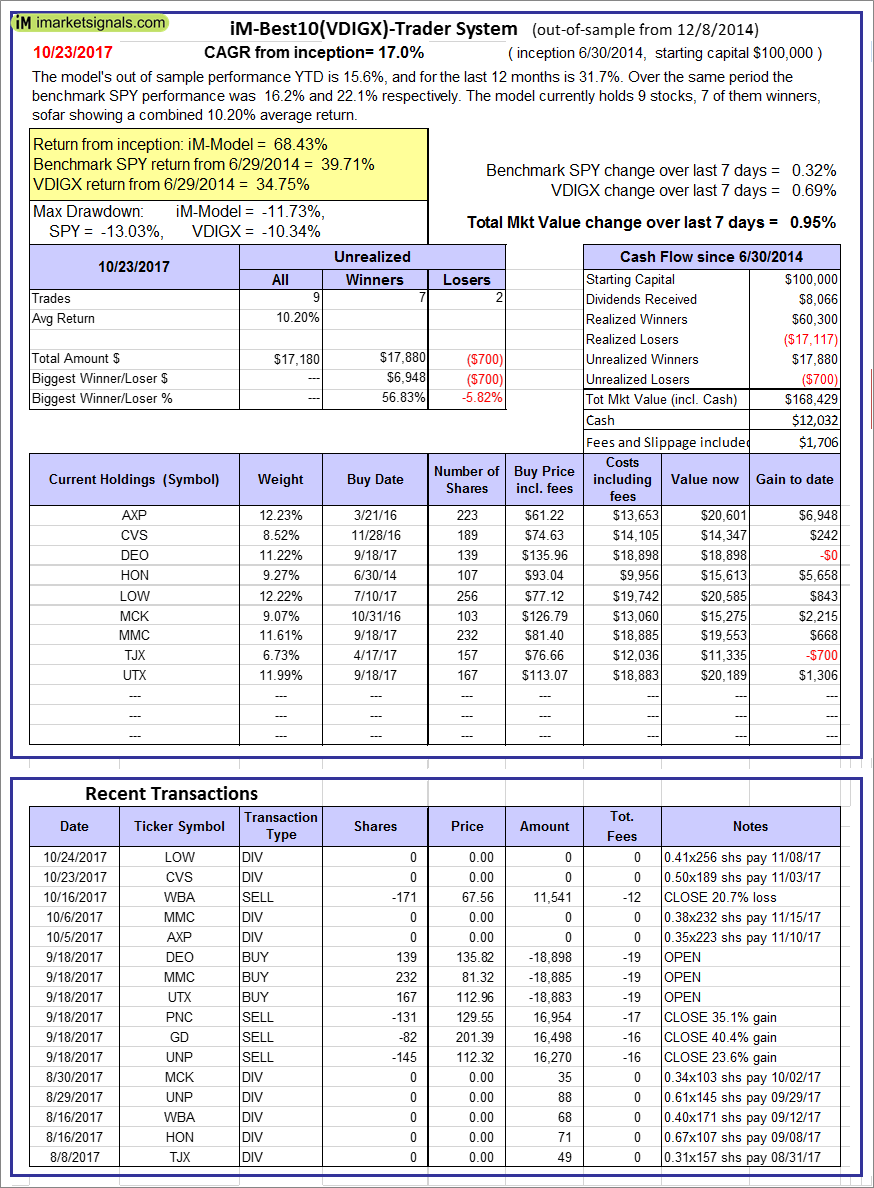 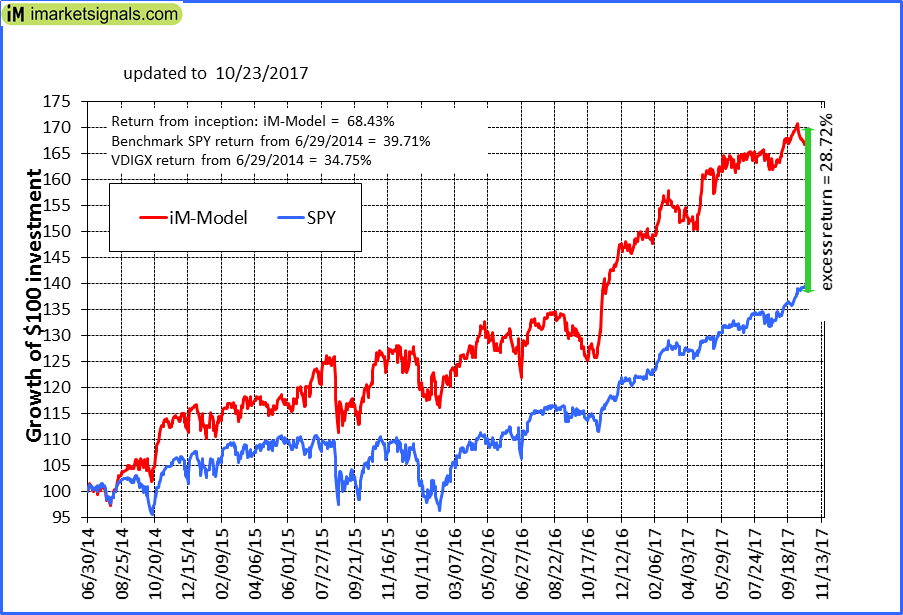 |
iM-Best10(VDIGX)-Trader: The model’s out of sample performance YTD is 15.6%, and for the last 12 months is 31.7%. Over the same period the benchmark SPY performance was 16.2% and 22.1% respectively. Since inception, on 7/1/2014, the model gained 68.43% while the benchmark SPY gained 39.71% and VDIGX gained 34.75% over the same period. Over the previous week the market value of iM-Best10(VDIGX) gained 0.95% at a time when SPY gained 0.32%. A starting capital of $100,000 at inception on 7/1/2014 would have grown to $168,429 which includes $12,032 cash and excludes $1,706 spent on fees and slippage. |
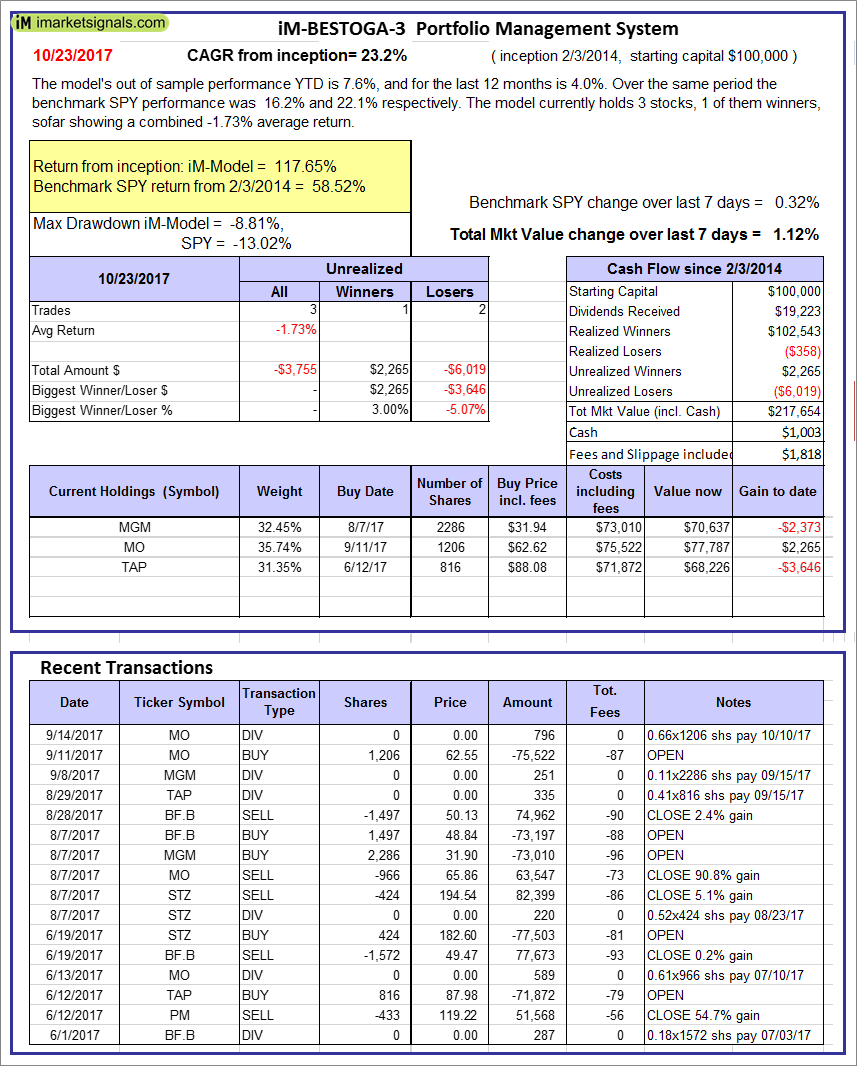 |
iM-BESTOGA-3: The model’s out of sample performance YTD is 7.6%, and for the last 12 months is 4.0%. Over the same period the benchmark SPY performance was 16.2% and 22.1% respectively. Over the previous week the market value of iM-BESTOGA-3 gained 1.12% at a time when SPY gained 0.32%. A starting capital of $100,000 at inception on 2/3/2014 would have grown to $217,654 which includes $1,003 cash and excludes $1,818 spent on fees and slippage. |
 |
iM-Best7(HiD-LoV): The model’s out of sample performance YTD is 7.4%, and for the last 12 months is 13.0%. Over the same period the benchmark SPY performance was 16.2% and 22.1% respectively. Over the previous week the market value of iM-BESTOGA-3 gained 1.13% at a time when SPY gained 0.32%. A starting capital of $100,000 at inception on 6/30/2016 would have grown to $110,405 which includes $662 cash and excludes $1,211 spent on fees and slippage. |
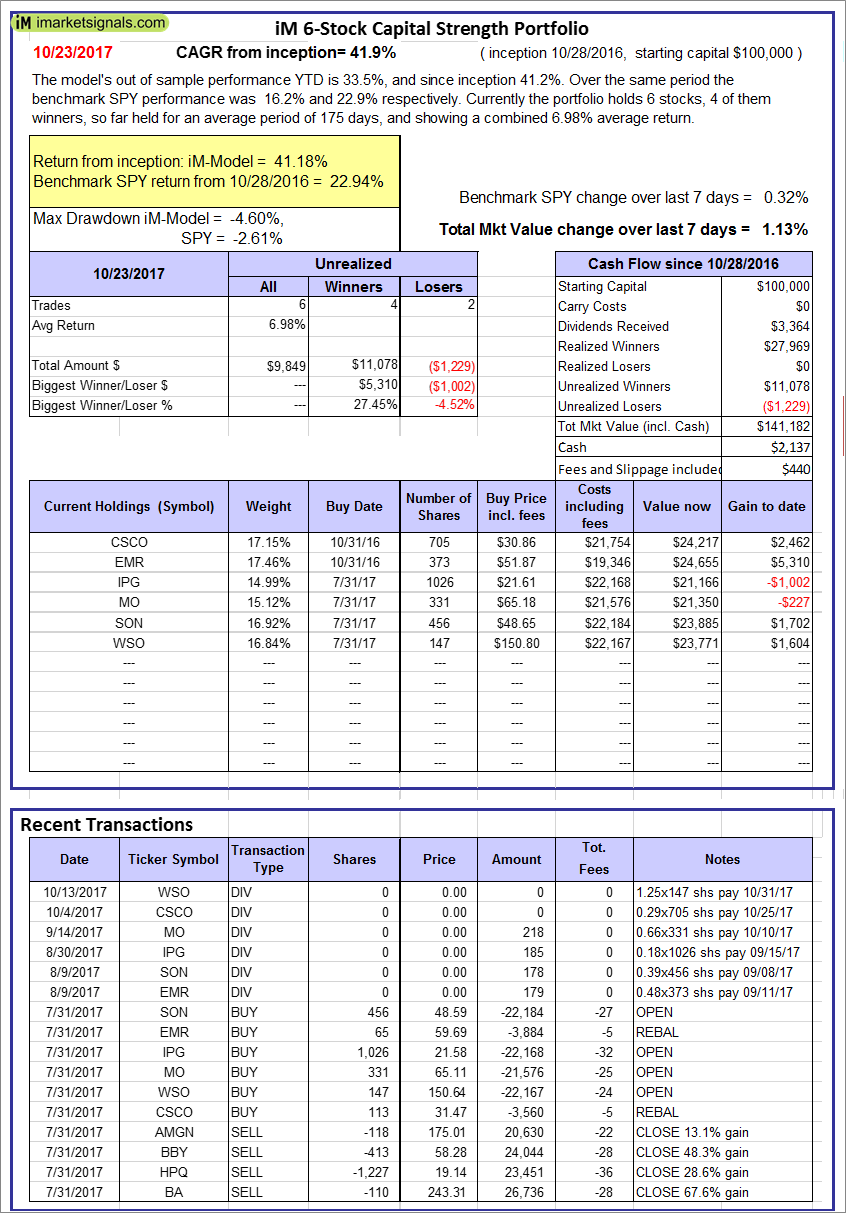 |
iM 6-Stock Capital Strength Portfolio: The model’s out of sample performance YTD is 33.5%, and since inception 41.2%. Over the same period the benchmark SPY performance was 16.2% and 22.9% respectively. Over the previous week the market value of the iM 6-Stock Capital Strength Portfolio gained 1.13% at a time when SPY gained 0.32%. A starting capital of $100,000 at inception on 10/28/2016 would have grown to $141,182 which includes $2,137 cash and excludes $440 spent on fees and slippage. |
 |
iM-BestogaX5-System: The model’s out of sample performance YTD is 7.7%, and for the last 12 months is 11.5%. Over the same period the benchmark SPY performance was 16.2% and 22.1% respectively. Over the previous week the market value of iM-Best8(S&P 500)Tax-Eff. gained -0.53% at a time when SPY gained 0.32%. A starting capital of $100,000 at inception on 3/28/2016 would have grown to $106,187 which includes $684 cash and excludes $881 spent on fees and slippage. |
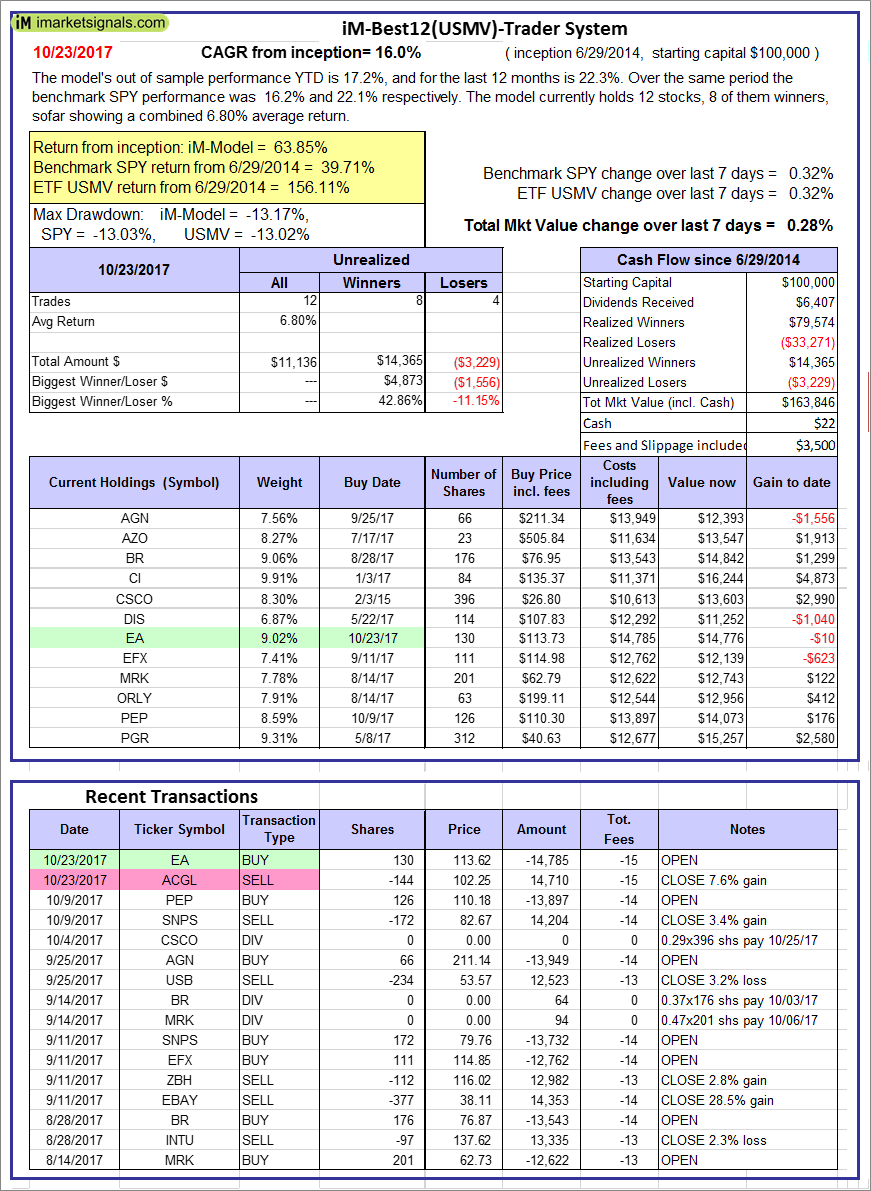 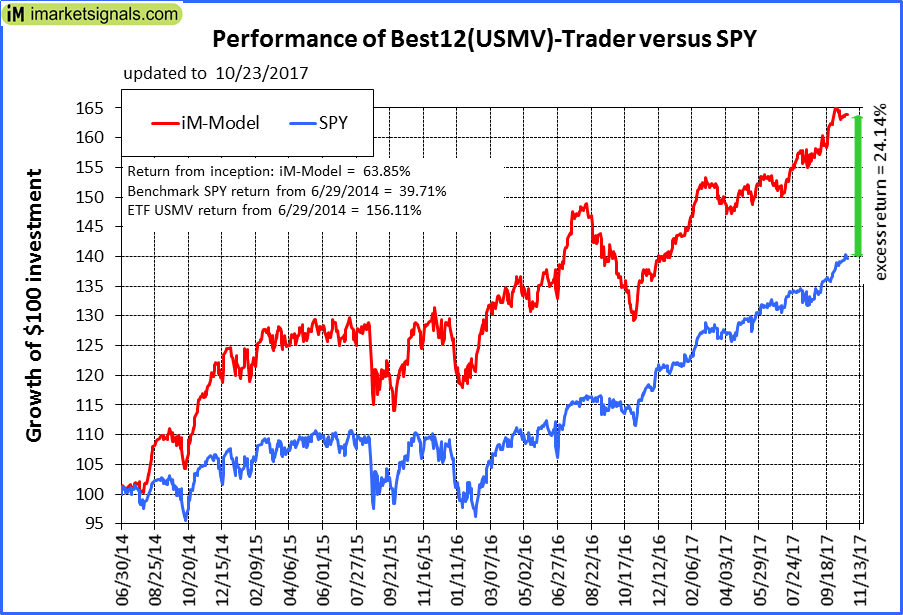 |
iM-Best12(USMV)-Trader: The model’s out of sample performance YTD is 17.2%, and for the last 12 months is 22.3%. Over the same period the benchmark SPY performance was 16.2% and 22.1% respectively. Since inception, on 6/30/2014, the model gained 63.85% while the benchmark SPY gained 39.71% and the ETF USMV gained 156.11% over the same period. Over the previous week the market value of iM-Best12(USMV)-Trader gained 0.28% at a time when SPY gained 0.32%. A starting capital of $100,000 at inception on 6/30/2014 would have grown to $163,846 which includes $22 cash and excludes $3,500 spent on fees and slippage. |
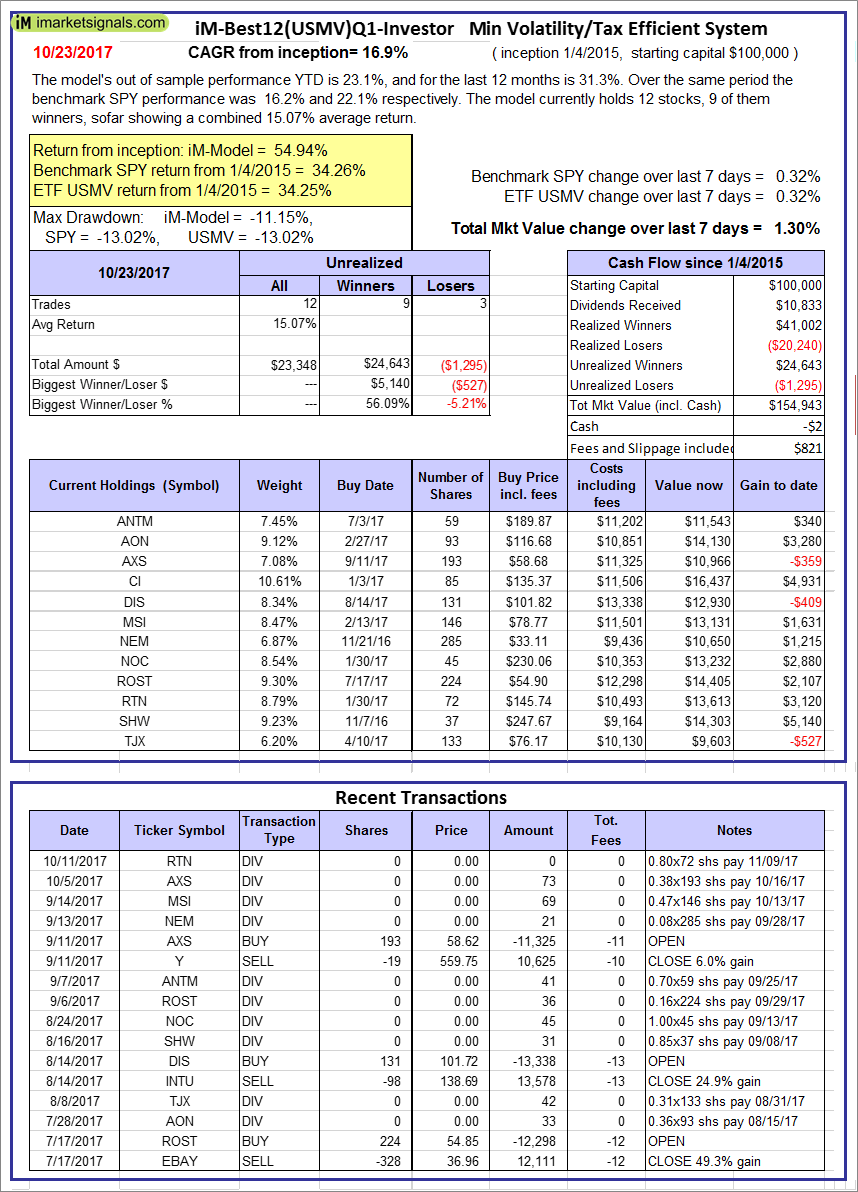 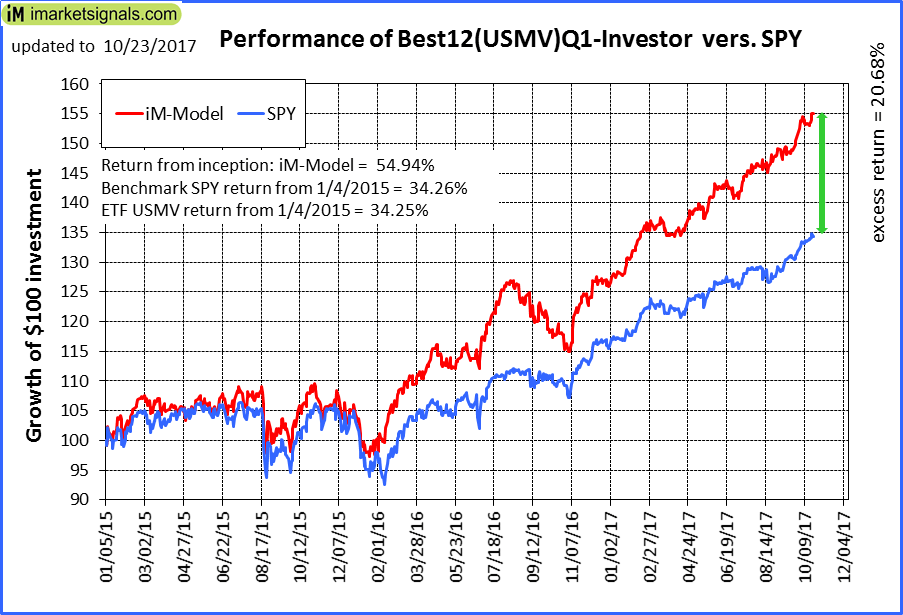 |
iM-Best12(USMV)Q1-Investor: The model’s out of sample performance YTD is 23.1%, and for the last 12 months is 31.3%. Over the same period the benchmark SPY performance was 16.2% and 22.1% respectively. Since inception, on 1/5/2015, the model gained 54.94% while the benchmark SPY gained 34.26% and the ETF USMV gained 34.25% over the same period. Over the previous week the market value of iM-Best12(USMV)Q1 gained 1.30% at a time when SPY gained 0.32%. A starting capital of $100,000 at inception on 1/5/2015 would have grown to $154,943 which includes -$2 cash and excludes $821 spent on fees and slippage. |
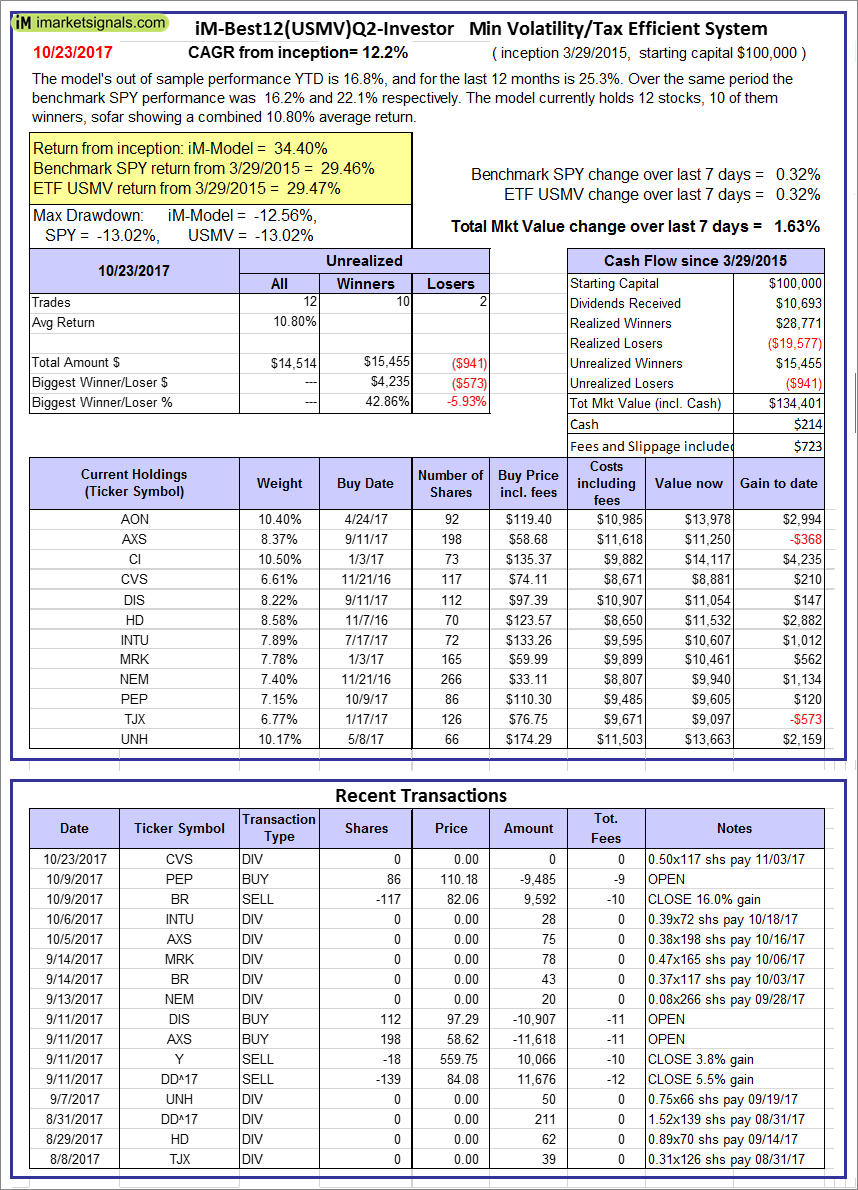 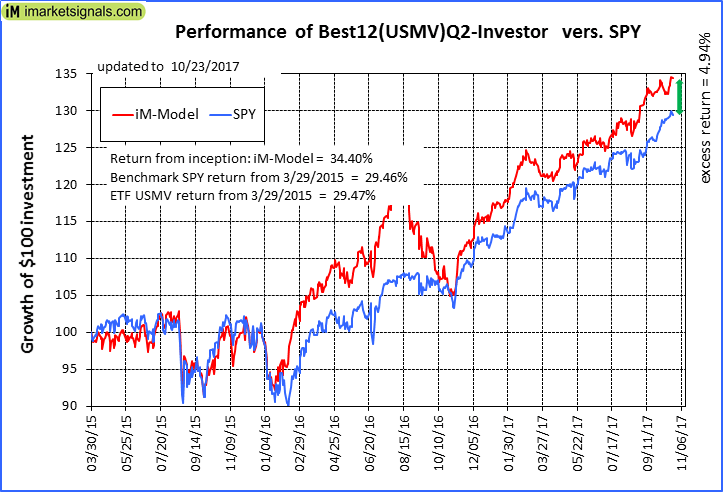 |
iM-Best12(USMV)Q2-Investor: The model’s out of sample performance YTD is 16.8%, and for the last 12 months is 25.3%. Over the same period the benchmark SPY performance was 16.2% and 22.1% respectively. Since inception, on 3/30/2015, the model gained 34.40% while the benchmark SPY gained 29.46% and the ETF USMV gained 29.47% over the same period. Over the previous week the market value of iM-Best12(USMV)Q2 gained 1.63% at a time when SPY gained 0.32%. A starting capital of $100,000 at inception on 3/30/2015 would have grown to $134,401 which includes $214 cash and excludes $723 spent on fees and slippage. |
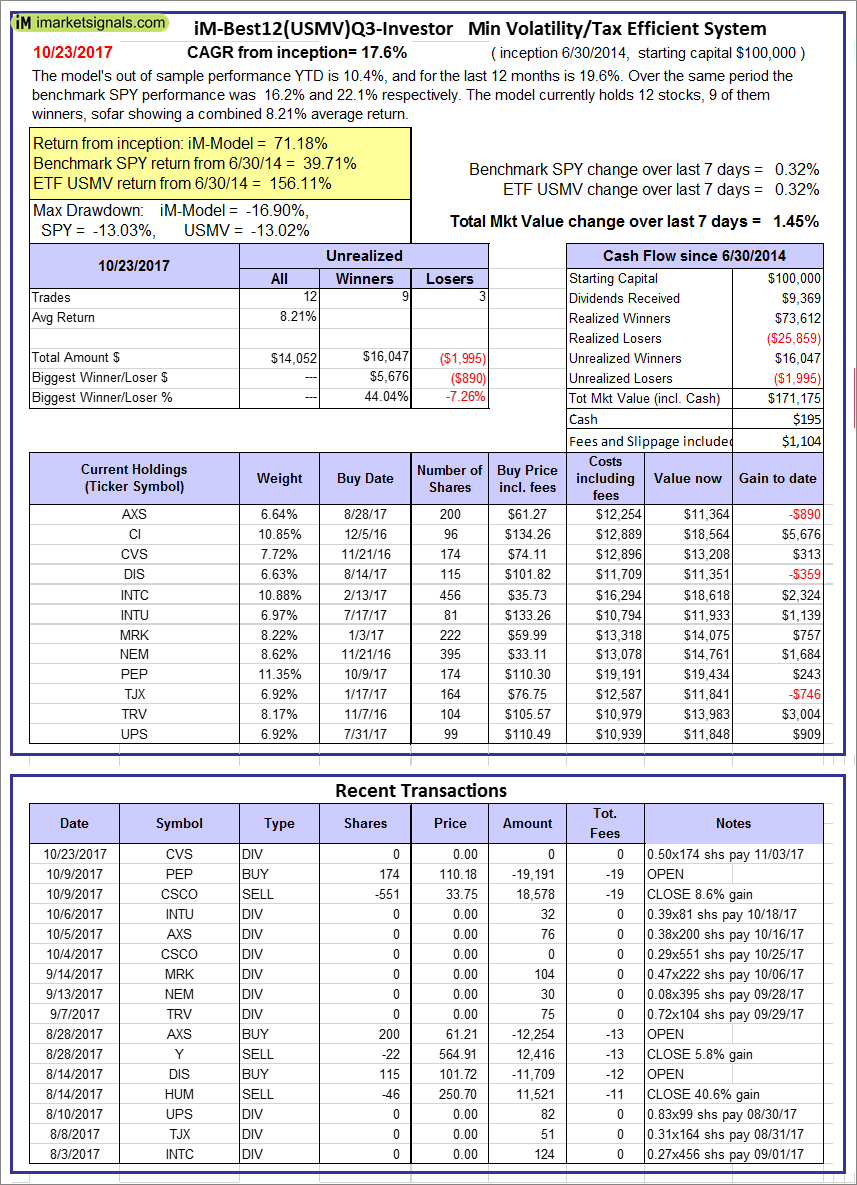 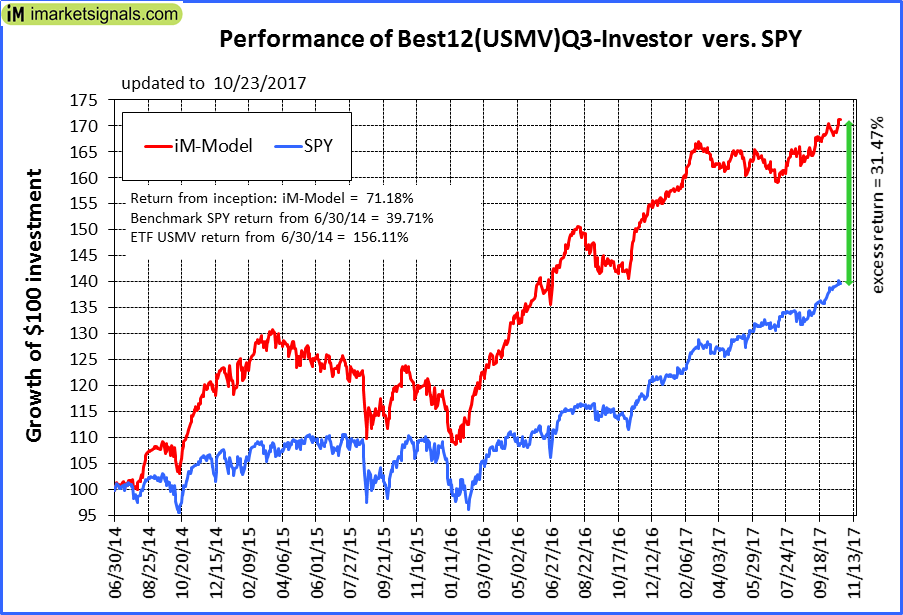 |
iM-Best12(USMV)Q3-Investor: The model’s out of sample performance YTD is 10.4%, and for the last 12 months is 19.6%. Over the same period the benchmark SPY performance was 16.2% and 22.1% respectively. Since inception, on 7/1/2014, the model gained 71.18% while the benchmark SPY gained 39.71% and the ETF USMV gained 156.11% over the same period. Over the previous week the market value of iM-Best12(USMV)Q3 gained 1.45% at a time when SPY gained 0.32%. A starting capital of $100,000 at inception on 7/1/2014 would have grown to $171,175 which includes $195 cash and excludes $1,104 spent on fees and slippage. |
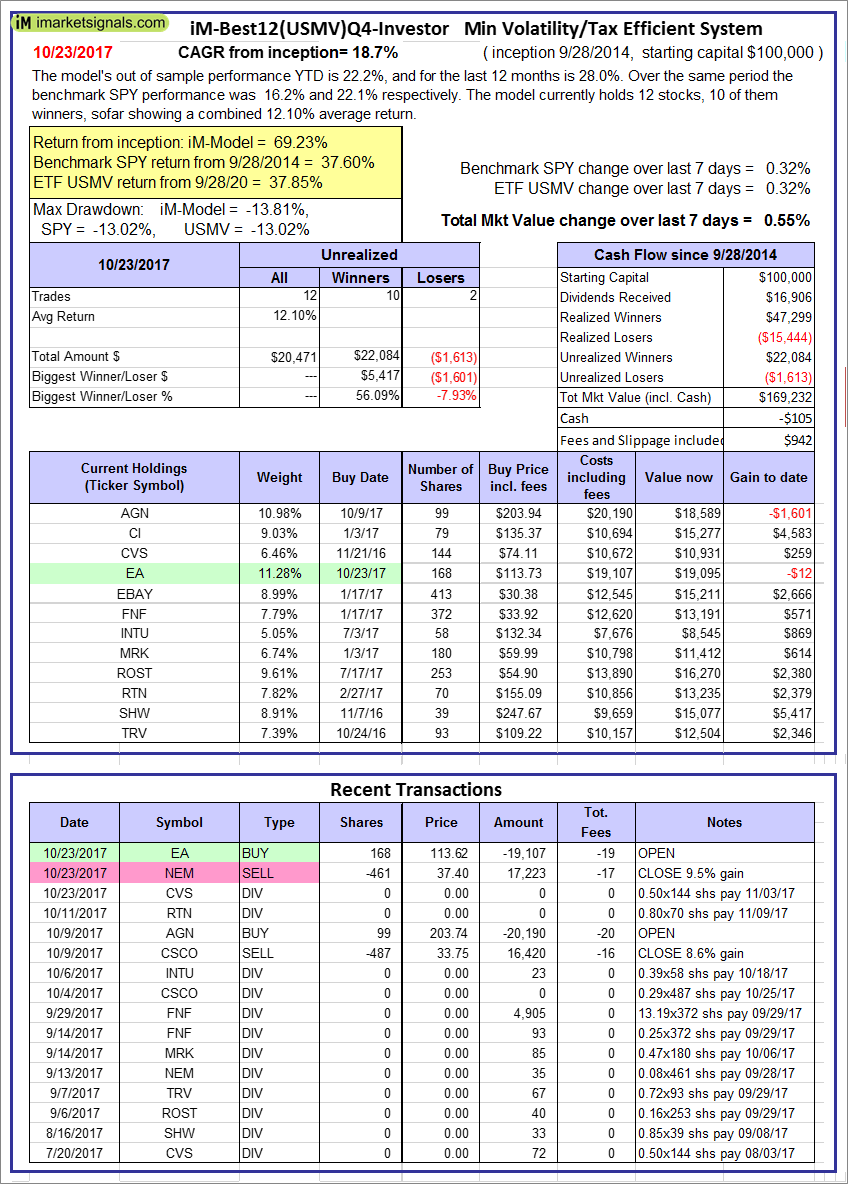 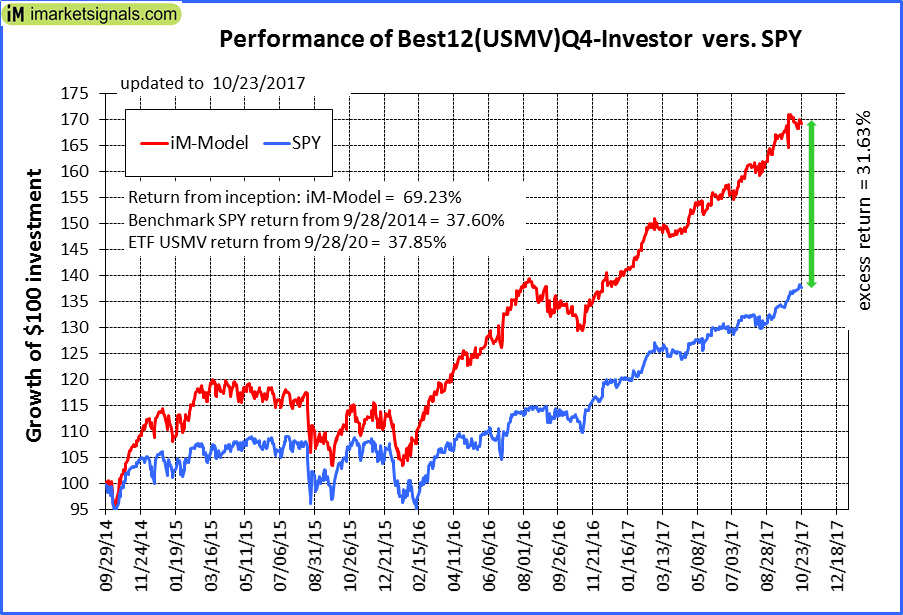 |
iM-Best12(USMV)Q4-Investor: Since inception, on 9/29/2014, the model gained 69.23% while the benchmark SPY gained 37.60% and the ETF USMV gained 37.85% over the same period. Over the previous week the market value of iM-Best12(USMV)Q4 gained 0.55% at a time when SPY gained 0.32%. A starting capital of $100,000 at inception on 9/29/2014 would have grown to $169,232 which includes -$105 cash and excludes $942 spent on fees and slippage. |
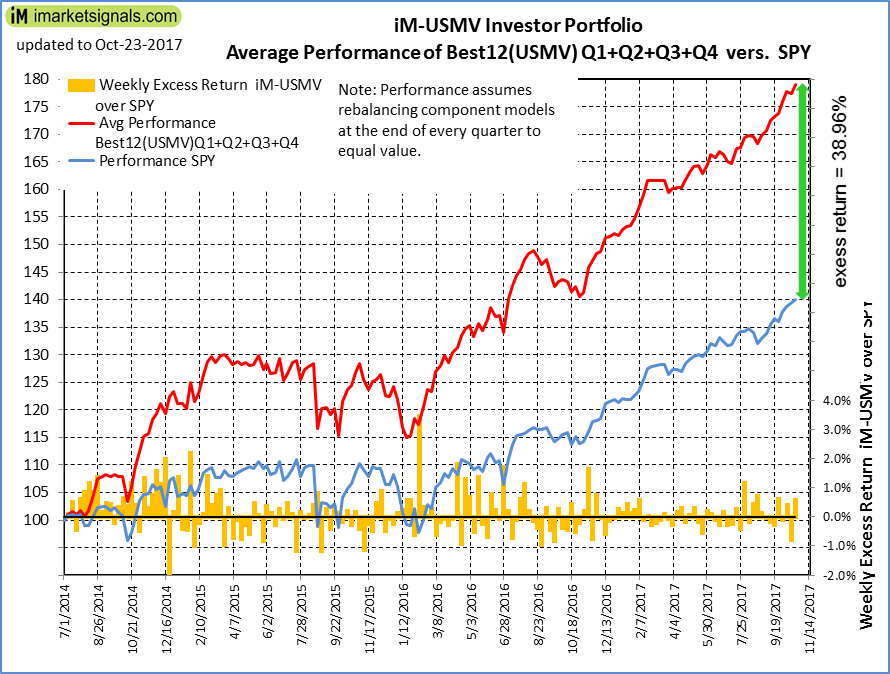 |
Average Performance of iM-Best12(USMV)Q1+Q2+Q3+Q4-Investor resulted in an excess return of 38.96% over SPY. (see iM-USMV Investor Portfolio) |
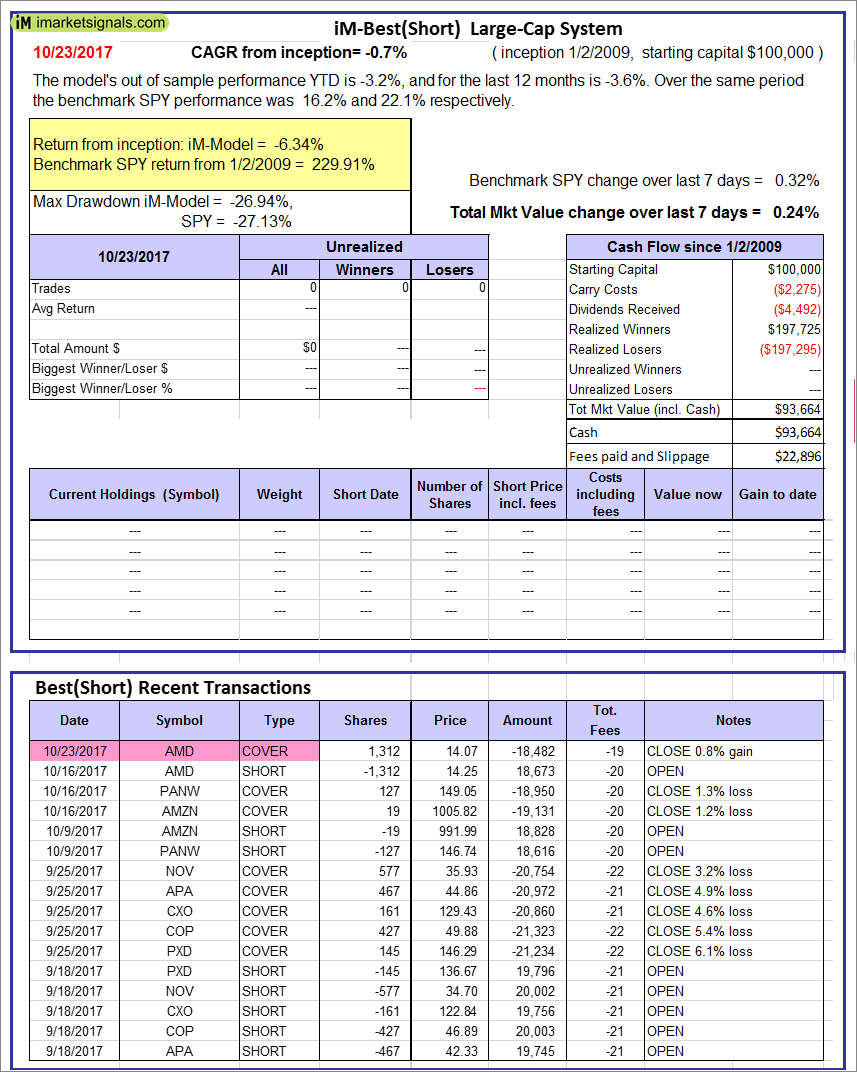 |
iM-Best(Short): The model’s out of sample performance YTD is -3.2%, and for the last 12 months is -3.6%. Over the same period the benchmark SPY performance was 16.2% and 22.1% respectively. Over the previous week the market value of iM-Best(Short) gained 0.24% at a time when SPY gained 0.32%. Over the period 1/2/2009 to 10/23/2017 the starting capital of $100,000 would have grown to $93,664 which includes $93,664 cash and excludes $22,896 spent on fees and slippage. |
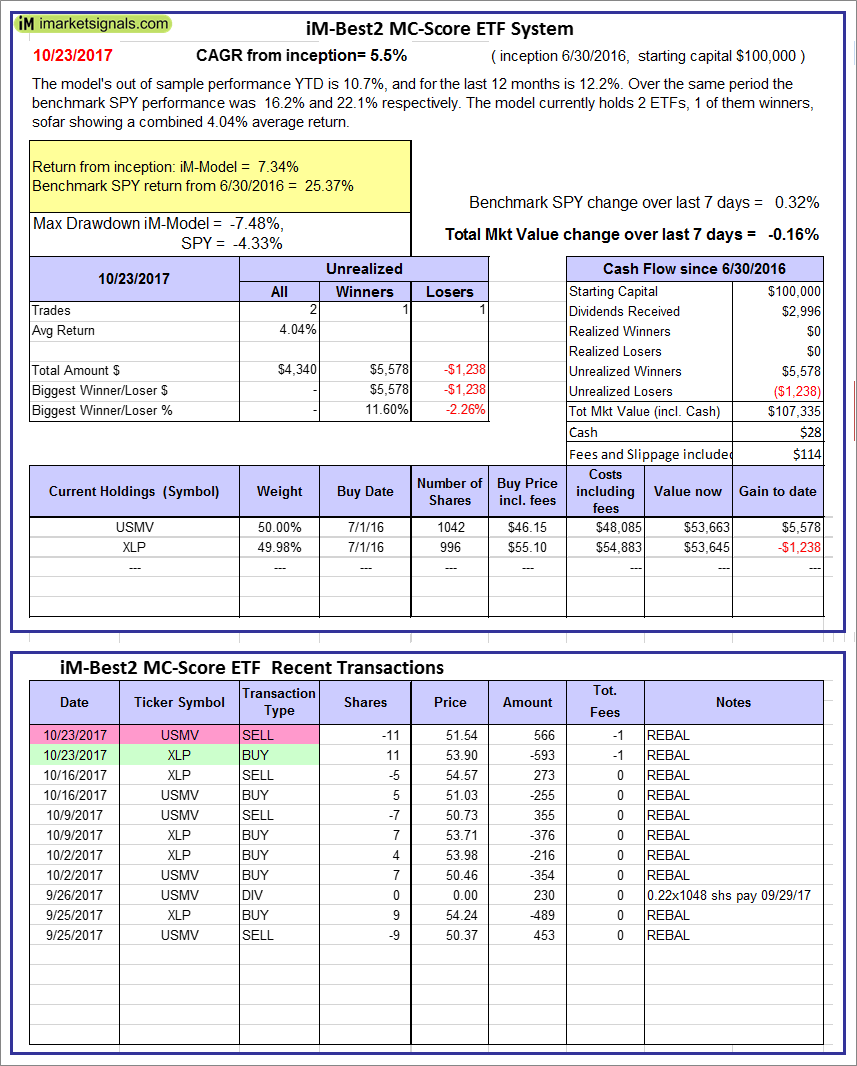 |
iM-Best2 MC-Score ETF System: The model’s out of sample performance YTD is 10.7%, and for the last 12 months is 12.2%. Over the same period the benchmark SPY performance was 16.2% and 22.1% respectively. Over the previous week the market value of the iM-Best2 MC-Score ETF System gained -0.16% at a time when SPY gained 0.32%. A starting capital of $100,000 at inception on 6/30/2016 would have grown to $107,335 which includes $28 cash and excludes $114 spent on fees and slippage. |
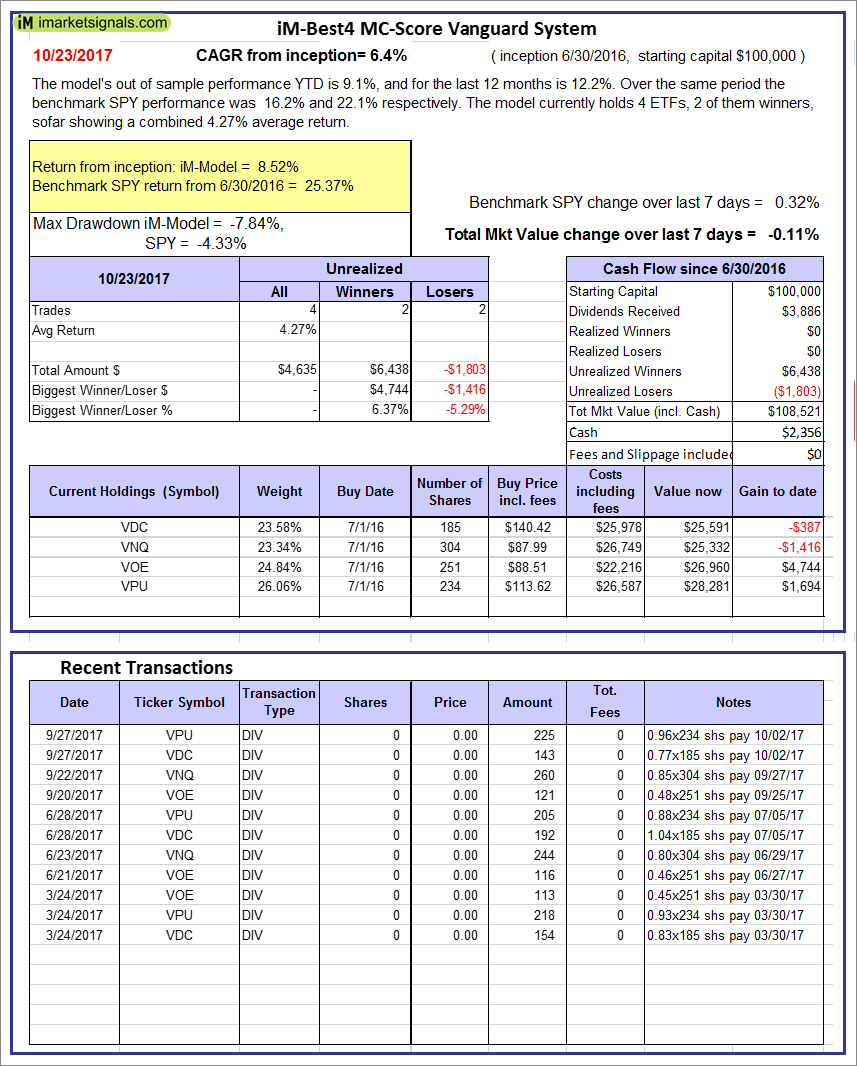 |
iM-Best4 MC-Score Vanguard System: The model’s out of sample performance YTD is 9.1%, and for the last 12 months is 12.2%. Over the same period the benchmark SPY performance was 16.2% and 22.1% respectively. Over the previous week the market value of the iM-Best4 MC-Score Vanguard System gained -0.11% at a time when SPY gained 0.32%. A starting capital of $100,000 at inception on 6/30/2016 would have grown to $108,521 which includes $2,356 cash and excludes $00 spent on fees and slippage. |
 |
iM-Composite (SH-RSP) Timer: The model’s out of sample performance YTD is 13.3%, and for the last 12 months is 20.3%. Over the same period the benchmark SPY performance was 16.2% and 22.1% respectively. Over the previous week the market value of the iM-Composite (SH-RSP) Timer gained 0.52% at a time when SPY gained 0.32%. A starting capital of $100,000 at inception on 6/30/2016 would have grown to $124,399 which includes $1,593 cash and excludes $513 spent on fees and slippage. |
 |
iM-Composite (SPY-IEF) Timer: The model’s out of sample performance YTD is 17.8%, and for the last 12 months is 23.0%. Over the same period the benchmark SPY performance was 16.2% and 22.1% respectively. Over the previous week the market value of the iM-Composite (SPY-IEF) Timer gained 0.32% at a time when SPY gained 0.32%. A starting capital of $100,000 at inception on 6/30/2016 would have grown to $126,741 which includes $223 cash and excludes $1,390 spent on fees and slippage. |
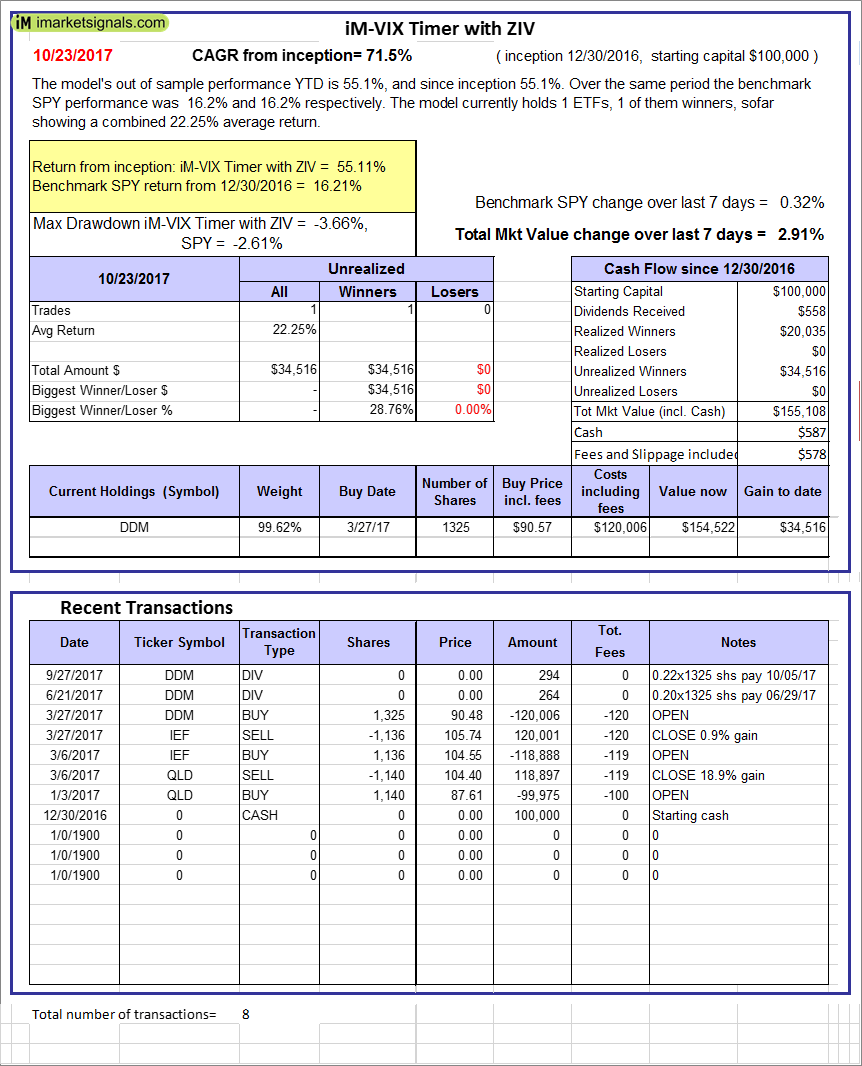 |
iM-VIX Timer with ZIV: The model’s out of sample performance YTD is 55.1%, and since inception 55.1%. Over the same period the benchmark SPY performance was 16.2% and 16.2% respectively. Over the previous week the market value of the iM-VIX Timer with ZIV gained 2.91% at a time when SPY gained 0.32%. A starting capital of $100,000 at inception on 6/30/2016 would have grown to $155,108 which includes $587 cash and excludes $578 spent on fees and slippage. |
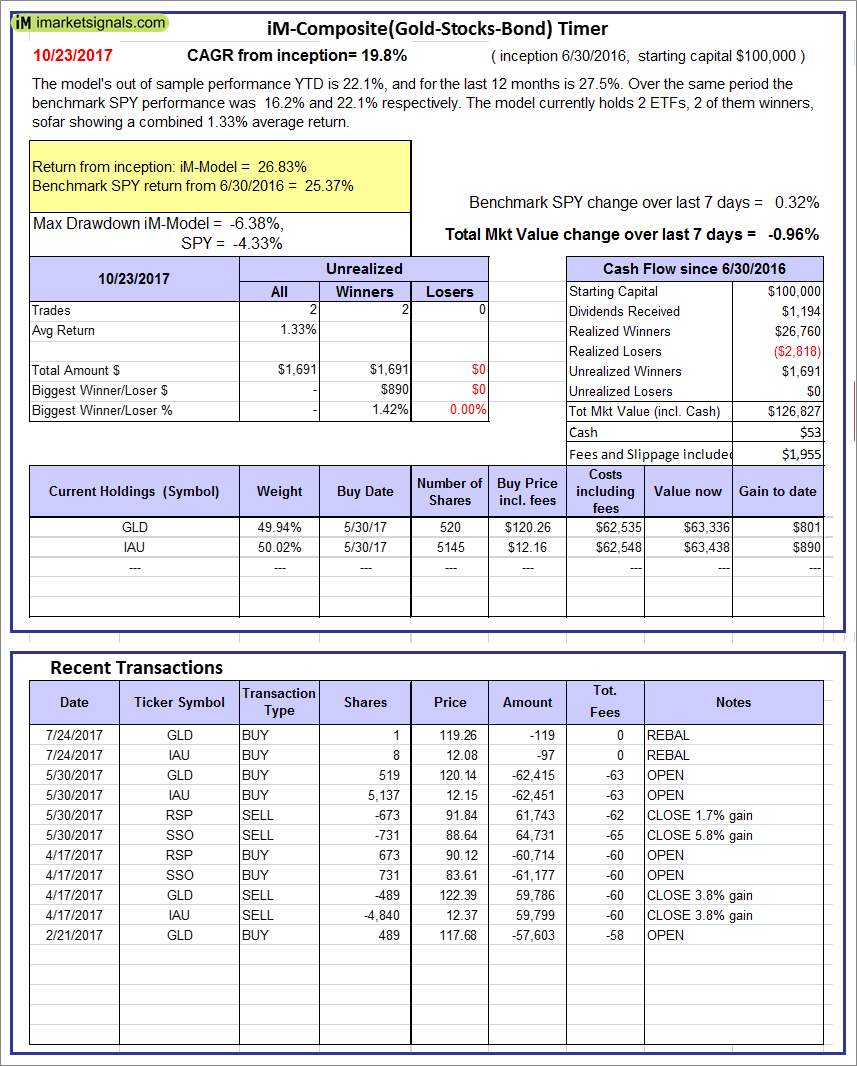 |
iM-Composite(Gold-Stocks-Bond) Timer: The model’s out of sample performance YTD is 22.1%, and for the last 12 months is 27.5%. Over the same period the benchmark SPY performance was 16.2% and 22.1% respectively. Over the previous week the market value of the iM-Composite(Gold-Stocks-Bond) Timer gained -0.96% at a time when SPY gained 0.32%. A starting capital of $100,000 at inception on 6/30/2016 would have grown to $126,827 which includes $53 cash and excludes $1,955 spent on fees and slippage. |
 |
iM-Low Turnover Composite Timer Combo: The model’s out of sample performance from inception is 4.5%. The benchmark SPY performance over the same period is 10.6%. Over the previous week the market value of the iM-Low Turnover Composite Timer Combo gained -0.25% at a time when SPY gained 0.32%. A starting capital of $100,000 at inception on 3/24/27 would have grown to $104,494 which includes $900 cash and excludes $69 spent on fees and slippage. |
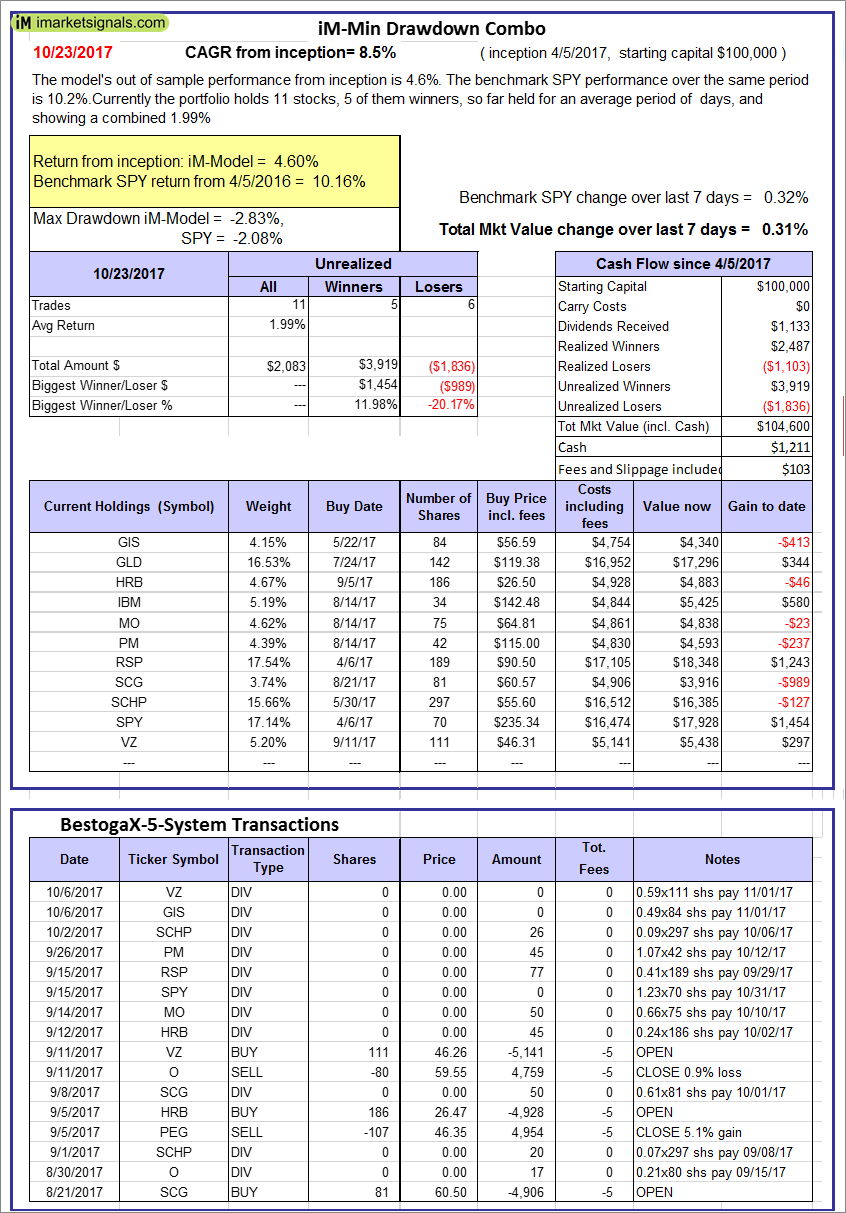 |
iM-Min Drawdown Combo: The model’s out of sample performance from inception is 4.6%. The benchmark SPY performance over the same period is 10.2%. Over the previous week the market value of the iM-Min Drawdown Combo gained 0.31% at a time when SPY gained 0.32%. A starting capital of $100,000 at inception on 4/5/2017 would have grown to $104,600 which includes $1,211 cash and excludes $103 spent on fees and slippage. |
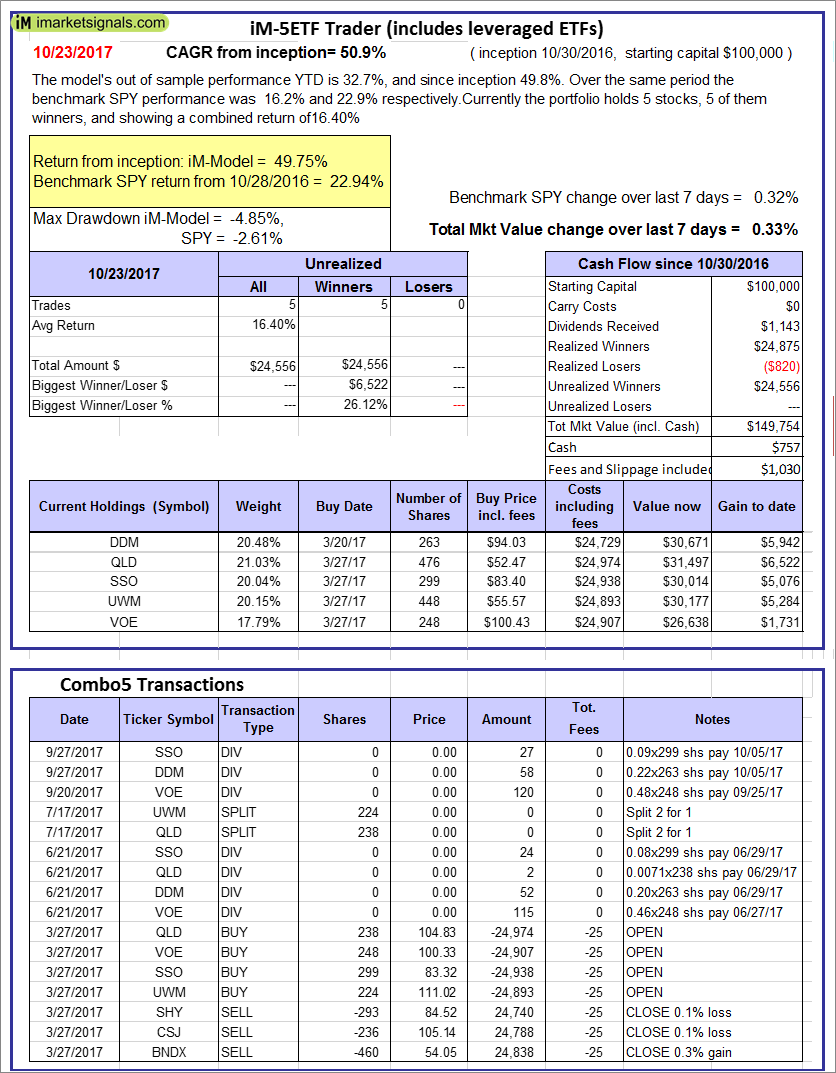 |
iM-5ETF Trader (includes leveraged ETFs): The model’s out of sample performance YTD is 32.7%, and since inception 49.8%. Over the same period the benchmark SPY performance was 16.2% and 22.9% respectively. Over the previous week the market value of the iM-5ETF Trader (includes leveraged ETFs) gained 0.33% at a time when SPY gained 0.32%. A starting capital of $100,000 at inception on 10/30/2016 would have grown to $149,754 which includes $757 cash and excludes $1,030 spent on fees and slippage. |
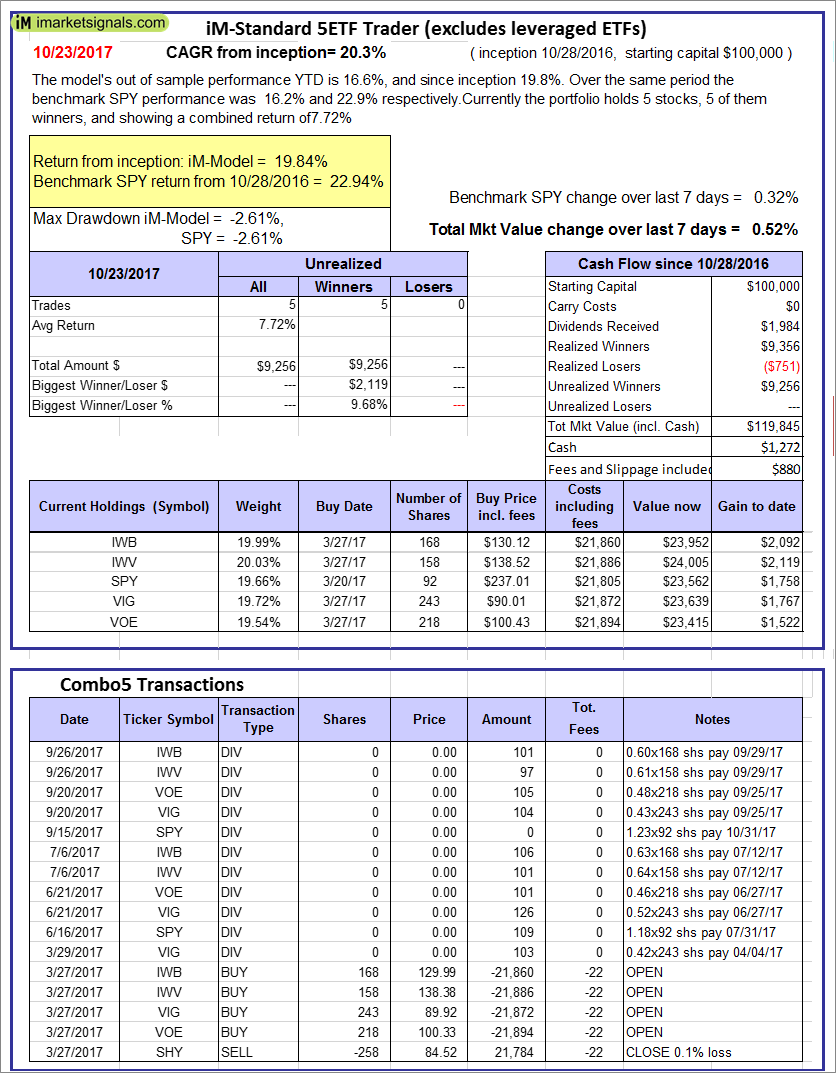 |
iM-Standard 5ETF Trader (excludes leveraged ETFs): The model’s out of sample performance YTD is 16.6%, and since inception 19.8%. Over the same period the benchmark SPY performance was 16.2% and 22.9% respectively. Over the previous week the market value of the iM-Standard 5ETF Trader (excludes leveraged ETFs) gained 0.52% at a time when SPY gained 0.32%. A starting capital of $100,000 at inception on 10/30/2016 would have grown to $119,845 which includes $1,272 cash and excludes $880 spent on fees and slippage. |
iM-Best Reports – 10/24/2017
Posted in pmp SPY-SH
Leave a Reply
You must be logged in to post a comment.