
Bond-market:
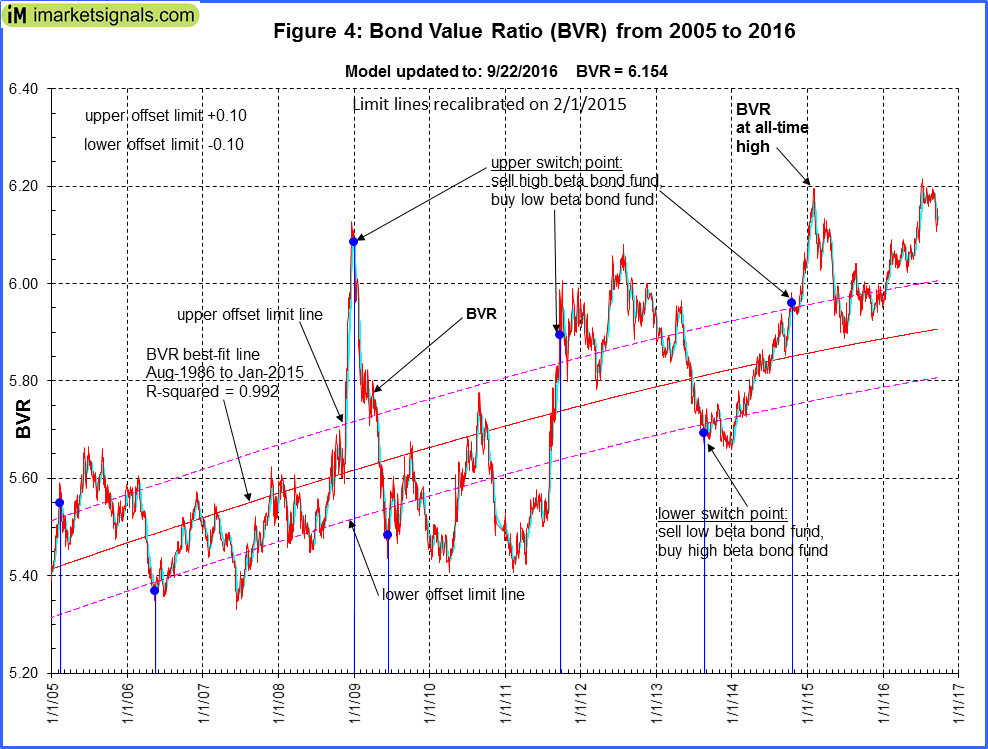 The BVR-model avoids high beta bonds (long-bonds) and also intermediate duration bonds.
The Bond Value Ratio is shown in Fig 4. The BVR is below last week’s level. According to the model, only when BVR turns upward after having been lower than the lower offset-line should one consider long bonds again.
The Yield Curve:
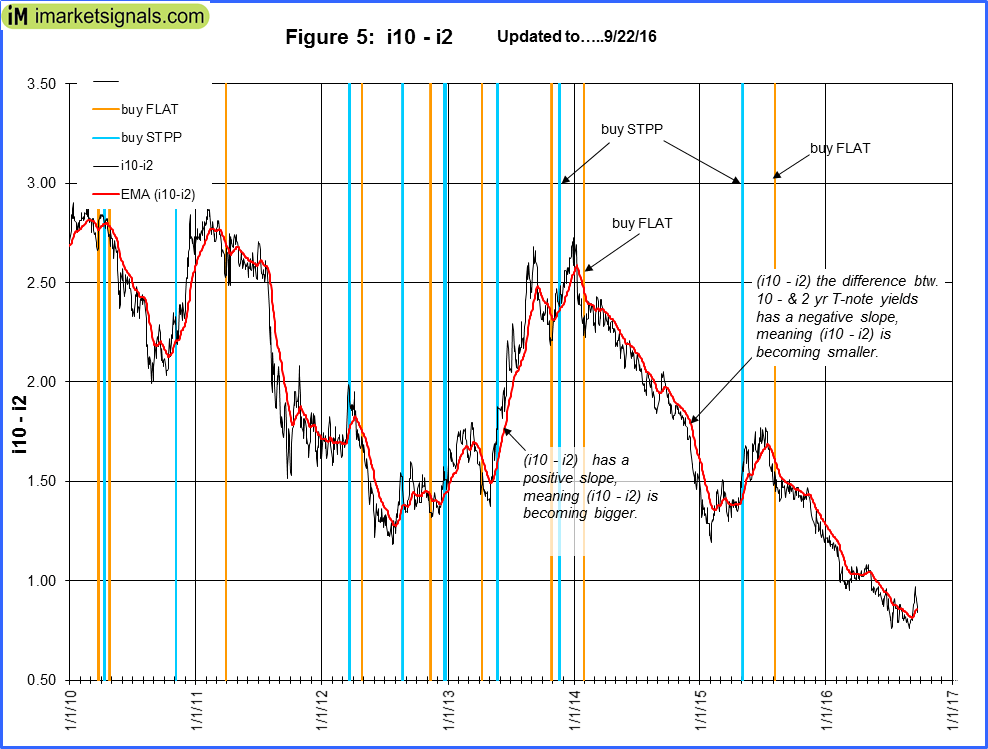 The yield curve model indicates the trend of the 10-year and 2-year Treasuries yield spread. Figure 5 charts (i10 – i2) which declined over the last year, was temporary halted, and now continues its downward trend. FLAT and STPP are ETNs. STPP profits from a steepening yield curve and FLAT increases in value when the yield curve flattens. This model confirms the direction of the BVR.
Gold:
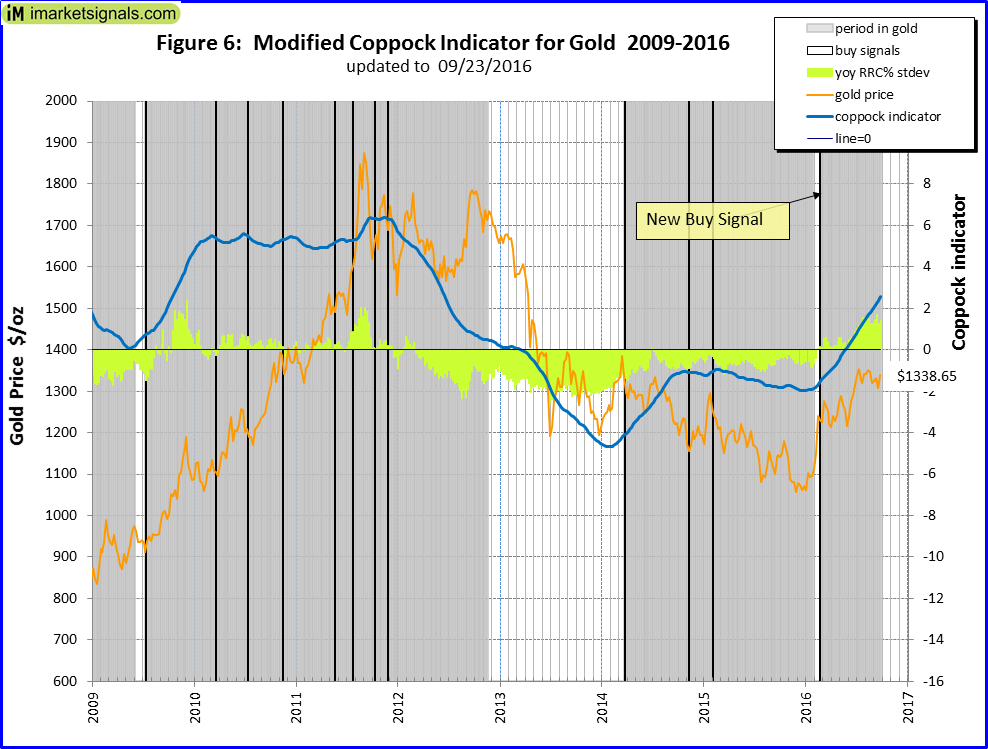 The modified Coppock Gold indicator shown in Fig 6. This model generated a buy end February 2016 and is invested in gold.
This indicator is described in Is it Time to Buy Gold Again? – Wait for the buy signal …….
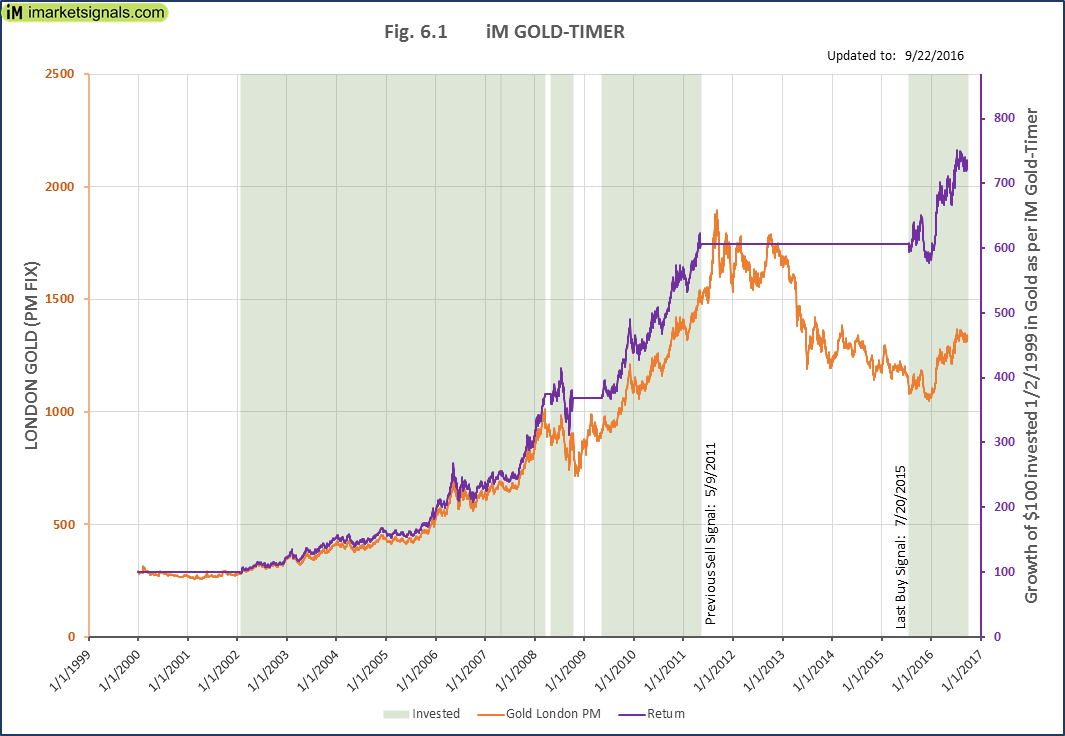 The iM GOLD-TIMER is invested in gold.
This indicator is described in the article: The iM Gold-Timer
Silver:
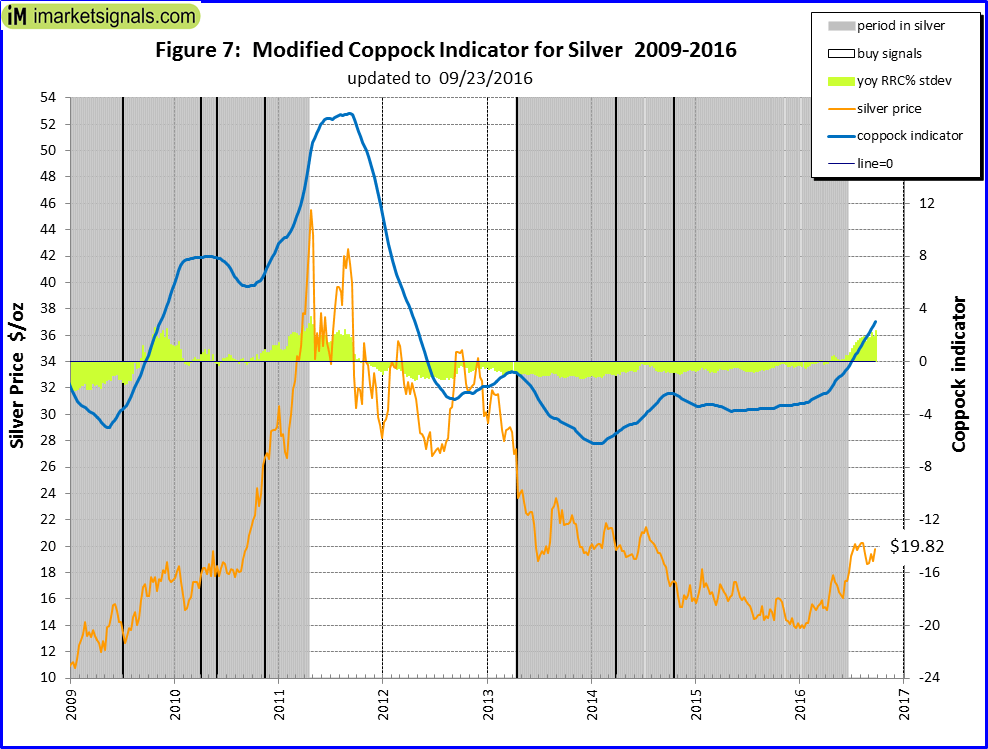 The modified Coppock Silver indicator shown in Fig 7 and exited the market on June 24, 2016, as the holding period since the last buy has expired .
This indicator is described in Silver – Better Than Gold: A Modified Coppock Indicator for Silver.
Leave a Reply
You must be logged in to post a comment.