
  |
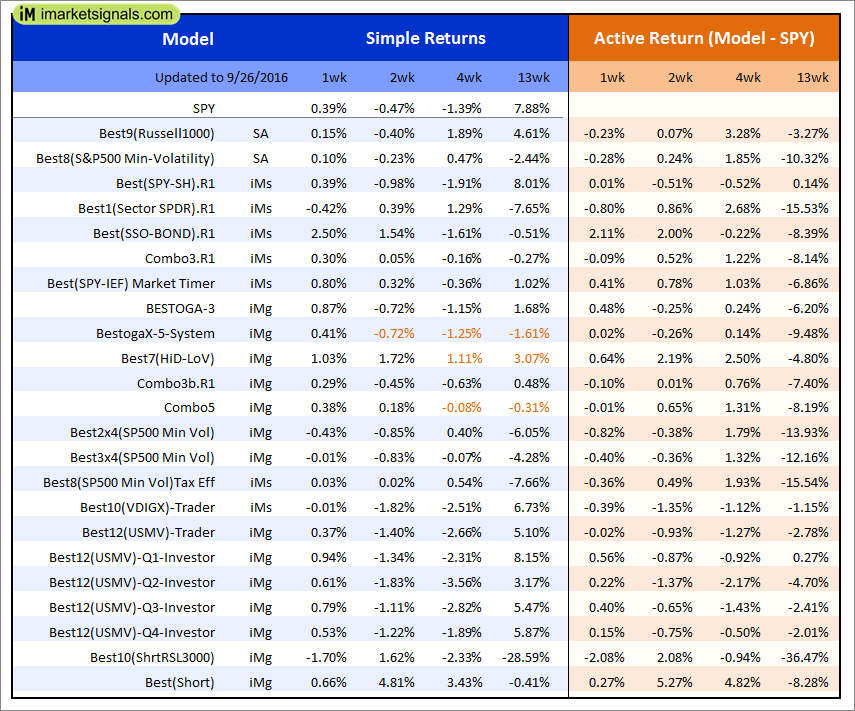
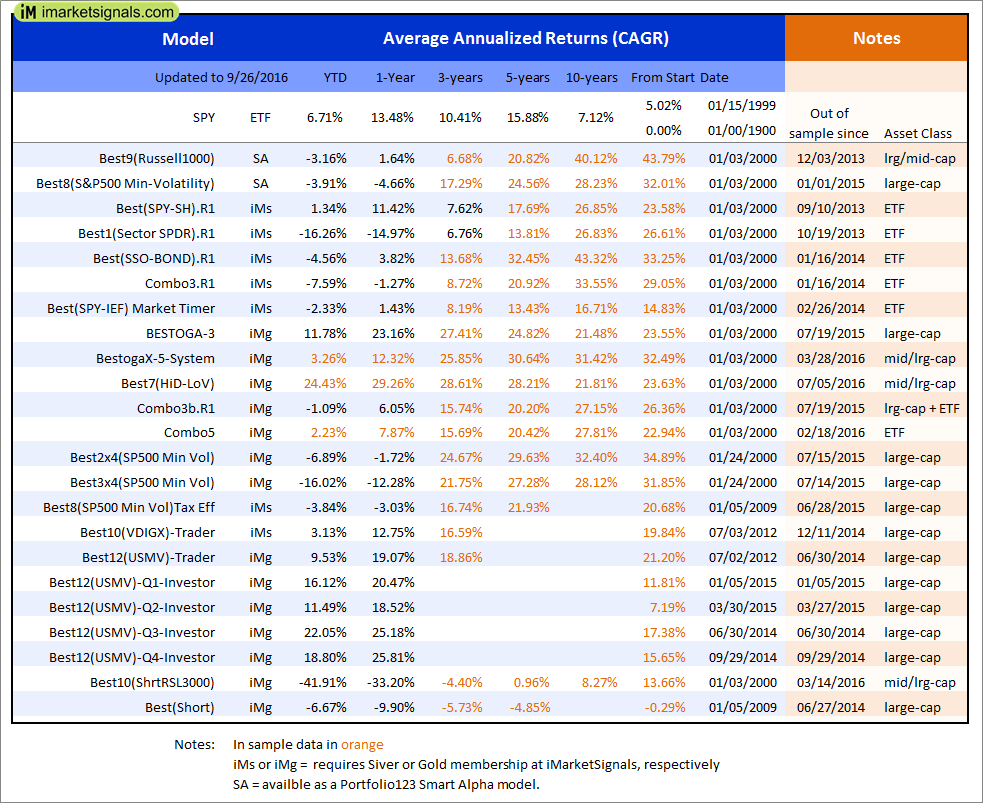
Out of sample performance summary of our models for the past 1, 2, 4 and 13 week periods. The active active return indicates how the models over- or underperformed the benchmark ETF SPY. Also the YTD, and the 1-, 3-, 5- and 10-year annualized returns are shown in the second table |
 |
iM-Best(SPY-SH).R1: The model’s out of sample performance YTD is 1.3%, and for the last 12 months is 11.5%. Over the same period the benchmark SPY performance was 6.7% and 13.5% respectively. Over the previous week the market value of Best(SPY-SH) gained 0.39% at a time when SPY gained 0.39%. A starting capital of $100,000 at inception on 1/2/2009 would have grown to $440,648 which includes -$4,971 cash and excludes $15,358 spent on fees and slippage. |
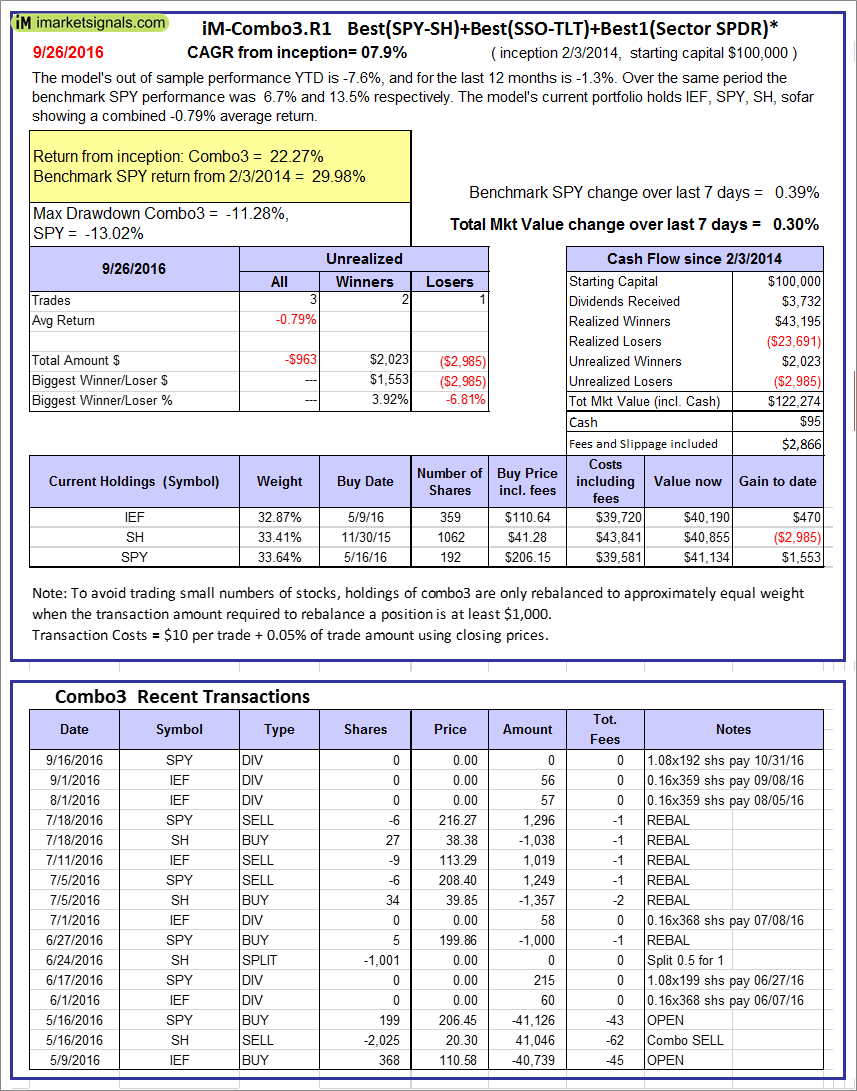 |
iM-Combo3.R1: The model’s out of sample performance YTD is -7.6%, and for the last 12 months is -1.3%. Over the same period the benchmark SPY performance was 6.7% and 13.5% respectively. Over the previous week the market value of iM-Combo3.R1 gained 0.30% at a time when SPY gained 0.39%. A starting capital of $100,000 at inception on 2/3/2014 would have grown to $122,274 which includes $95 cash and excludes $2,866 spent on fees and slippage. |
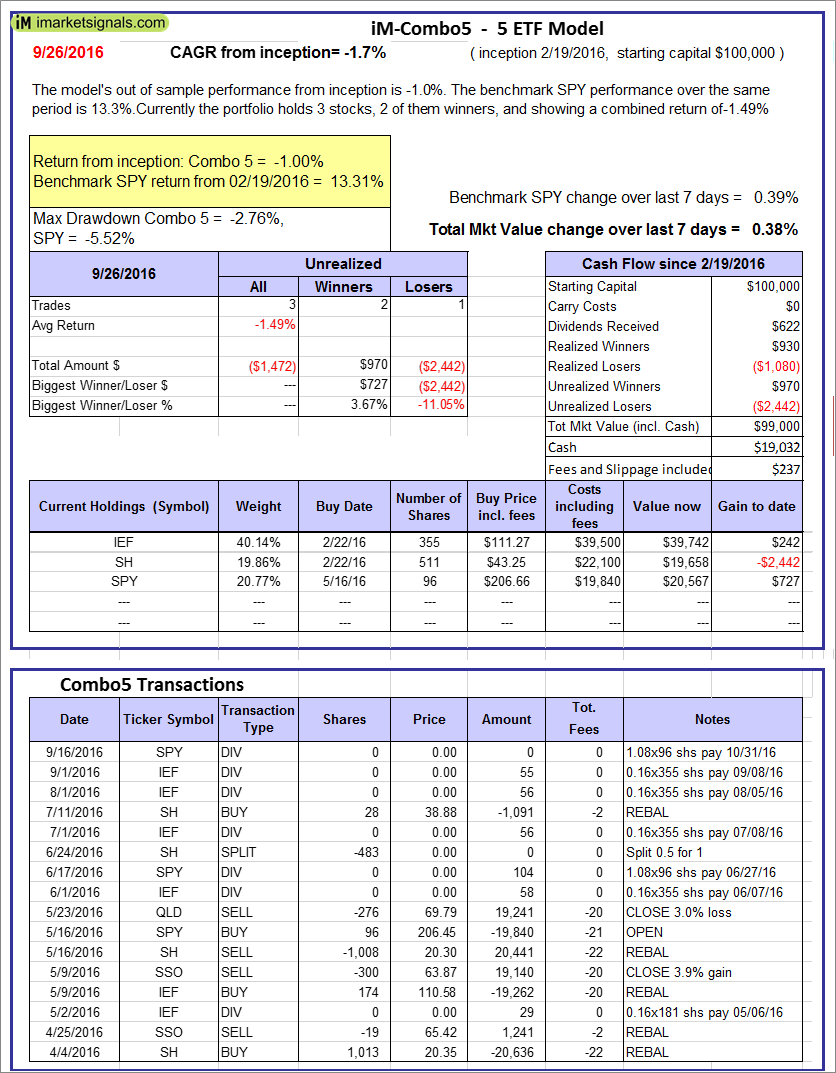 |
iM-Combo5: The model’s out of sample performance from inception is -1.0%. The benchmark SPY performance over the same period is 13.3%. Over the previous week the market value of iM-Combo5 gained 0.38% at a time when SPY gained 0.39%. A starting capital of $100,000 at inception on 2/22/2016 would have grown to $99,000 which includes $19,032 cash and excludes $237 spent on fees and slippage. |
 |
The iM-Best8(S&P500 Min Vol)Tax-Efficient The model’s out of sample performance YTD is -3.8%, and for the last 12 months is -3.0%. Over the same period the benchmark SPY performance was 6.7% and 13.5% respectively. Over the previous week the market value of iM-Best8(S&P 500)Tax-Eff. gained 0.02% at a time when SPY gained 0.39%. A starting capital of $100,000 at inception on 1/2/2009 would have grown to $428,235 which includes $191,212 cash and excludes $7,554 spent on fees and slippage. |
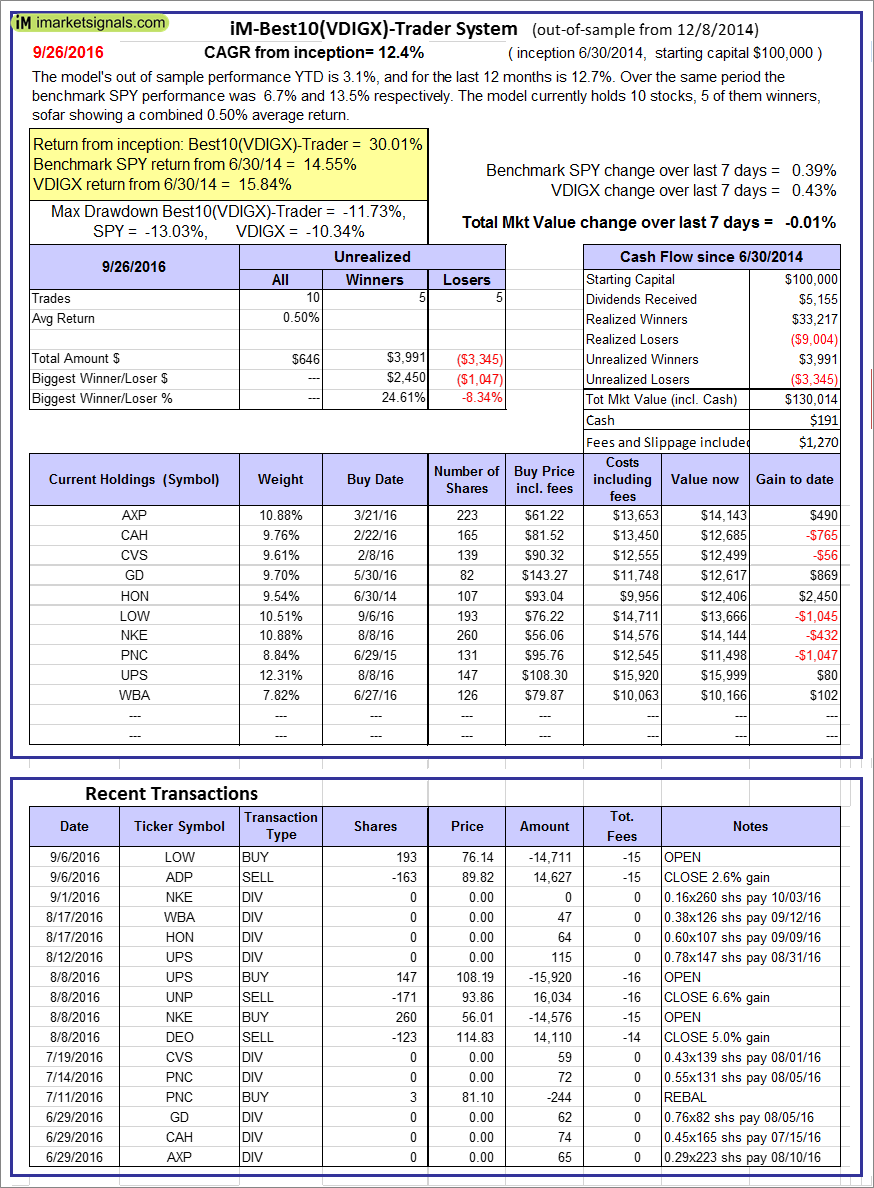 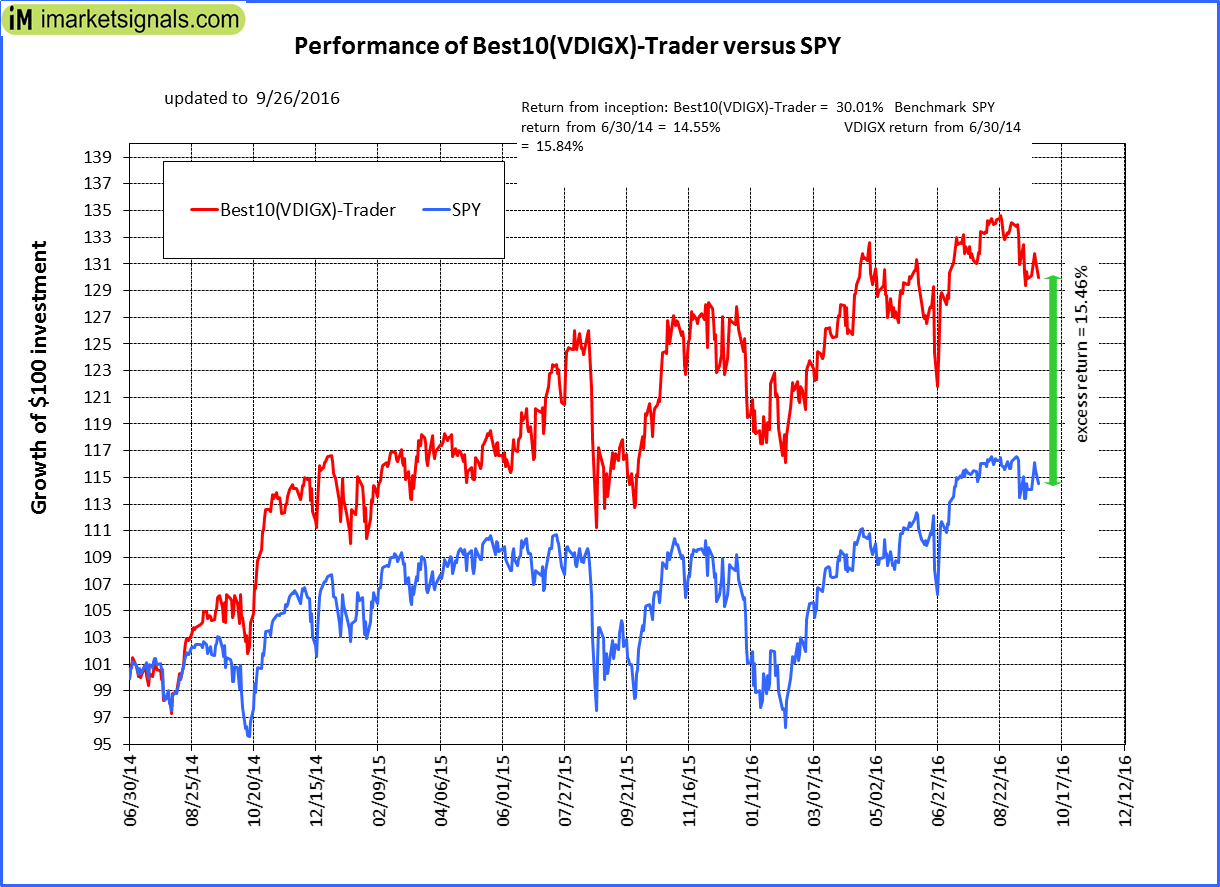 |
iM-Best10(VDIGX)-Trader: The model’s out of sample performance YTD is 3.1%, and for the last 12 months is 12.7%. Over the same period the benchmark SPY performance was 6.7% and 13.5% respectively. Since inception, on 7/1/2014, the model gained 30.01% while the benchmark SPY gained 14.55% and the ETF VDIGX gained 15.84% over the same period. Over the previous week the market value of iM-Best10(VDIGX) gained -0.01% at a time when SPY gained 0.39%. A starting capital of $100,000 at inception on 7/1/2014 would have grown to $130,014 which includes $191 cash and excludes $1,270 spent on fees and slippage. |
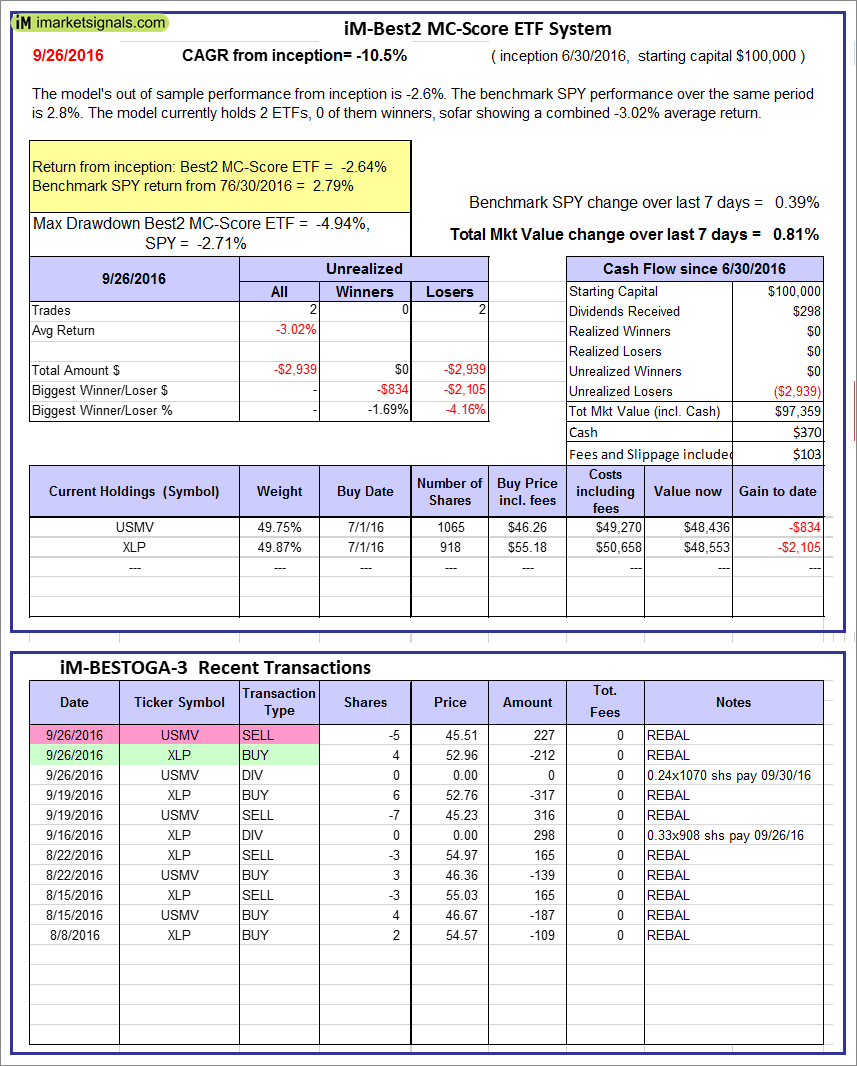 |
iM-Best2 MC-Score ETF System: The model’s out of sample performance from inception is -2.6%. The benchmark SPY performance over the same period is 2.8%. Over the previous week the market value of iM-BESTOGA-3 gained 0.81% at a time when SPY gained 0.39%. A starting capital of $100,000 at inception on 2/3/2014 would have grown to $370 which includes $103 cash and excludes Gain to date spent on fees and slippage. |
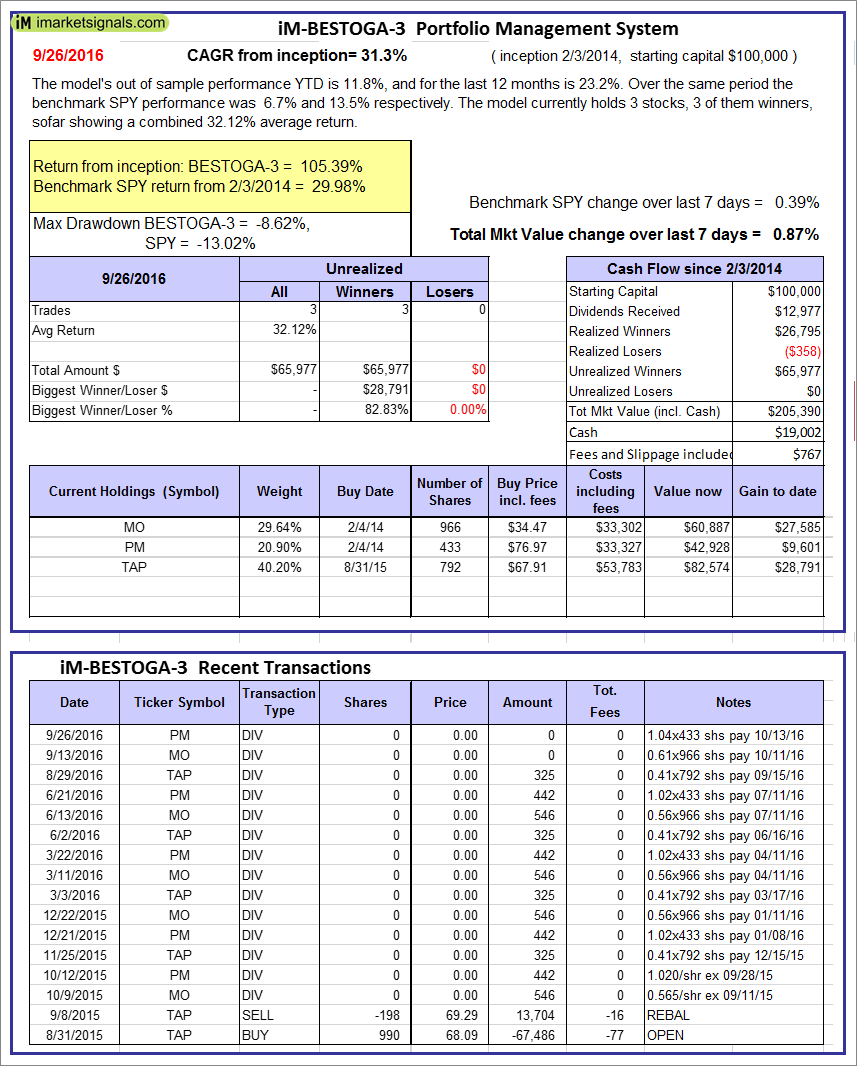 |
iM-BESTOGA-3: The model’s out of sample performance YTD is 11.8%, and for the last 12 months is 23.2%. Over the same period the benchmark SPY performance was 6.7% and 13.5% respectively. Over the previous week the market value of iM-BESTOGA-3 gained 0.87% at a time when SPY gained 0.39%. A starting capital of $100,000 at inception on 2/3/2014 would have grown to $205,390 which includes $19,002 cash and excludes $767 spent on fees and slippage. |
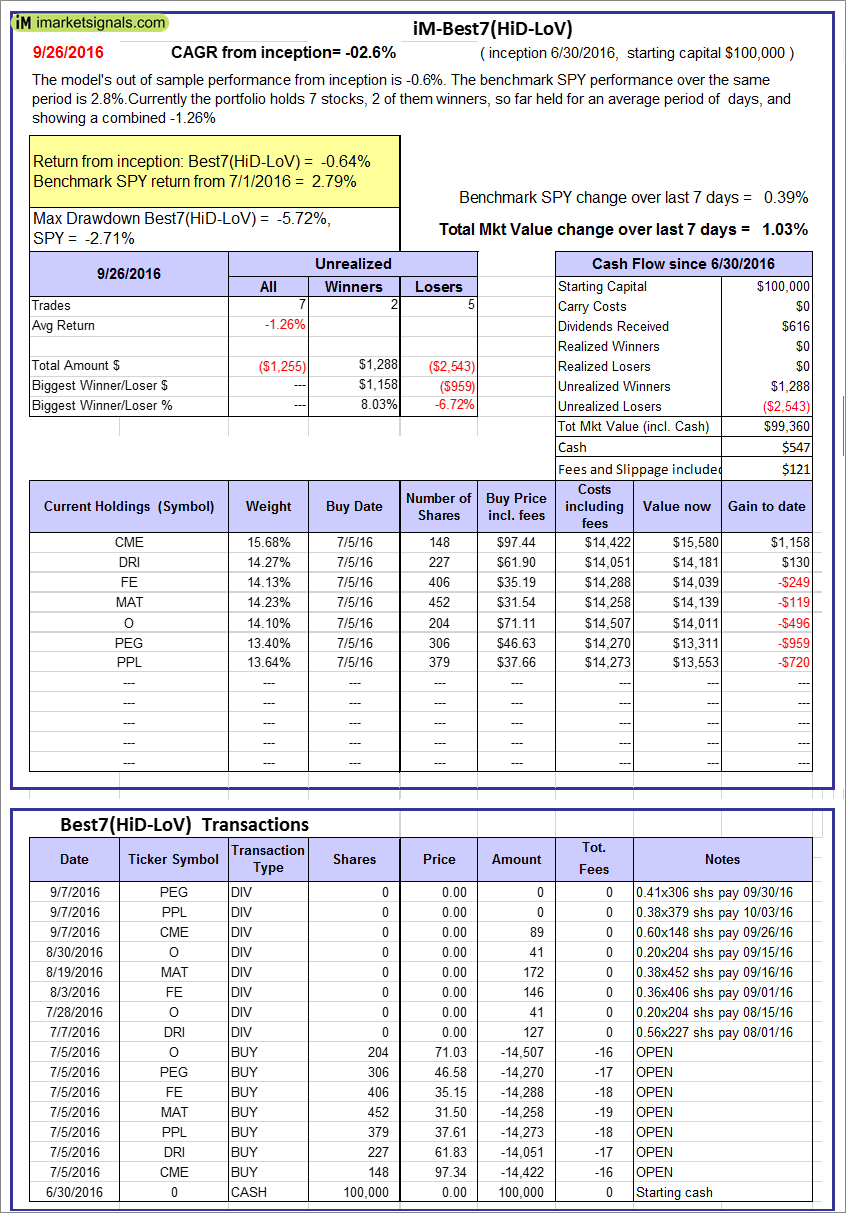 |
iM-Best7(HiD-LoV): The model’s out of sample performance from inception is -0.6%. The benchmark SPY performance over the same period is 2.8%. Over the previous week the market value of iM-BESTOGA-3 gained 1.03% at a time when SPY gained 0.39%. A starting capital of $100,000 at inception on 2/3/2014 would have grown to $99,360 which includes $547 cash and excludes $121 spent on fees and slippage. |
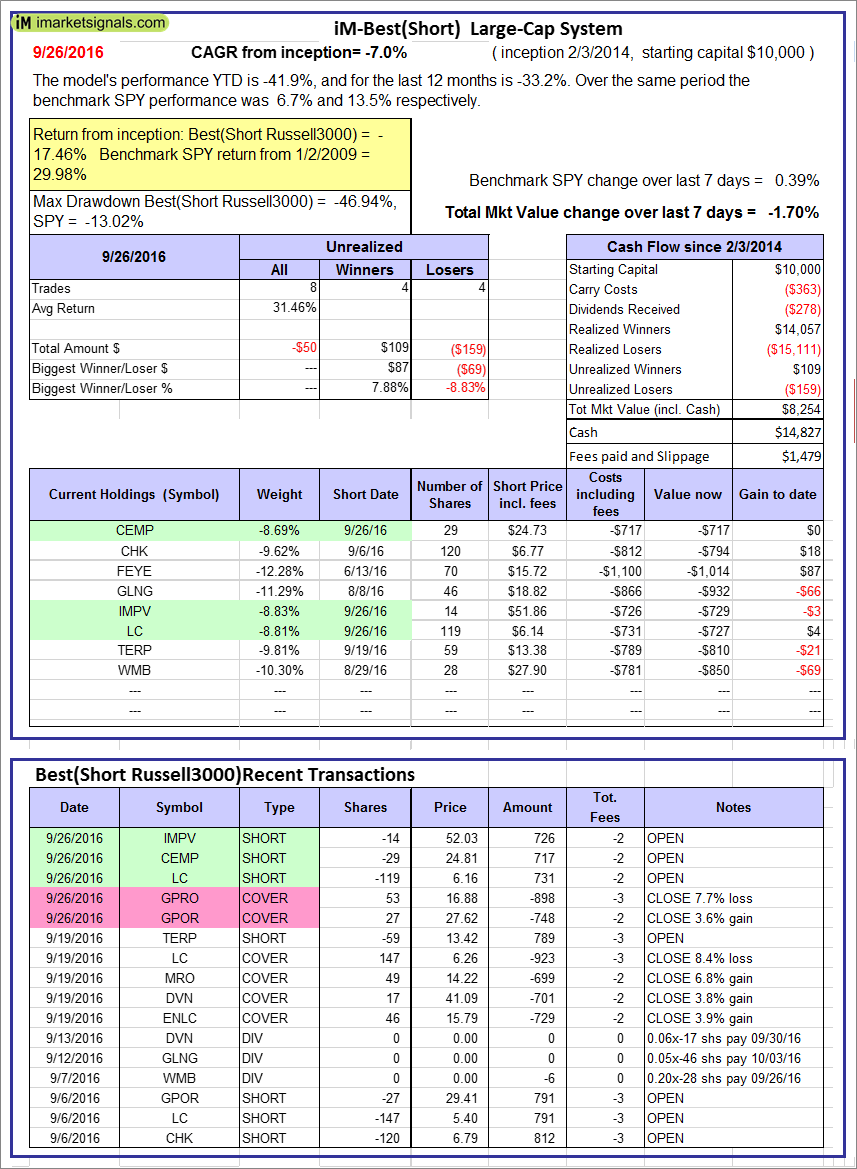 |
iM-Best10(Short Russell3000): The model’s performance YTD is -41.9%, and for the last 12 months is -33.2%. Over the same period the benchmark SPY performance was 6.7% and 13.5% respectively. Over the previous week the market value of iM-Best10(Short Russell3000) gained -1.70% at a time when SPY gained 0.39%. Over the period 2/3/2014 to 9/26/2016 the starting capital of $100,000 would have grown to $8,254 which includes $14,827 cash and excludes $1,479 spent on fees and slippage. |
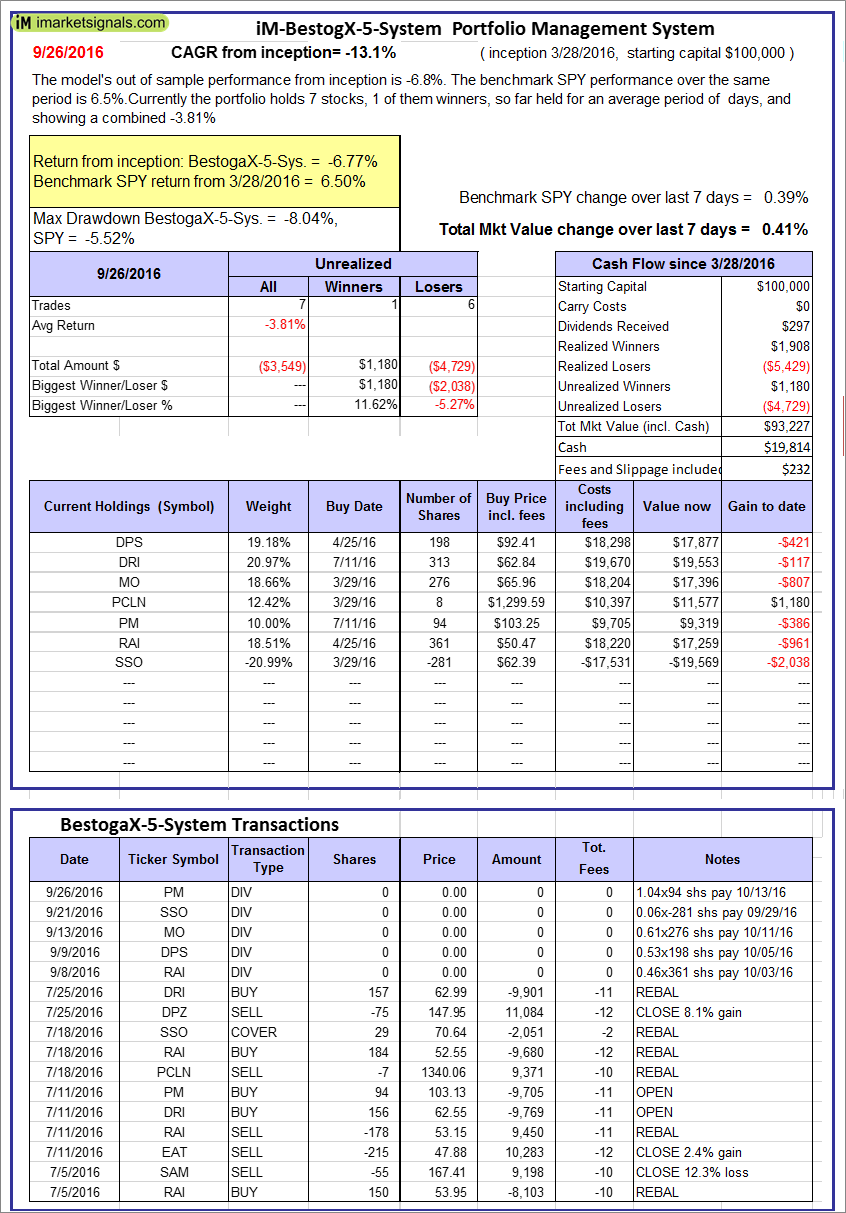 |
iM-BestogaX5-System: The model’s out of sample performance from inception is -6.8%. The benchmark SPY performance over the same period is 6.5%. Over the previous week the market value of iM-Best8(S&P 500)Tax-Eff. gained 0.41% at a time when SPY gained 0.39%. A starting capital of $100,000 at inception on 1/2/2009 would have grown to $93,227 which includes $19,814 cash and excludes $232 spent on fees and slippage. |
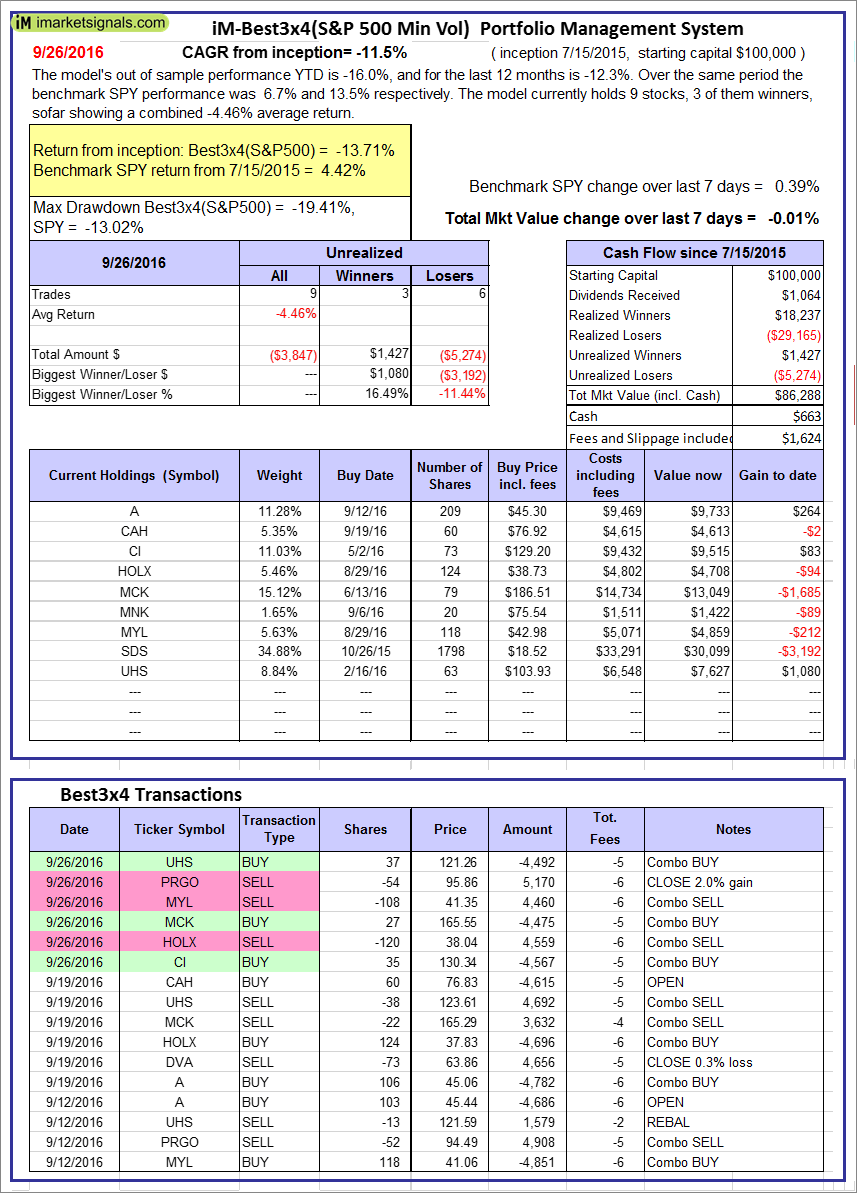 |
iM-Best3x4(S&P 500 Min Vol): The model’s out of sample performance YTD is -16.0%, and for the last 12 months is -12.3%. Over the same period the benchmark SPY performance was 6.7% and 13.5% respectively. Over the previous week the market value of iM-Best3x4 gained -0.01% at a time when SPY gained 0.39%. A starting capital of $100,000 at inception on 7/15/2015 would have grown to $86,288 which includes $663 cash and excludes $1,624 spent on fees and slippage. |
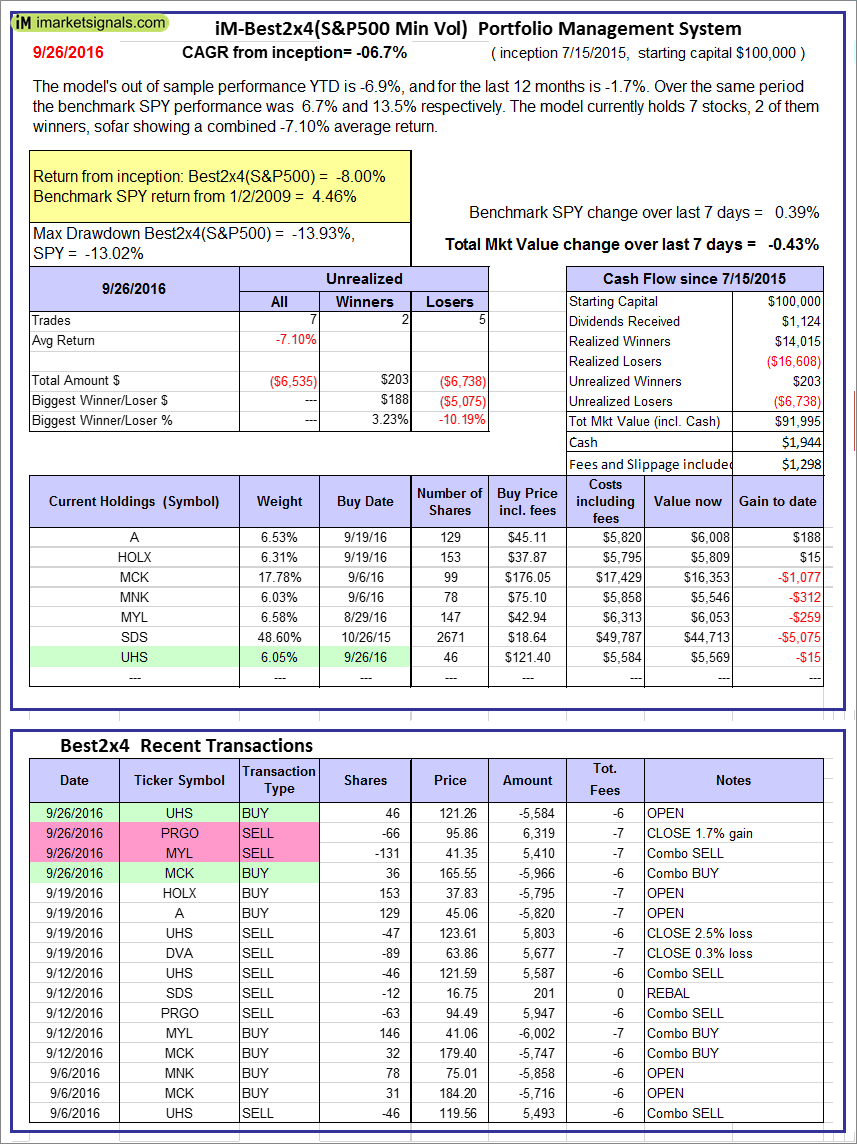 |
iM-Best2x4(S&P 500 Min Vol): The model’s out of sample performance YTD is -6.9%, and for the last 12 months is -1.7%. Over the same period the benchmark SPY performance was 6.7% and 13.5% respectively. Over the previous week the market value of iM-Best2x4 gained -0.43% at a time when SPY gained 0.39%. A starting capital of $100,000 at inception on 7/16/2015 would have grown to $91,995 which includes $1,944 cash and excludes $1,298 spent on fees and slippage. |
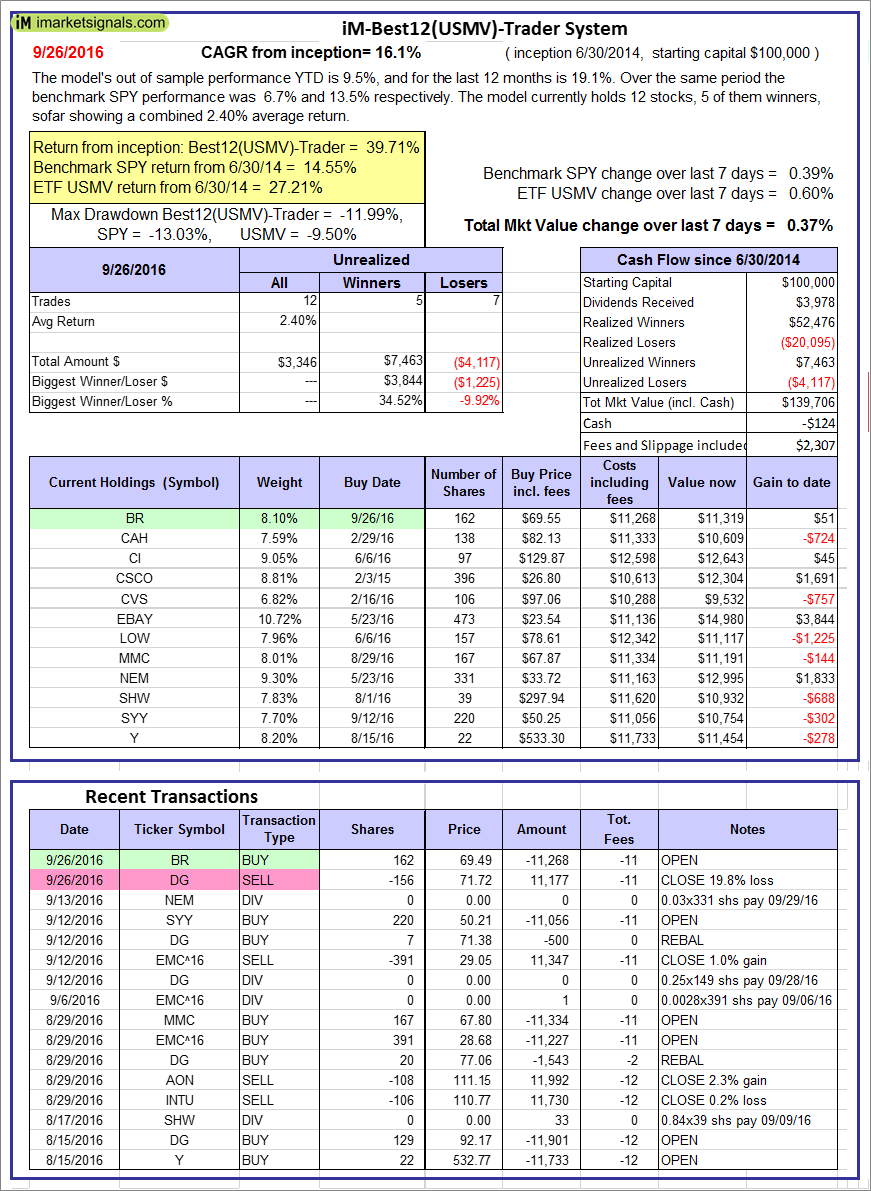 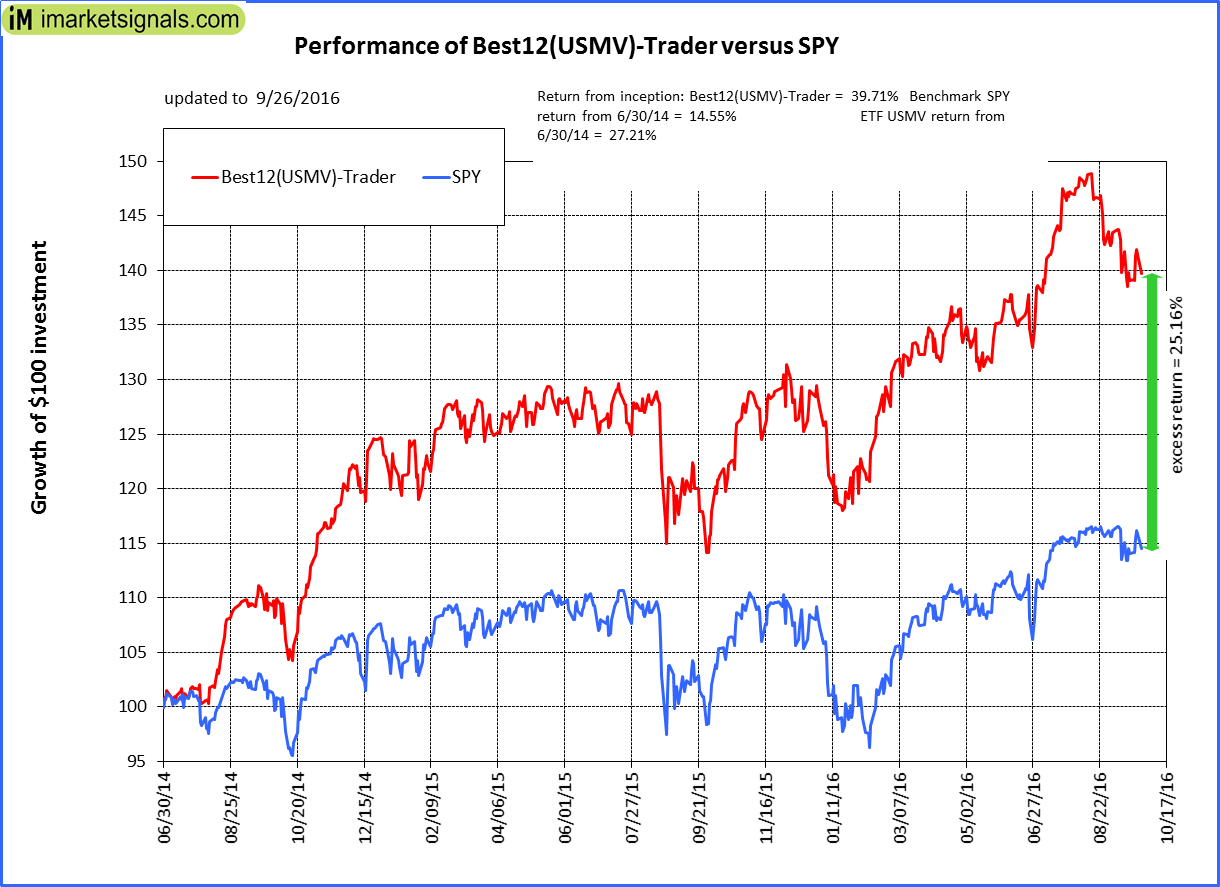 |
iM-Best12(USMV)-Trader: The model’s out of sample performance YTD is 9.5%, and for the last 12 months is 19.1%. Over the same period the benchmark SPY performance was 6.7% and 13.5% respectively. Since inception, on 7/1/2014, the model gained 39.71% while the benchmark SPY gained 14.55% and the ETF USMV gained 27.21% over the same period. Over the previous week the market value of iM-Best12(USMV)-Trader gained 0.37% at a time when SPY gained 0.39%. A starting capital of $100,000 at inception on 7/1/2014 would have grown to $139,706 which includes -$124 cash and excludes $2,307 spent on fees and slippage. |
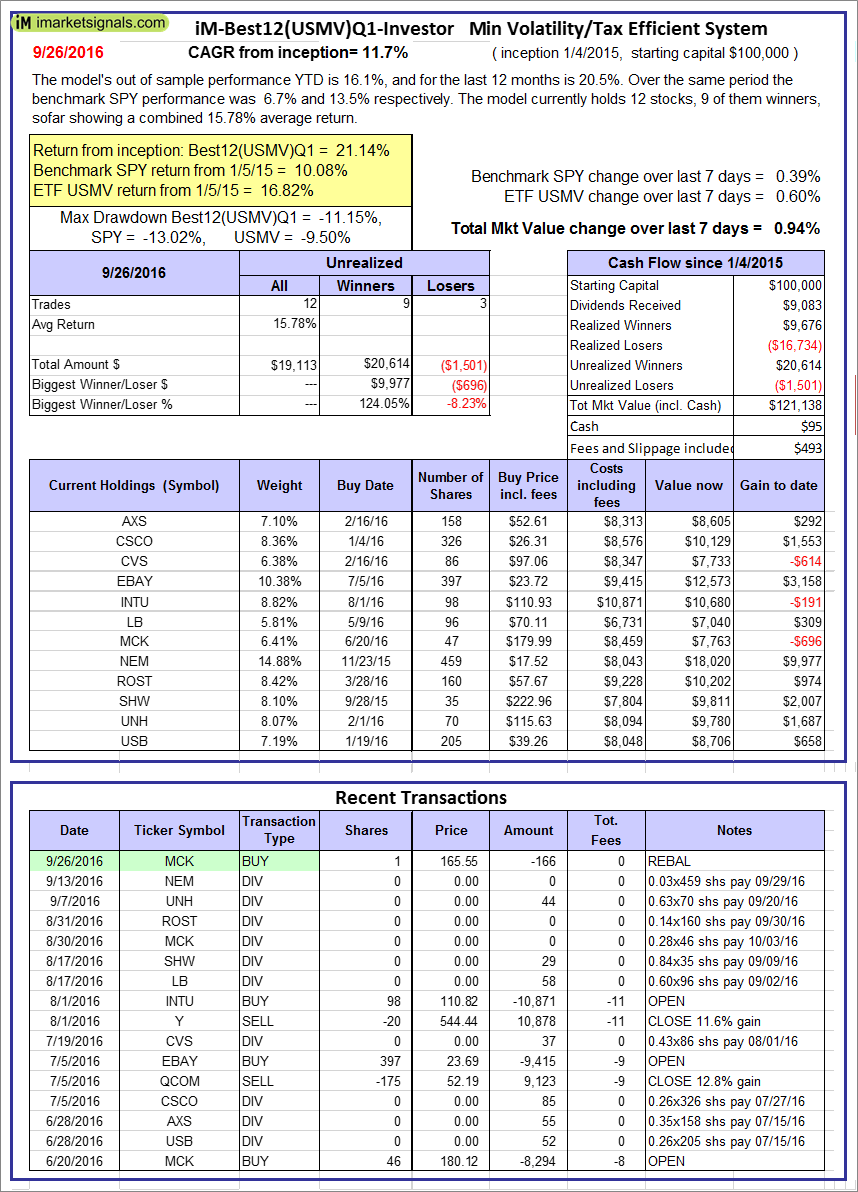 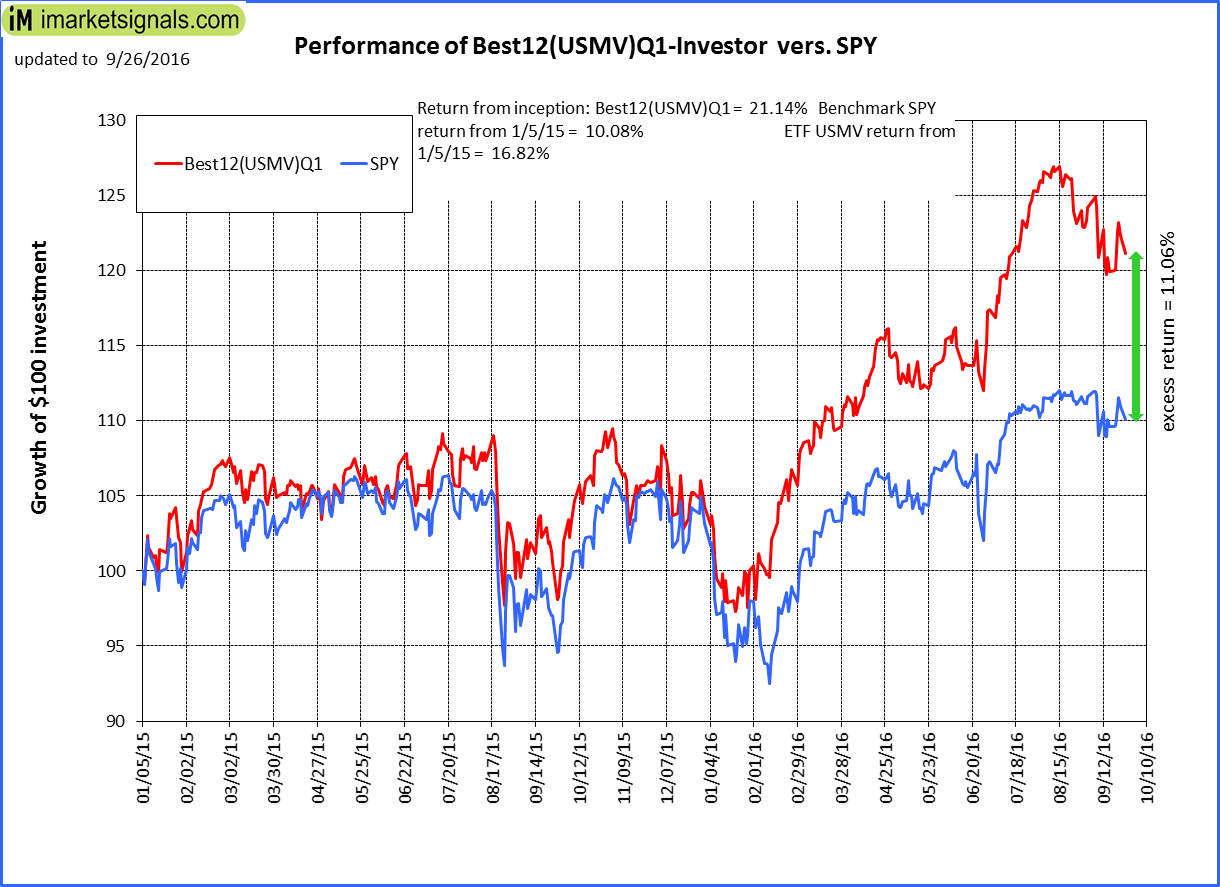 |
iM-Best12(USMV)Q1-Investor: The model’s out of sample performance YTD is 16.1%, and for the last 12 months is 20.5%. Over the same period the benchmark SPY performance was 6.7% and 13.5% respectively. Since inception, on 1/5/2015, the model gained 21.14% while the benchmark SPY gained 10.08% and the ETF USMV gained 16.82% over the same period. Over the previous week the market value of iM-Best12(USMV)Q1 gained 0.94% at a time when SPY gained 0.39%. A starting capital of $100,000 at inception on 1/5/2015 would have grown to $121,138 which includes $95 cash and excludes $493 spent on fees and slippage. |
  |
iM-Best12(USMV)Q2-Investor: The model’s out of sample performance YTD is 11.5%, and for the last 12 months is 18.5%. Over the same period the benchmark SPY performance was 6.7% and 13.5% respectively. Since inception, on 3/31/2015, the model gained 10.91% while the benchmark SPY gained 6.15% and the ETF USMV gained 12.83% over the same period. Over the previous week the market value of iM-Best12(USMV)Q2 gained 0.61% at a time when SPY gained 0.39%. A starting capital of $100,000 at inception on 3/31/2015 would have grown to $110,910 which includes -$110 cash and excludes $402 spent on fees and slippage. |
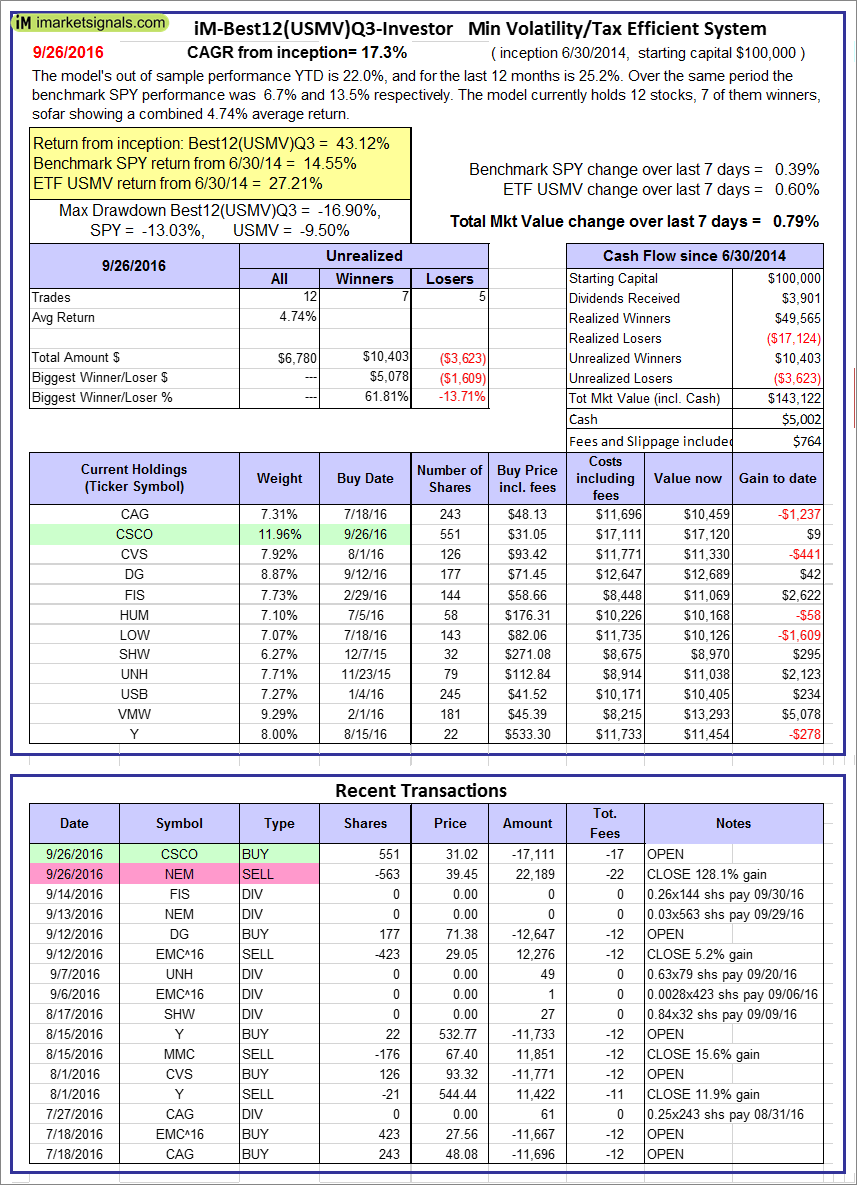 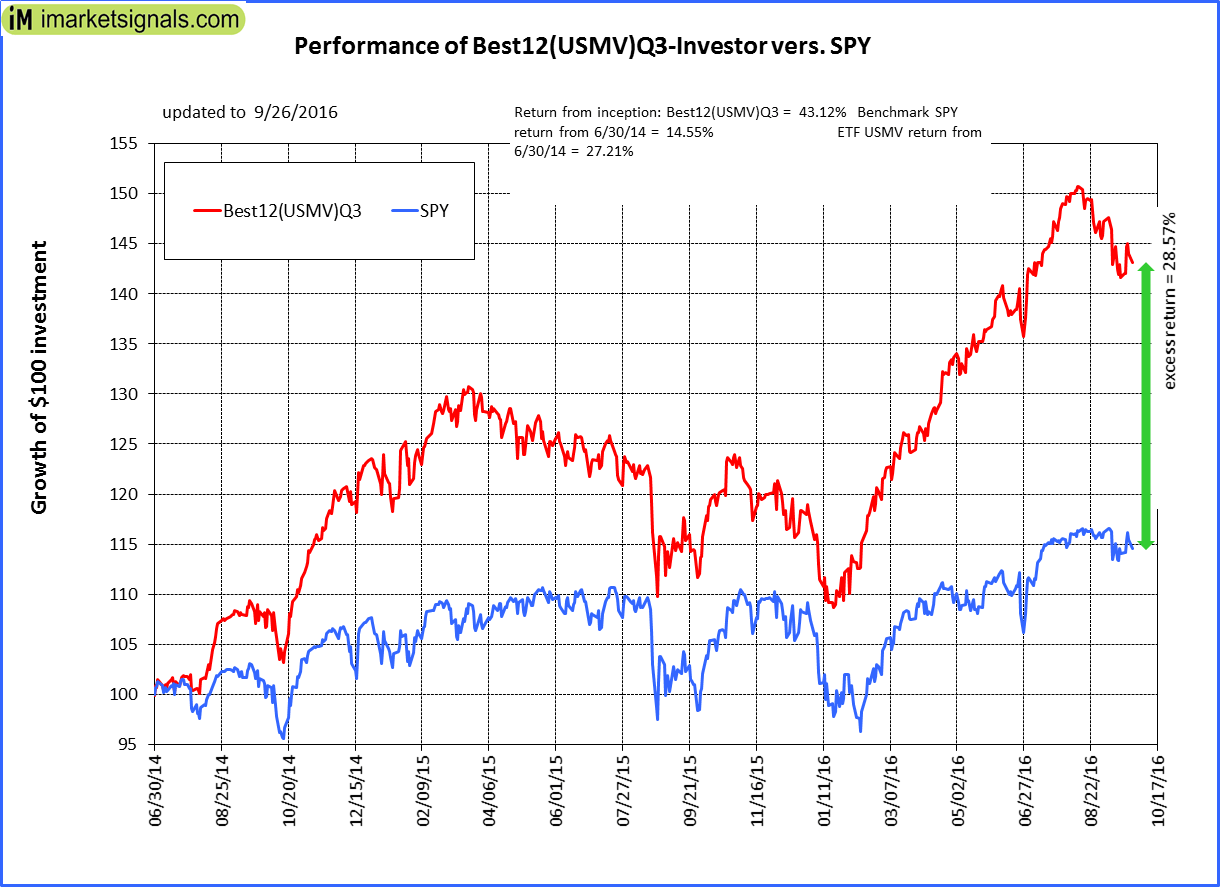 |
iM-Best12(USMV)Q3-Investor: The model’s out of sample performance YTD is 22.0%, and for the last 12 months is 25.2%. Over the same period the benchmark SPY performance was 6.7% and 13.5% respectively. Since inception, on 7/1/2014, the model gained 43.12% while the benchmark SPY gained 14.55% and the ETF USMV gained 27.21% over the same period. Over the previous week the market value of iM-Best12(USMV)Q3 gained 0.79% at a time when SPY gained 0.39%. A starting capital of $100,000 at inception on 7/1/2014 would have grown to $143,122 which includes $5,002 cash and excludes $764 spent on fees and slippage. |
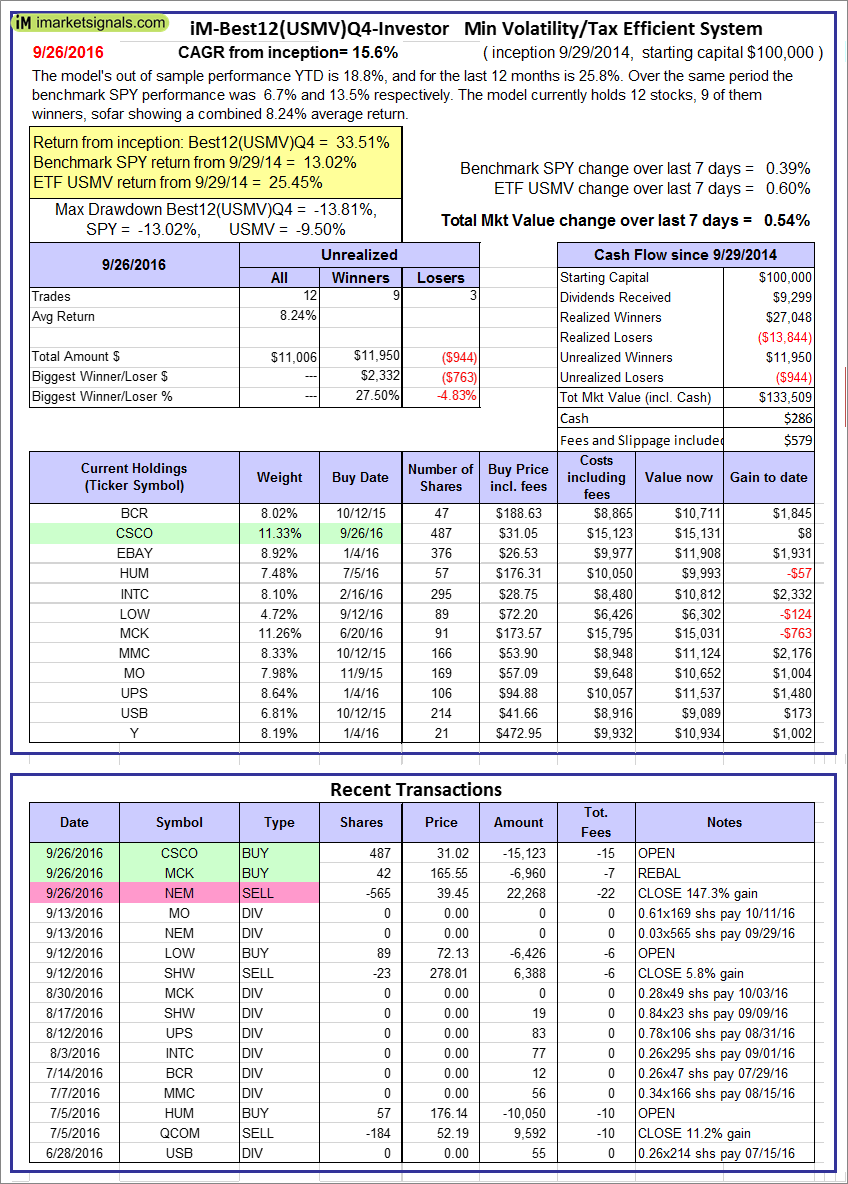 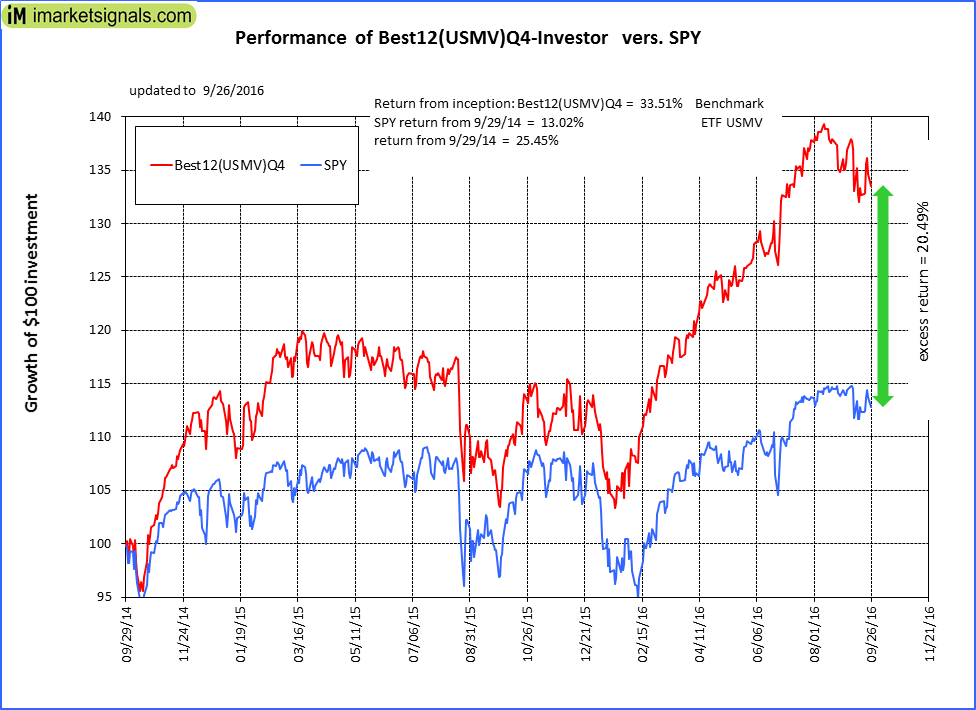 |
iM-Best12(USMV)Q4-Investor: Since inception, on 9/30/2014, the model gained 33.51% while the benchmark SPY gained 13.02% and the ETF USMV gained 25.45% over the same period. Over the previous week the market value of iM-Best12(USMV)Q4 gained 0.54% at a time when SPY gained 0.39%. A starting capital of $100,000 at inception on 9/30/2014 would have grown to $133,509 which includes $286 cash and excludes $579 spent on fees and slippage. |
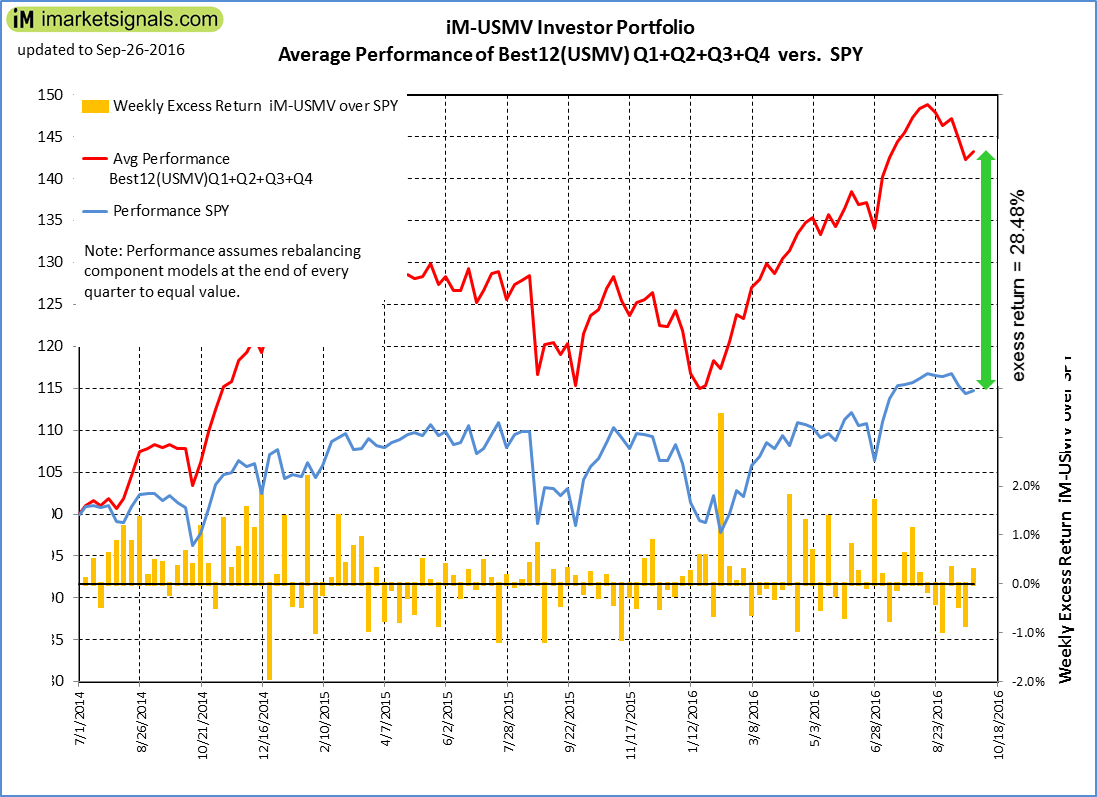 |
Average Performance of iM-Best12(USMV)Q1+Q2+Q3+Q4-Investor resulted in an excess return of 28.48% over SPY. (see iM-USMV Investor Portfolio) |
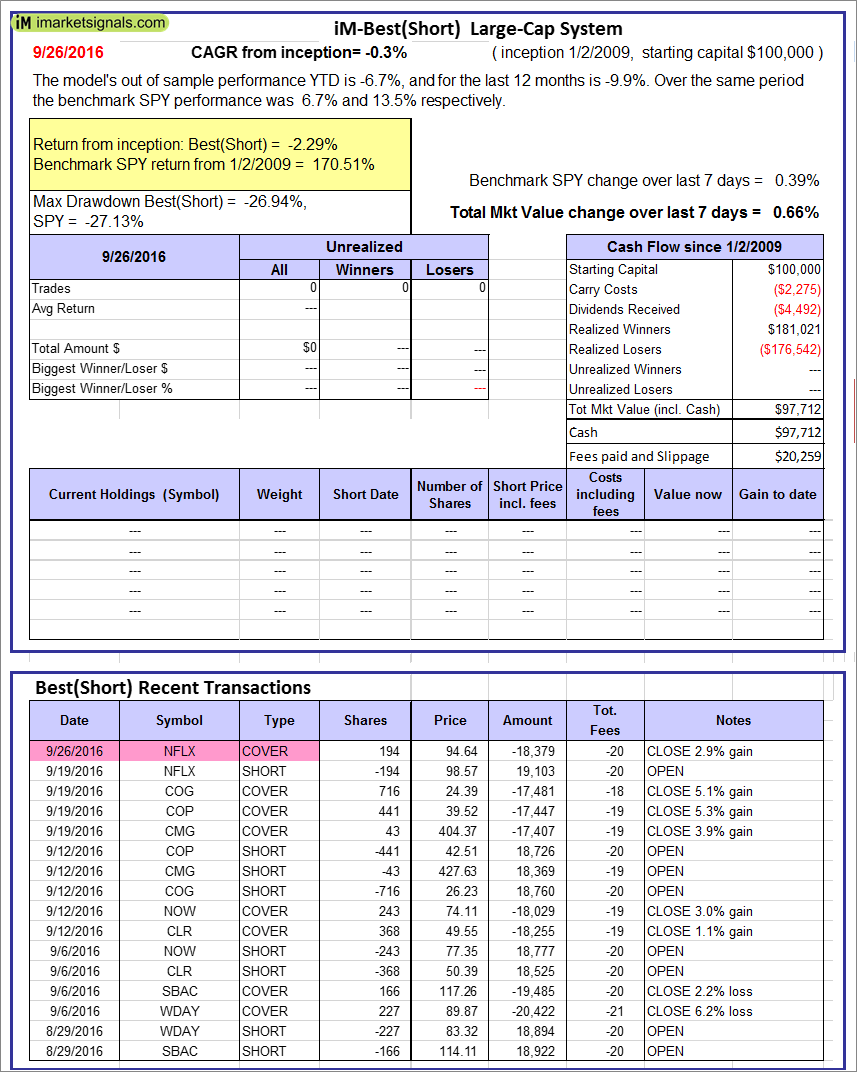 |
iM-Best(Short): The model’s out of sample performance YTD is -6.7%, and for the last 12 months is -9.9%. Over the same period the benchmark SPY performance was 6.7% and 13.5% respectively. Over the previous week the market value of iM-Best(Short) gained 0.66% at a time when SPY gained 0.39%. Over the period 1/2/2009 to 9/26/2016 the starting capital of $100,000 would have grown to $97,712 which includes $97,712 cash and excludes $20,259 spent on fees and slippage. |
iM-Best Reports – 9/26/2016
Posted in pmp SPY-SH
Leave a Reply
You must be logged in to post a comment.