  |
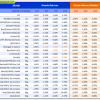
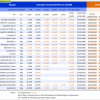
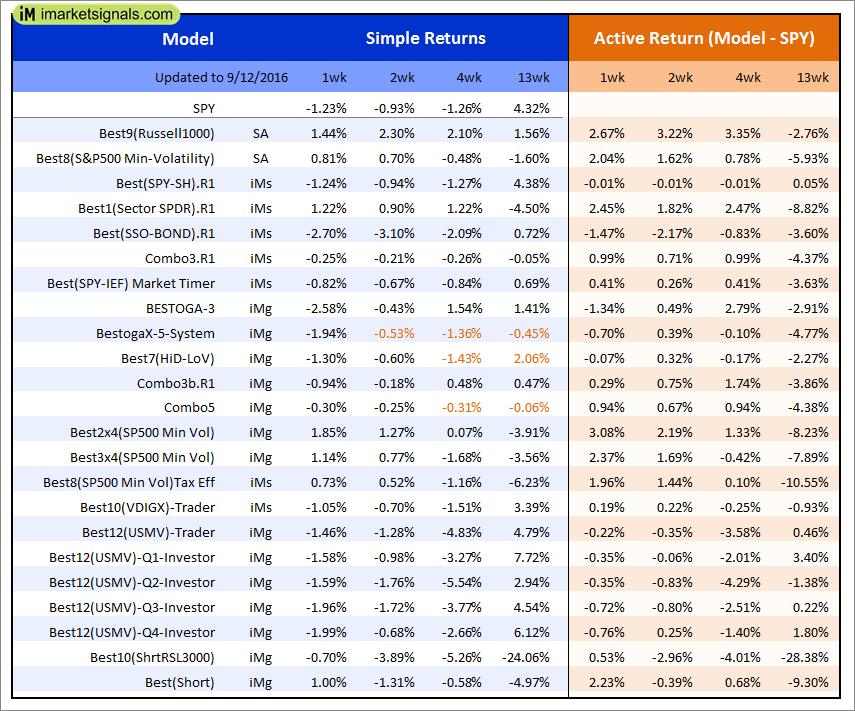
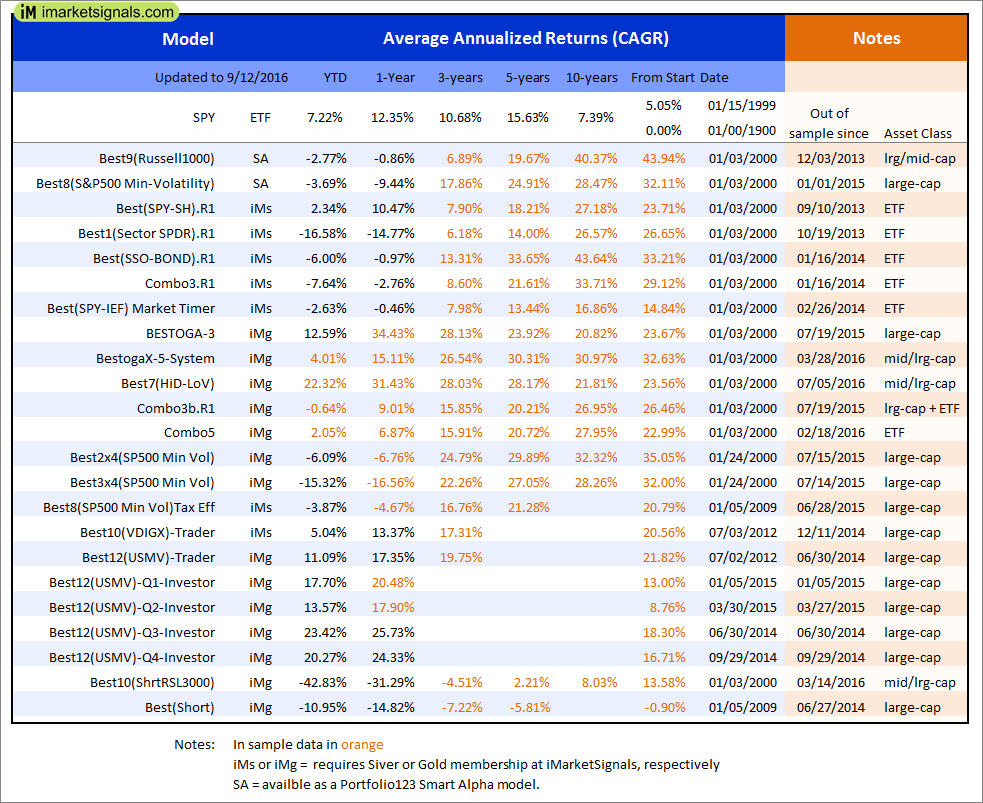
Out of sample performance summary of our models for the past 1, 2, 4 and 13 week periods. The active active return indicates how the models over- or underperformed the benchmark ETF SPY. Also the YTD, and the 1-, 3-, 5- and 10-year annualized returns are shown in the second table |
|
|
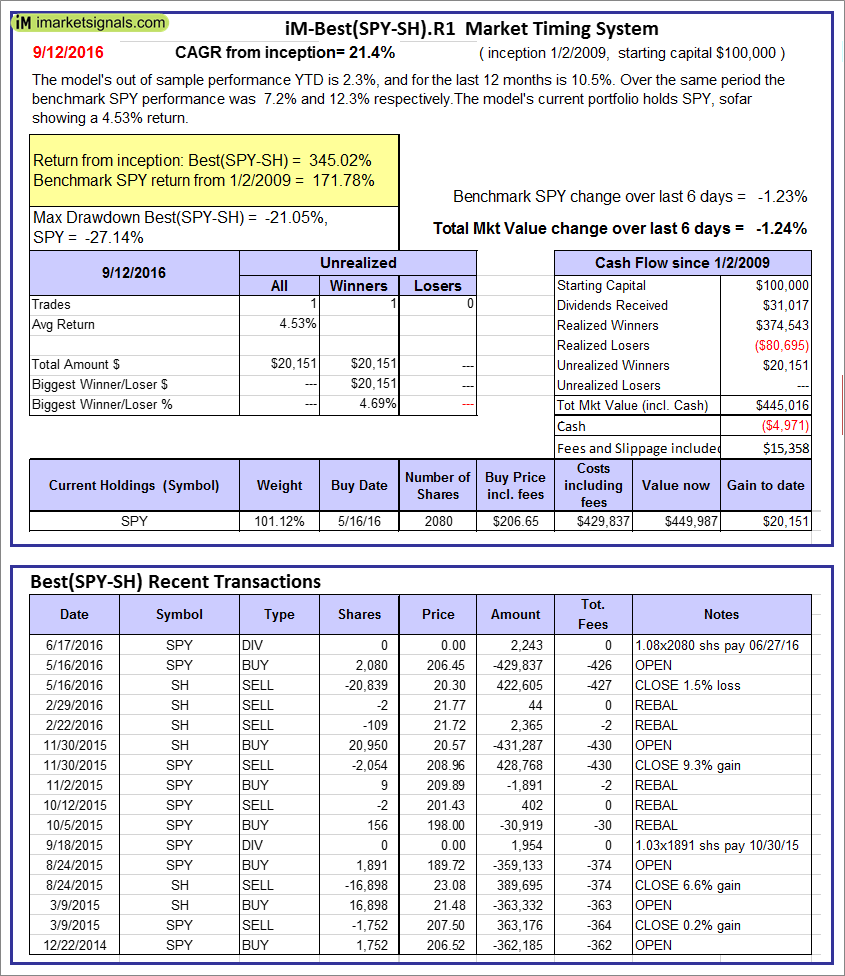
iM-Best(SPY-SH).R1: The model’s out of sample performance YTD is 2.3%, and for the last 12 months is 10.5%. Over the same period the benchmark SPY performance was 7.2% and 12.3% respectively. Over the previous week the market value of Best(SPY-SH) gained -1.24% at a time when SPY gained -1.23%. A starting capital of $100,000 at inception on 1/2/2009 would have grown to $445,016 which includes -$4,971 cash and excludes $15,358 spent on fees and slippage. |
|
|
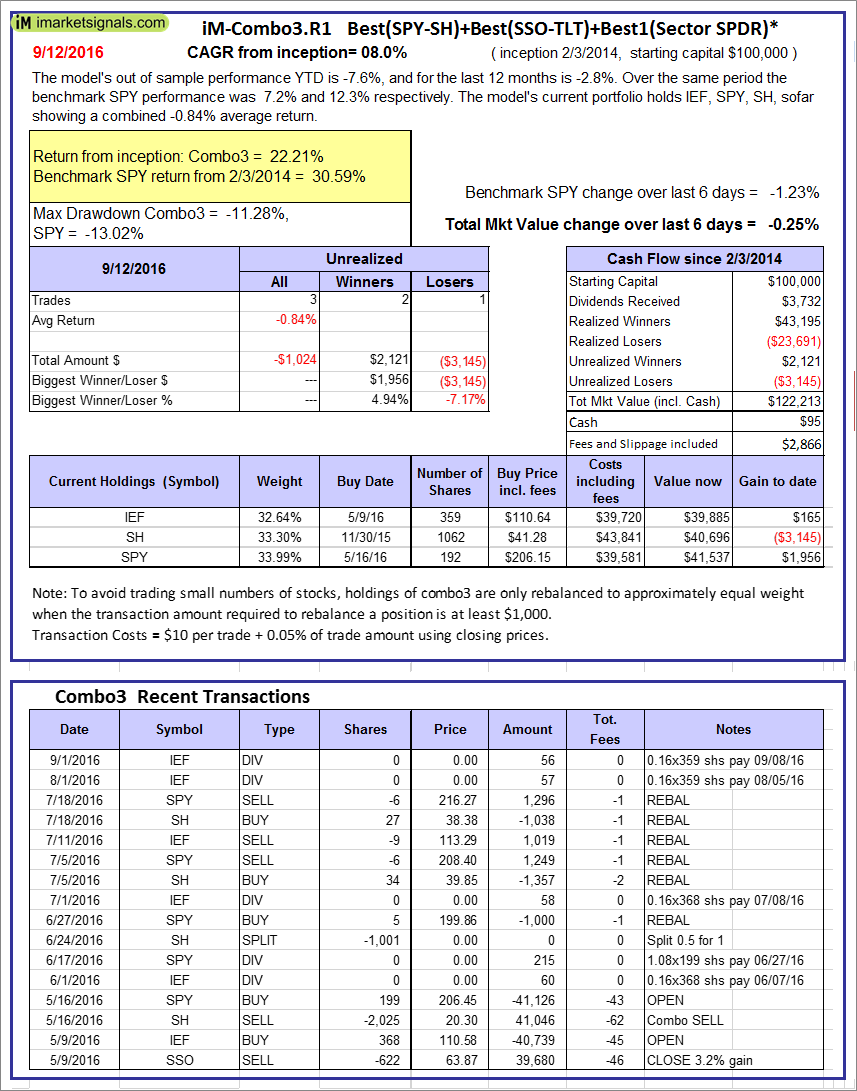
iM-Combo3.R1: The model’s out of sample performance YTD is -7.6%, and for the last 12 months is -2.8%. Over the same period the benchmark SPY performance was 7.2% and 12.3% respectively. Over the previous week the market value of iM-Combo3.R1 gained -0.25% at a time when SPY gained -1.23%. A starting capital of $100,000 at inception on 2/3/2014 would have grown to $122,213 which includes $95 cash and excludes $2,866 spent on fees and slippage. |
|
|
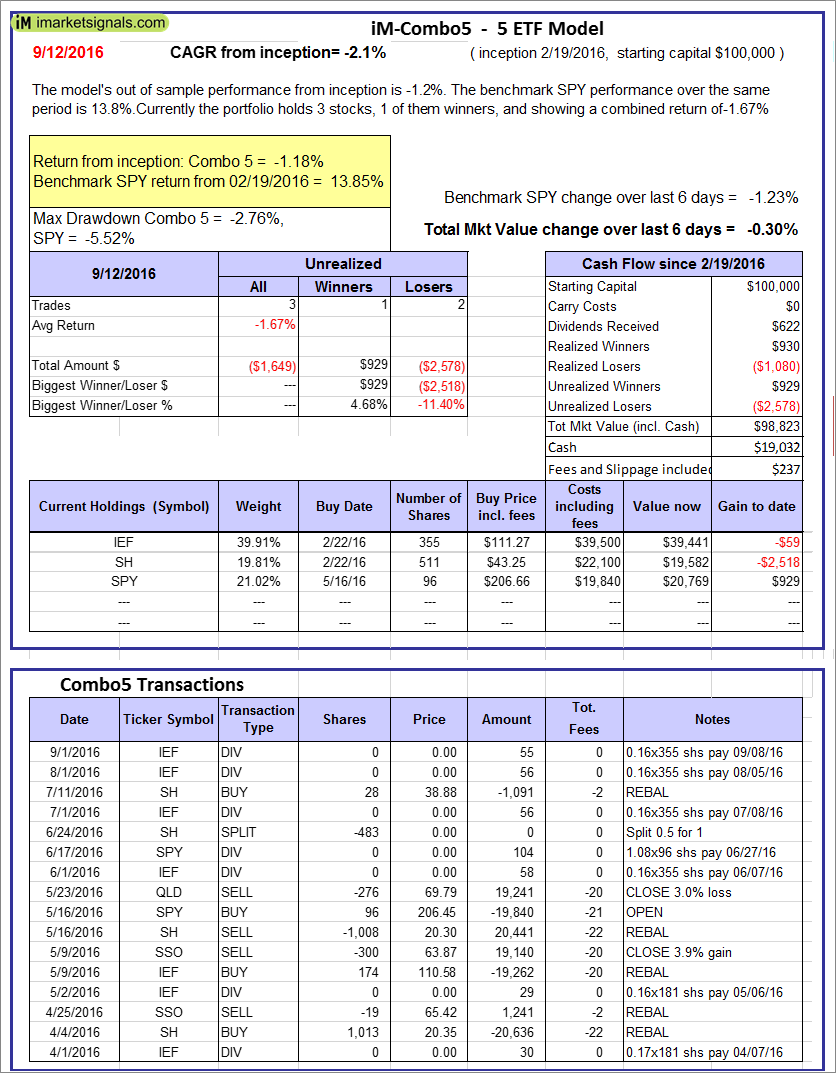
iM-Combo5: The model’s out of sample performance from inception is -1.2%. The benchmark SPY performance over the same period is 13.8%. Over the previous week the market value of iM-Combo5 gained -0.30% at a time when SPY gained -1.23%. A starting capital of $100,000 at inception on 2/22/2016 would have grown to $98,823 which includes $19,032 cash and excludes $237 spent on fees and slippage. |
|
|
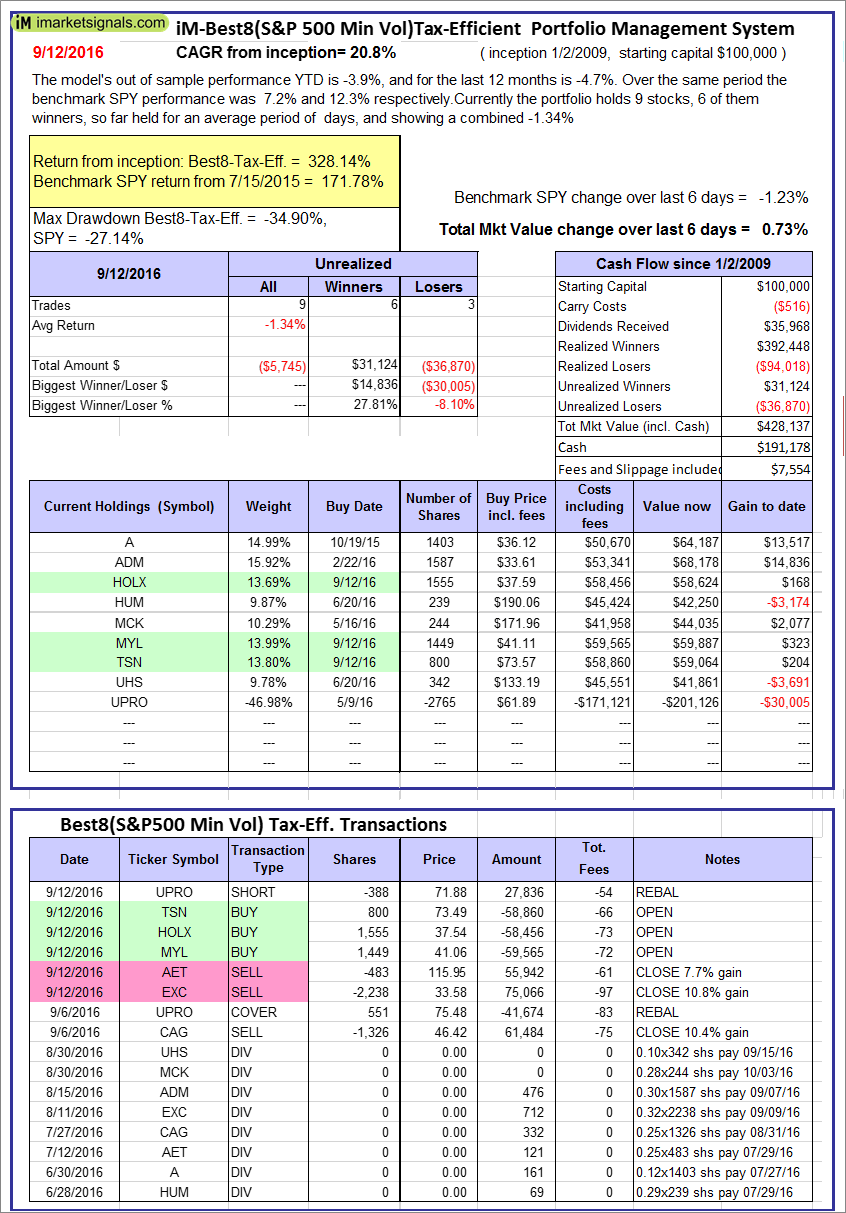
The iM-Best8(S&P500 Min Vol)Tax-Efficient The model’s out of sample performance YTD is -3.9%, and for the last 12 months is -4.7%. Over the same period the benchmark SPY performance was 7.2% and 12.3% respectively. Over the previous week the market value of iM-Best8(S&P 500)Tax-Eff. gained 0.73% at a time when SPY gained -1.23%. A starting capital of $100,000 at inception on 1/2/2009 would have grown to $428,137 which includes $191,178 cash and excludes $7,554 spent on fees and slippage. |
|
|
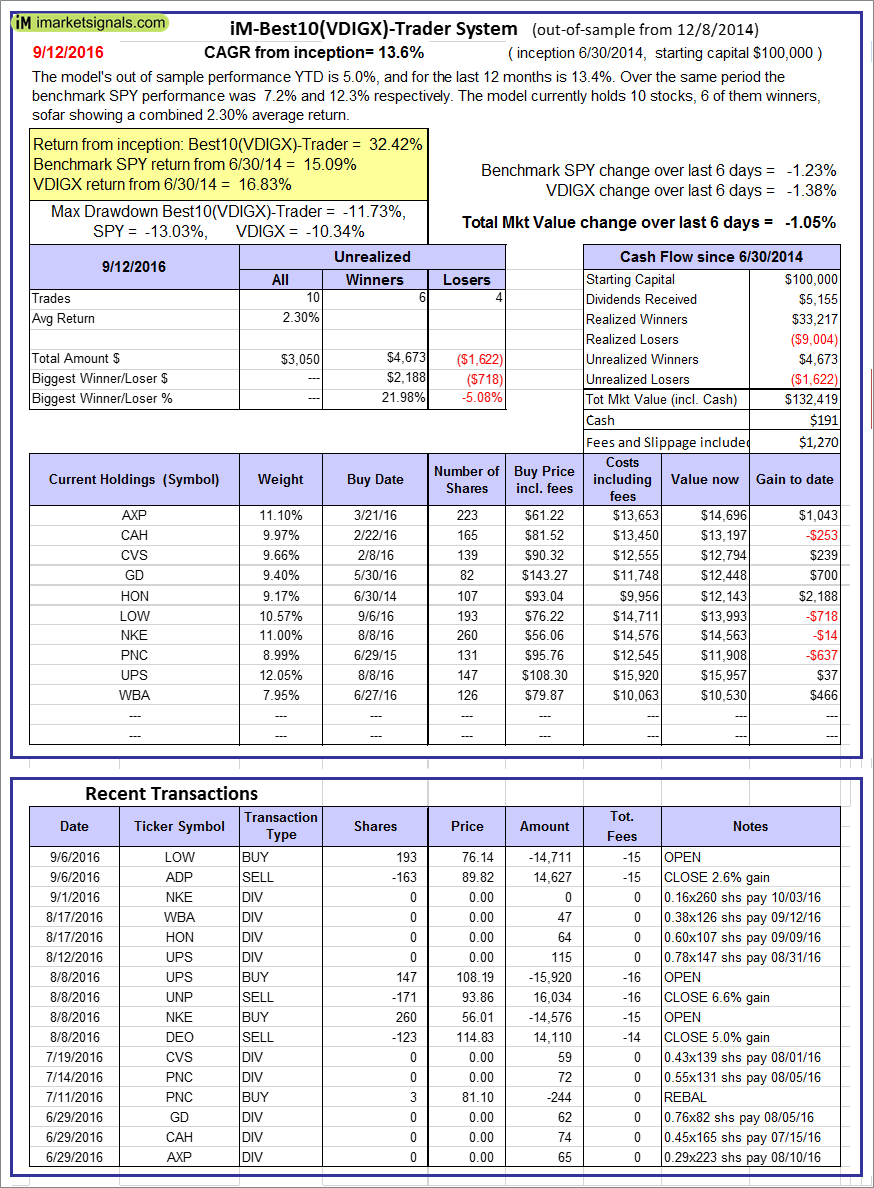
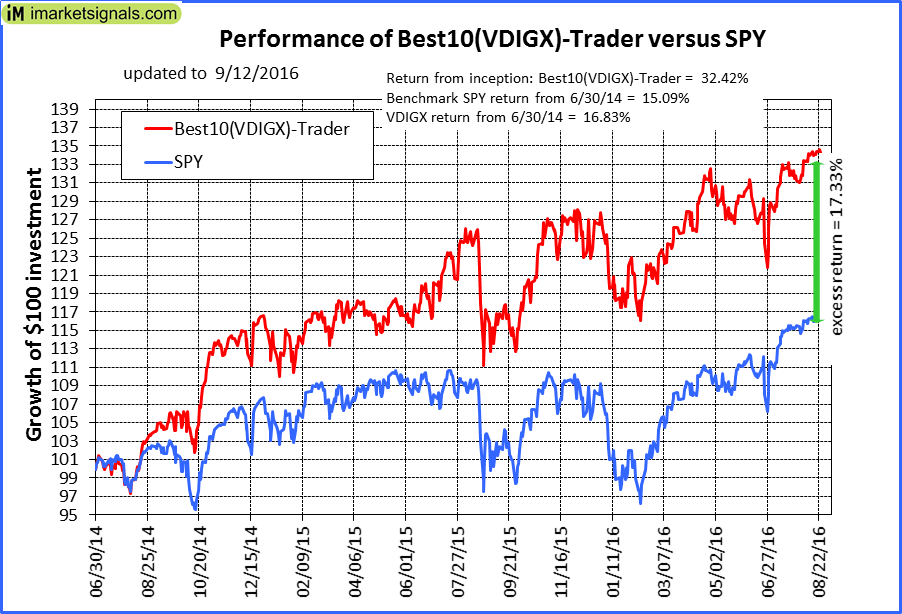
iM-Best10(VDIGX)-Trader: The model’s out of sample performance YTD is 5.0%, and for the last 12 months is 13.4%. Over the same period the benchmark SPY performance was 7.2% and 12.3% respectively. Since inception, on 7/1/2014, the model gained 32.42% while the benchmark SPY gained 15.09% and the ETF VDIGX gained 16.83% over the same period. Over the previous week the market value of iM-Best10(VDIGX) gained -1.05% at a time when SPY gained -1.23%. A starting capital of $100,000 at inception on 7/1/2014 would have grown to $132,419 which includes $191 cash and excludes $1,270 spent on fees and slippage. |
|
|
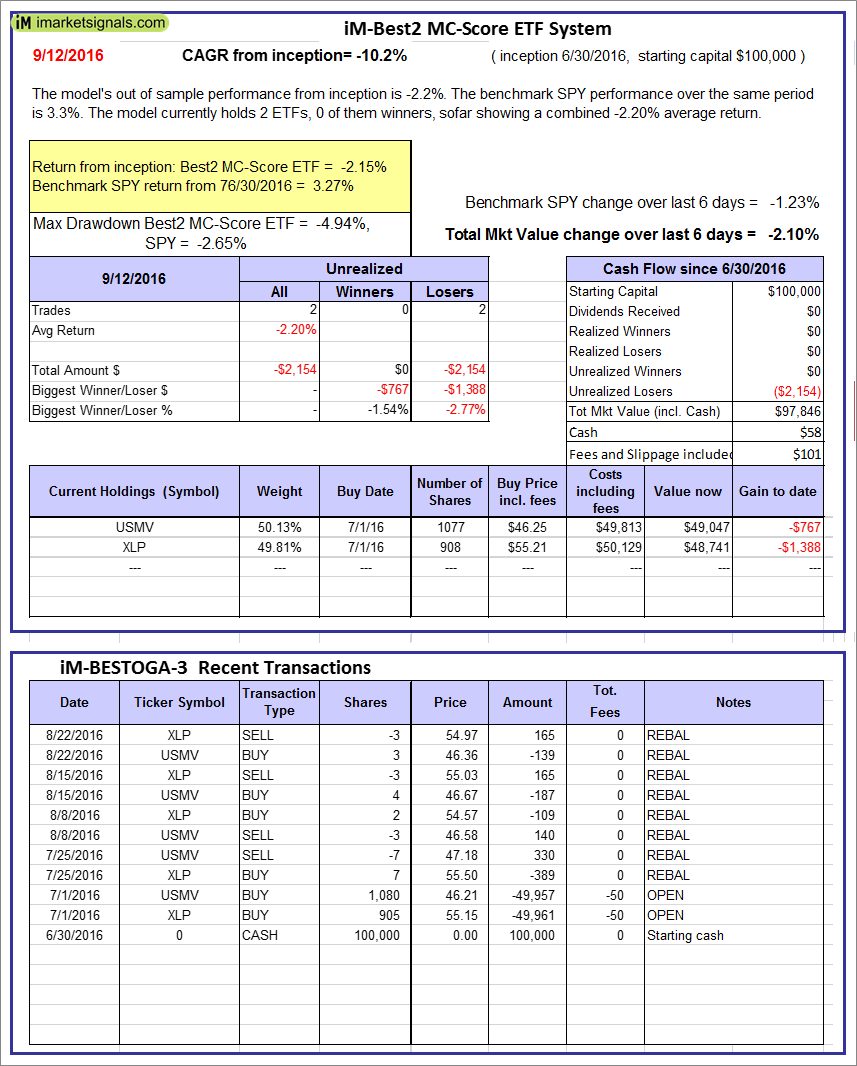
iM-Best2 MC-Score ETF System: The model’s out of sample performance from inception is -2.2%. The benchmark SPY performance over the same period is 3.3%. Over the previous week the market value of iM-BESTOGA-3 gained -2.10% at a time when SPY gained -1.23%. A starting capital of $100,000 at inception on 2/3/2014 would have grown to $58 which includes $101 cash and excludes Gain to date spent on fees and slippage. |
|
|
iM-BESTOGA-3: The model’s out of sample performance YTD is 12.6%, and for the last 12 months is 34.4%. Over the same period the benchmark SPY performance was 7.2% and 12.3% respectively. Over the previous week the market value of iM-BESTOGA-3 gained -2.58% at a time when SPY gained -1.23%. A starting capital of $100,000 at inception on 2/3/2014 would have grown to $206,880 which includes $18,677 cash and excludes $767 spent on fees and slippage. |
|
|
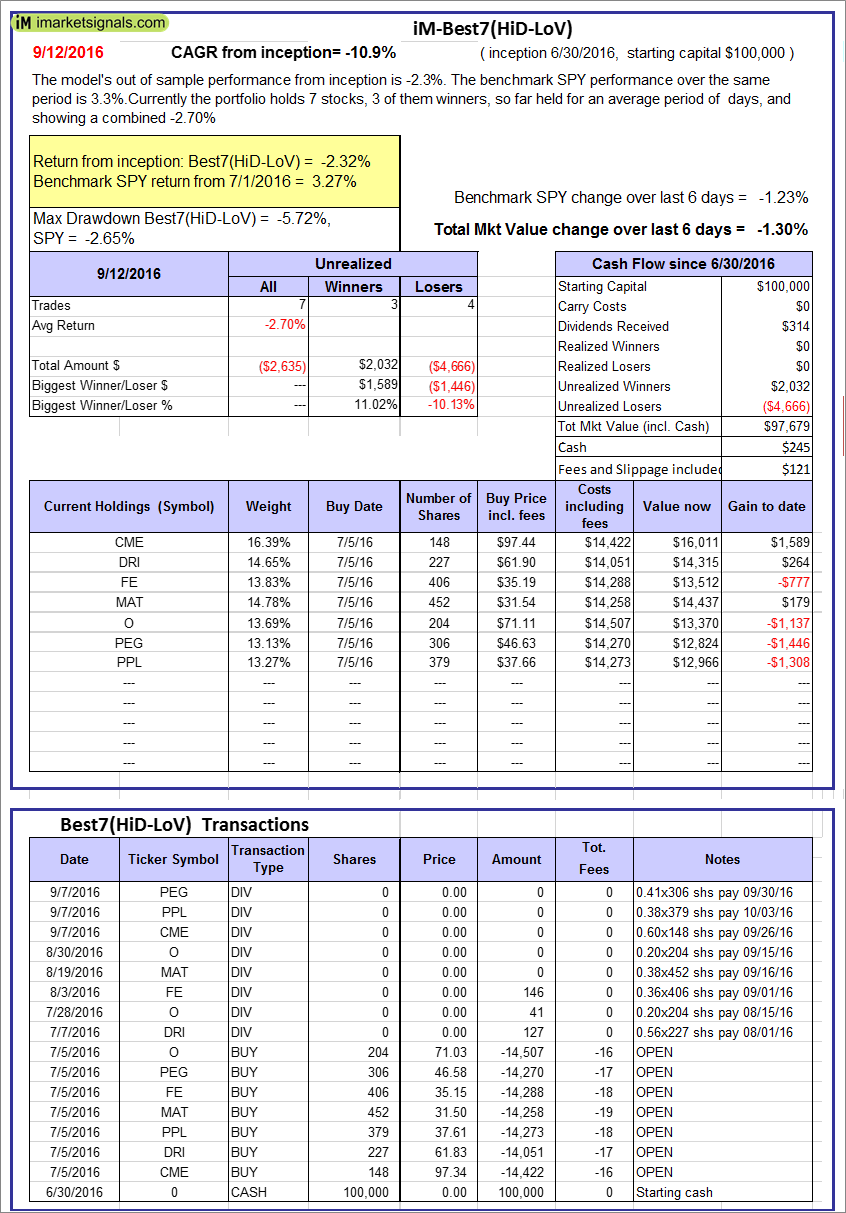
iM-Best7(HiD-LoV): The model’s out of sample performance from inception is -2.3%. The benchmark SPY performance over the same period is 3.3%. Over the previous week the market value of iM-BESTOGA-3 gained -1.30% at a time when SPY gained -1.23%. A starting capital of $100,000 at inception on 2/3/2014 would have grown to $97,679 which includes $245 cash and excludes $121 spent on fees and slippage. |
|
|
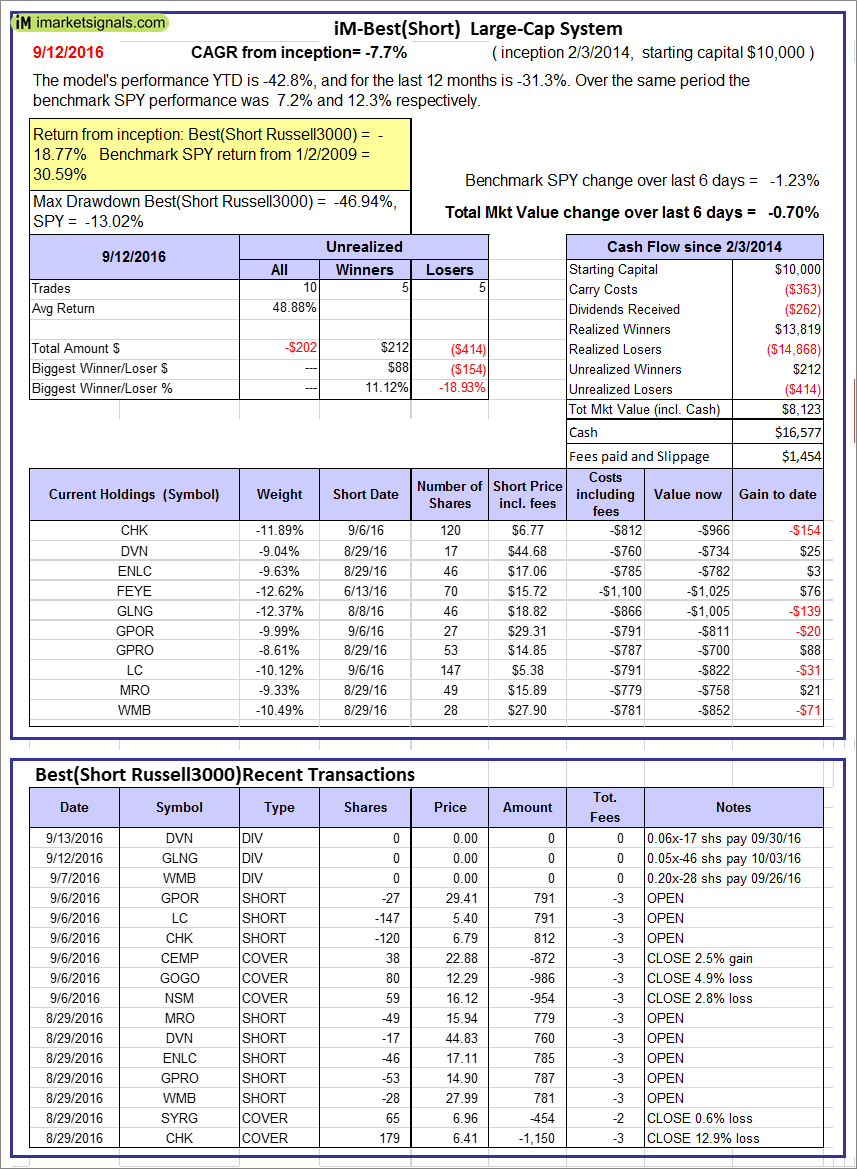
iM-Best10(Short Russell3000): The model’s performance YTD is -42.8%, and for the last 12 months is -31.3%. Over the same period the benchmark SPY performance was 7.2% and 12.3% respectively. Over the previous week the market value of iM-Best10(Short Russell3000) gained -0.70% at a time when SPY gained -1.23%. Over the period 2/3/2014 to 9/12/2016 the starting capital of $100,000 would have grown to $8,123 which includes $16,577 cash and excludes $1,454 spent on fees and slippage. |
|
|
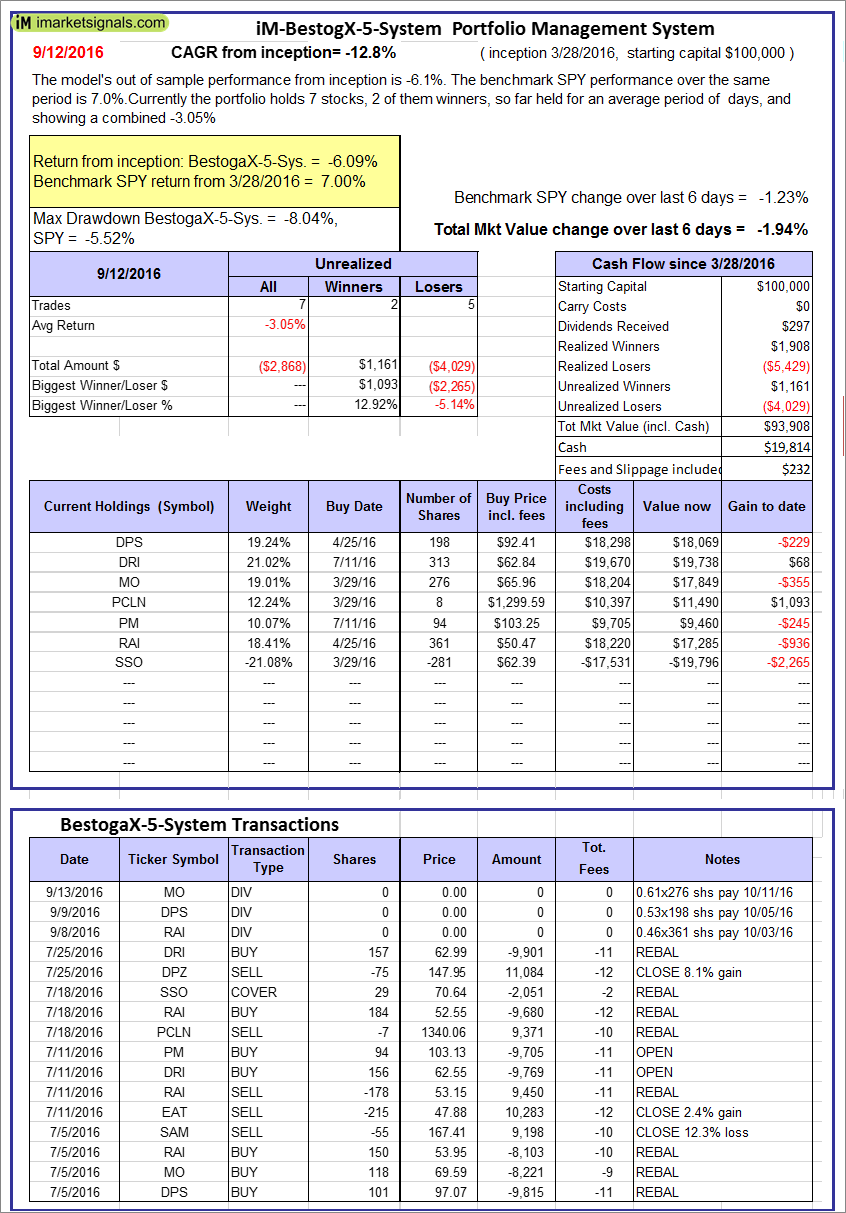
iM-BestogaX5-System: The model’s out of sample performance from inception is -6.1%. The benchmark SPY performance over the same period is 7.0%. Over the previous week the market value of iM-Best8(S&P 500)Tax-Eff. gained -1.94% at a time when SPY gained -1.23%. A starting capital of $100,000 at inception on 1/2/2009 would have grown to $93,908 which includes $19,814 cash and excludes $232 spent on fees and slippage. |
|
|
iM-Best3x4(S&P 500 Min Vol): The model’s out of sample performance YTD is -15.3%, and for the last 12 months is -16.6%. Over the same period the benchmark SPY performance was 7.2% and 12.3% respectively. Over the previous week the market value of iM-Best3x4 gained 1.14% at a time when SPY gained -1.23%. A starting capital of $100,000 at inception on 7/15/2015 would have grown to $87,008 which includes $1,100 cash and excludes $1,560 spent on fees and slippage. |
|
|
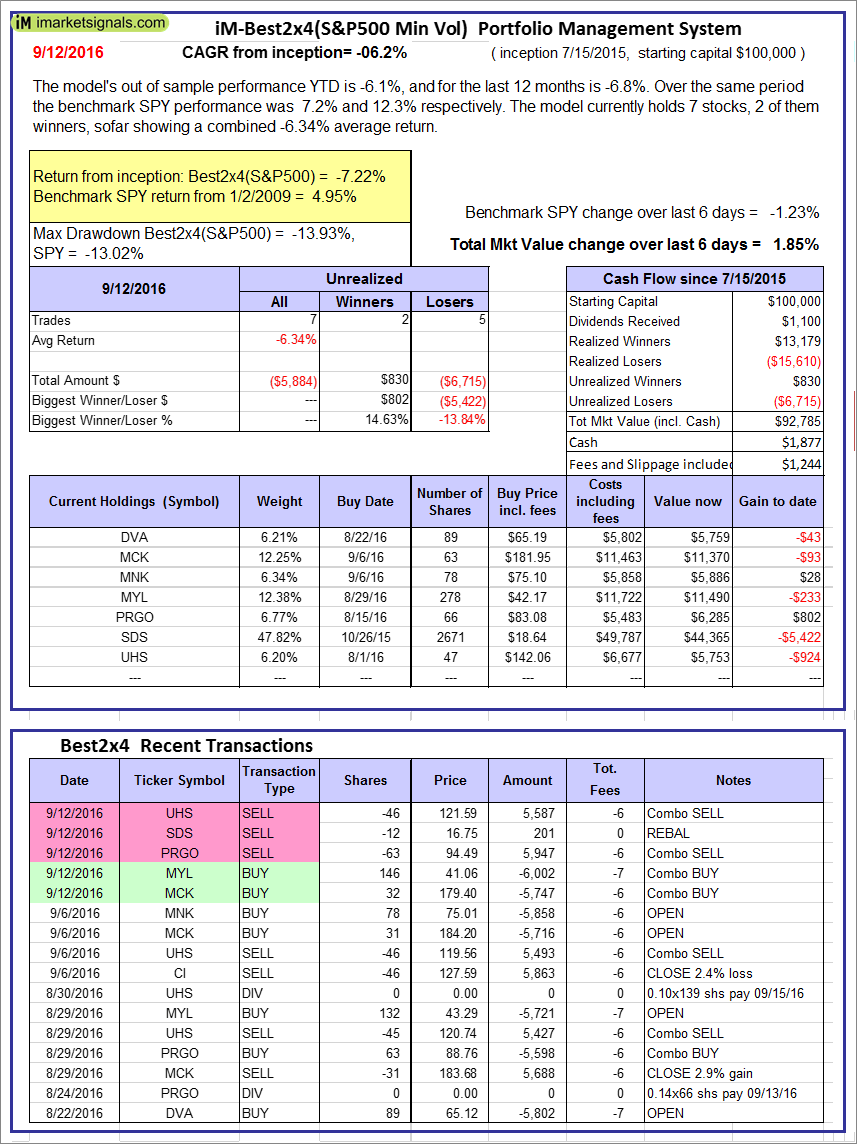
iM-Best2x4(S&P 500 Min Vol): The model’s out of sample performance YTD is -6.1%, and for the last 12 months is -6.8%. Over the same period the benchmark SPY performance was 7.2% and 12.3% respectively. Over the previous week the market value of iM-Best2x4 gained 1.85% at a time when SPY gained -1.23%. A starting capital of $100,000 at inception on 7/16/2015 would have grown to $92,785 which includes $1,877 cash and excludes $1,244 spent on fees and slippage. |
|
|
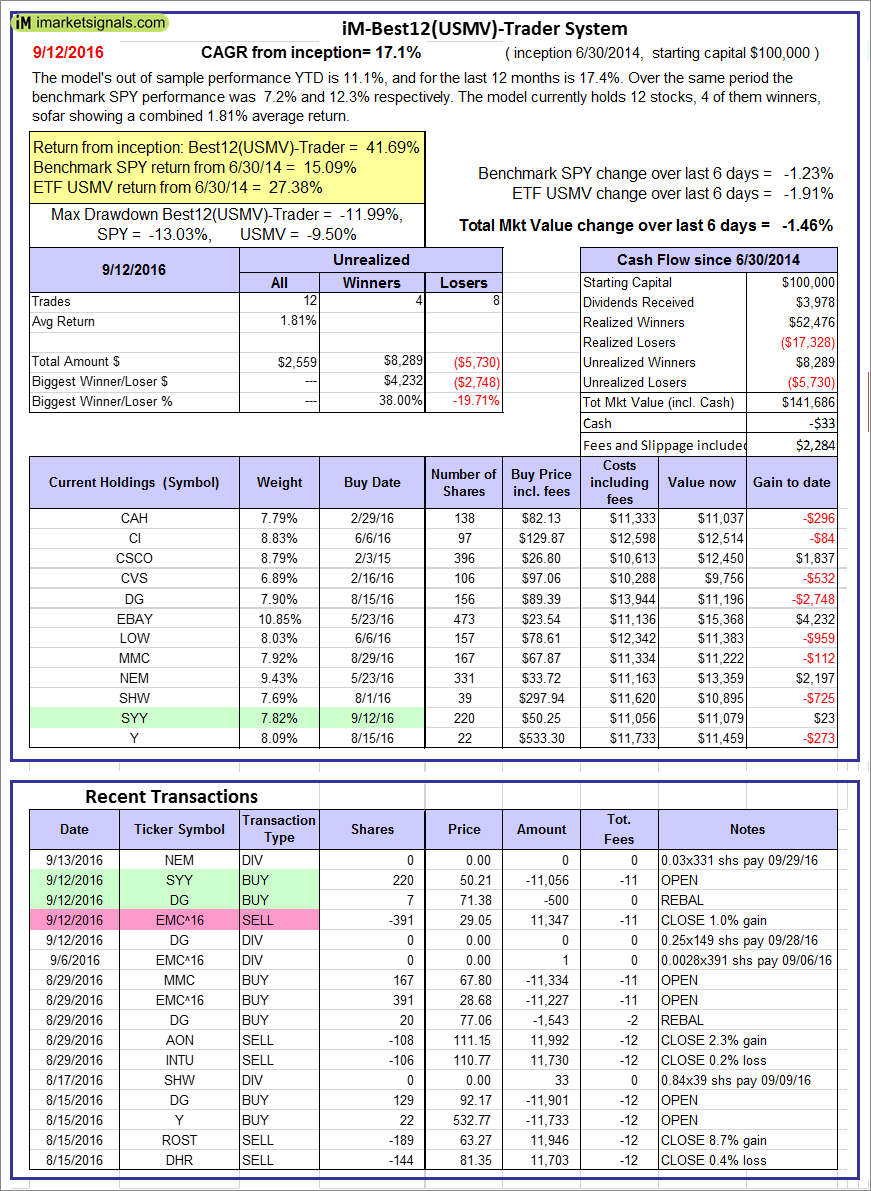
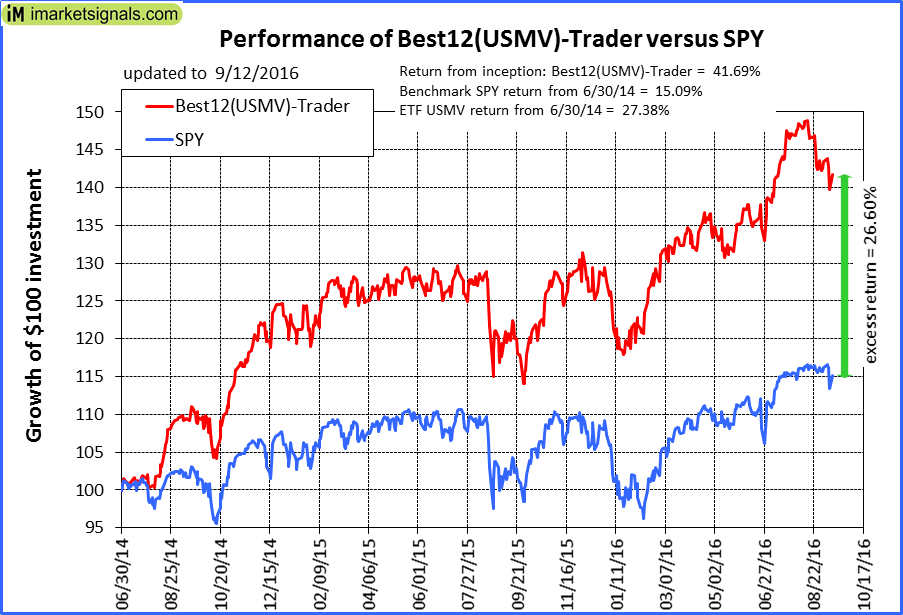
iM-Best12(USMV)-Trader: The model’s out of sample performance YTD is 11.1%, and for the last 12 months is 17.4%. Over the same period the benchmark SPY performance was 7.2% and 12.3% respectively. Since inception, on 7/1/2014, the model gained 41.69% while the benchmark SPY gained 15.09% and the ETF USMV gained 27.38% over the same period. Over the previous week the market value of iM-Best12(USMV)-Trader gained -1.46% at a time when SPY gained -1.23%. A starting capital of $100,000 at inception on 7/1/2014 would have grown to $141,686 which includes -$33 cash and excludes $2,284 spent on fees and slippage. |
|
|
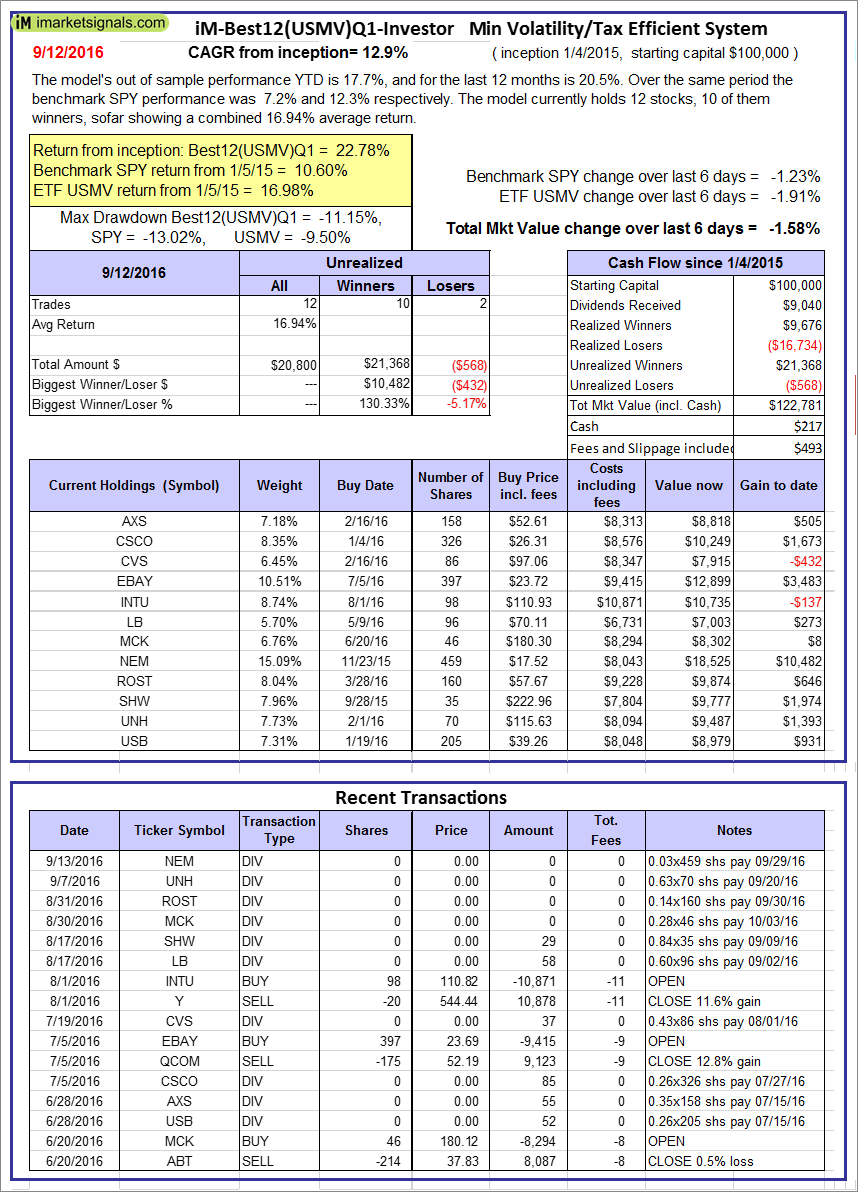
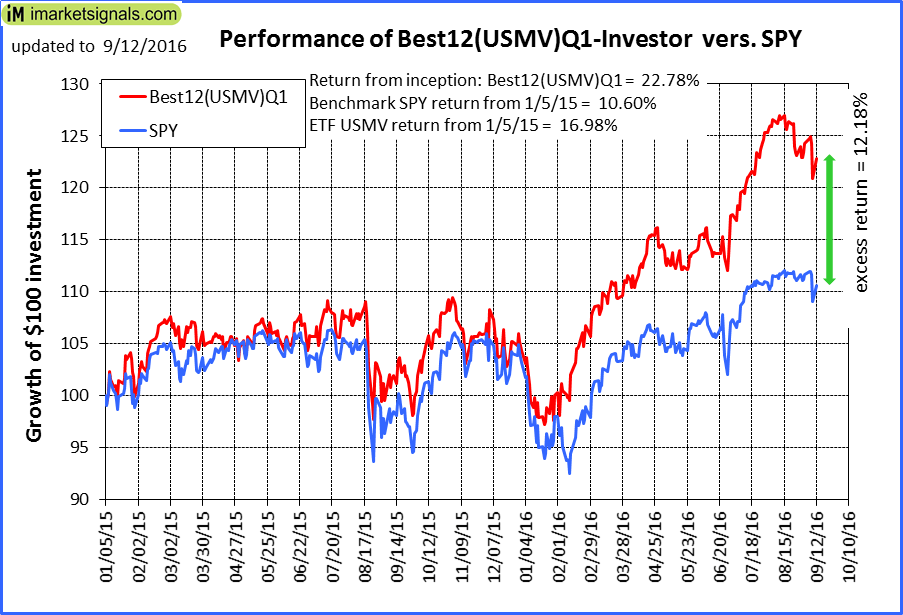
iM-Best12(USMV)Q1-Investor: The model’s out of sample performance YTD is 17.7%, and for the last 12 months is 20.5%. Over the same period the benchmark SPY performance was 7.2% and 12.3% respectively. Since inception, on 1/5/2015, the model gained 22.78% while the benchmark SPY gained 10.60% and the ETF USMV gained 16.98% over the same period. Over the previous week the market value of iM-Best12(USMV)Q1 gained -1.58% at a time when SPY gained -1.23%. A starting capital of $100,000 at inception on 1/5/2015 would have grown to $122,781 which includes $217 cash and excludes $493 spent on fees and slippage. |
|
|
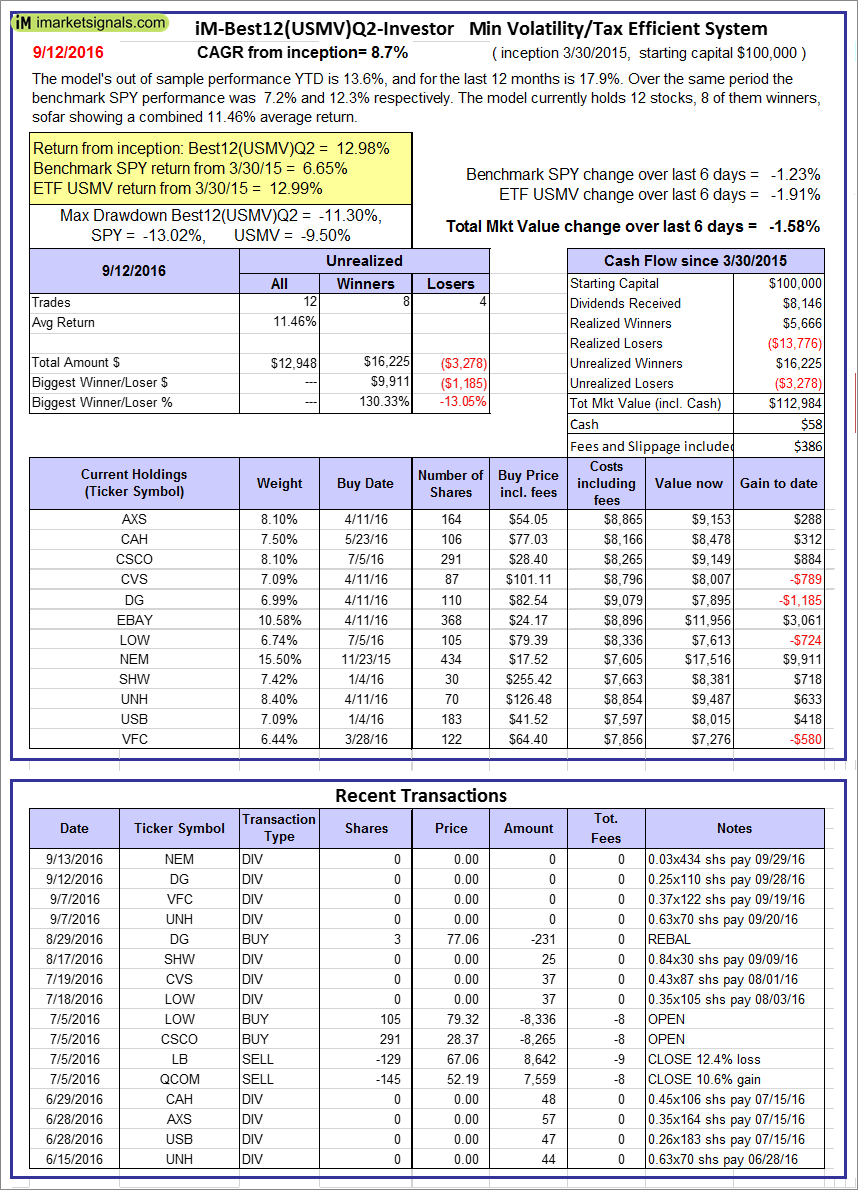
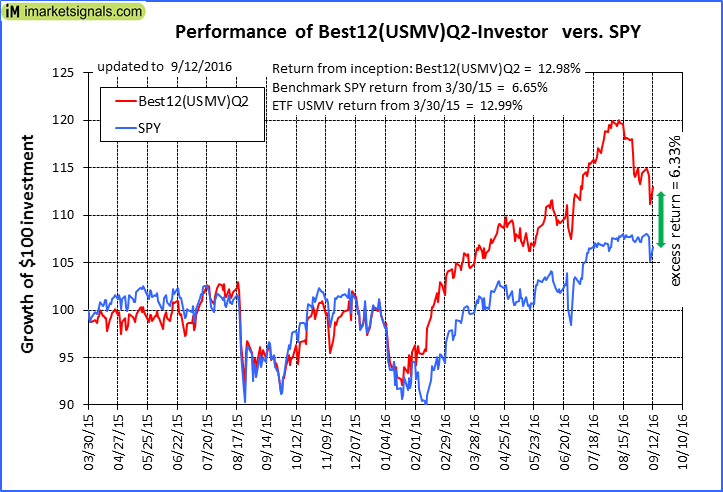
iM-Best12(USMV)Q2-Investor: The model’s out of sample performance YTD is 13.6%, and for the last 12 months is 17.9%. Over the same period the benchmark SPY performance was 7.2% and 12.3% respectively. Since inception, on 3/31/2015, the model gained 12.98% while the benchmark SPY gained 6.65% and the ETF USMV gained 12.99% over the same period. Over the previous week the market value of iM-Best12(USMV)Q2 gained -1.58% at a time when SPY gained -1.23%. A starting capital of $100,000 at inception on 3/31/2015 would have grown to $112,984 which includes $58 cash and excludes $386 spent on fees and slippage. |
|
|
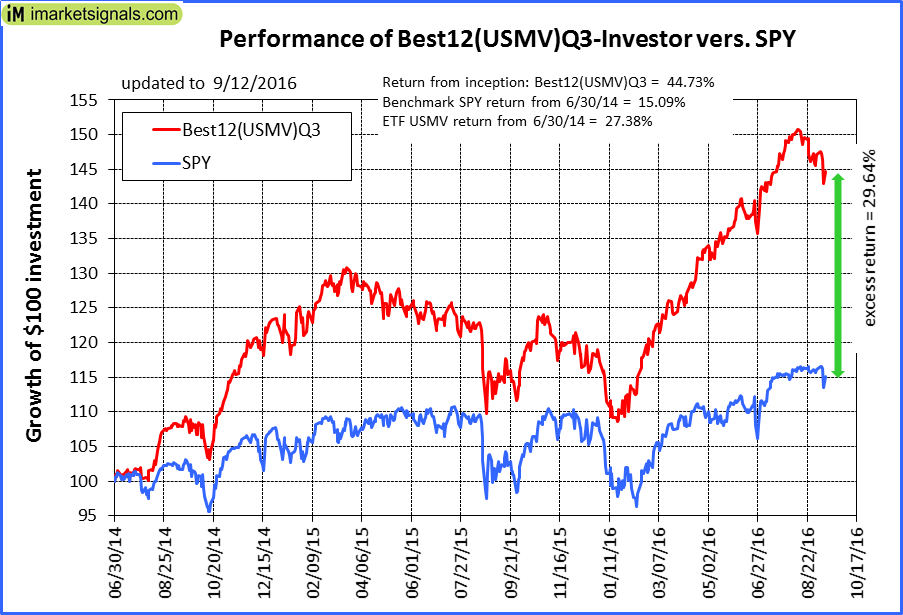
iM-Best12(USMV)Q3-Investor: The model’s out of sample performance YTD is 23.4%, and for the last 12 months is 25.7%. Over the same period the benchmark SPY performance was 7.2% and 12.3% respectively. Since inception, on 7/1/2014, the model gained 44.73% while the benchmark SPY gained 15.09% and the ETF USMV gained 27.38% over the same period. Over the previous week the market value of iM-Best12(USMV)Q3 gained -1.96% at a time when SPY gained -1.23%. A starting capital of $100,000 at inception on 7/1/2014 would have grown to $144,731 which includes -$126 cash and excludes $725 spent on fees and slippage. |
|
|
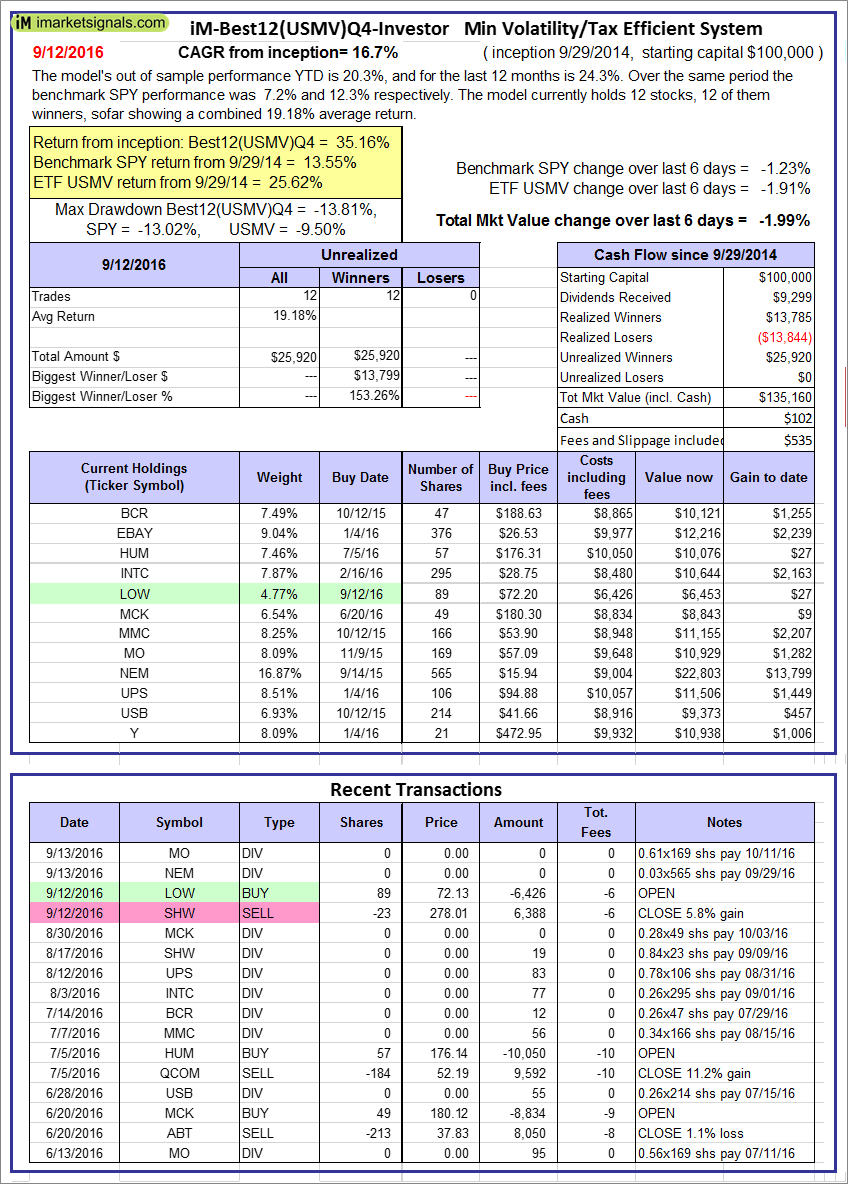
iM-Best12(USMV)Q4-Investor: Since inception, on 9/30/2014, the model gained 35.16% while the benchmark SPY gained 13.55% and the ETF USMV gained 25.62% over the same period. Over the previous week the market value of iM-Best12(USMV)Q4 gained -1.99% at a time when SPY gained -1.23%. A starting capital of $100,000 at inception on 9/30/2014 would have grown to $135,160 which includes $102 cash and excludes $535 spent on fees and slippage. |
|
|
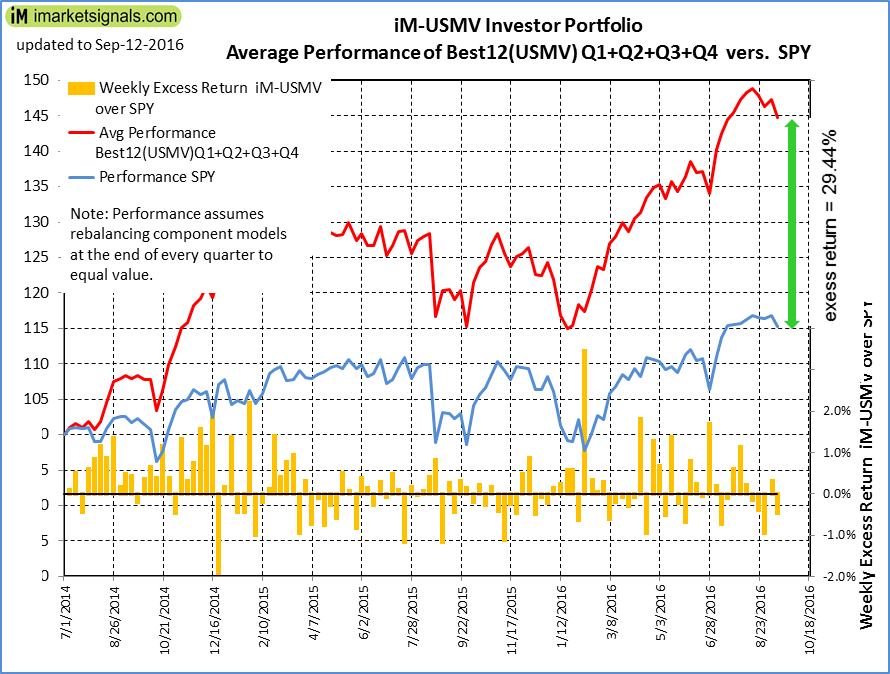
Average Performance of iM-Best12(USMV)Q1+Q2+Q3+Q4-Investor resulted in an excess return of 29.44% over SPY. (see iM-USMV Investor Portfolio) |
|
|
iM-Best(Short): The model’s out of sample performance YTD is -11.0%, and for the last 12 months is -14.8%. Over the same period the benchmark SPY performance was 7.2% and 12.3% respectively. Over the previous week the market value of iM-Best(Short) gained 0.99% at a time when SPY gained -1.23%. Over the period 1/2/2009 to 9/12/2016 the starting capital of $100,000 would have grown to $93,231 which includes $149,322 cash and excludes $20,164 spent on fees and slippage. |


Leave a Reply
You must be logged in to post a comment.