
  |
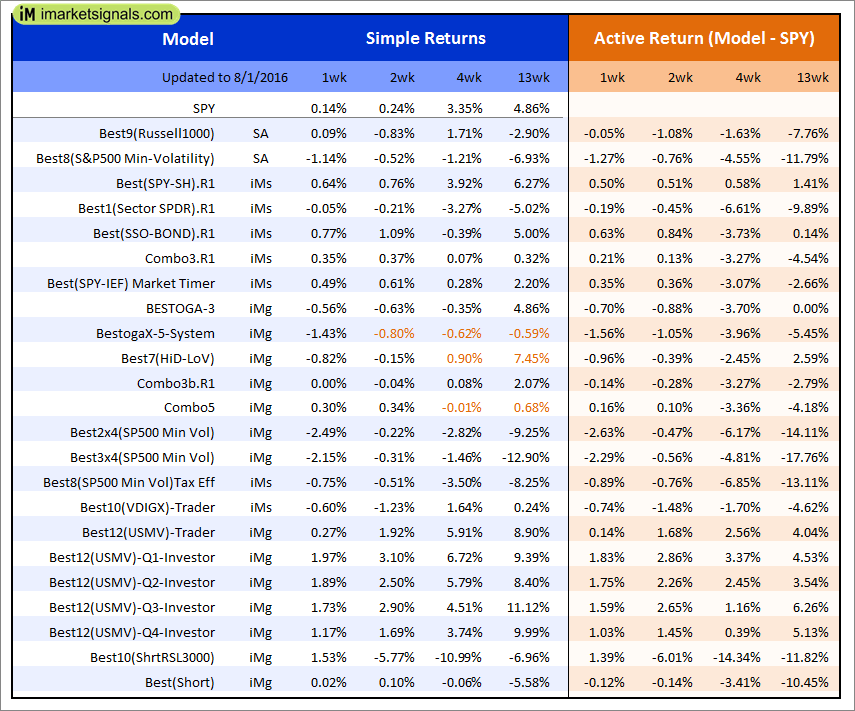
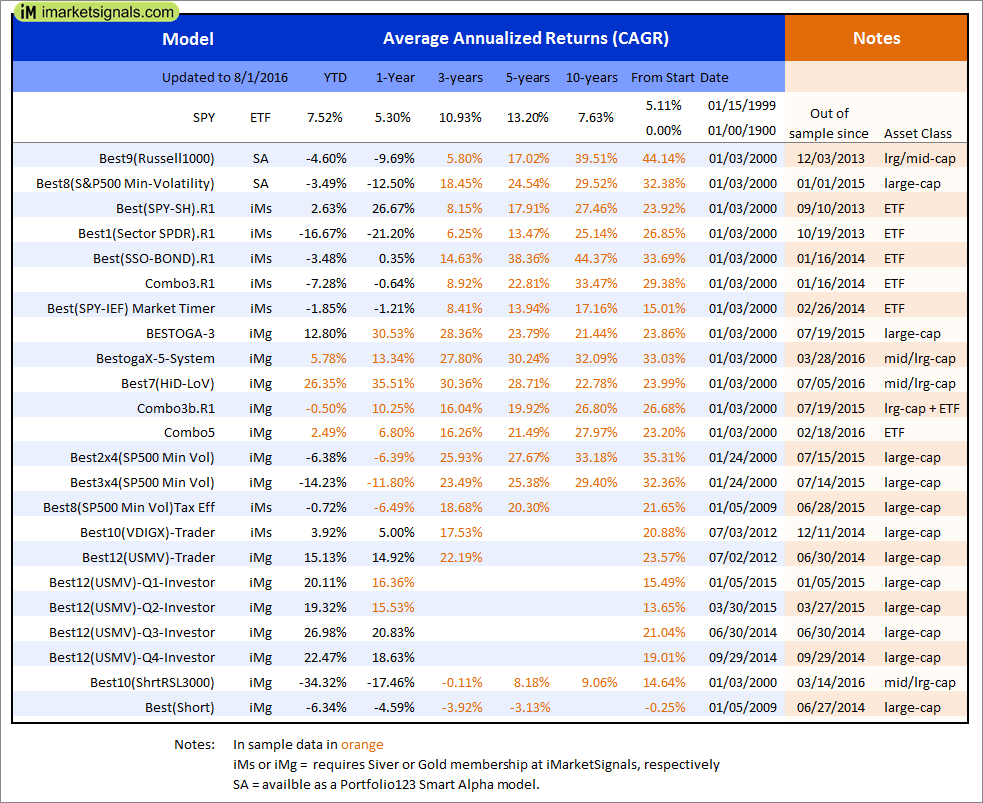
Out of sample performance summary of our models for the past 1, 2, 4 and 13 week periods. The active active return indicates how the models over- or underperformed the benchmark ETF SPY. Also the YTD, and the 1-, 3-, 5- and 10-year annualized returns are shown in the second table |
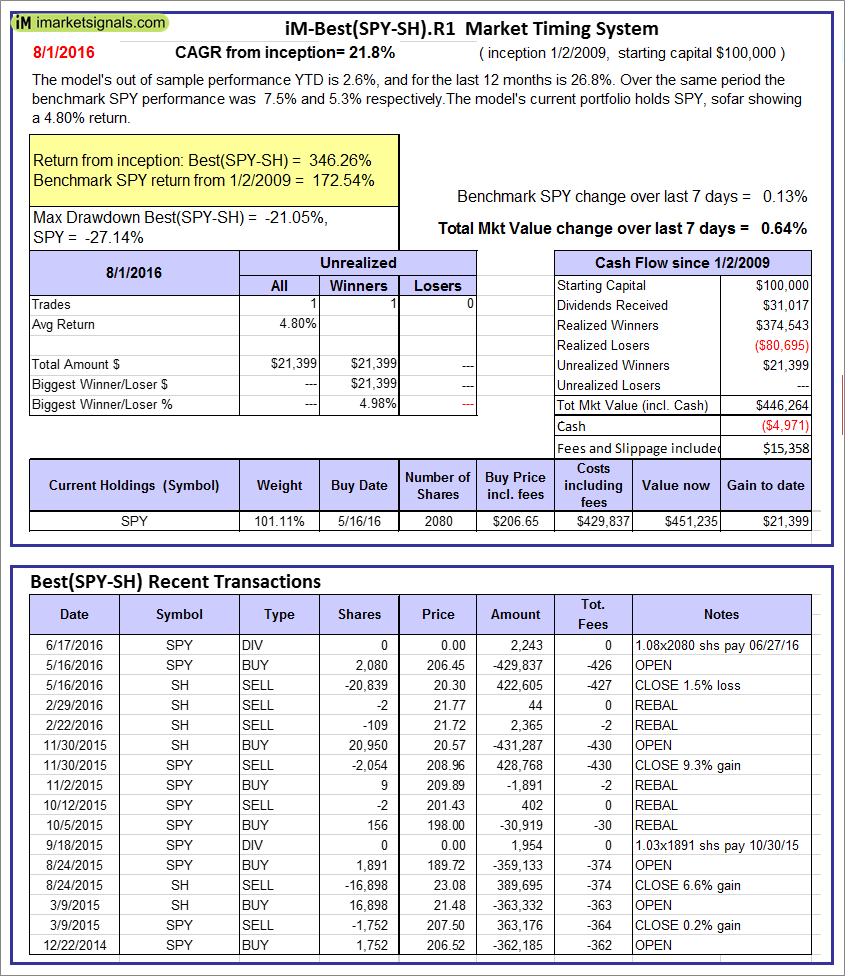 |
iM-Best(SPY-SH).R1: The model’s out of sample performance YTD is 2.6%, and for the last 12 months is 26.8%. Over the same period the benchmark SPY performance was 7.5% and 5.3% respectively. Over the previous week the market value of Best(SPY-SH) gained 0.64% at a time when SPY gained 0.13%. A starting capital of $100,000 at inception on 1/2/2009 would have grown to $446,264 which includes -$4,971 cash and excludes $15,358 spent on fees and slippage. |
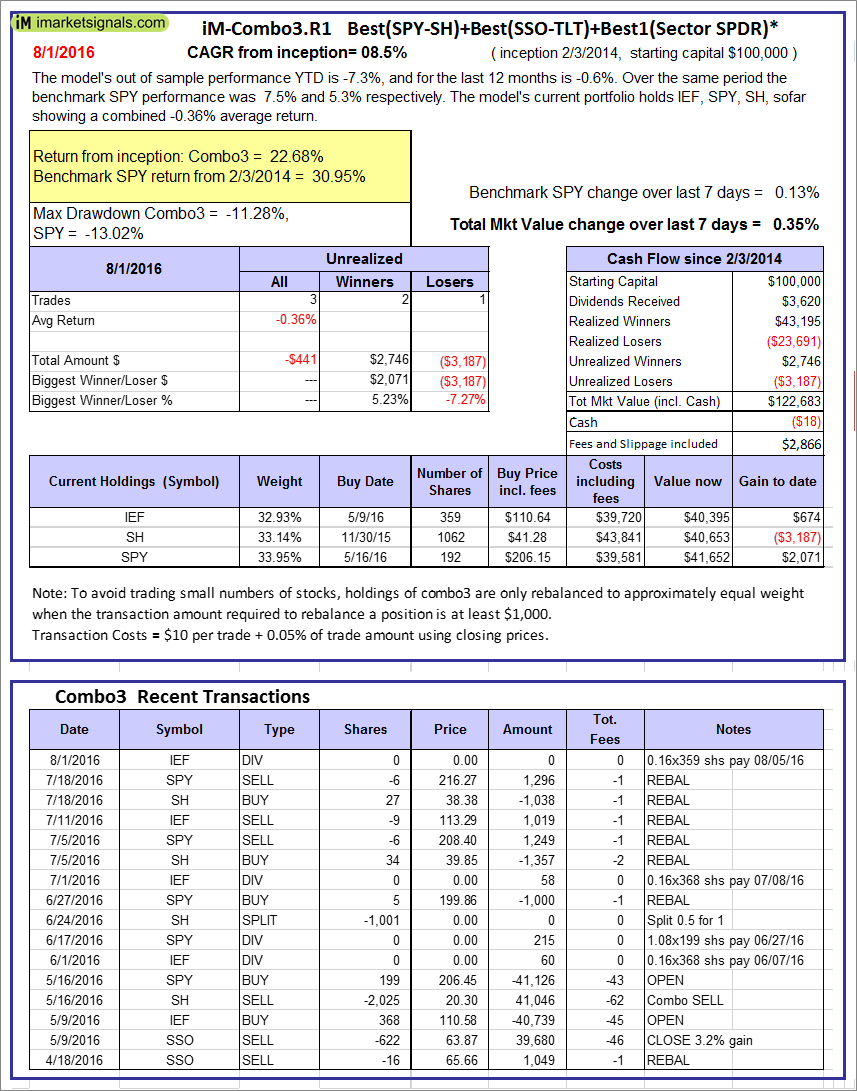 |
iM-Combo3.R1: The model’s out of sample performance YTD is -7.3%, and for the last 12 months is -0.6%. Over the same period the benchmark SPY performance was 7.5% and 5.3% respectively. Over the previous week the market value of iM-Combo3.R1 gained 0.35% at a time when SPY gained 0.13%. A starting capital of $100,000 at inception on 2/3/2014 would have grown to $122,683 which includes -$18 cash and excludes $2,866 spent on fees and slippage. |
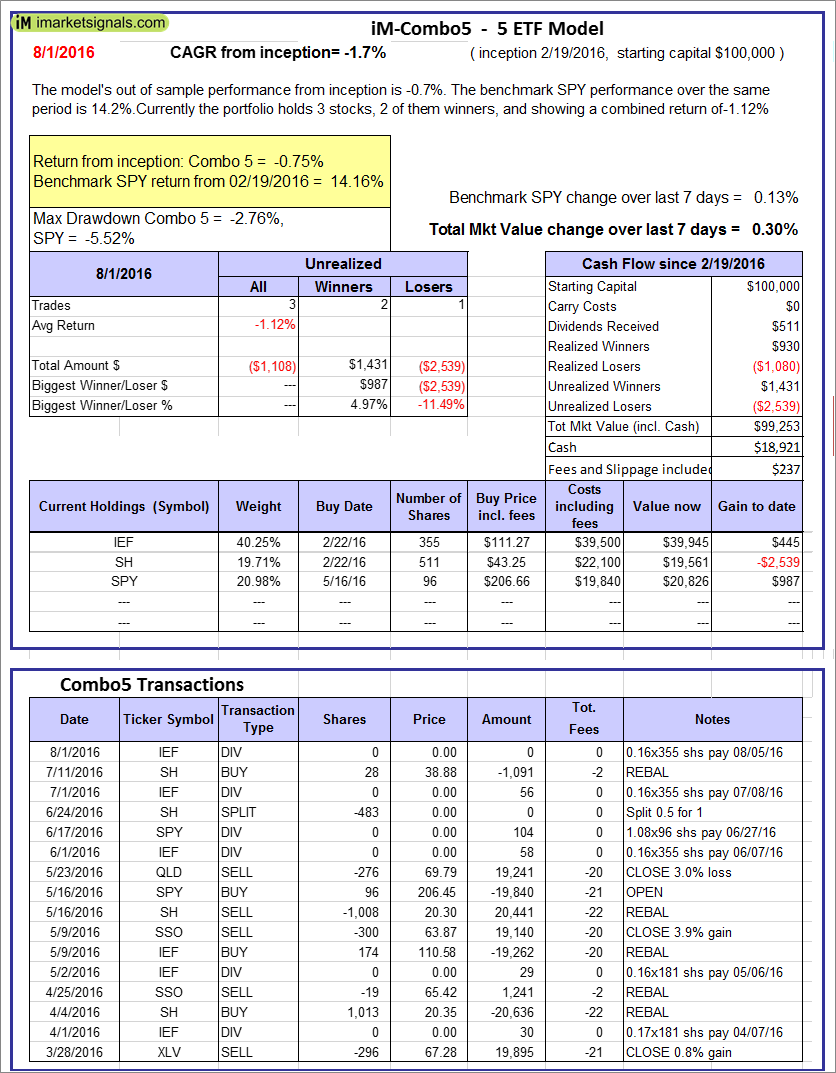 |
iM-Combo5: The model’s out of sample performance from inception is -0.7%. The benchmark SPY performance over the same period is 14.2%. Over the previous week the market value of iM-Combo5 gained 0.30% at a time when SPY gained 0.13%. A starting capital of $100,000 at inception on 2/22/2016 would have grown to $99,253 which includes $18,921 cash and excludes $237 spent on fees and slippage. |
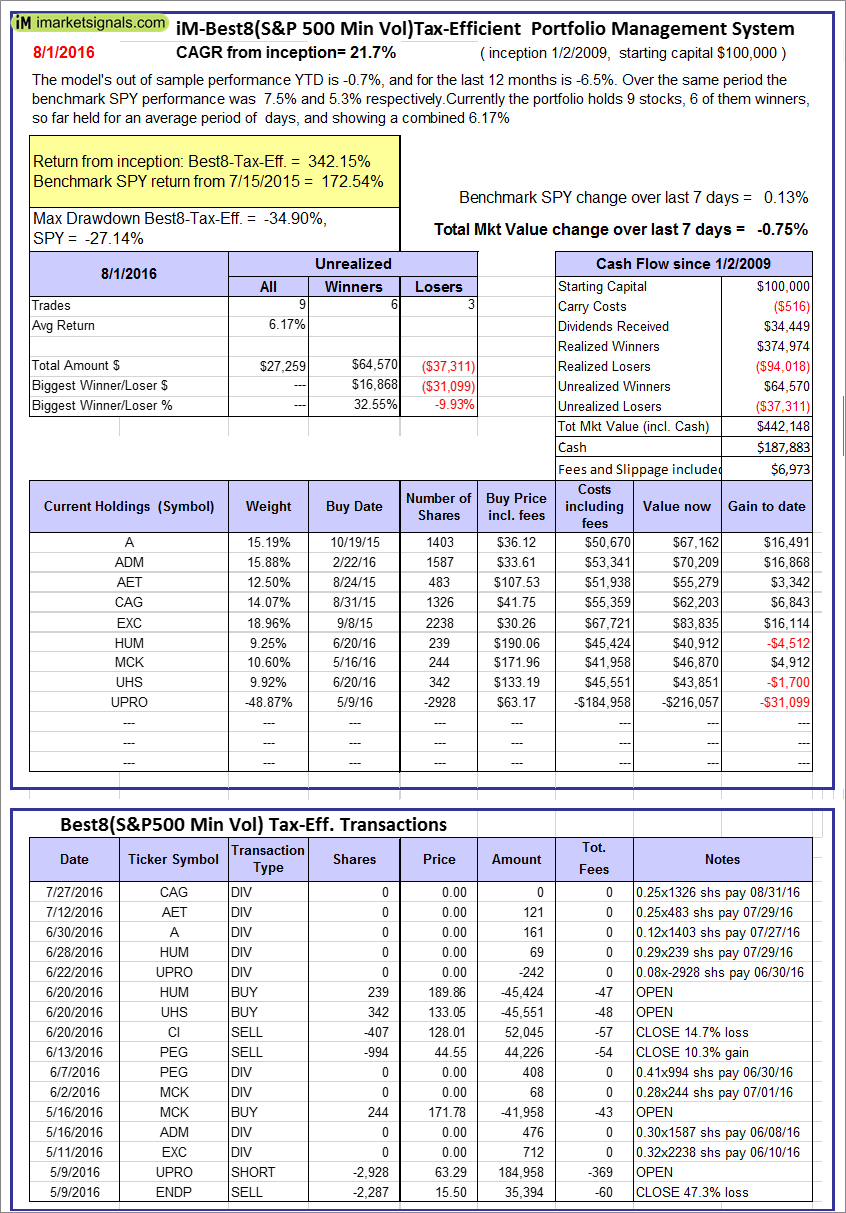 |
The iM-Best8(S&P500 Min Vol)Tax-Efficient The model’s out of sample performance YTD is -0.7%, and for the last 12 months is -6.5%. Over the same period the benchmark SPY performance was 7.5% and 5.3% respectively. Over the previous week the market value of iM-Best8(S&P 500)Tax-Eff. gained -0.75% at a time when SPY gained 0.13%. A starting capital of $100,000 at inception on 1/2/2009 would have grown to $442,148 which includes $187,883 cash and excludes $6,973 spent on fees and slippage. |
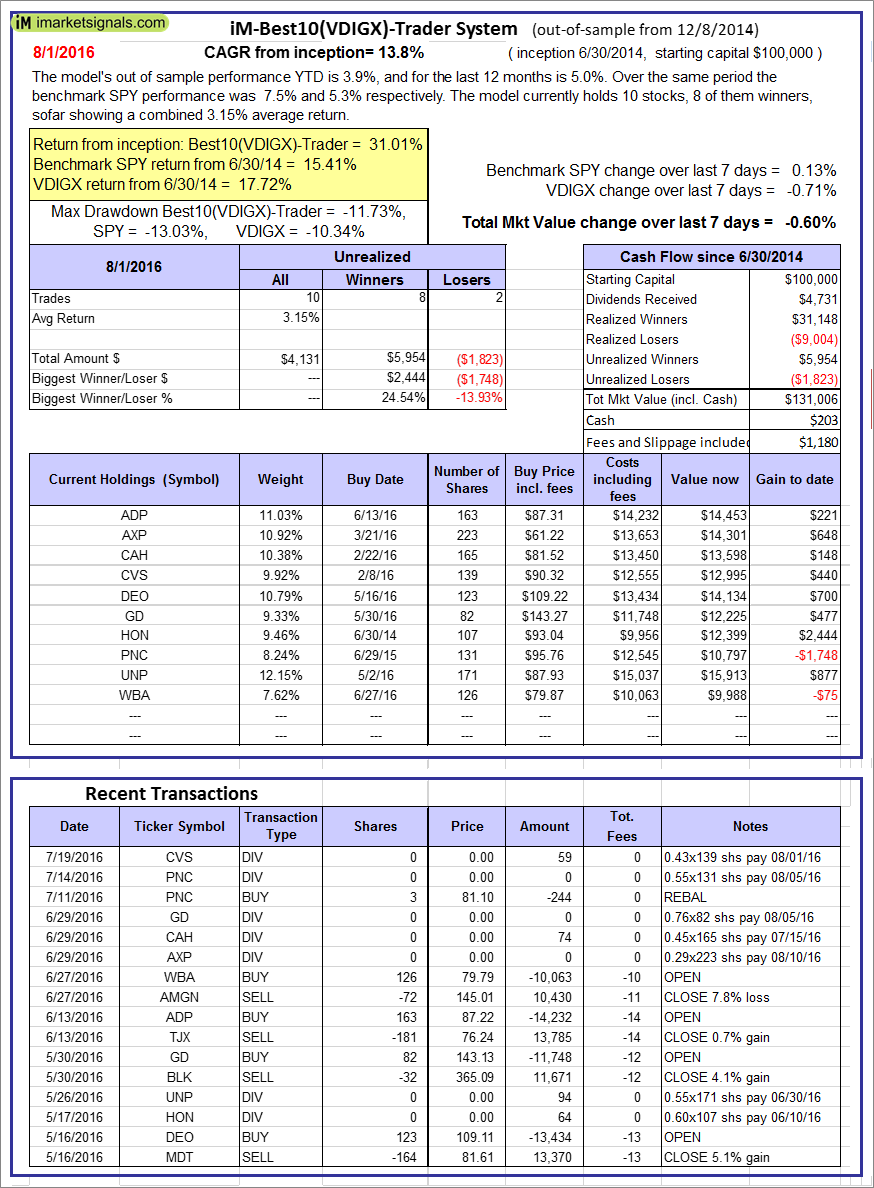 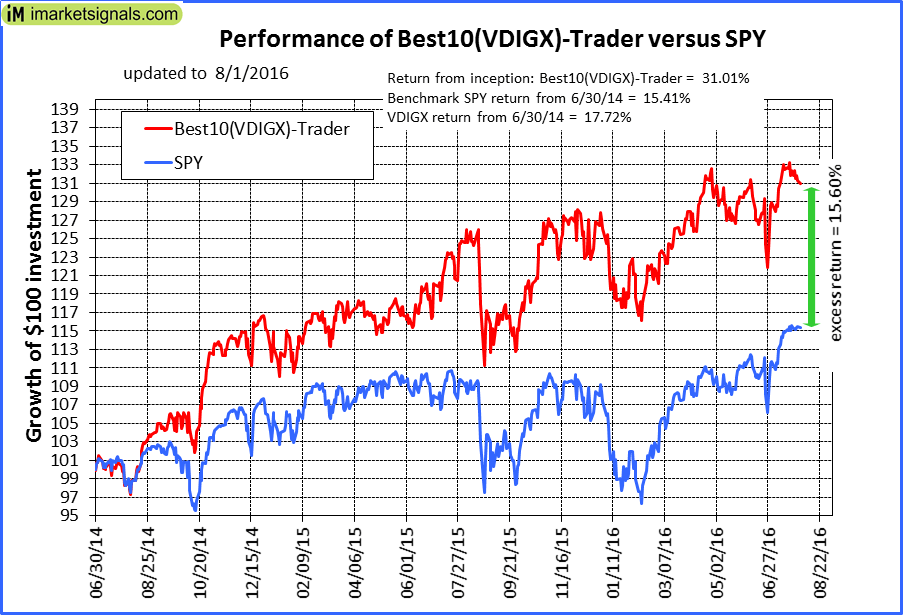 |
iM-Best10(VDIGX)-Trader: The model’s out of sample performance YTD is 3.9%, and for the last 12 months is 5.0%. Over the same period the benchmark SPY performance was 7.5% and 5.3% respectively. Since inception, on 7/1/2014, the model gained 31.01% while the benchmark SPY gained 15.41% and the ETF VDIGX gained 17.72% over the same period. Over the previous week the market value of iM-Best10(VDIGX) gained -0.60% at a time when SPY gained 0.13%. A starting capital of $100,000 at inception on 7/1/2014 would have grown to $131,006 which includes $203 cash and excludes $1,180 spent on fees and slippage. |
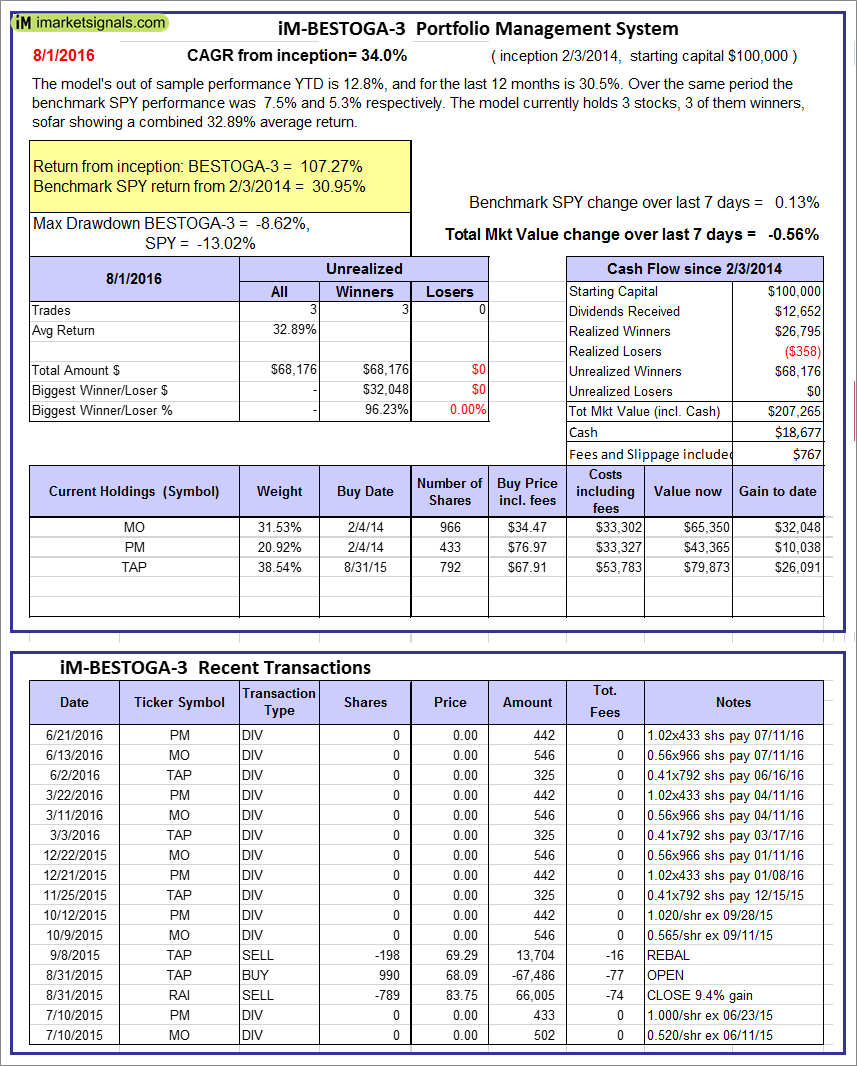 |
iM-BESTOGA-3: The model’s out of sample performance YTD is 12.8%, and for the last 12 months is 30.5%. Over the same period the benchmark SPY performance was 7.5% and 5.3% respectively. Over the previous week the market value of iM-BESTOGA-3 gained -0.56% at a time when SPY gained 0.13%. A starting capital of $100,000 at inception on 2/3/2014 would have grown to $207,265 which includes $18,677 cash and excludes $767 spent on fees and slippage. |
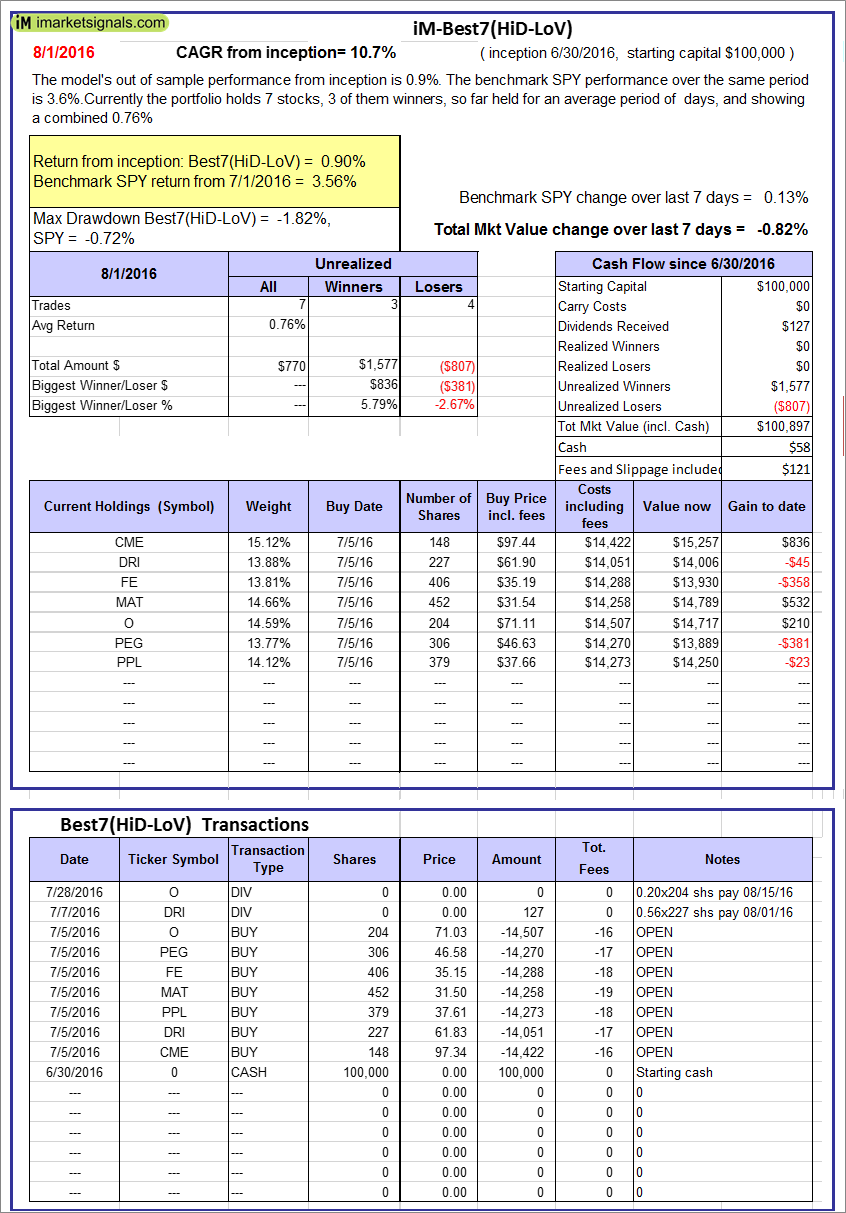 |
iM-Best7(HiD-LoV): The model’s out of sample performance from inception is 0.9%. The benchmark SPY performance over the same period is 3.6%. Over the previous week the market value of iM-BESTOGA-3 gained -0.82% at a time when SPY gained 0.13%. A starting capital of $100,000 at inception on 2/3/2014 would have grown to $100,897 which includes $58 cash and excludes $121 spent on fees and slippage. |
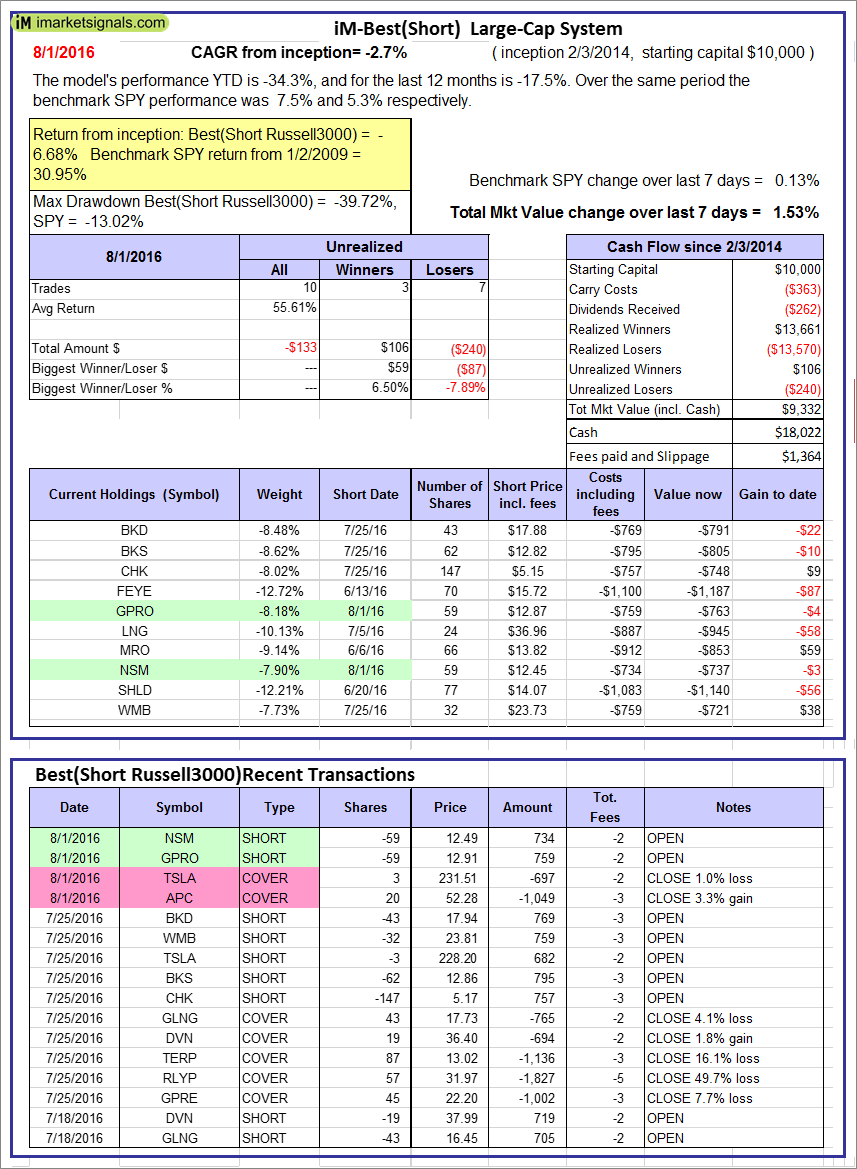 |
iM-Best10(Short Russell3000): The model’s performance YTD is -34.3%, and for the last 12 months is -17.5%. Over the same period the benchmark SPY performance was 7.5% and 5.3% respectively. Over the previous week the market value of iM-Best10(Short Russell3000) gained 1.53% at a time when SPY gained 0.13%. Over the period 2/3/2014 to 8/1/2016 the starting capital of $100,000 would have grown to $9,332 which includes $18,022 cash and excludes $1,364 spent on fees and slippage. |
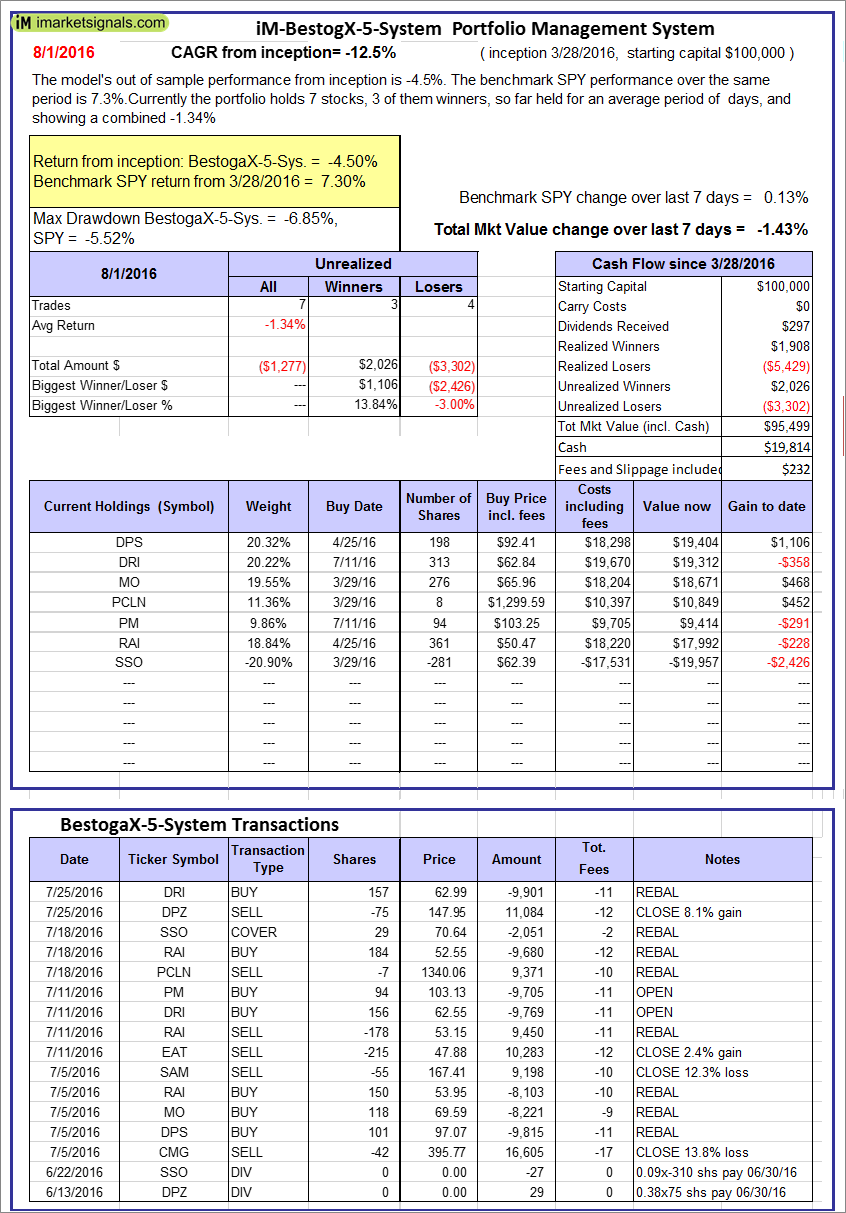 |
iM-BestogaX5-System: The model’s out of sample performance from inception is -4.5%. The benchmark SPY performance over the same period is 7.3%. Over the previous week the market value of iM-Best8(S&P 500)Tax-Eff. gained -1.43% at a time when SPY gained 0.13%. A starting capital of $100,000 at inception on 1/2/2009 would have grown to $95,499 which includes $19,814 cash and excludes $232 spent on fees and slippage. |
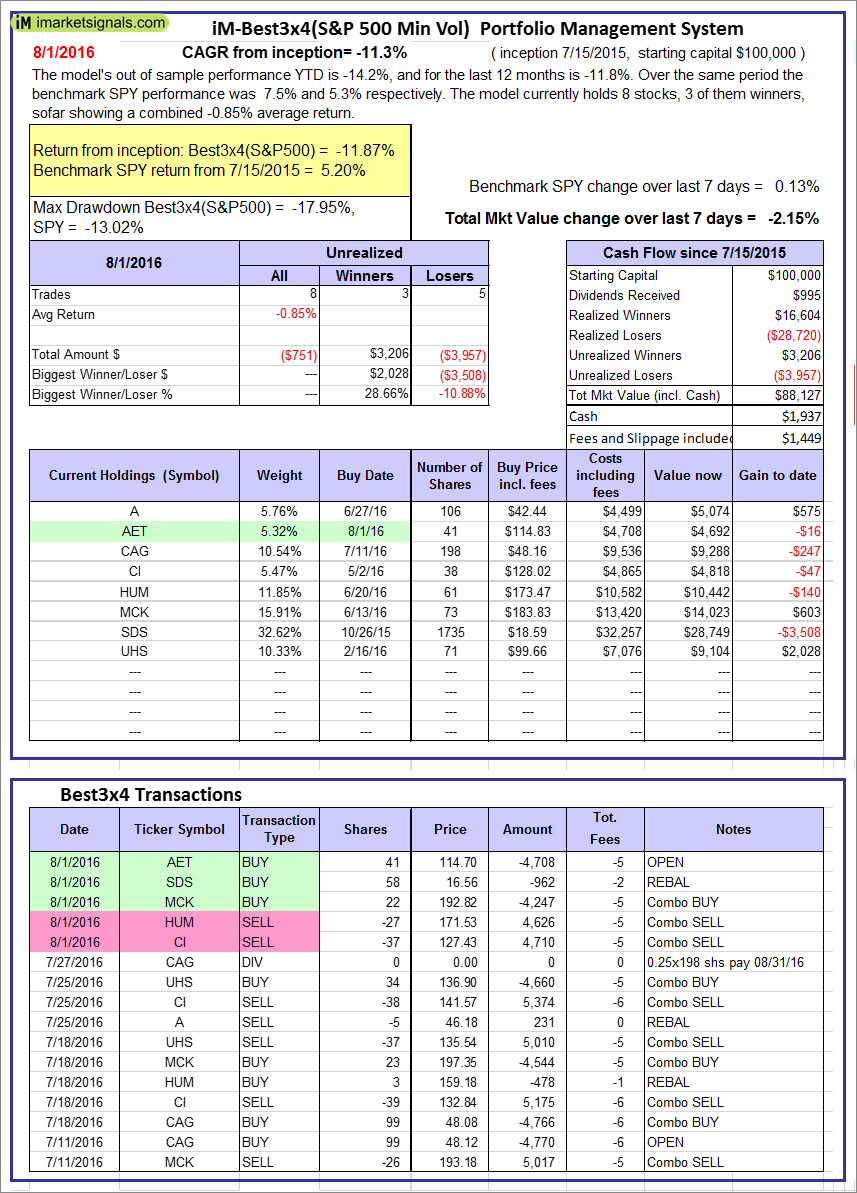 |
iM-Best3x4(S&P 500 Min Vol): The model’s out of sample performance YTD is -14.2%, and for the last 12 months is -11.8%. Over the same period the benchmark SPY performance was 7.5% and 5.3% respectively. Over the previous week the market value of iM-Best3x4 gained -2.15% at a time when SPY gained 0.13%. A starting capital of $100,000 at inception on 7/15/2015 would have grown to $88,127 which includes $1,937 cash and excludes $1,449 spent on fees and slippage. |
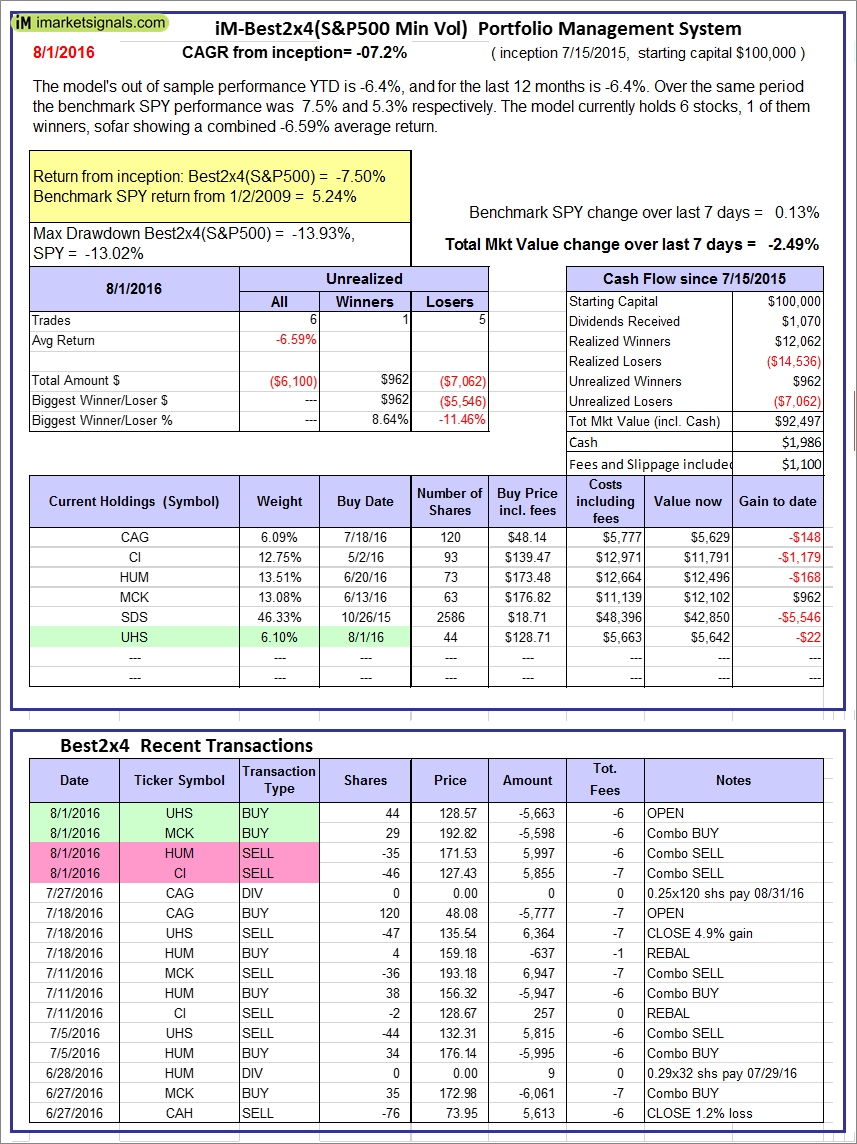 |
iM-Best2x4(S&P 500 Min Vol): The model’s out of sample performance YTD is -6.2%, and since inception -7.3%. Over the same period the benchmark SPY performance was 5.8% and 3.5% respectively. Over the previous week the market value of iM-Best2x4 gained -3.02% at a time when SPY gained 2.39%. A starting capital of $100,000 at inception on 7/16/2015 would have grown to $92,674 which includes $1,437 cash and excludes $1,060 spent on fees and slippage. |
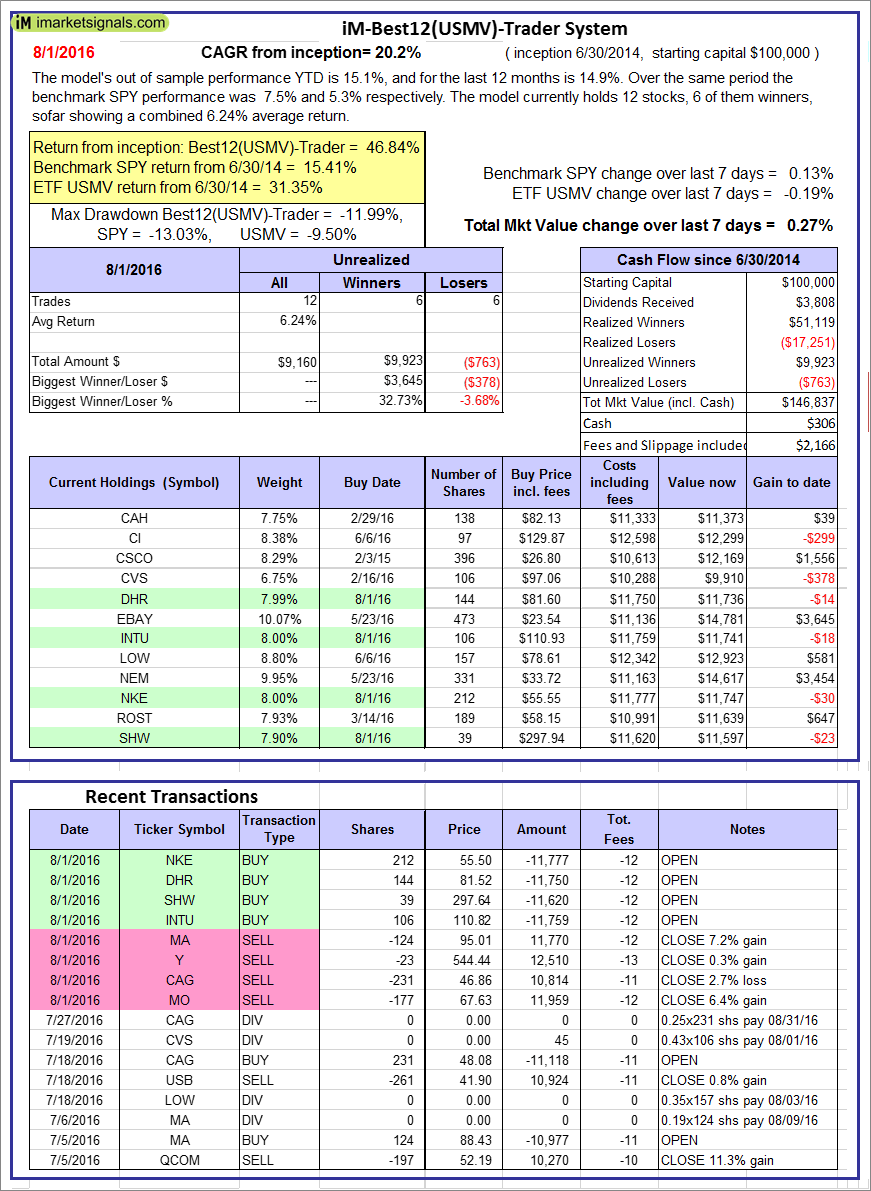 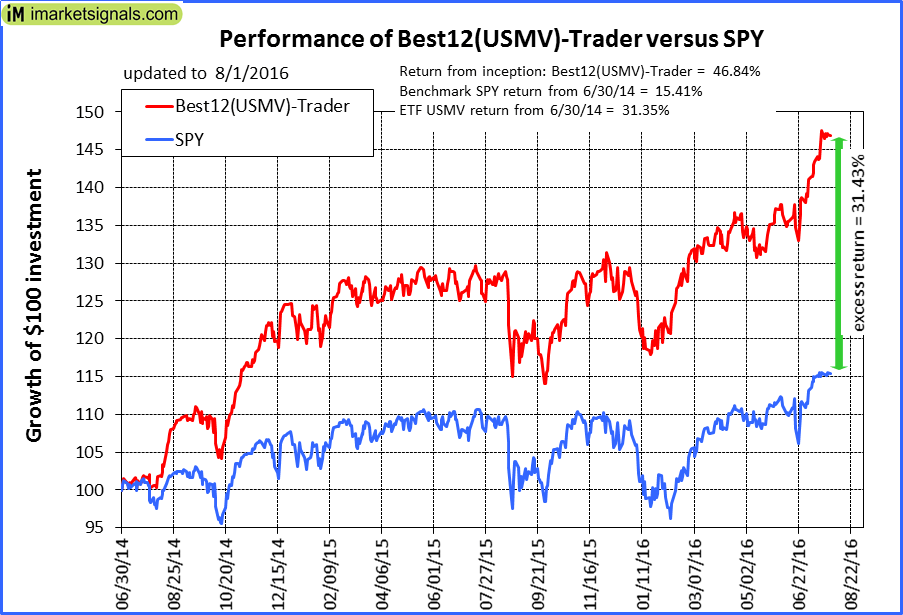 |
iM-Best12(USMV)-Trader: The model’s out of sample performance YTD is 15.1%, and for the last 12 months is 14.9%. Over the same period the benchmark SPY performance was 7.5% and 5.3% respectively. Since inception, on 7/1/2014, the model gained 46.84% while the benchmark SPY gained 15.41% and the ETF USMV gained 31.35% over the same period. Over the previous week the market value of iM-Best12(USMV)-Trader gained 0.27% at a time when SPY gained 0.13%. A starting capital of $100,000 at inception on 7/1/2014 would have grown to $146,837 which includes $306 cash and excludes $2,166 spent on fees and slippage. |
 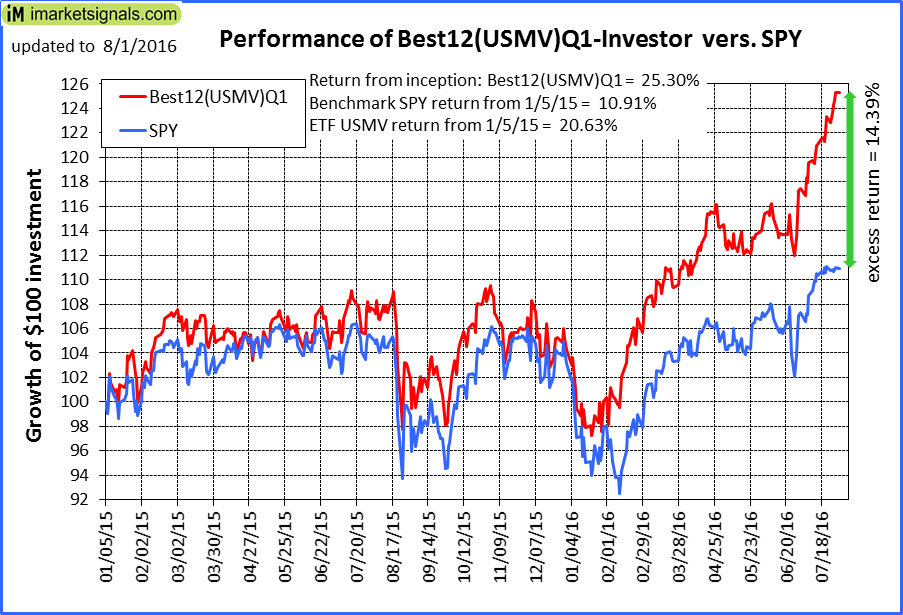 |
iM-Best12(USMV)Q1-Investor: The model’s out of sample performance YTD is 20.1%, and for the last 12 months is 16.4%. Over the same period the benchmark SPY performance was 7.5% and 5.3% respectively. Since inception, on 1/5/2015, the model gained 25.30% while the benchmark SPY gained 10.91% and the ETF USMV gained 20.63% over the same period. Over the previous week the market value of iM-Best12(USMV)Q1 gained 1.97% at a time when SPY gained 0.13%. A starting capital of $100,000 at inception on 1/5/2015 would have grown to $125,297 which includes $130 cash and excludes $493 spent on fees and slippage. |
 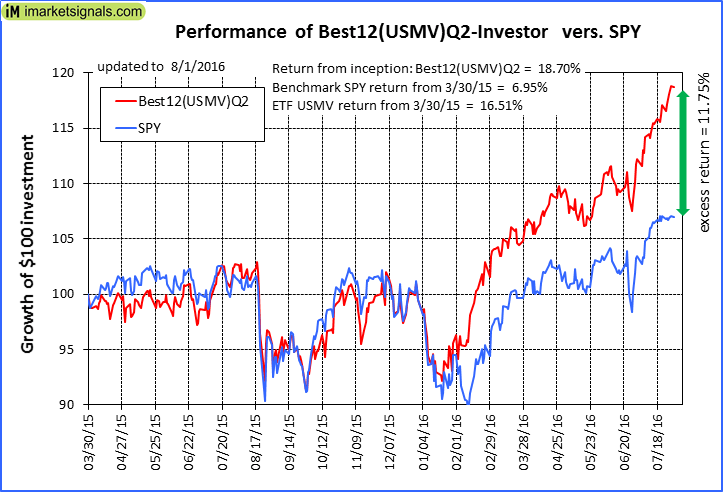 |
iM-Best12(USMV)Q2-Investor: The model’s out of sample performance YTD is 19.3%, and for the last 12 months is 15.5%. Over the same period the benchmark SPY performance was 7.5% and 5.3% respectively. Since inception, on 3/31/2015, the model gained 18.70% while the benchmark SPY gained 6.95% and the ETF USMV gained 16.51% over the same period. Over the previous week the market value of iM-Best12(USMV)Q2 gained 1.89% at a time when SPY gained 0.13%. A starting capital of $100,000 at inception on 3/31/2015 would have grown to $118,698 which includes $227 cash and excludes $385 spent on fees and slippage. |
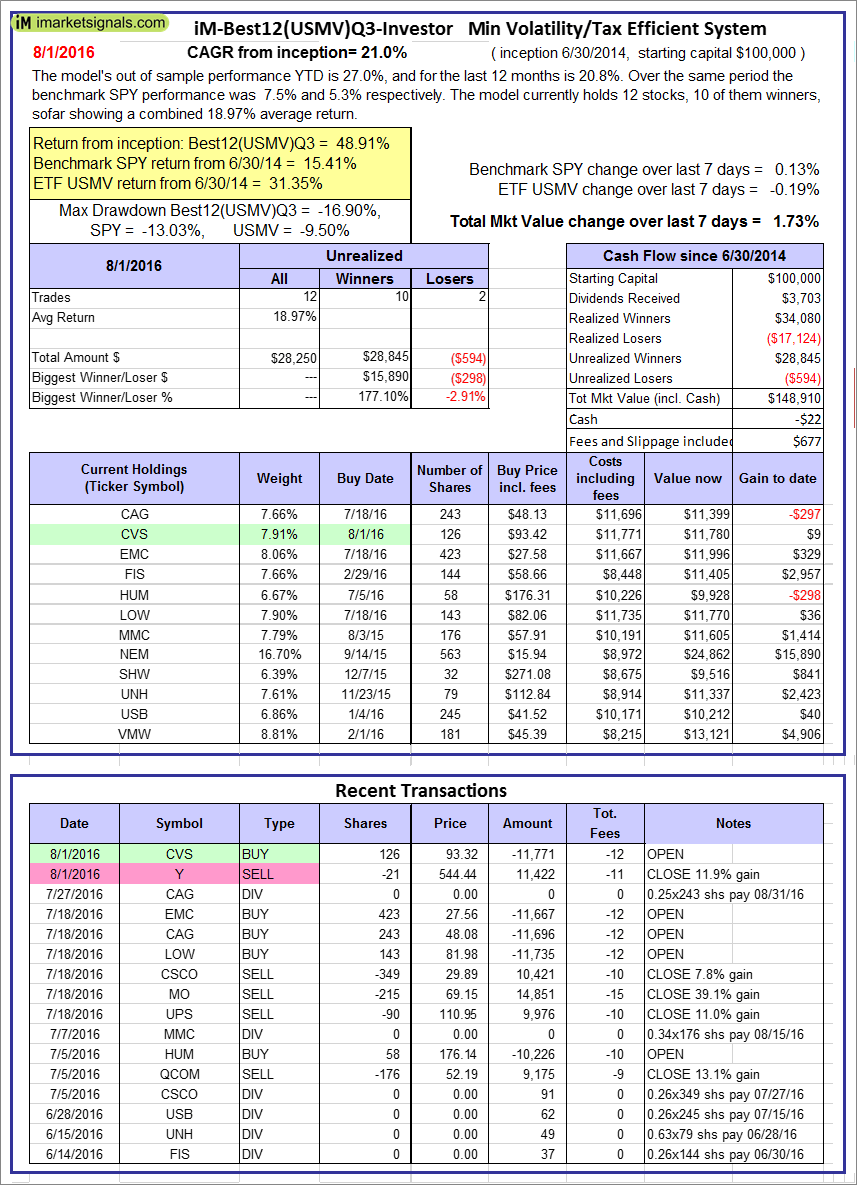 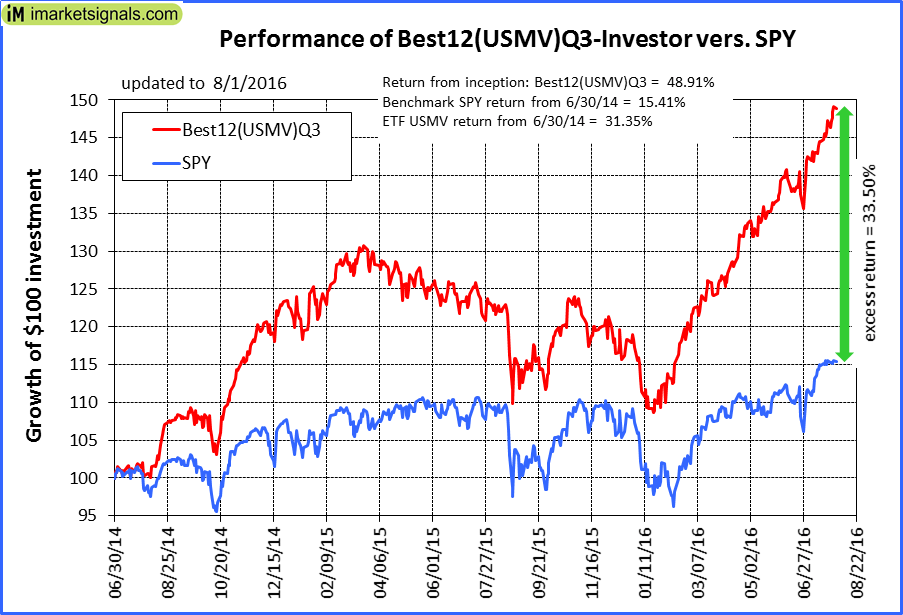 |
iM-Best12(USMV)Q3-Investor: The model’s out of sample performance YTD is 27.0%, and for the last 12 months is 20.8%. Over the same period the benchmark SPY performance was 7.5% and 5.3% respectively. Since inception, on 7/1/2014, the model gained 48.91% while the benchmark SPY gained 15.41% and the ETF USMV gained 31.35% over the same period. Over the previous week the market value of iM-Best12(USMV)Q3 gained 1.73% at a time when SPY gained 0.13%. A starting capital of $100,000 at inception on 7/1/2014 would have grown to $148,910 which includes -$22 cash and excludes $677 spent on fees and slippage. |
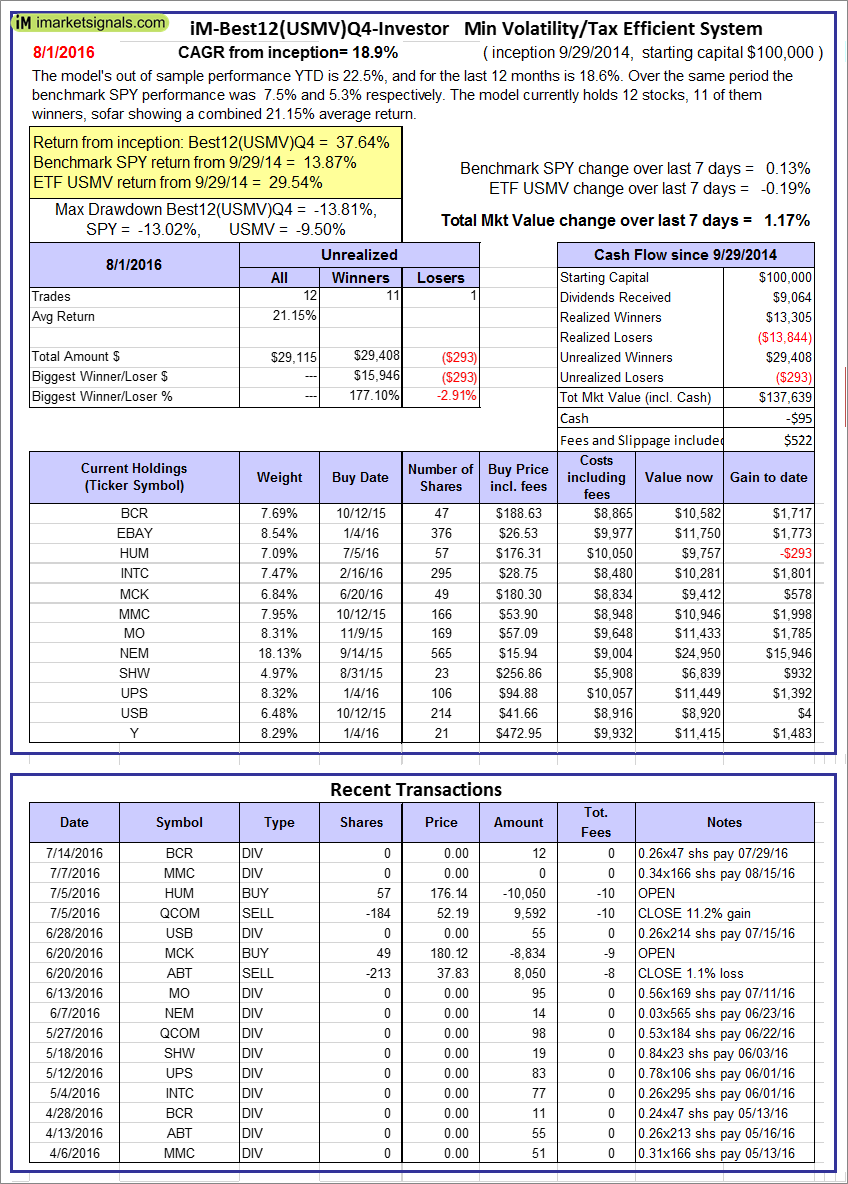 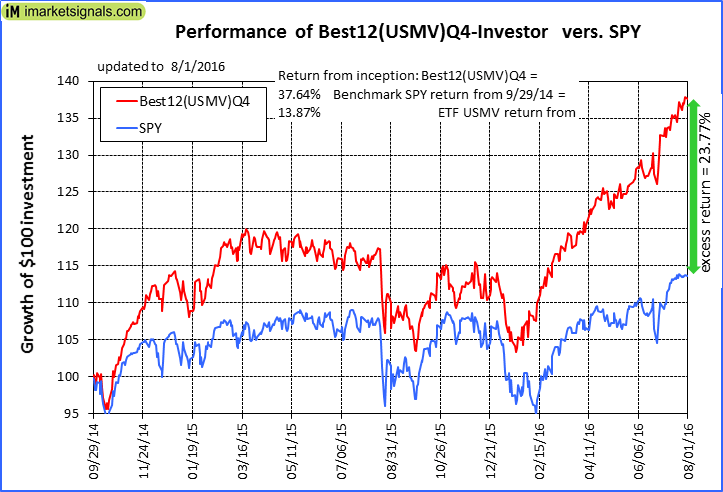 |
iM-Best12(USMV)Q4-Investor: Since inception, on 9/30/2014, the model gained 37.64% while the benchmark SPY gained 13.87% and the ETF USMV gained 29.54% over the same period. Over the previous week the market value of iM-Best12(USMV)Q4 gained 1.17% at a time when SPY gained 0.13%. A starting capital of $100,000 at inception on 9/30/2014 would have grown to $137,639 which includes -$95 cash and excludes $522 spent on fees and slippage. |
 |
Average Performance of iM-Best12(USMV)Q1+Q2+Q3+Q4-Investor resulted in an excess return of 31.66% over SPY. (see iM-USMV Investor Portfolio) |
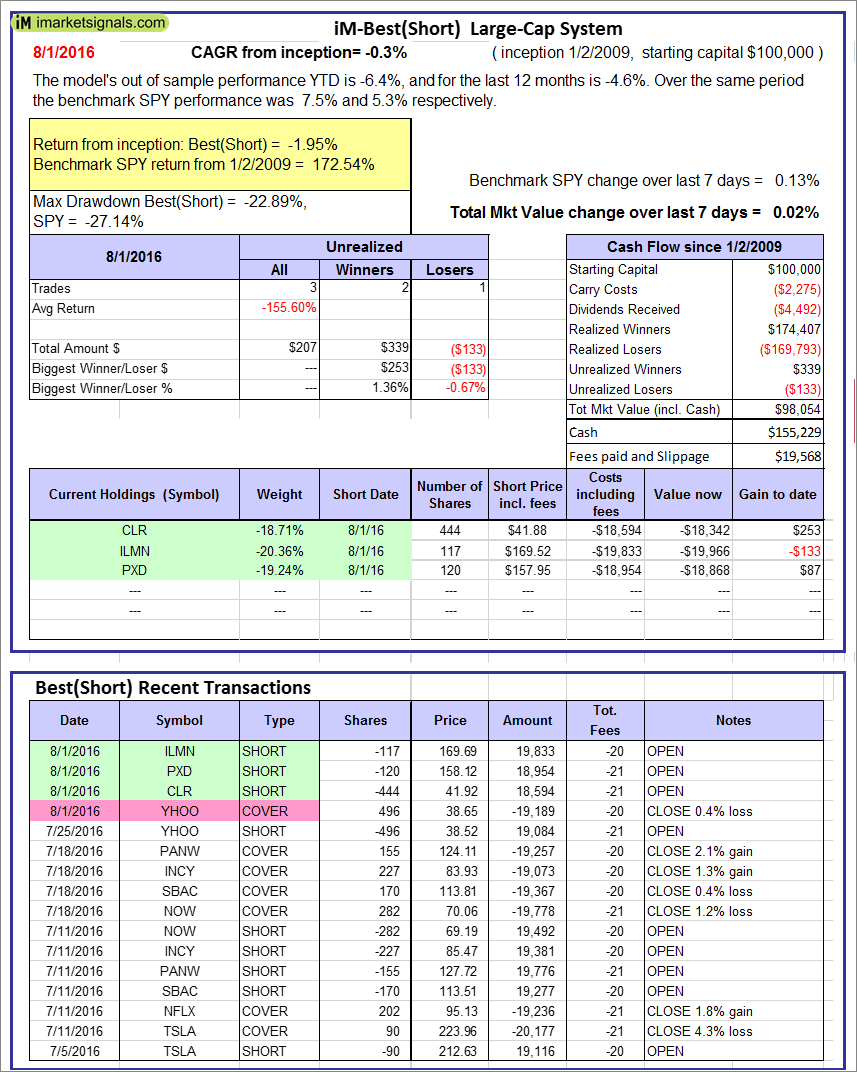 |
iM-Best(Short): The model’s out of sample performance YTD is -6.4%, and for the last 12 months is -4.6%. Over the same period the benchmark SPY performance was 7.5% and 5.3% respectively. Over the previous week the market value of iM-Best(Short) gained 0.02% at a time when SPY gained 0.13%. Over the period 1/2/2009 to 8/1/2016 the starting capital of $100,000 would have grown to $98,054 which includes $155,229 cash and excludes $19,568 spent on fees and slippage. |
iM-Best Reports – 8/1/2016
Posted in pmp SPY-SH
Leave a Reply
You must be logged in to post a comment.