
  |
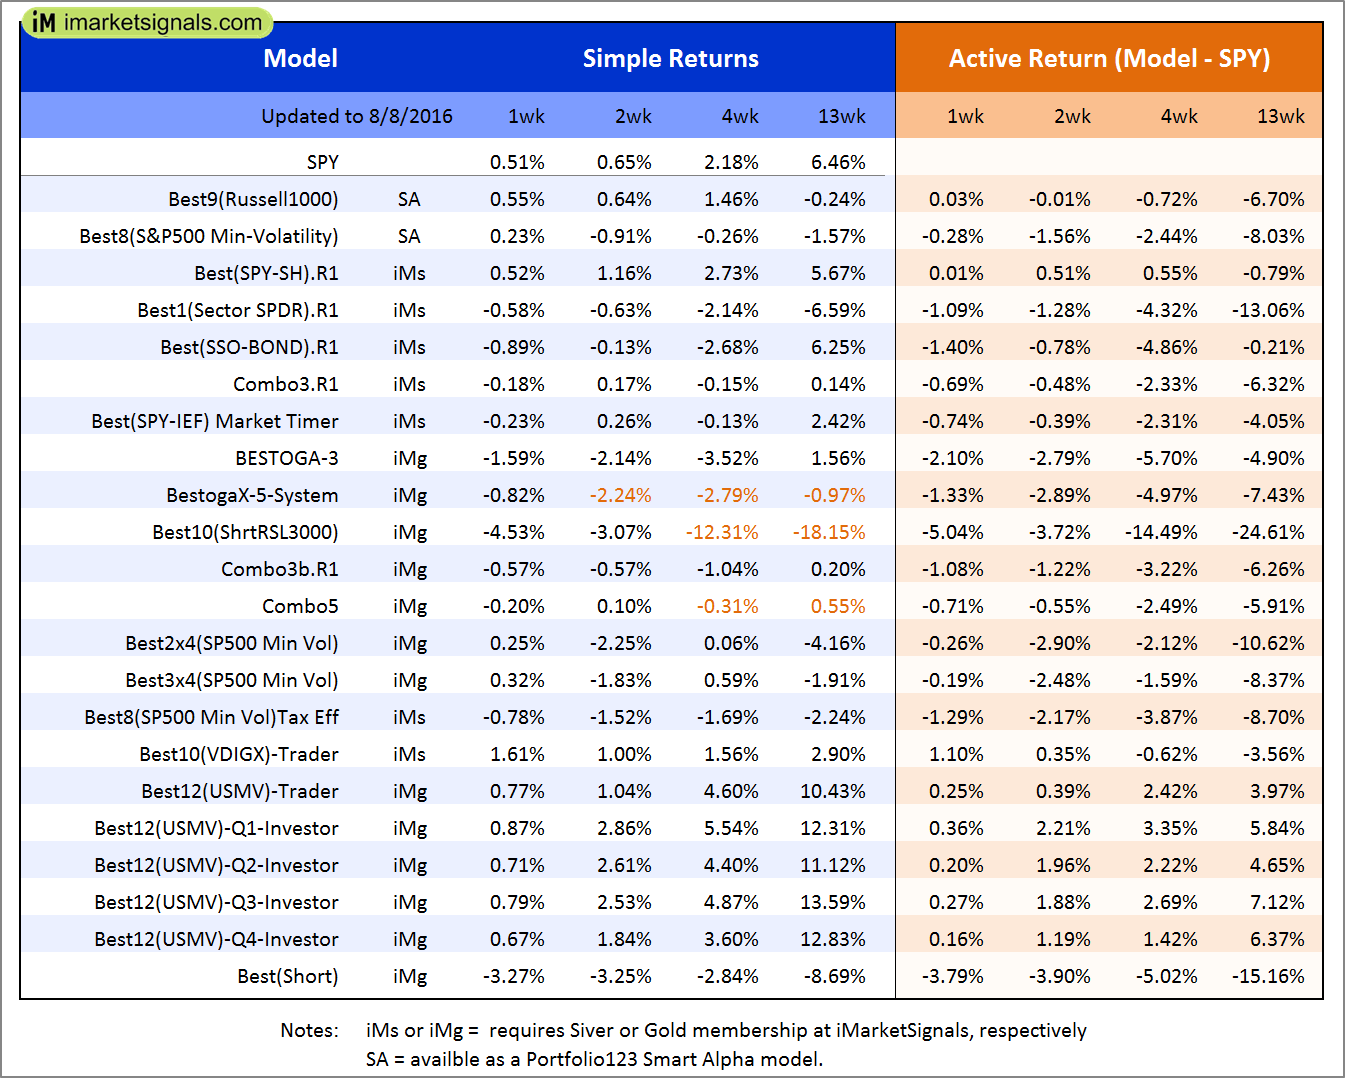
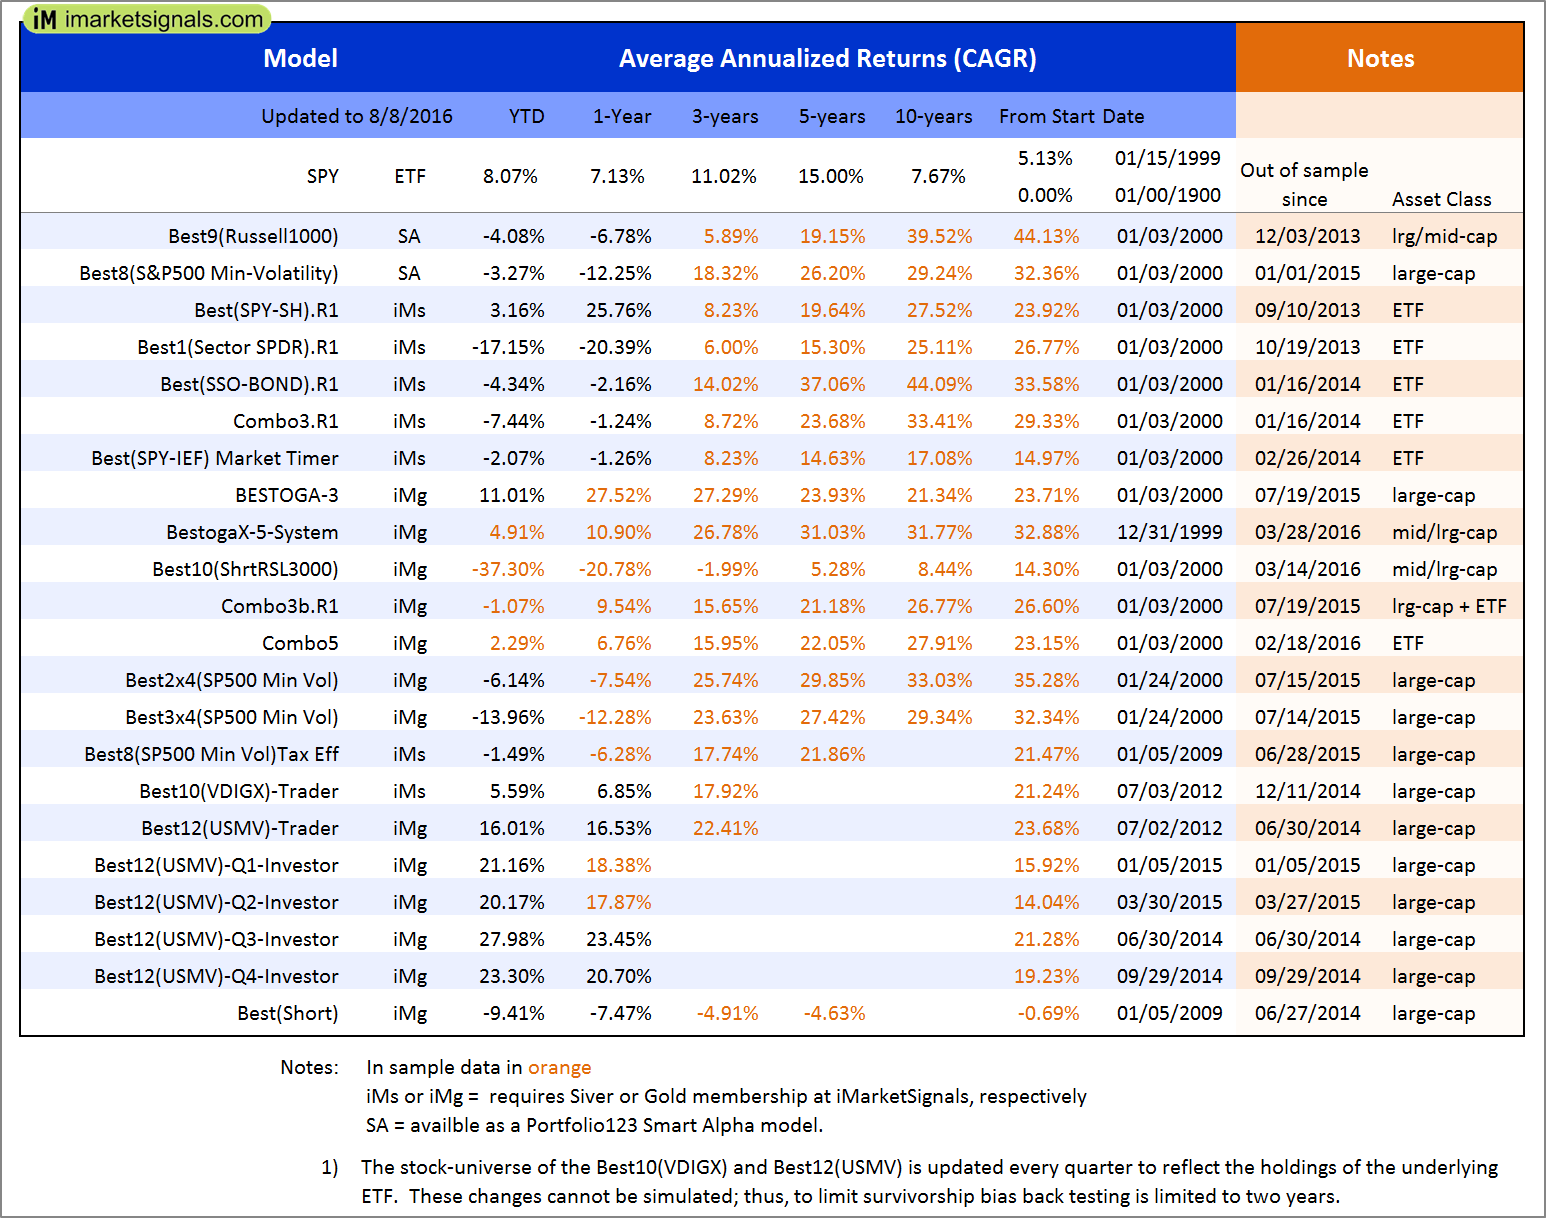
Out of sample performance summary of our models for the past 1, 2, 4 and 13 week periods. The active active return indicates how the models over- or underperformed the benchmark ETF SPY. Also the YTD, and the 1-, 3-, 5- and 10-year annualized returns are shown in the second table |
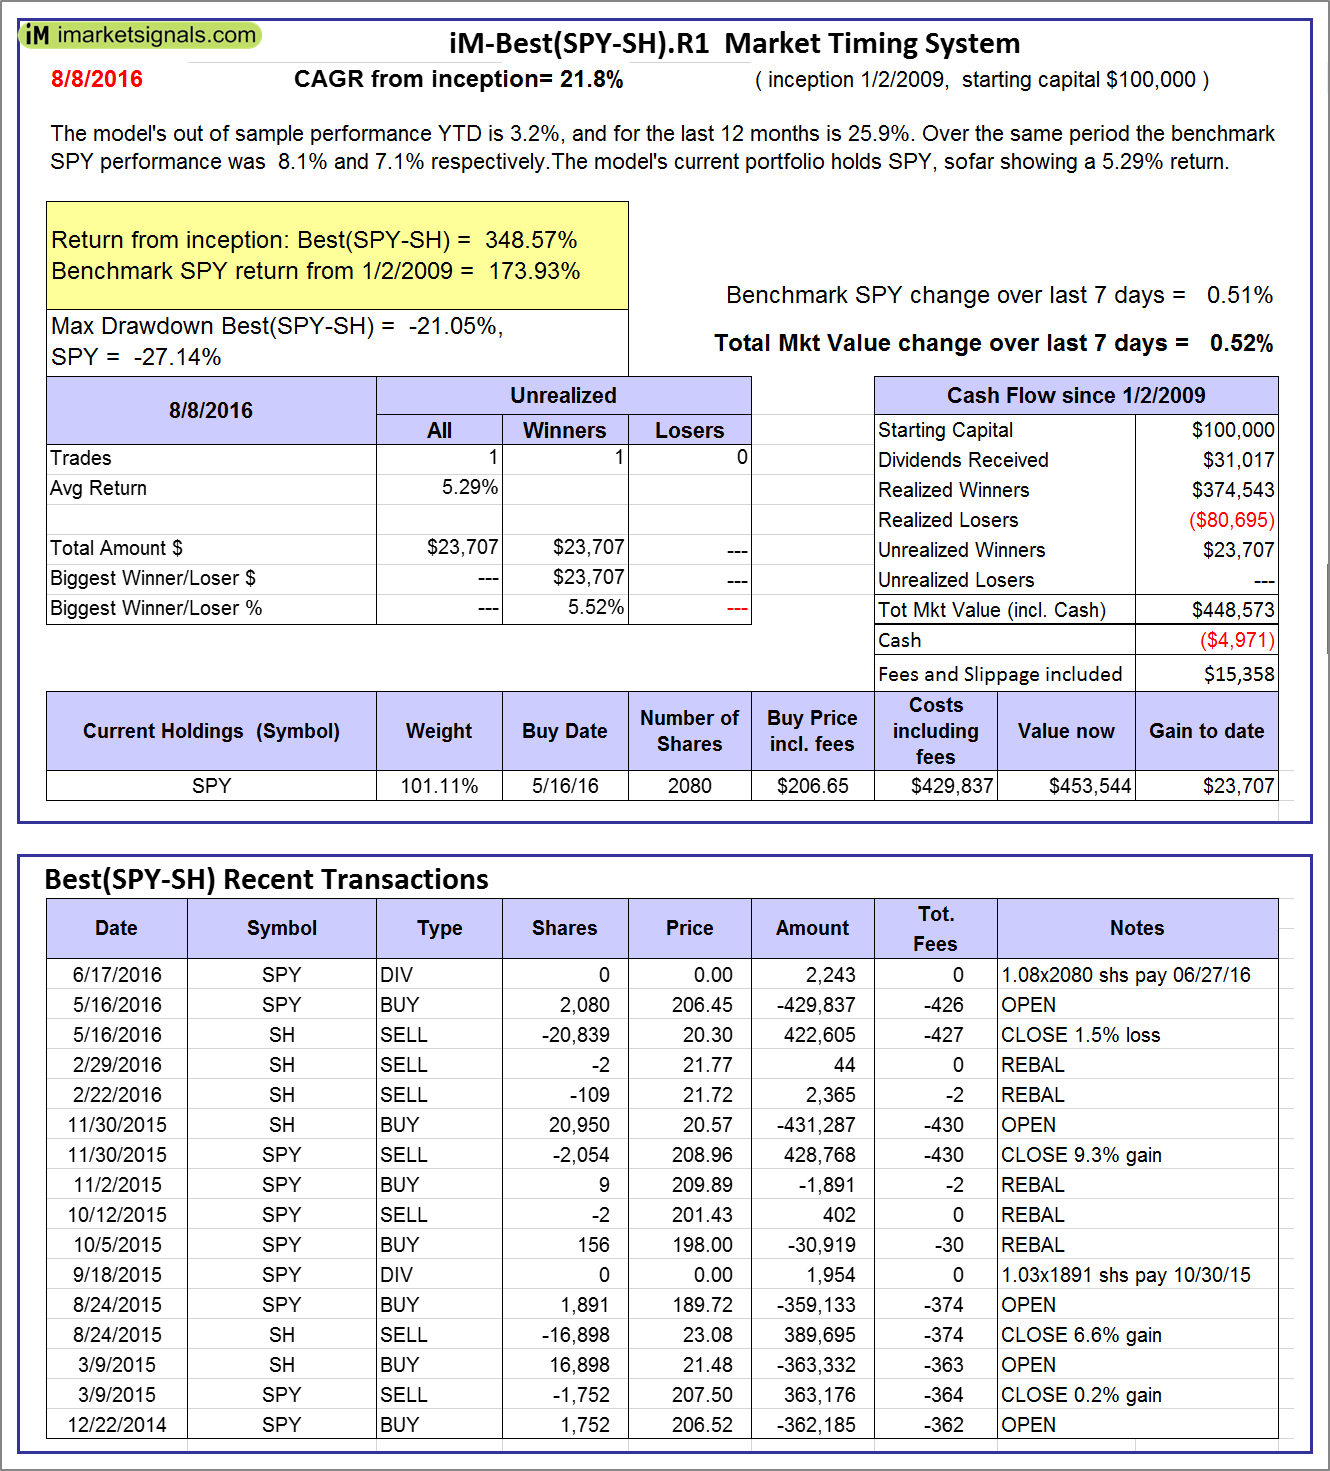 |
iM-Best(SPY-SH).R1: The model’s out of sample performance YTD is 3.2%, and for the last 12 months is 25.9%. Over the same period the benchmark SPY performance was 8.1% and 7.1% respectively. Over the previous week the market value of Best(SPY-SH) gained 0.52% at a time when SPY gained 0.51%. A starting capital of $100,000 at inception on 1/2/2009 would have grown to $448,573 which includes -$4,971 cash and excludes $15,358 spent on fees and slippage. |
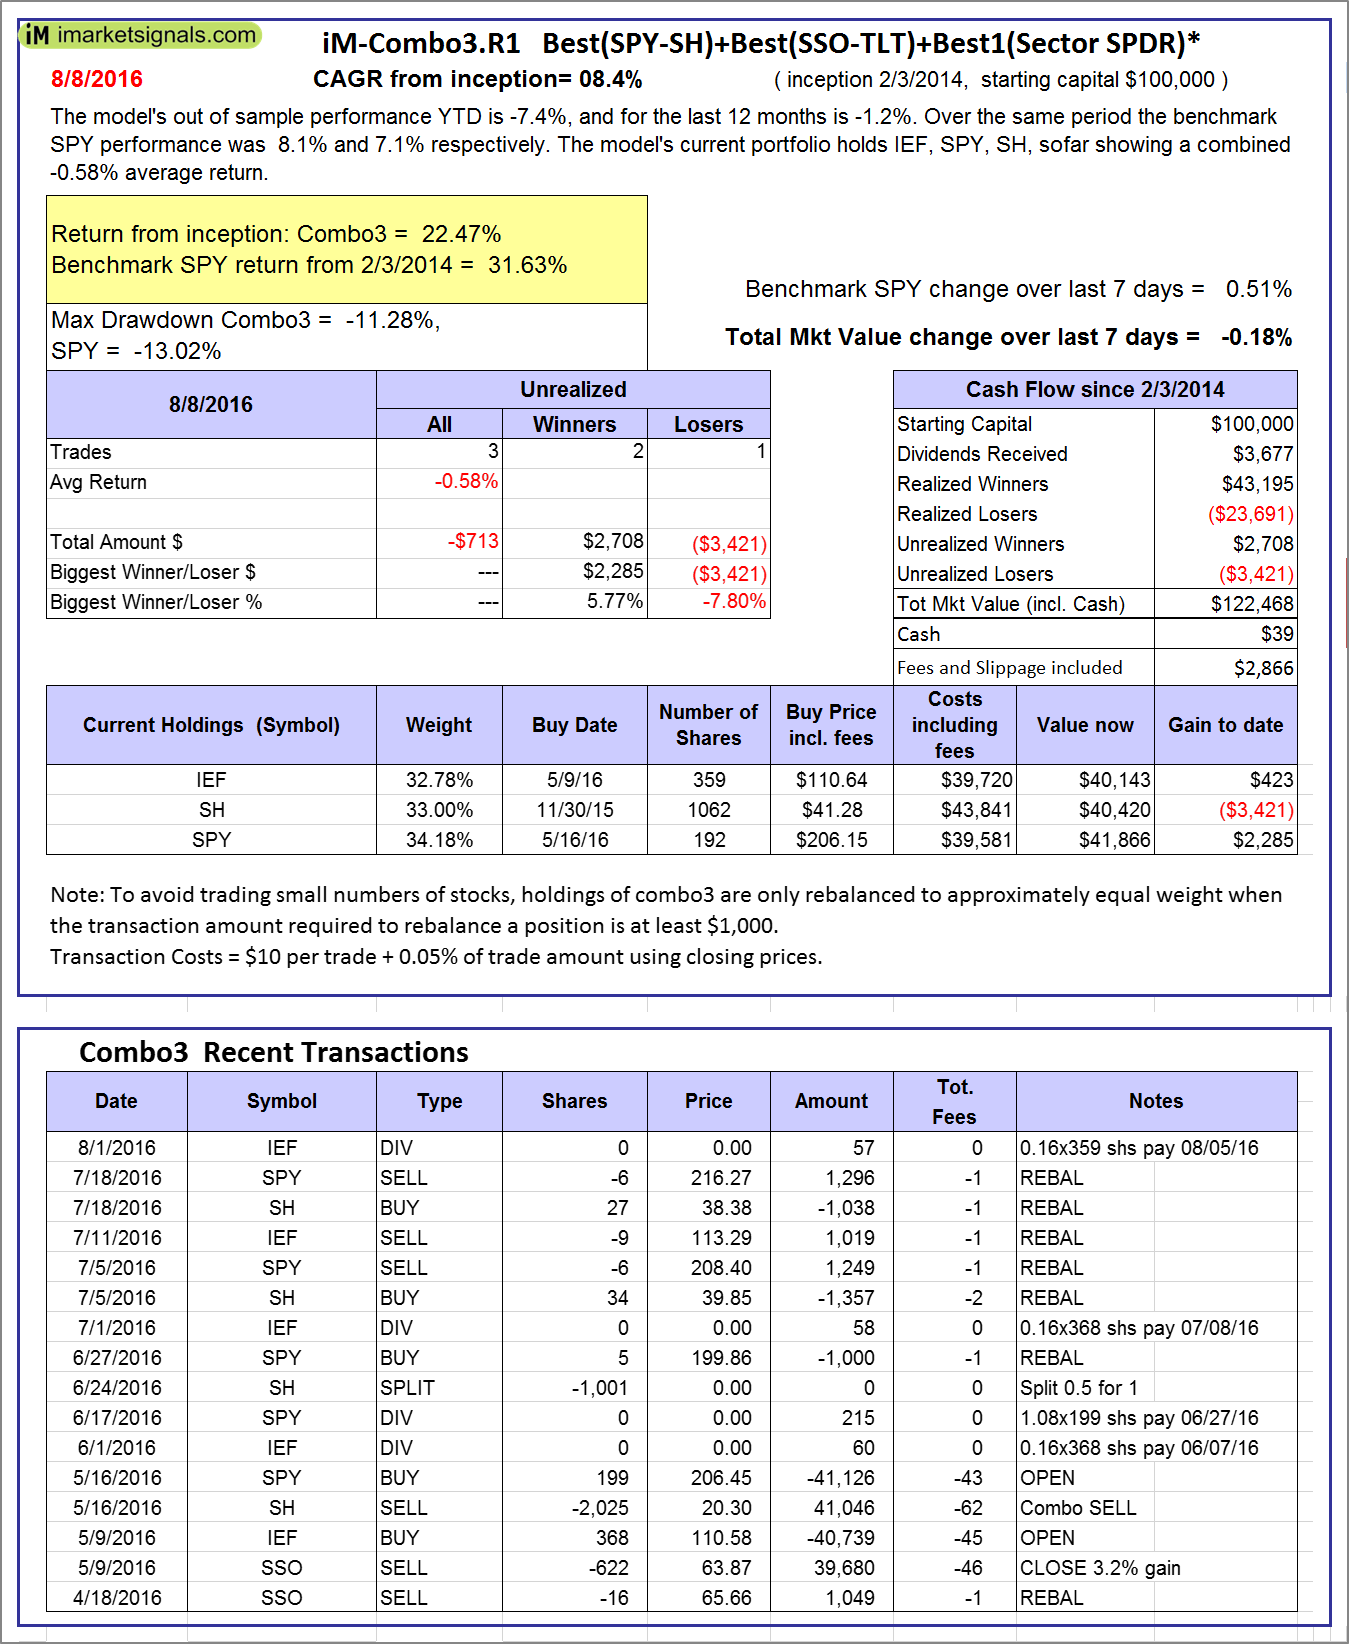 |
iM-Combo3.R1: The model’s out of sample performance YTD is -7.4%, and for the last 12 months is -1.2%. Over the same period the benchmark SPY performance was 8.1% and 7.1% respectively. Over the previous week the market value of iM-Combo3.R1 gained -0.18% at a time when SPY gained 0.51%. A starting capital of $100,000 at inception on 2/3/2014 would have grown to $122,468 which includes $39 cash and excludes $2,866 spent on fees and slippage. |
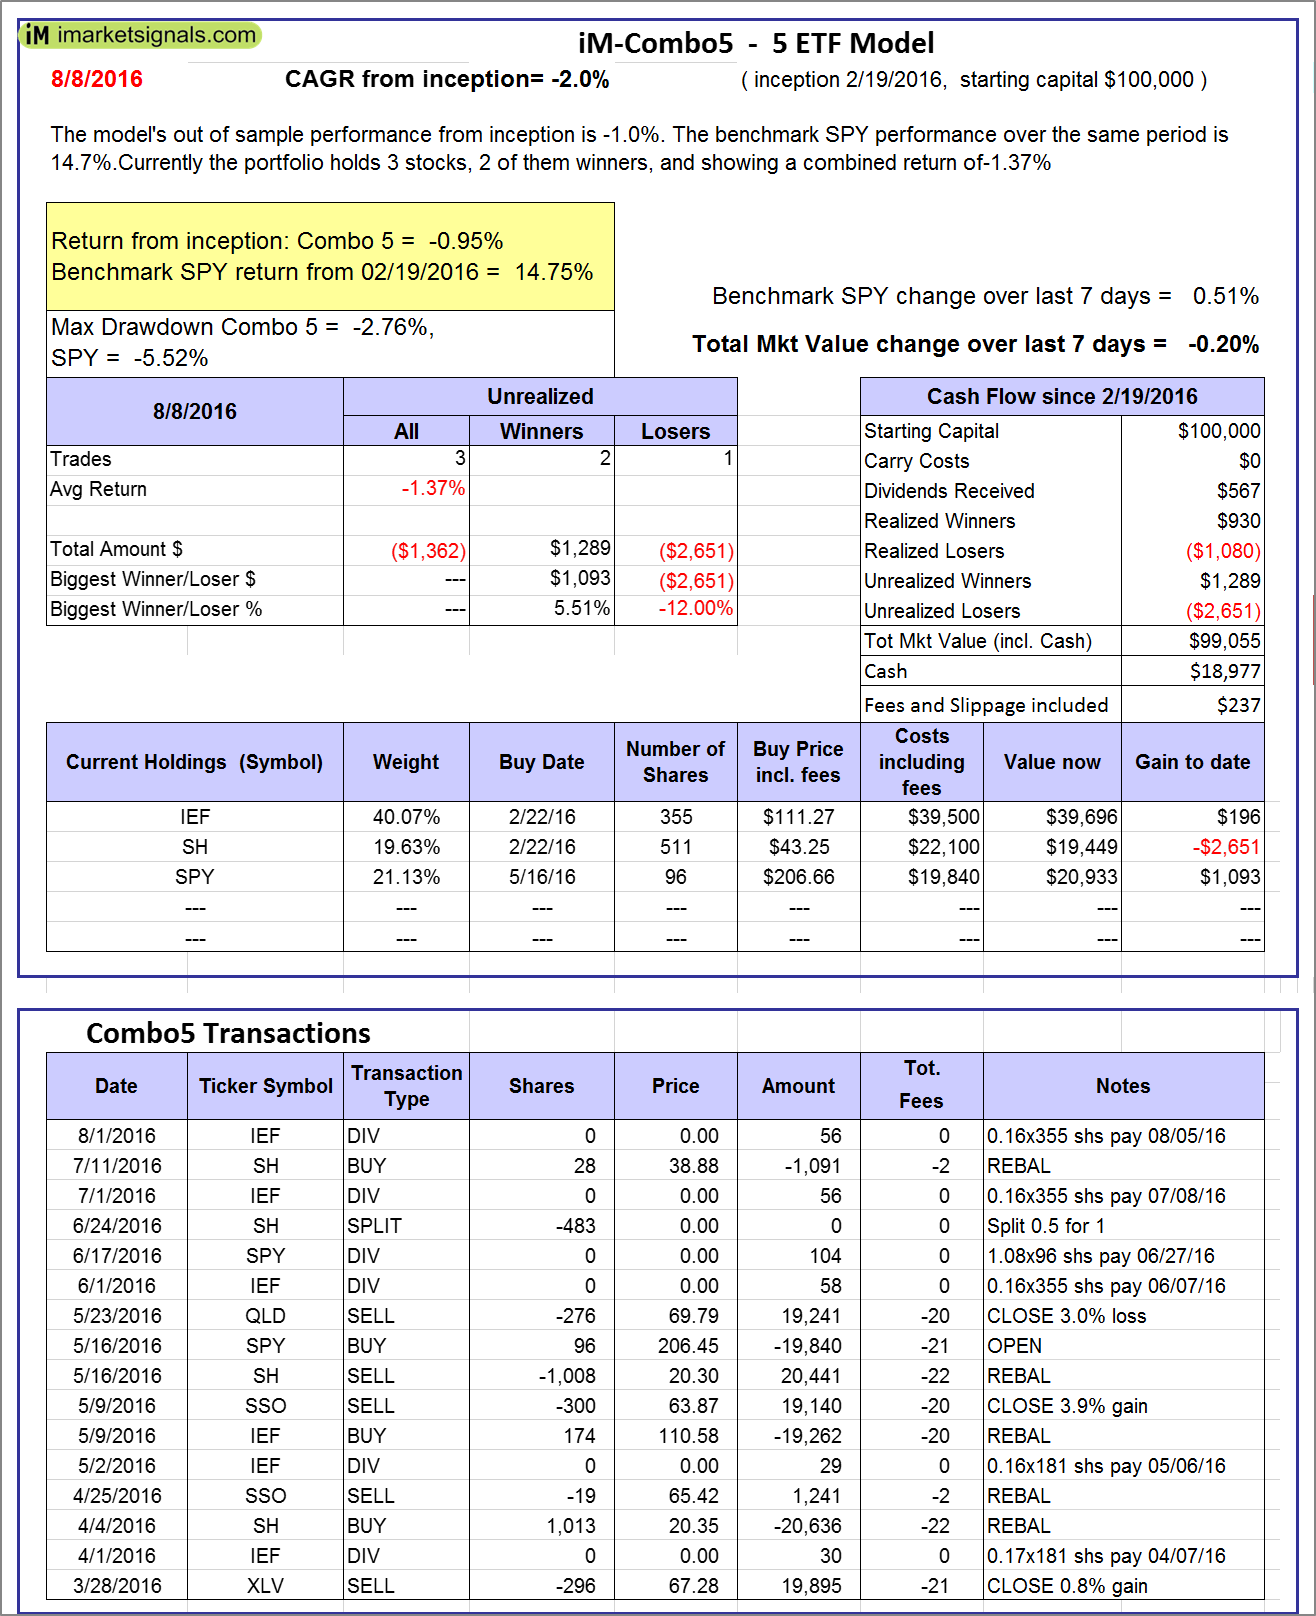 |
iM-Combo5: The model’s out of sample performance from inception is -1.0%. The benchmark SPY performance over the same period is 14.7%. Over the previous week the market value of iM-Combo5 gained -0.20% at a time when SPY gained 0.51%. A starting capital of $100,000 at inception on 2/22/2016 would have grown to $99,055 which includes $18,977 cash and excludes $237 spent on fees and slippage. |
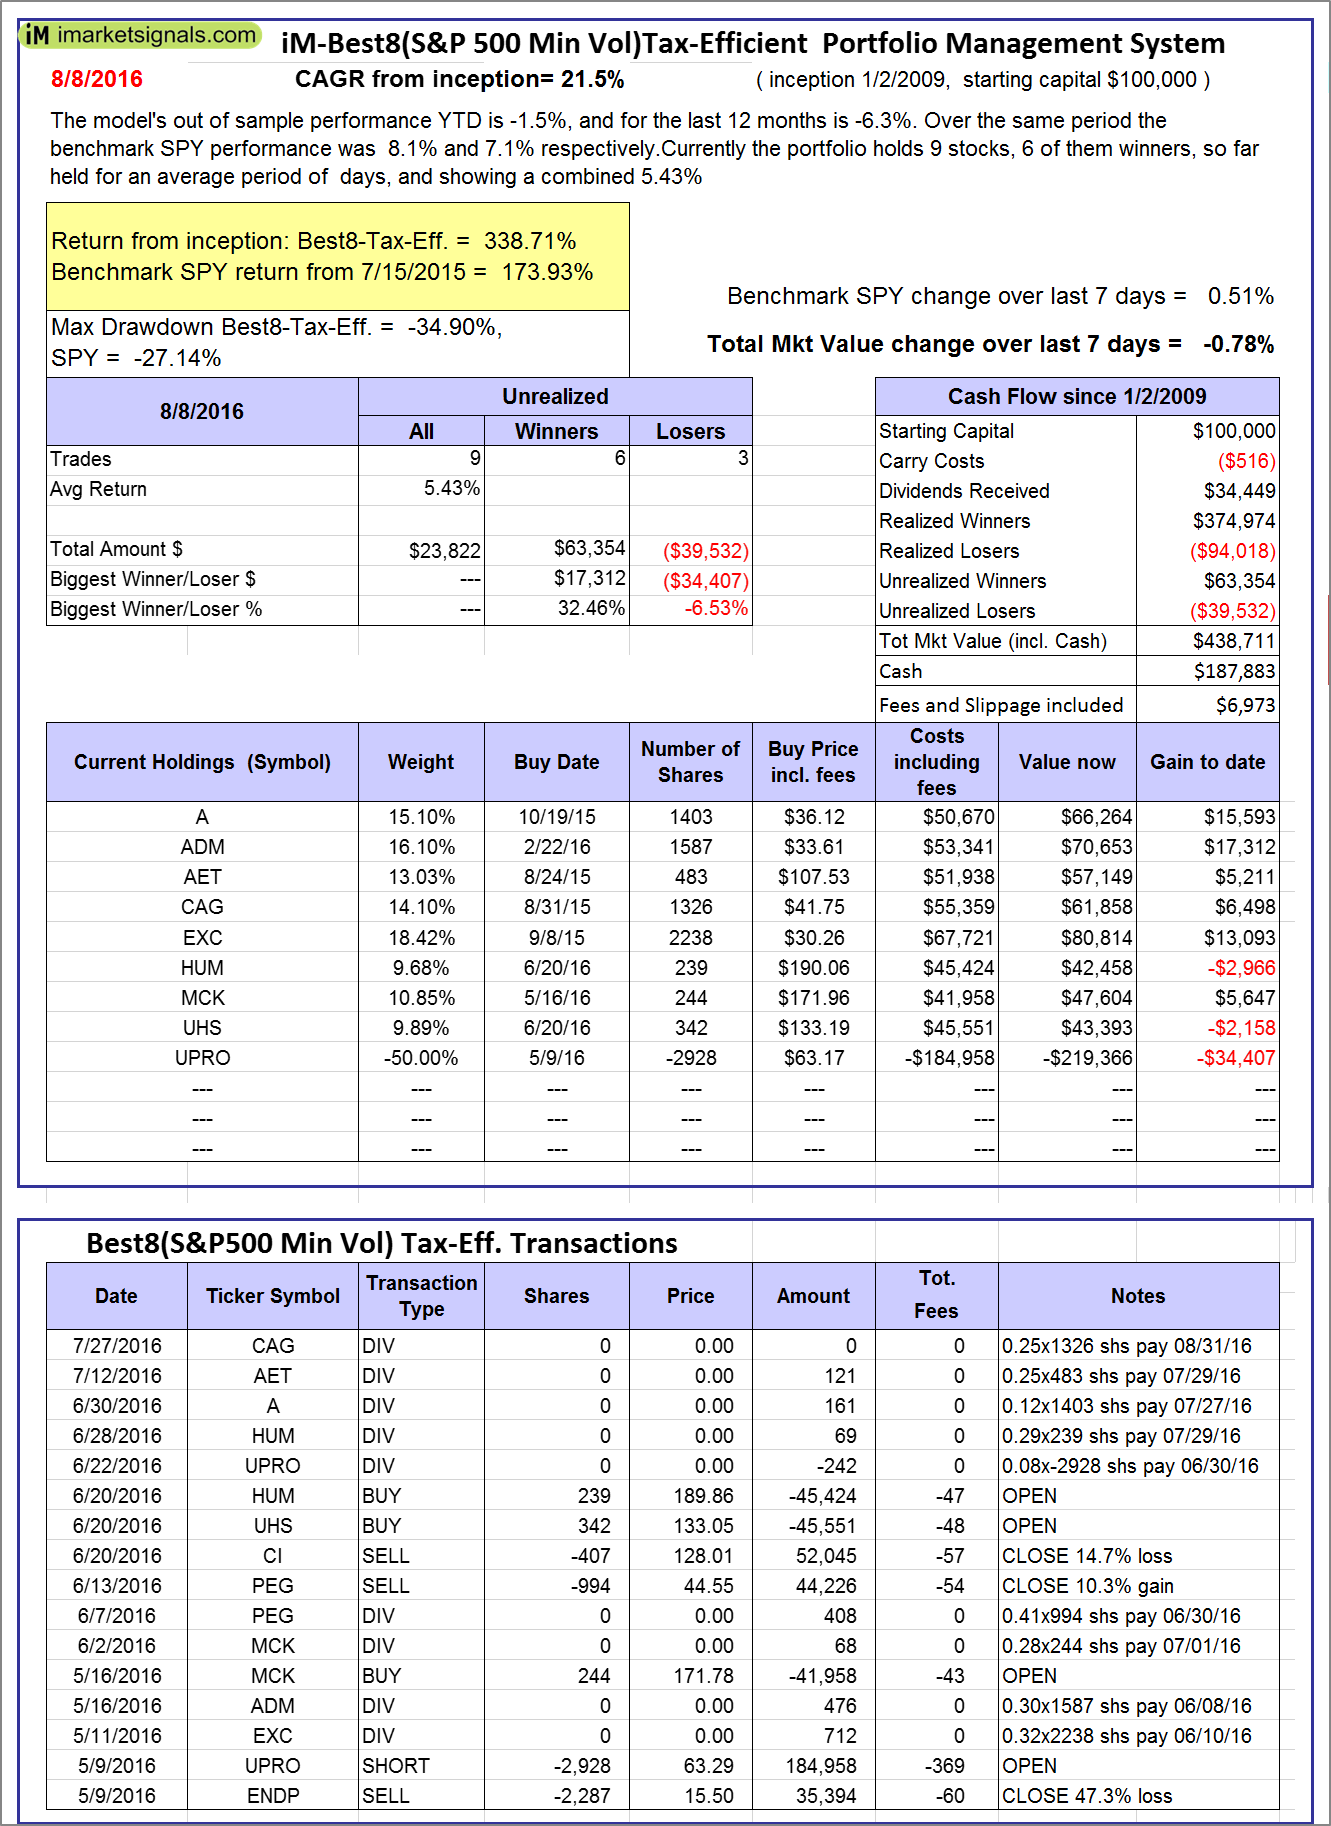 |
The iM-Best8(S&P500 Min Vol)Tax-Efficient The model’s out of sample performance YTD is -1.5%, and for the last 12 months is -6.3%. Over the same period the benchmark SPY performance was 8.1% and 7.1% respectively. Over the previous week the market value of iM-Best8(S&P 500)Tax-Eff. gained -0.78% at a time when SPY gained 0.51%. A starting capital of $100,000 at inception on 1/2/2009 would have grown to $438,711 which includes $187,883 cash and excludes $6,973 spent on fees and slippage. |
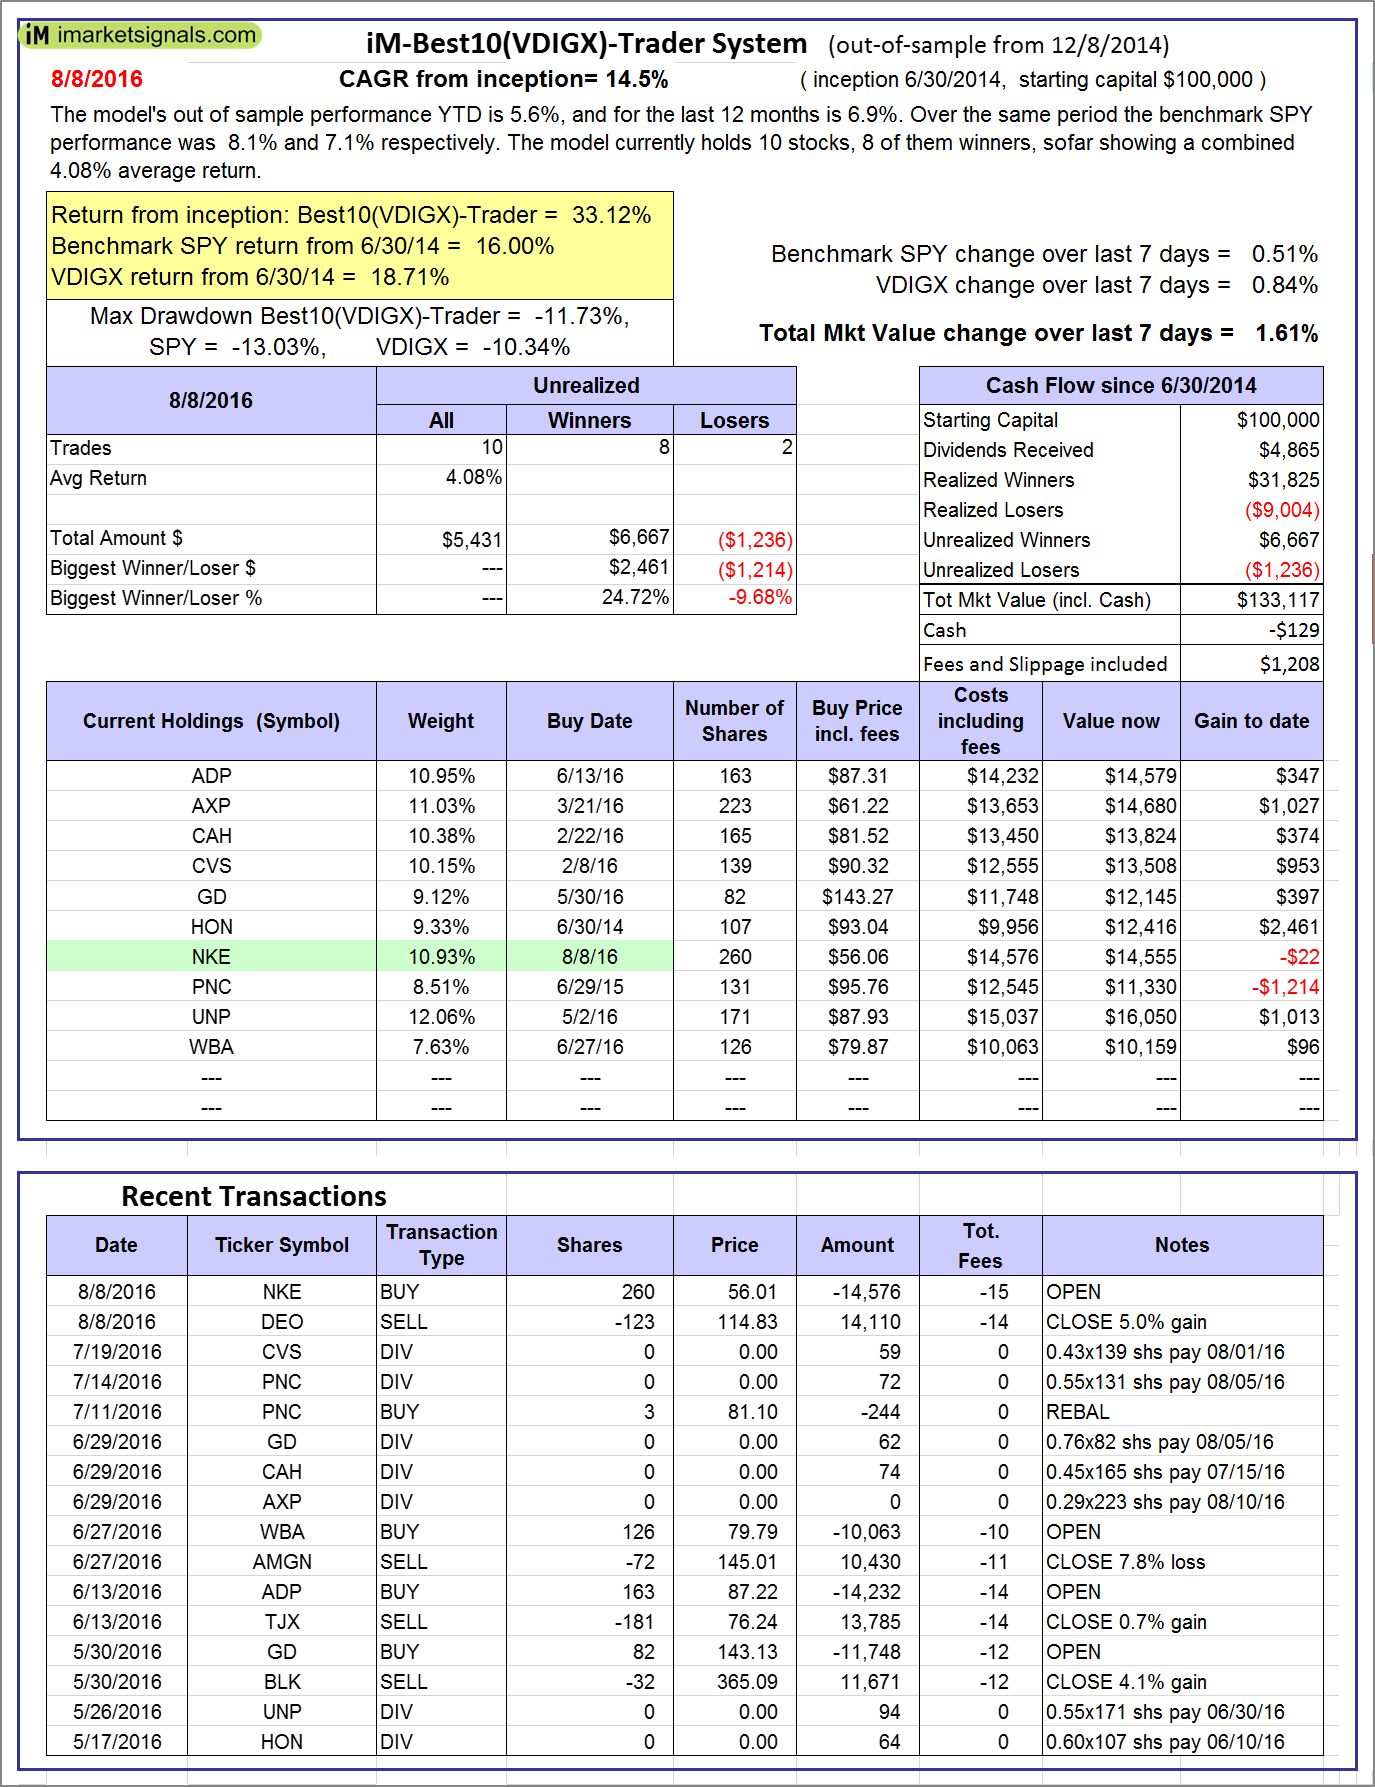 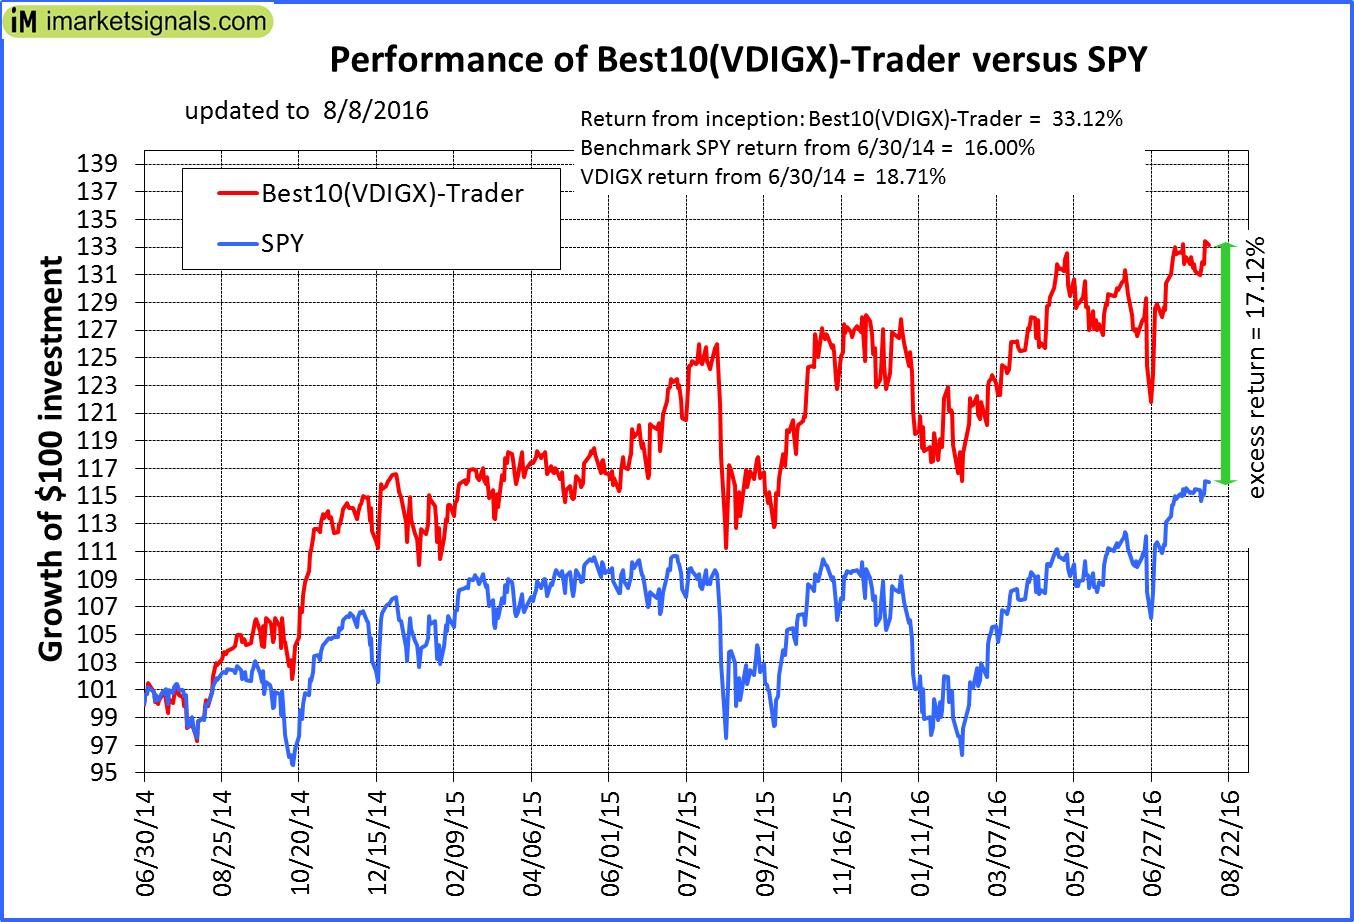 |
iM-Best10(VDIGX)-Trader: The model’s out of sample performance YTD is 5.6%, and for the last 12 months is 6.9%. Over the same period the benchmark SPY performance was 8.1% and 7.1% respectively. Since inception, on 7/1/2014, the model gained 33.12% while the benchmark SPY gained 16.00% and the ETF VDIGX gained 18.71% over the same period. Over the previous week the market value of iM-Best10(VDIGX) gained 1.61% at a time when SPY gained 0.51%. A starting capital of $100,000 at inception on 7/1/2014 would have grown to $133,117 which includes -$129 cash and excludes $1,208 spent on fees and slippage. |
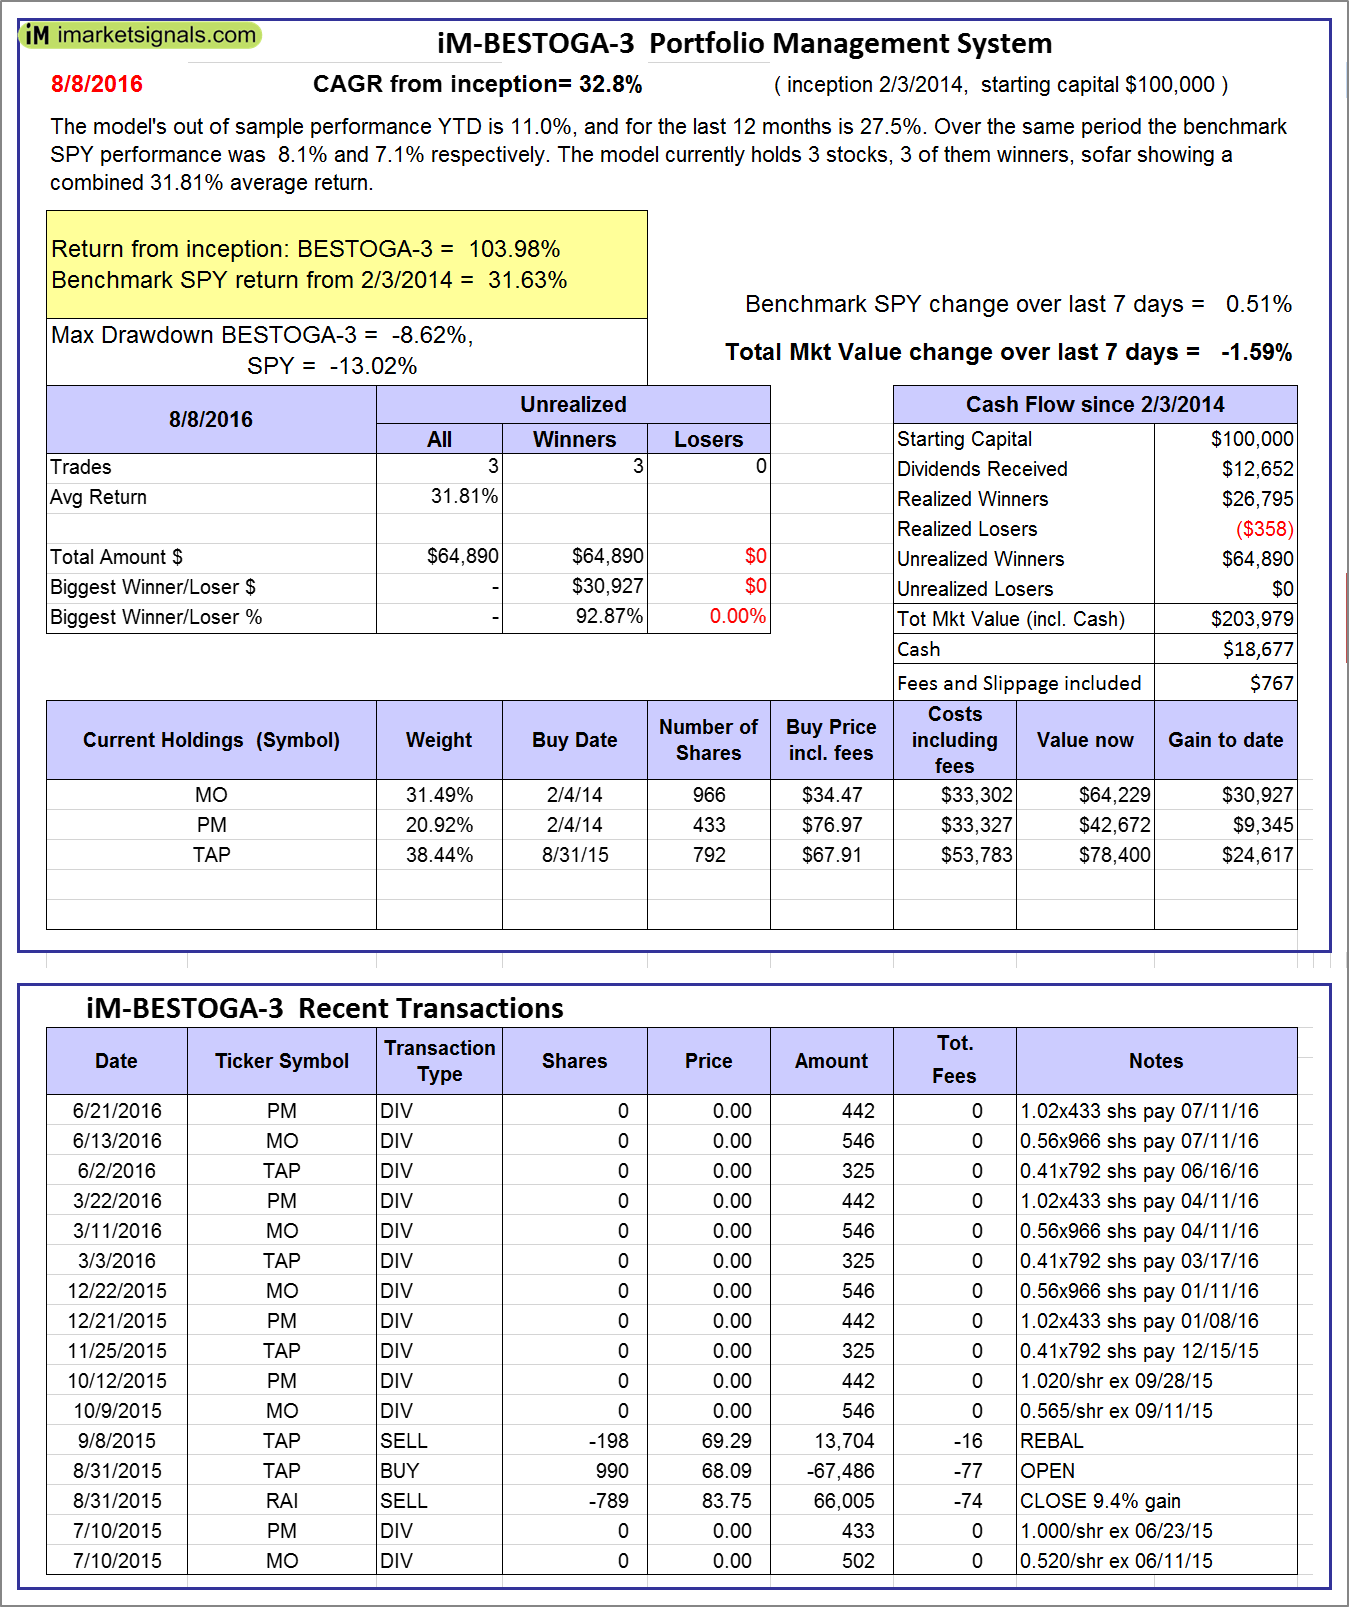 |
iM-BESTOGA-3: The model’s out of sample performance YTD is 11.0%, and for the last 12 months is 27.5%. Over the same period the benchmark SPY performance was 8.1% and 7.1% respectively. Over the previous week the market value of iM-BESTOGA-3 gained -1.59% at a time when SPY gained 0.51%. A starting capital of $100,000 at inception on 2/3/2014 would have grown to $203,979 which includes $18,677 cash and excludes $767 spent on fees and slippage. |
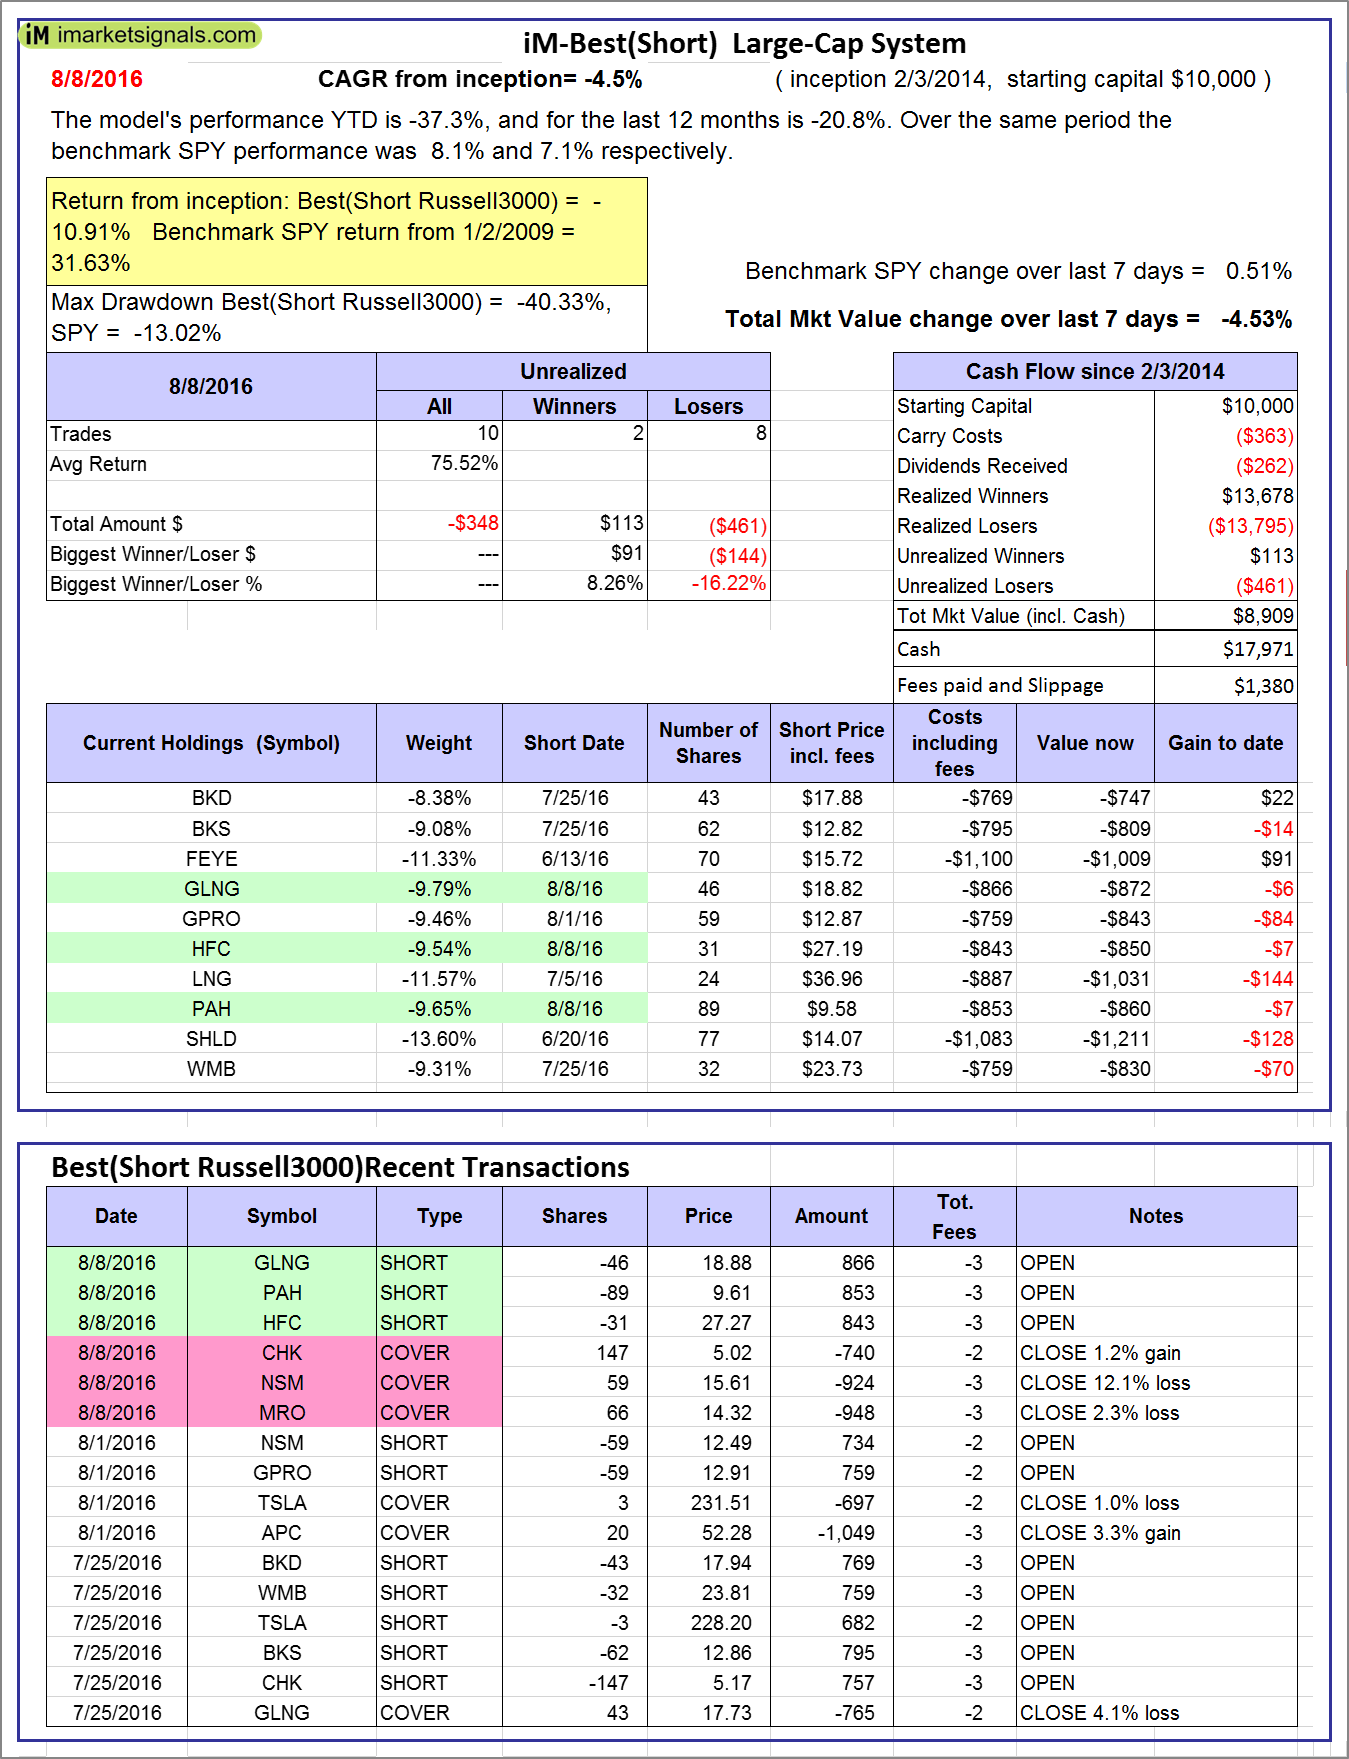 |
iM-Best10(Short Russell3000): The model’s performance YTD is -37.3%, and for the last 12 months is -20.8%. Over the same period the benchmark SPY performance was 8.1% and 7.1% respectively. Over the previous week the market value of iM-Best10(Short Russell3000) gained -4.53% at a time when SPY gained 0.51%. Over the period 2/3/2014 to 8/8/2016 the starting capital of $100,000 would have grown to $8,909 which includes $17,971 cash and excludes $1,380 spent on fees and slippage. |
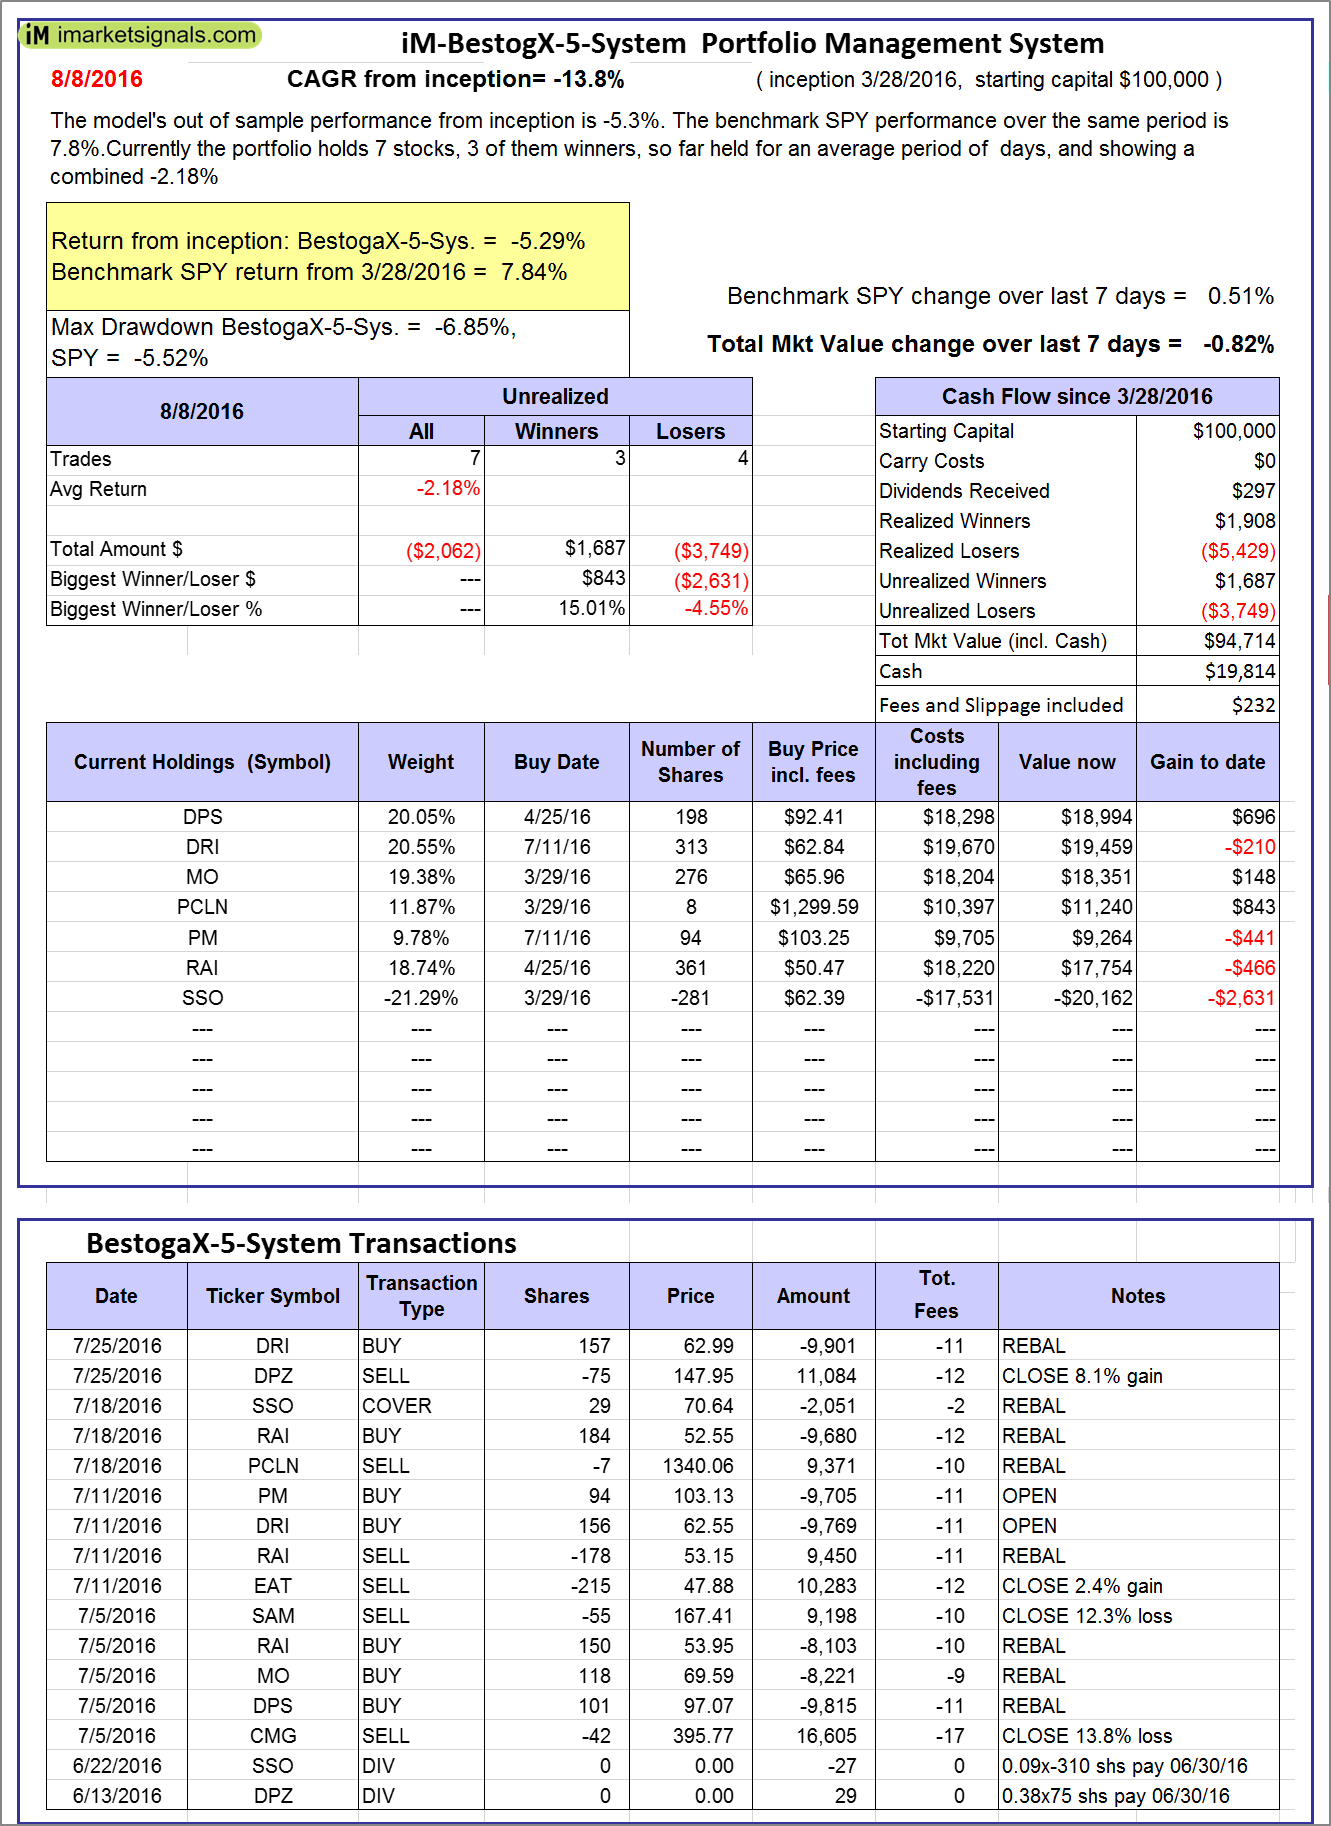 |
iM-BestogaX5-System: The model’s out of sample performance from inception is -5.3%. The benchmark SPY performance over the same period is 7.8%. Over the previous week the market value of iM-Best8(S&P 500)Tax-Eff. gained -0.82% at a time when SPY gained 0.51%. A starting capital of $100,000 at inception on 1/2/2009 would have grown to $94,714 which includes $19,814 cash and excludes $232 spent on fees and slippage. |
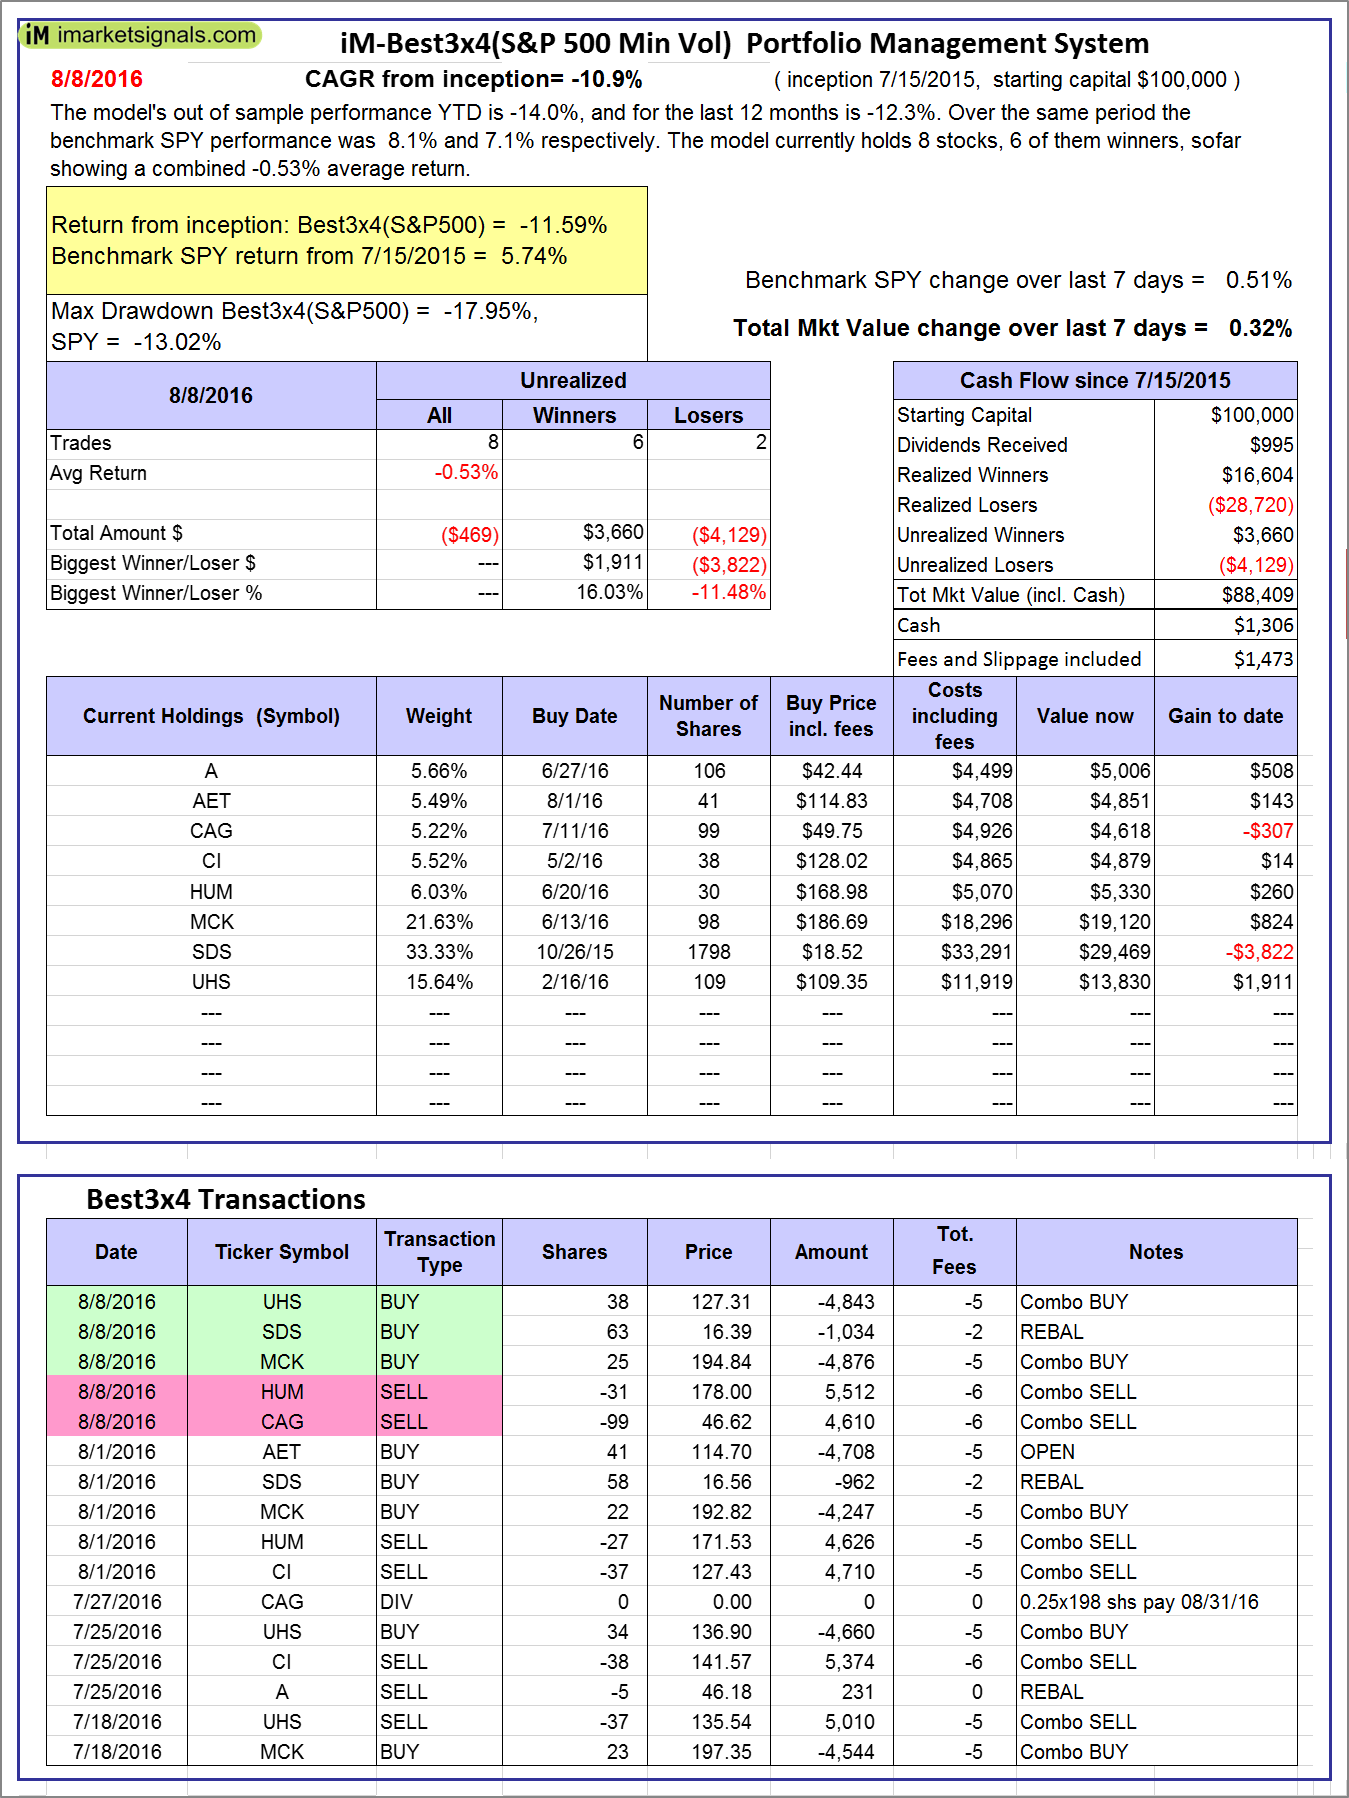 |
iM-Best3x4(S&P 500 Min Vol): The model’s out of sample performance YTD is -14.0%, and for the last 12 months is -12.3%. Over the same period the benchmark SPY performance was 8.1% and 7.1% respectively. Over the previous week the market value of iM-Best3x4 gained 0.32% at a time when SPY gained 0.51%. A starting capital of $100,000 at inception on 7/15/2015 would have grown to $88,409 which includes $1,306 cash and excludes $1,473 spent on fees and slippage. |
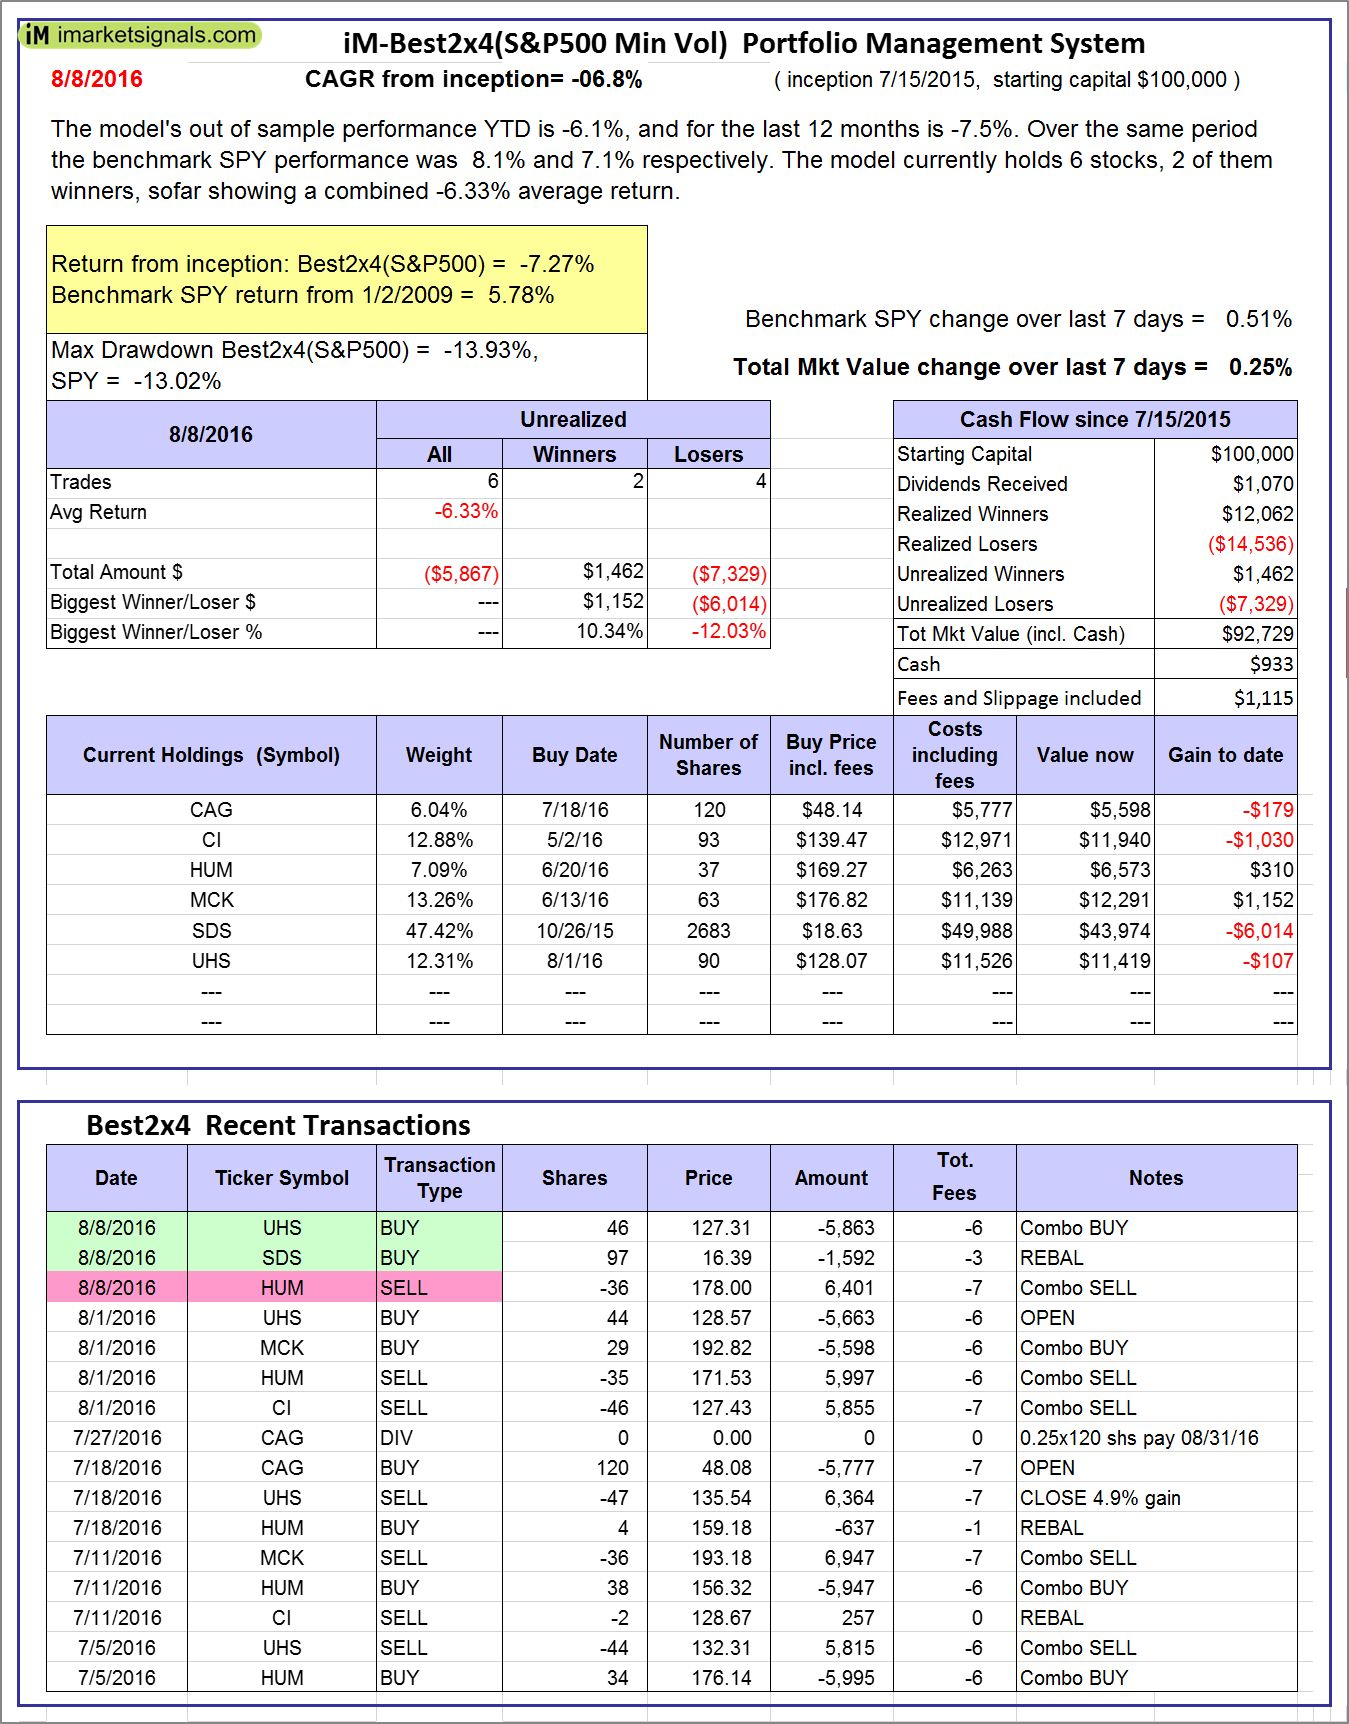 |
iM-Best2x4(S&P 500 Min Vol): The model’s out of sample performance YTD is -6.1%, and for the last 12 months is -7.5%. Over the same period the benchmark SPY performance was 8.1% and 7.1% respectively. Over the previous week the market value of iM-Best2x4 gained 0.25% at a time when SPY gained 0.51%. A starting capital of $100,000 at inception on 7/16/2015 would have grown to $92,729 which includes $933 cash and excludes $1,115 spent on fees and slippage. |
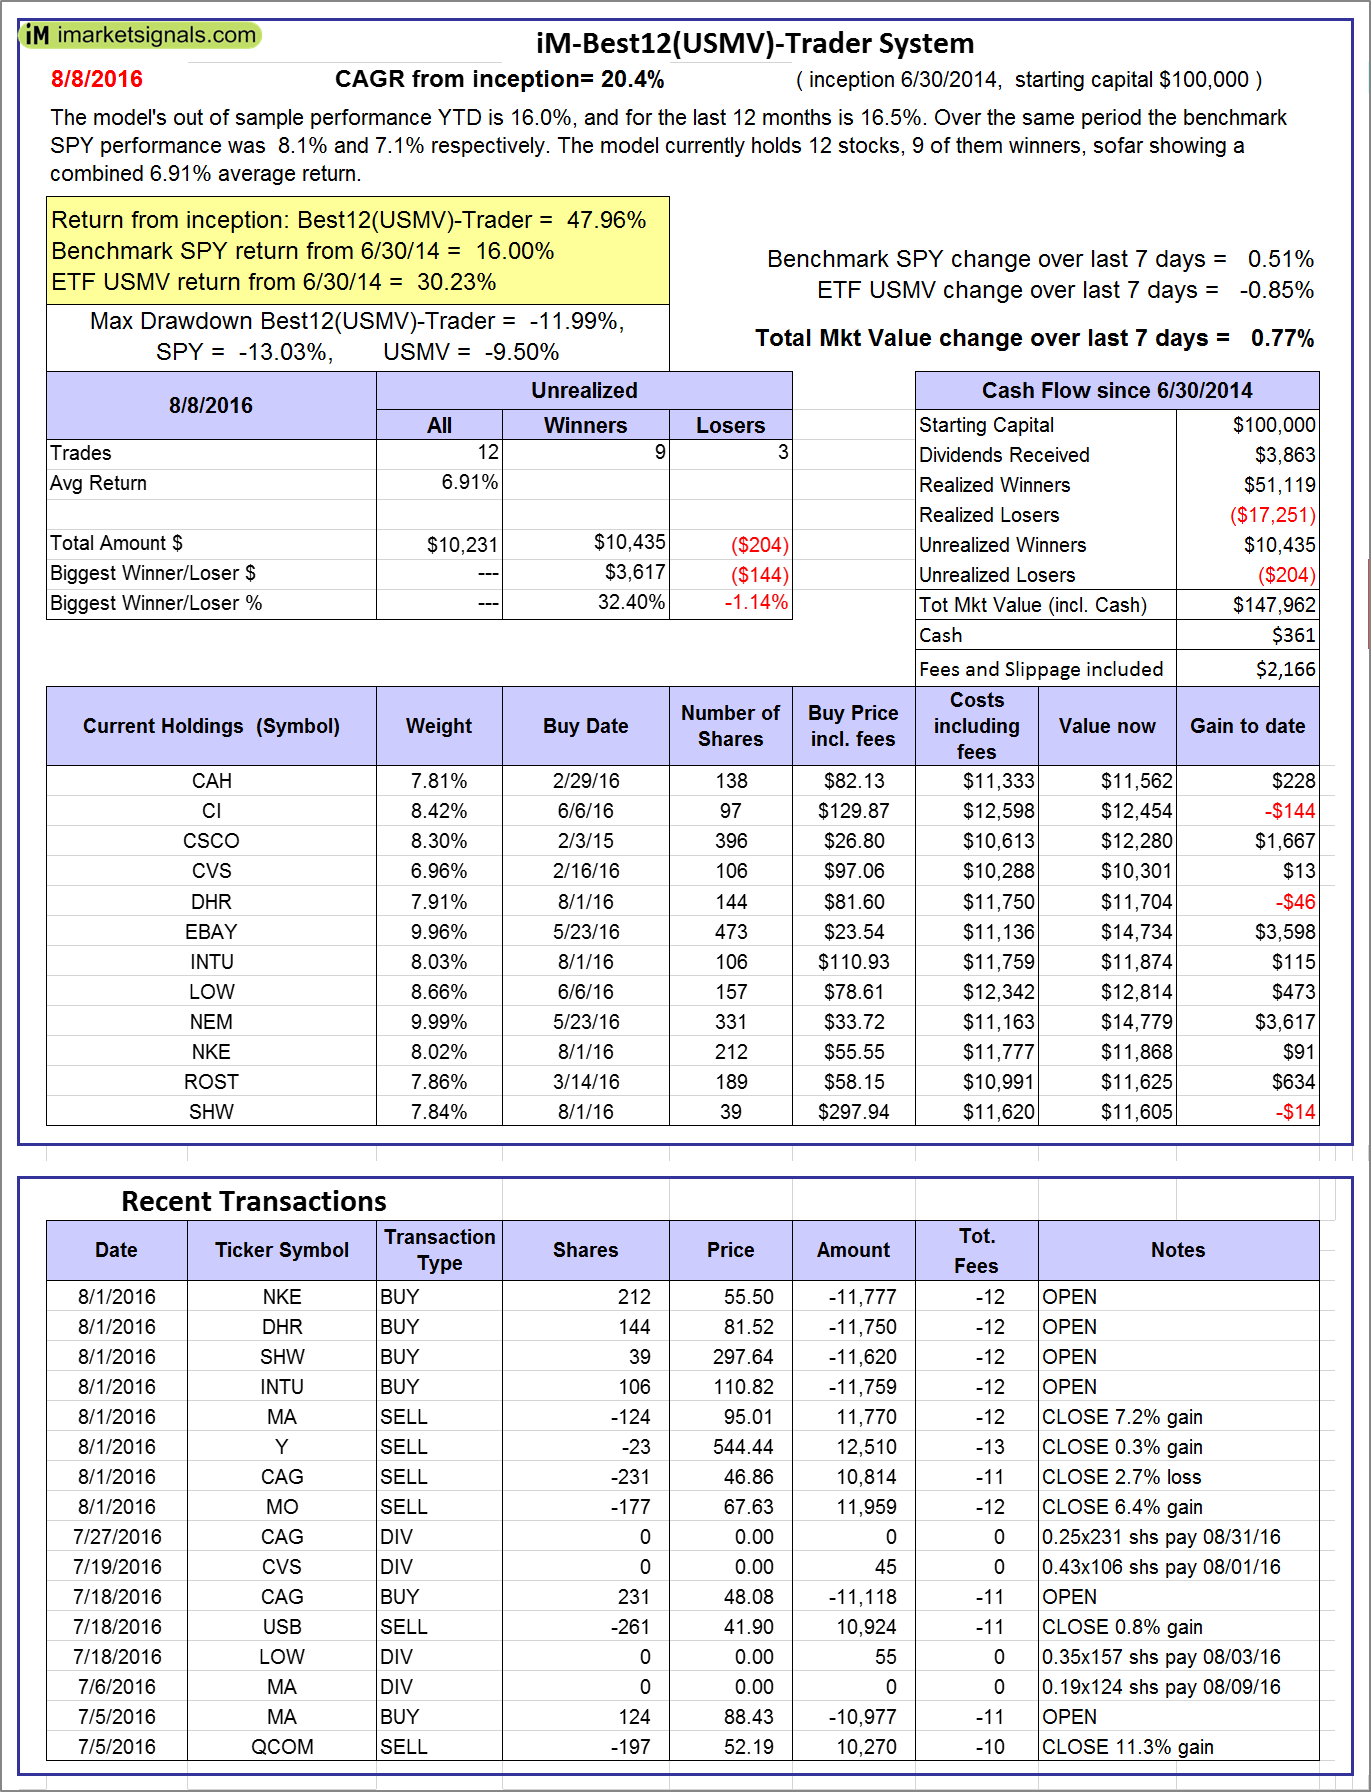 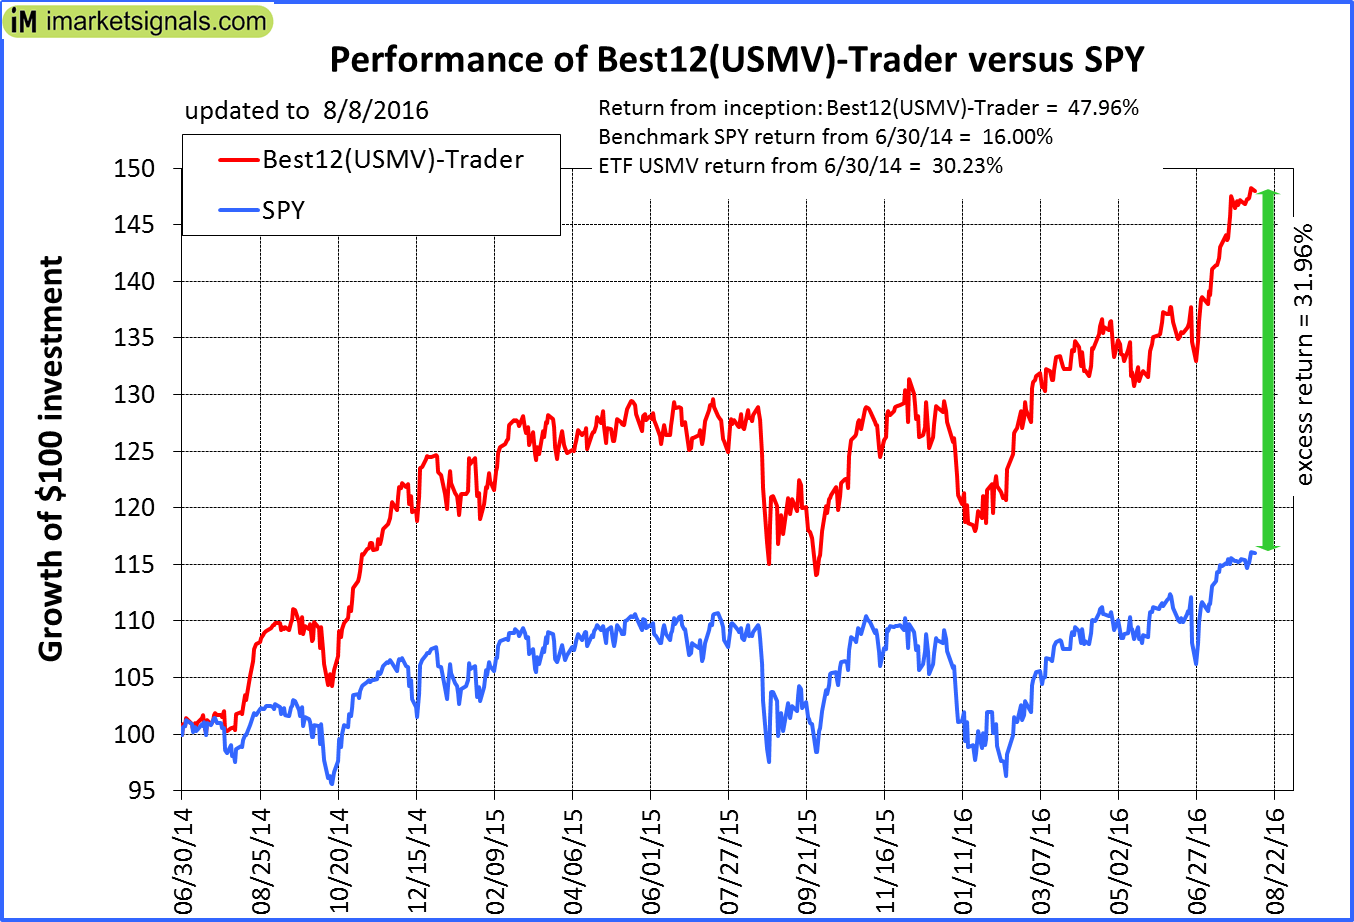 |
iM-Best12(USMV)-Trader: The model’s out of sample performance YTD is 16.0%, and for the last 12 months is 16.5%. Over the same period the benchmark SPY performance was 8.1% and 7.1% respectively. Since inception, on 7/1/2014, the model gained 47.96% while the benchmark SPY gained 16.00% and the ETF USMV gained 30.23% over the same period. Over the previous week the market value of iM-Best12(USMV)-Trader gained 0.77% at a time when SPY gained 0.51%. A starting capital of $100,000 at inception on 7/1/2014 would have grown to $147,962 which includes $361 cash and excludes $2,166 spent on fees and slippage. |
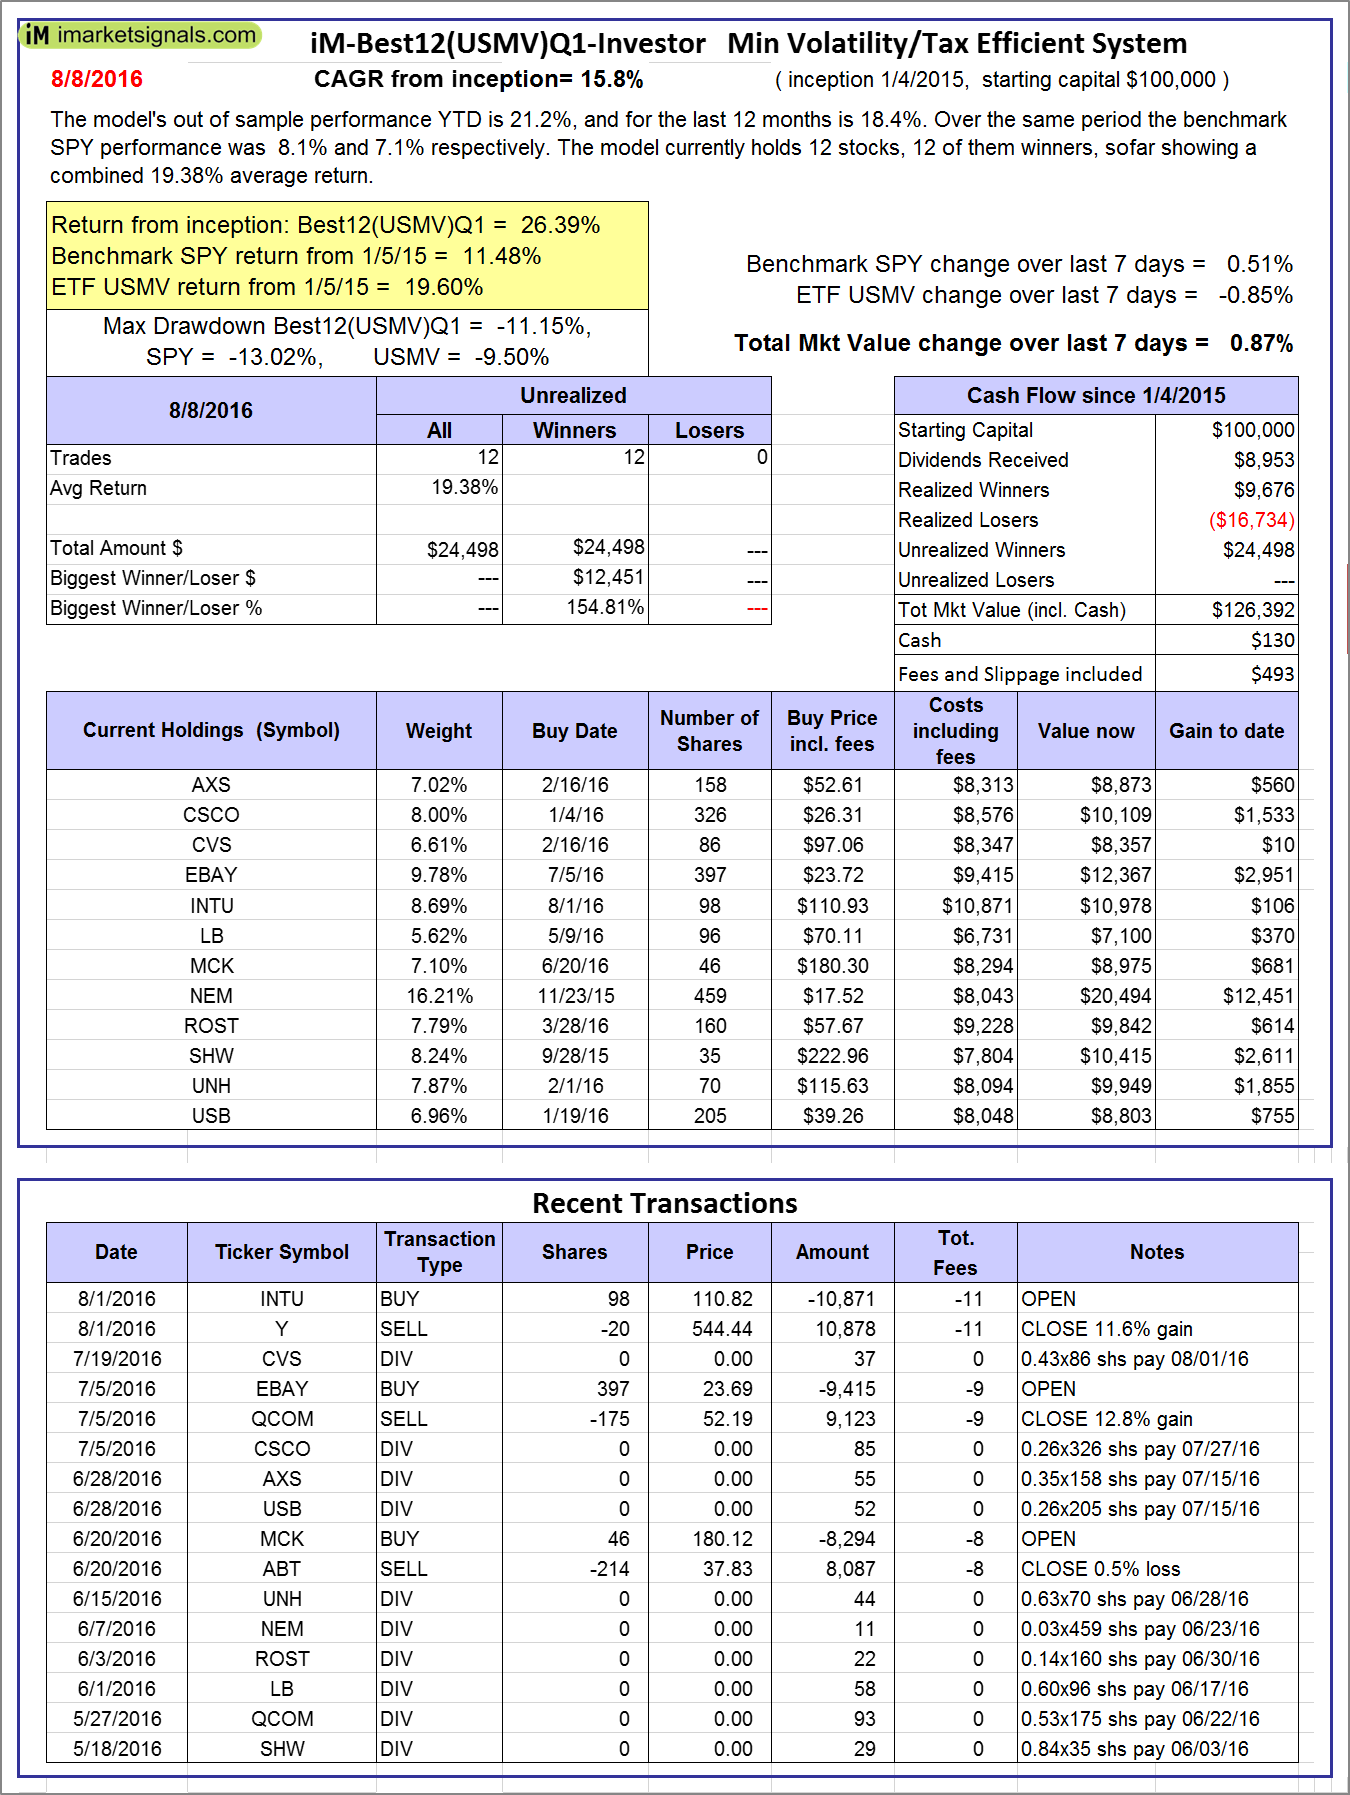 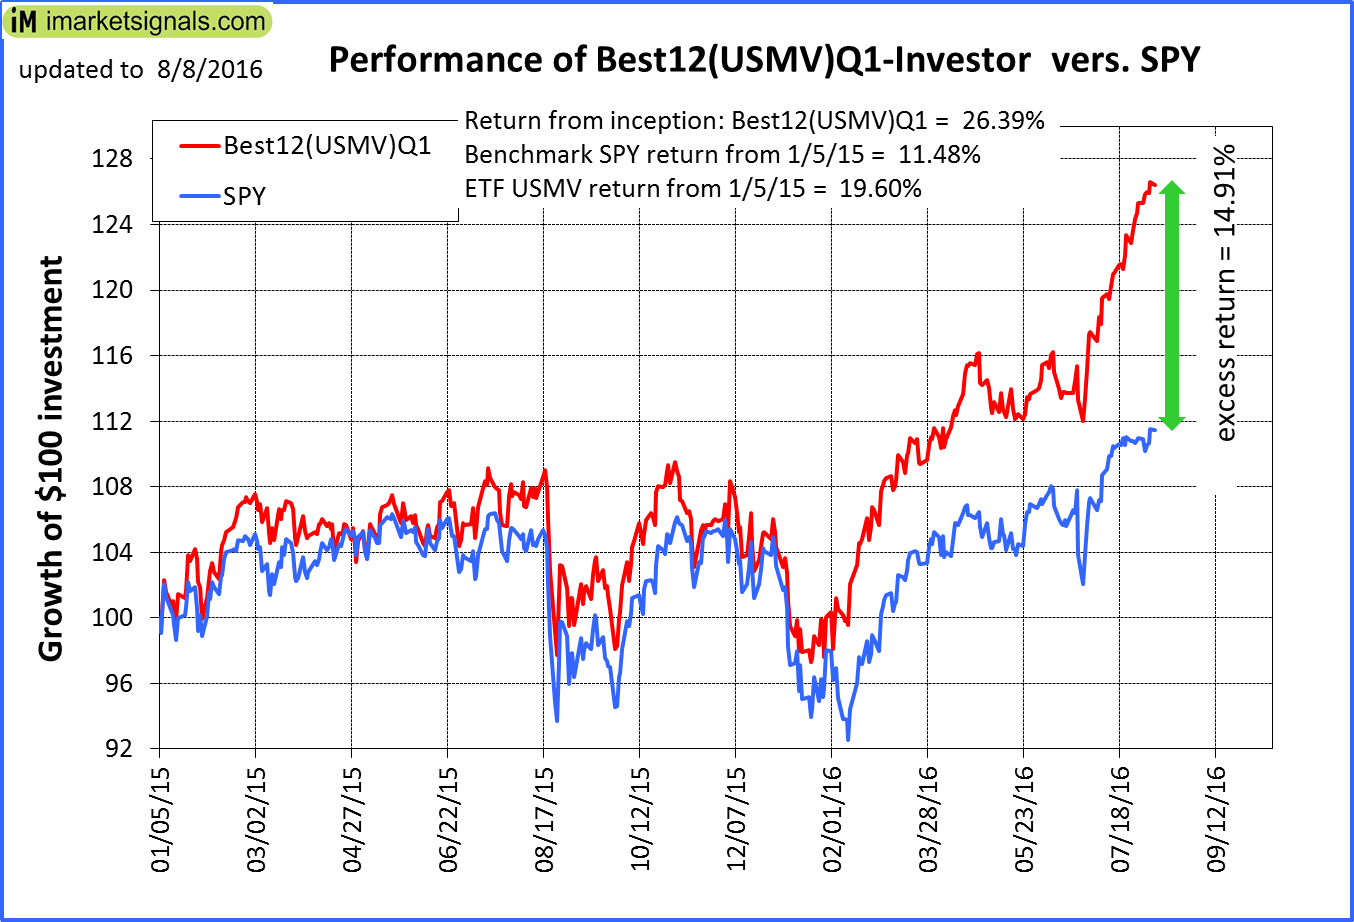 |
iM-Best12(USMV)Q1-Investor: The model’s out of sample performance YTD is 21.2%, and for the last 12 months is 18.4%. Over the same period the benchmark SPY performance was 8.1% and 7.1% respectively. Since inception, on 1/5/2015, the model gained 26.39% while the benchmark SPY gained 11.48% and the ETF USMV gained 19.60% over the same period. Over the previous week the market value of iM-Best12(USMV)Q1 gained 0.87% at a time when SPY gained 0.51%. A starting capital of $100,000 at inception on 1/5/2015 would have grown to $126,392 which includes $130 cash and excludes $493 spent on fees and slippage. |
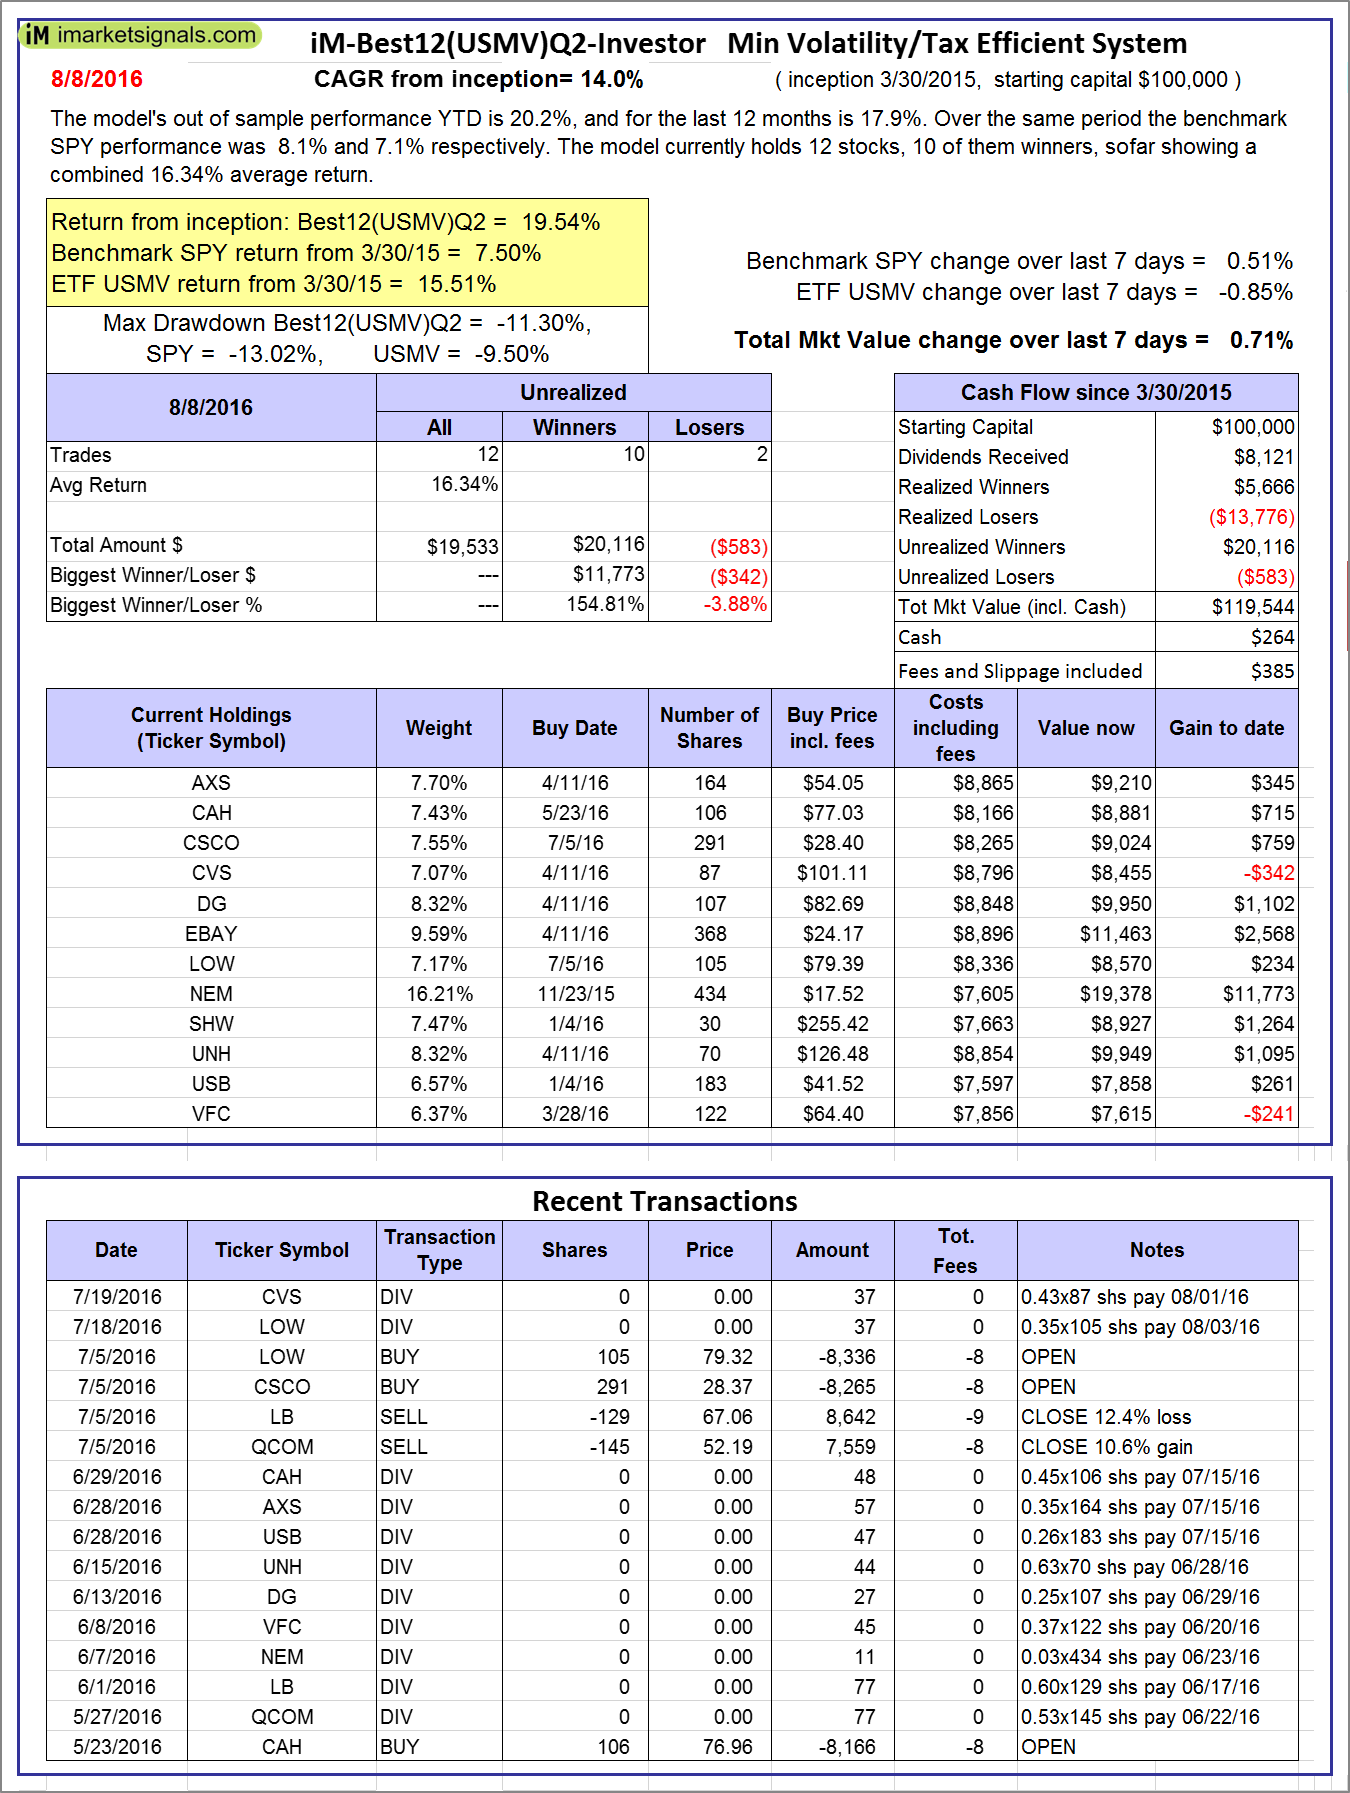  |
iM-Best12(USMV)Q2-Investor: The model’s out of sample performance YTD is 20.2%, and for the last 12 months is 17.9%. Over the same period the benchmark SPY performance was 8.1% and 7.1% respectively. Since inception, on 3/31/2015, the model gained 19.54% while the benchmark SPY gained 7.50% and the ETF USMV gained 15.51% over the same period. Over the previous week the market value of iM-Best12(USMV)Q2 gained 0.71% at a time when SPY gained 0.51%. A starting capital of $100,000 at inception on 3/31/2015 would have grown to $119,544 which includes $264 cash and excludes $385 spent on fees and slippage. |
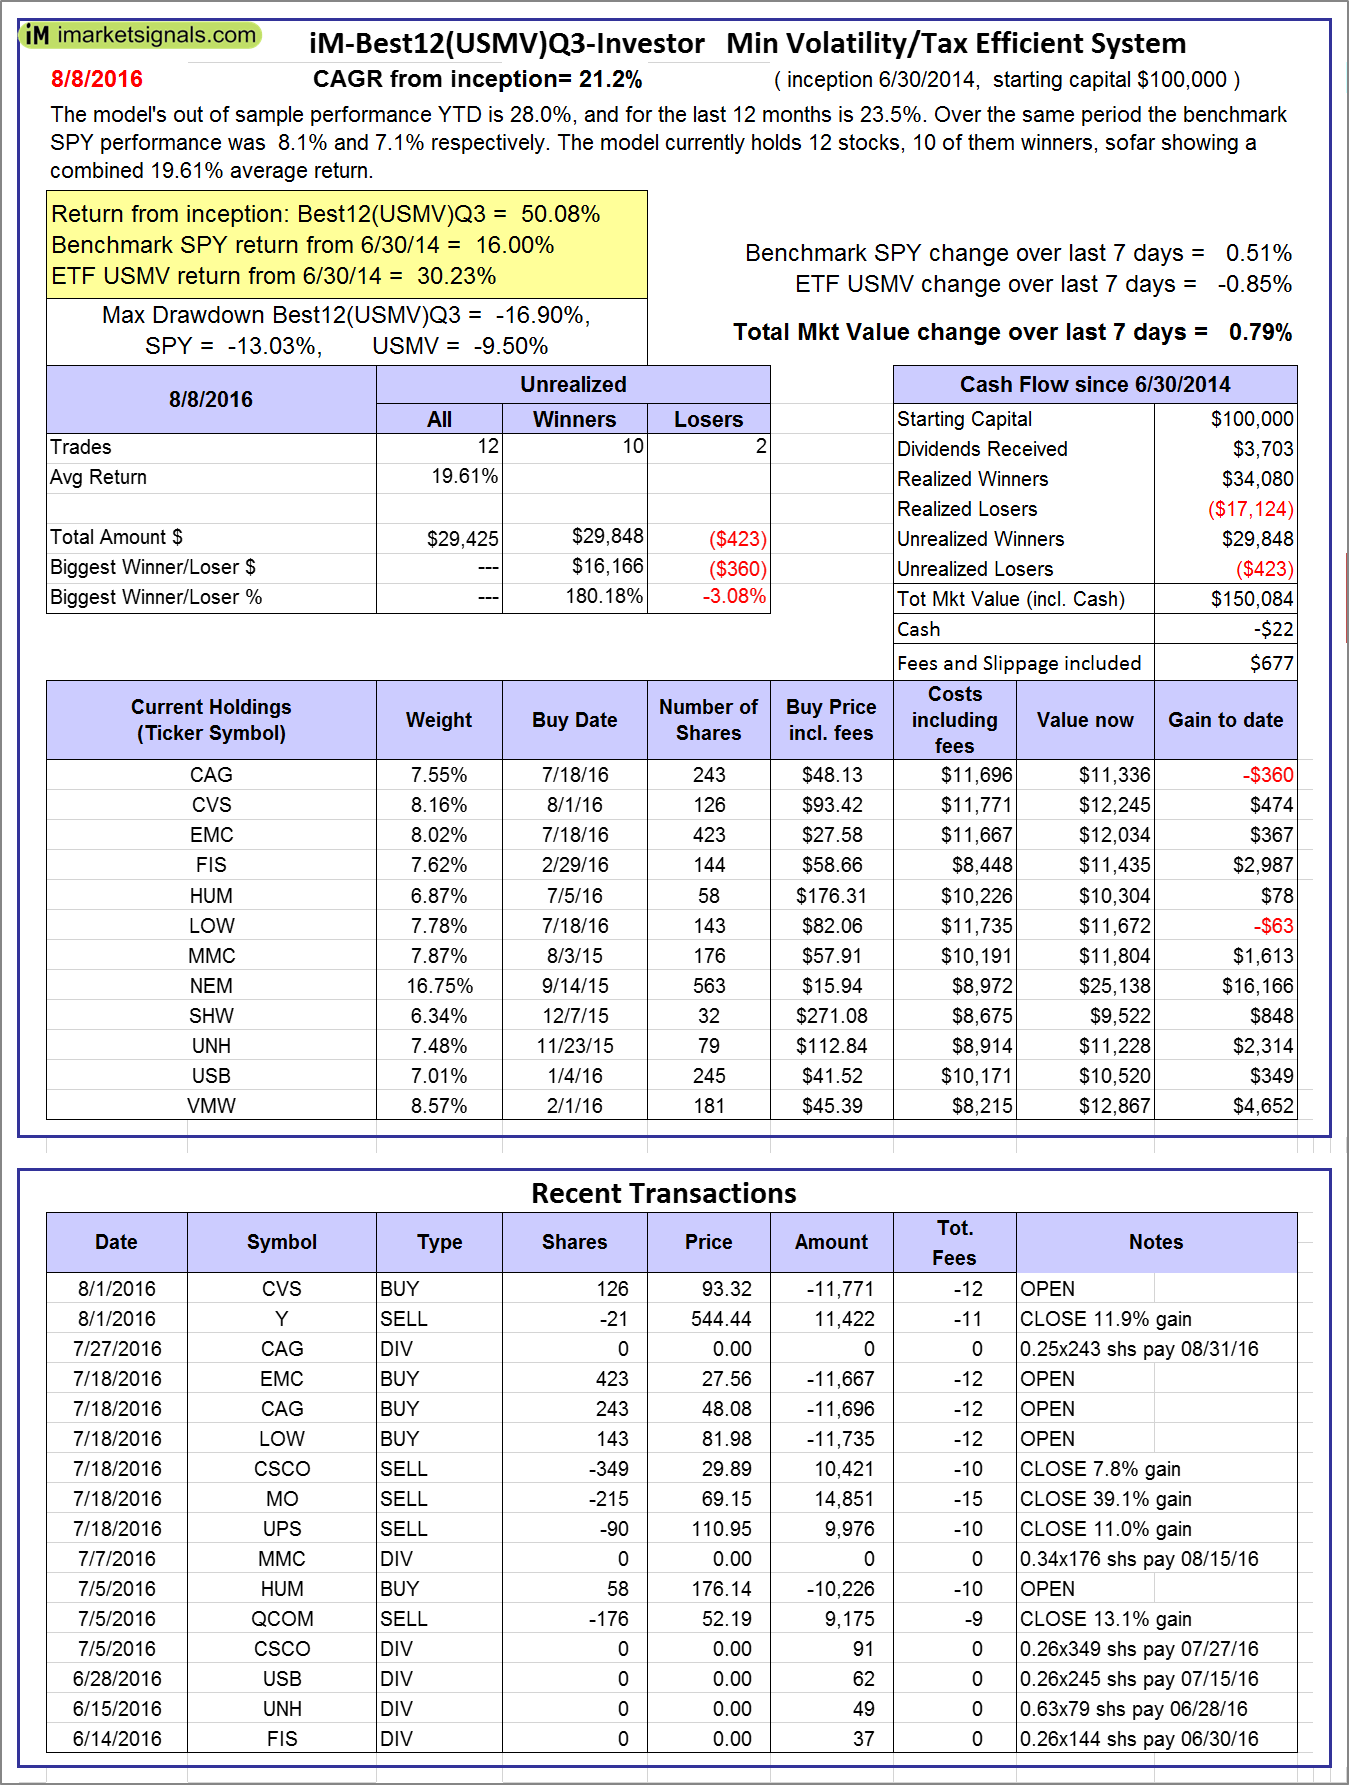 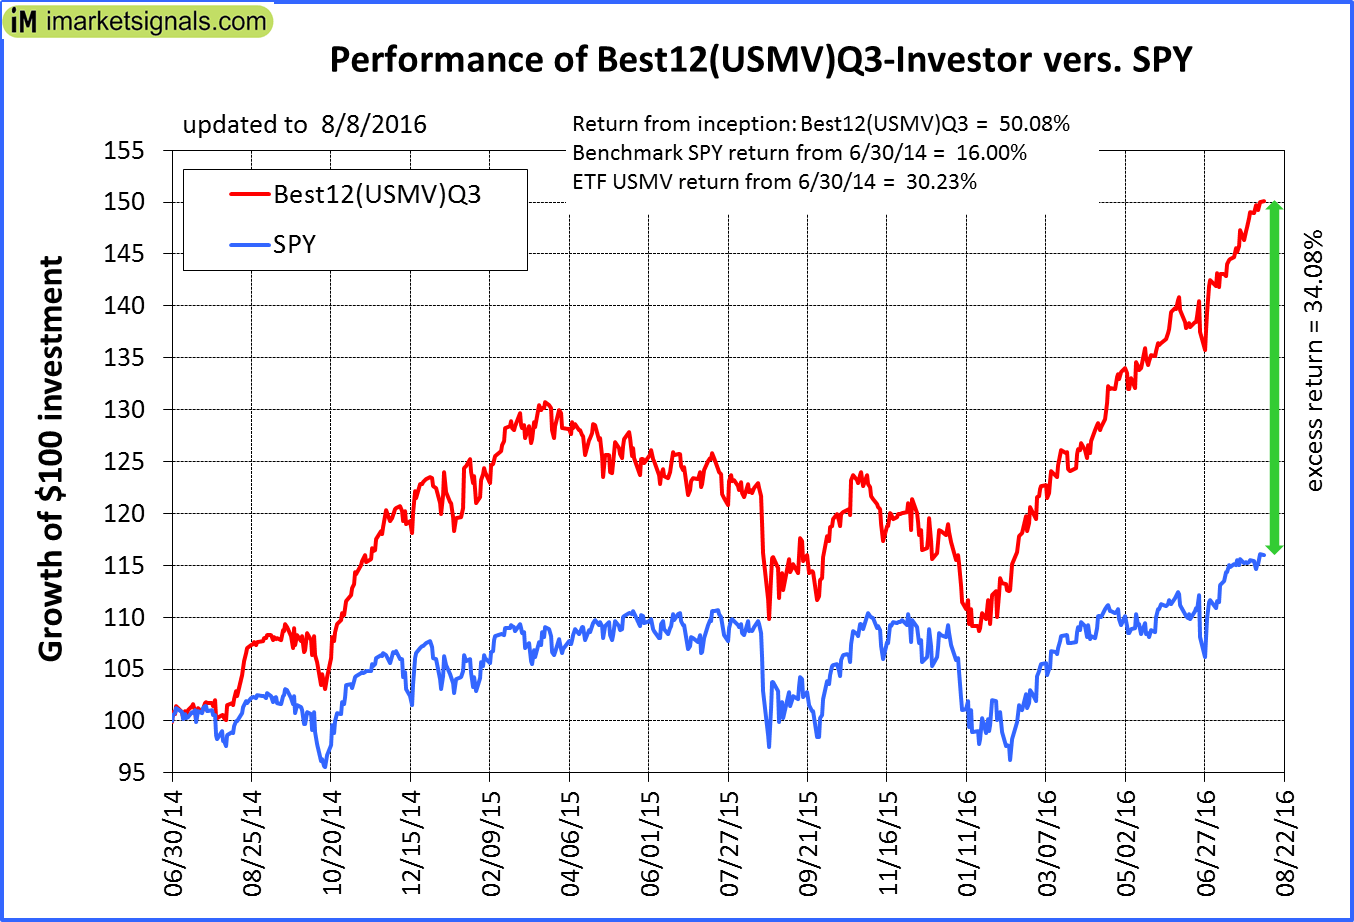 |
iM-Best12(USMV)Q3-Investor: The model’s out of sample performance YTD is 28.0%, and for the last 12 months is 23.5%. Over the same period the benchmark SPY performance was 8.1% and 7.1% respectively. Since inception, on 7/1/2014, the model gained 50.08% while the benchmark SPY gained 16.00% and the ETF USMV gained 30.23% over the same period. Over the previous week the market value of iM-Best12(USMV)Q3 gained 0.79% at a time when SPY gained 0.51%. A starting capital of $100,000 at inception on 7/1/2014 would have grown to $150,084 which includes -$22 cash and excludes $677 spent on fees and slippage. |
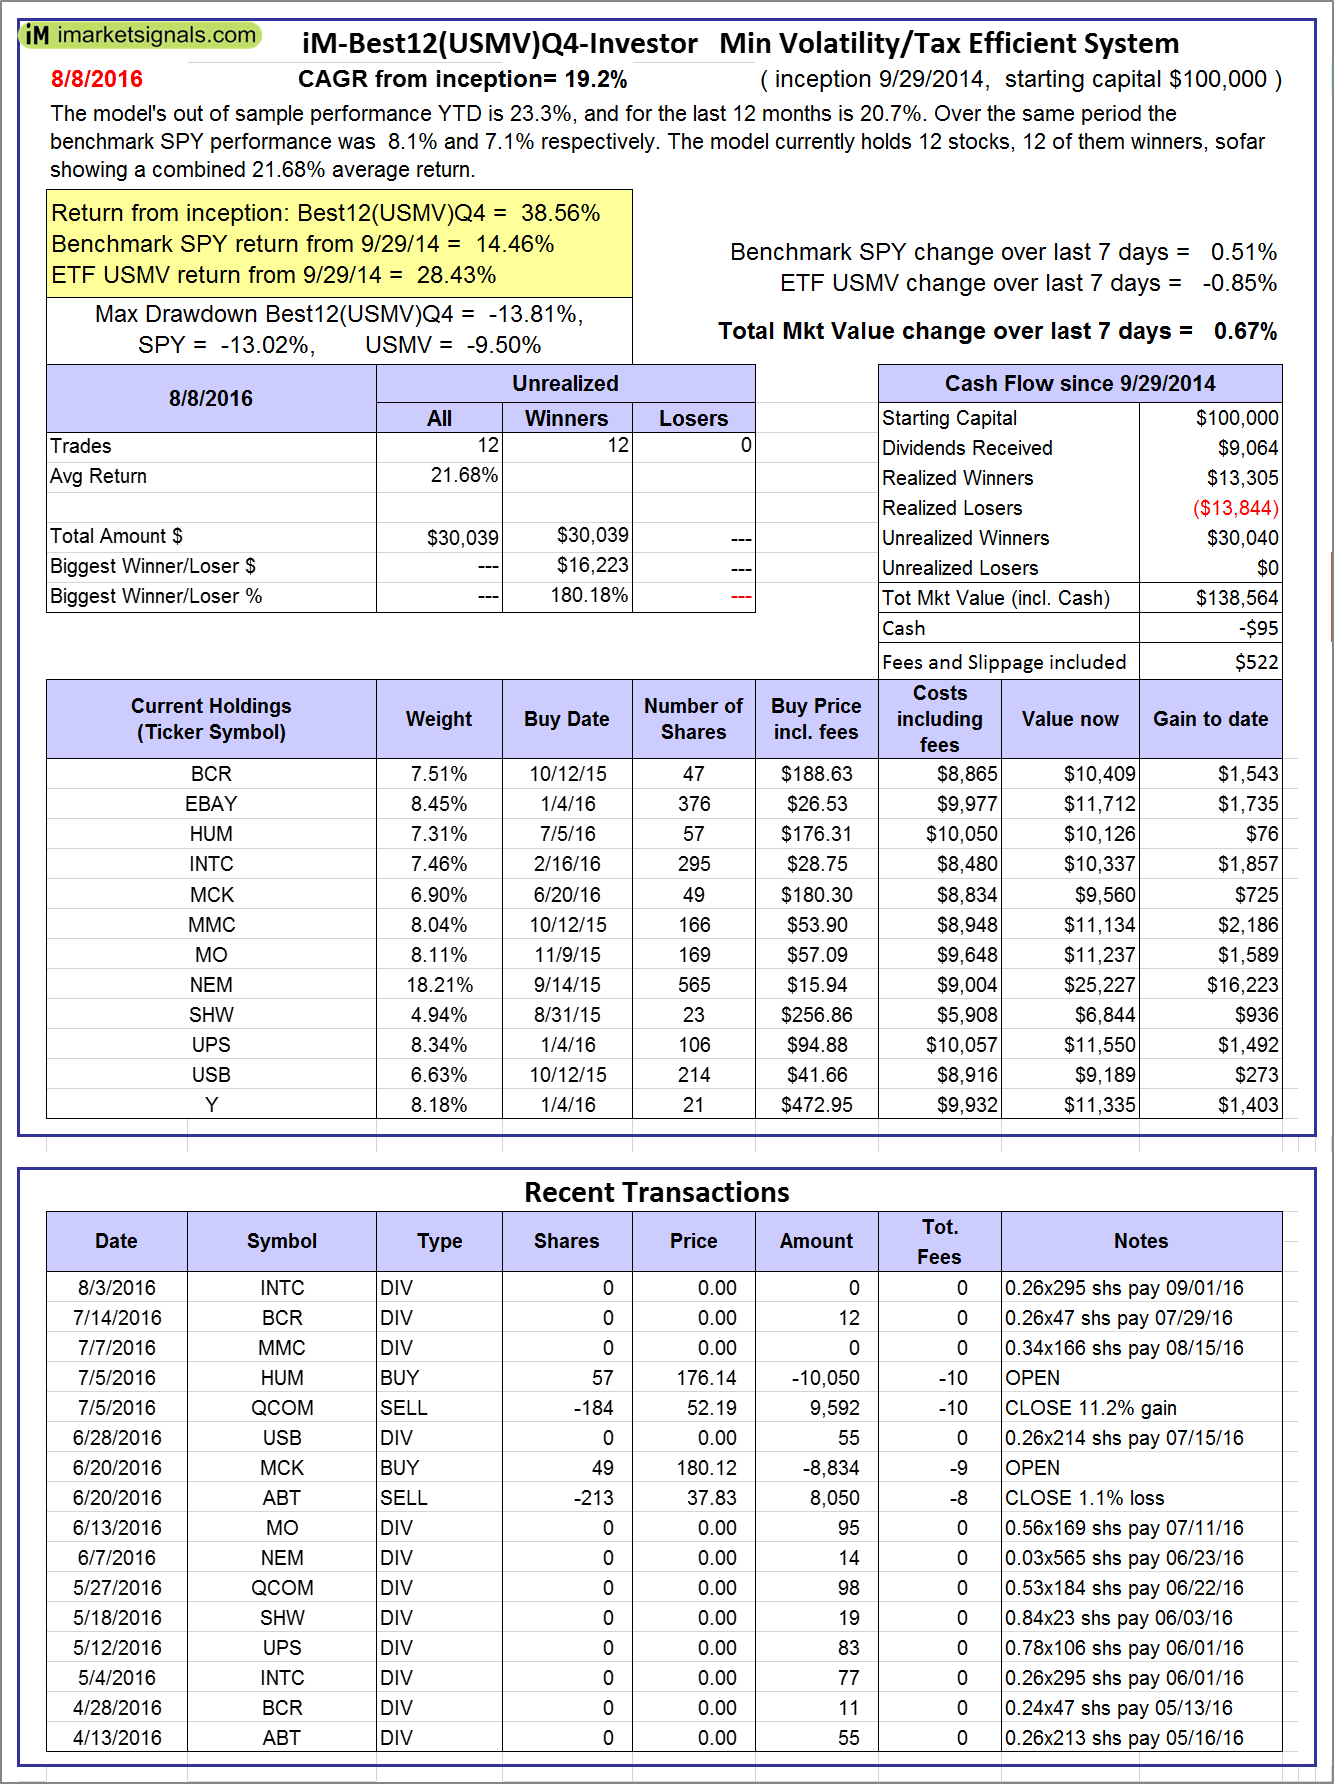 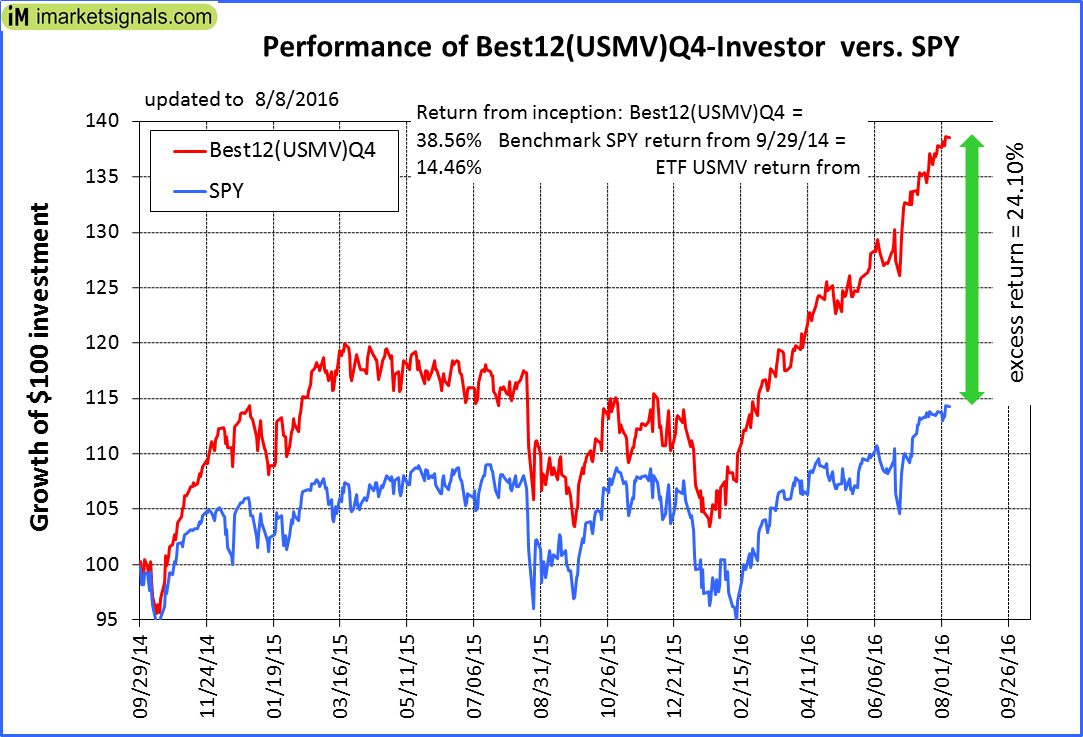 |
iM-Best12(USMV)Q4-Investor: Since inception, on 9/30/2014, the model gained 38.56% while the benchmark SPY gained 14.46% and the ETF USMV gained 28.43% over the same period. Over the previous week the market value of iM-Best12(USMV)Q4 gained 0.67% at a time when SPY gained 0.51%. A starting capital of $100,000 at inception on 9/30/2014 would have grown to $138,564 which includes -$95 cash and excludes $522 spent on fees and slippage. |
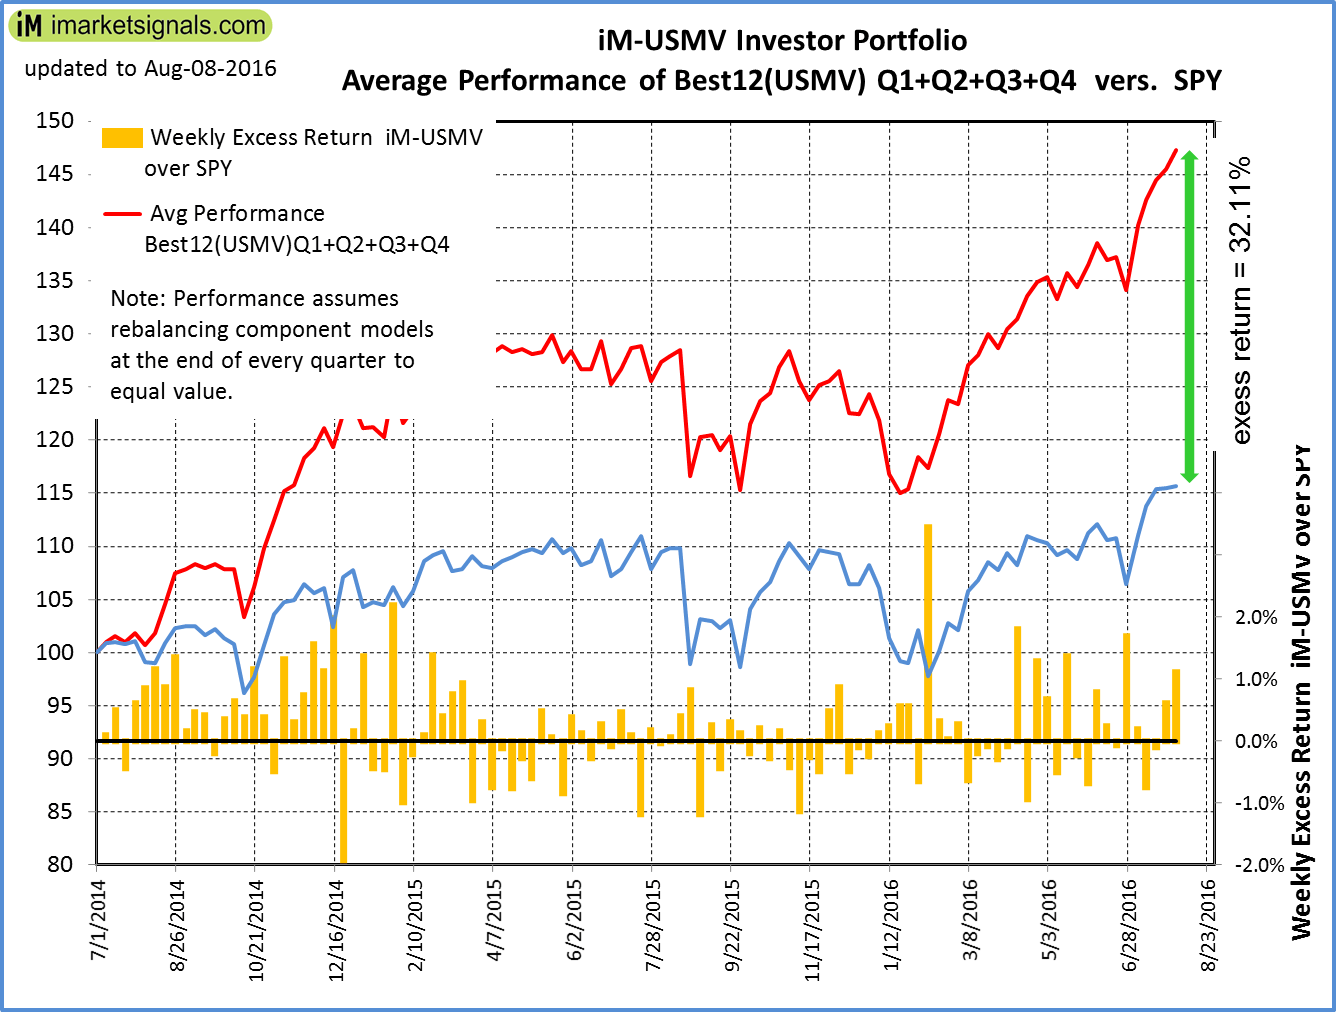 |
Average Performance of iM-Best12(USMV)Q1+Q2+Q3+Q4-Investor resulted in an excess return of 32.11% over SPY. (see iM-USMV Investor Portfolio) |
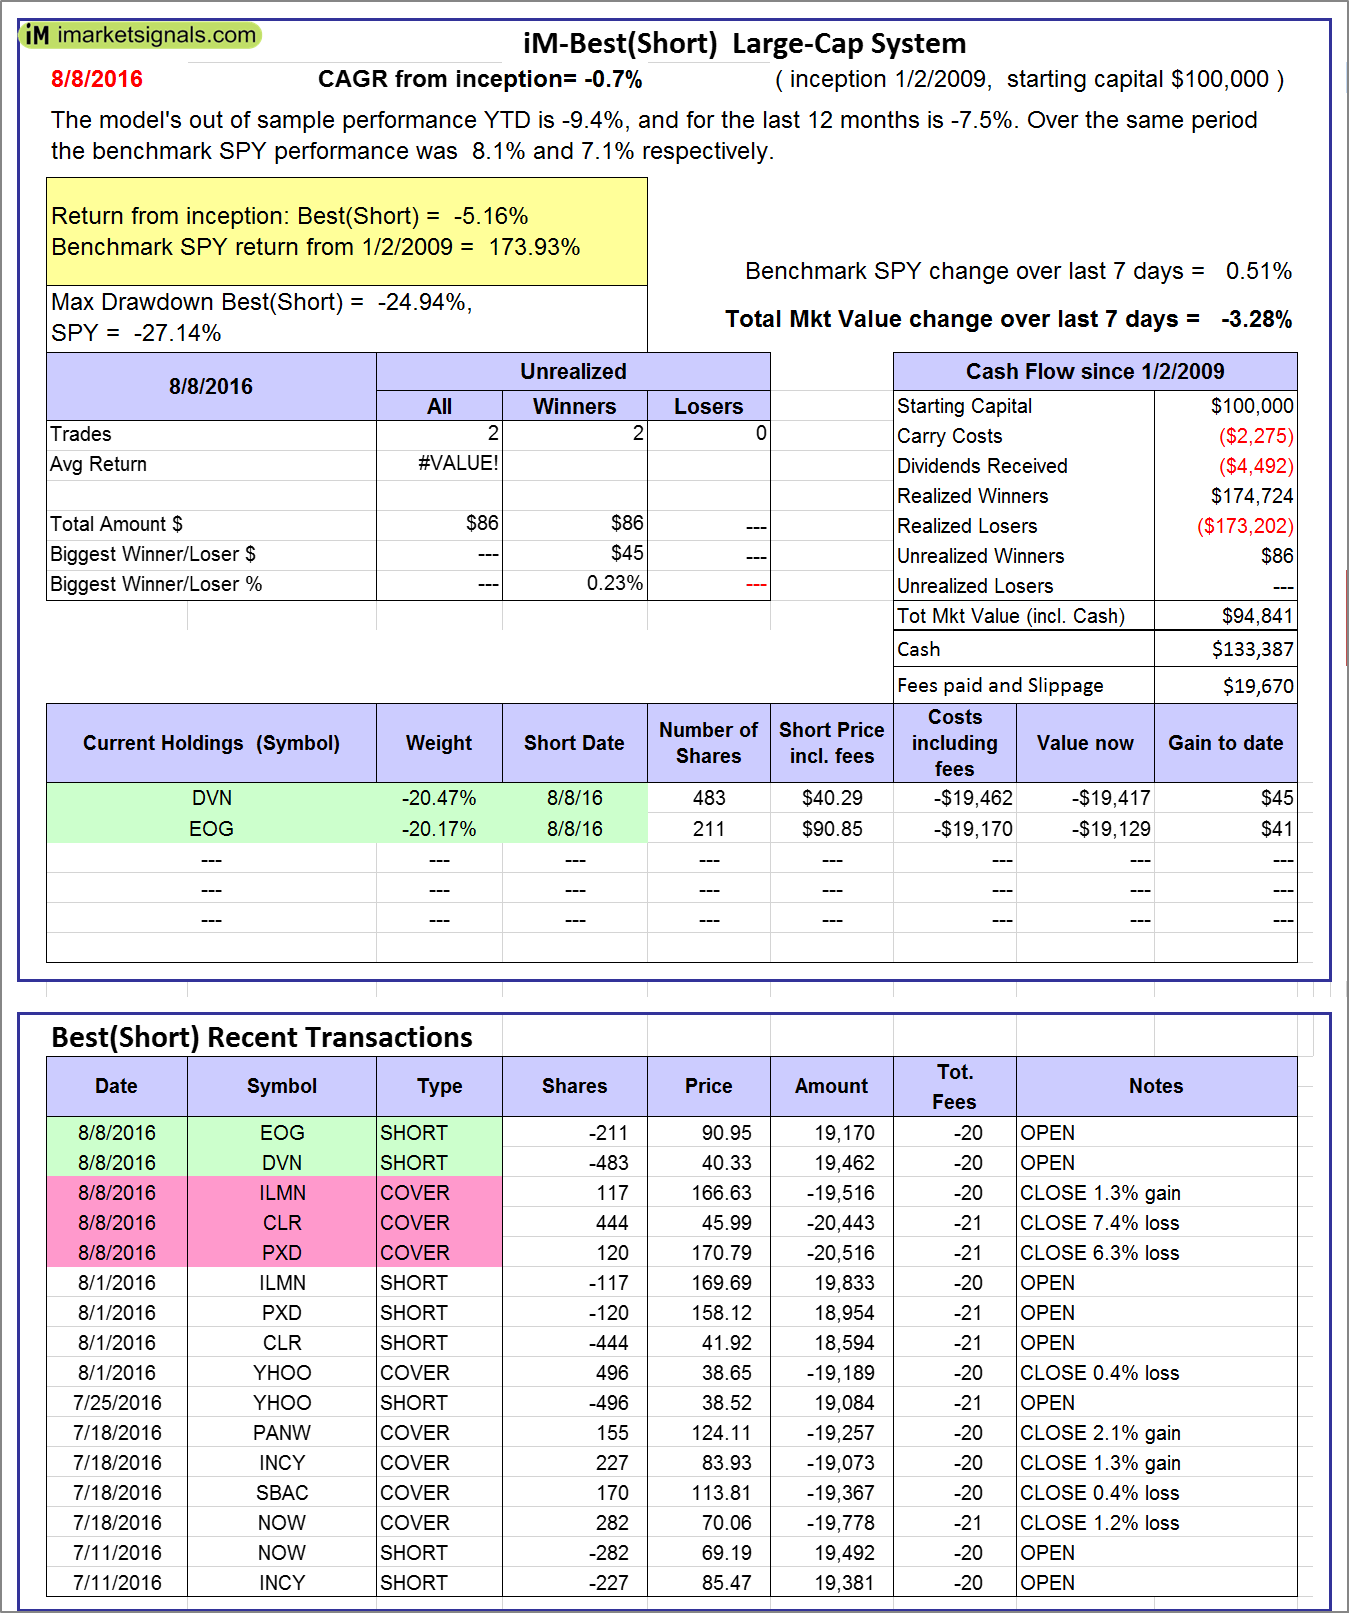 |
iM-Best(Short): The model’s out of sample performance YTD is -9.4%, and for the last 12 months is -7.5%. Over the same period the benchmark SPY performance was 8.1% and 7.1% respectively. Over the previous week the market value of iM-Best(Short) gained -3.28% at a time when SPY gained 0.51%. Over the period 1/2/2009 to 8/8/2016 the starting capital of $100,000 would have grown to $94,841 which includes $133,387 cash and excludes $19,670 spent on fees and slippage. |
iM-Best Reports – 8/8/2016
Posted in pmp SPY-SH
Leave a Reply
You must be logged in to post a comment.