
  |
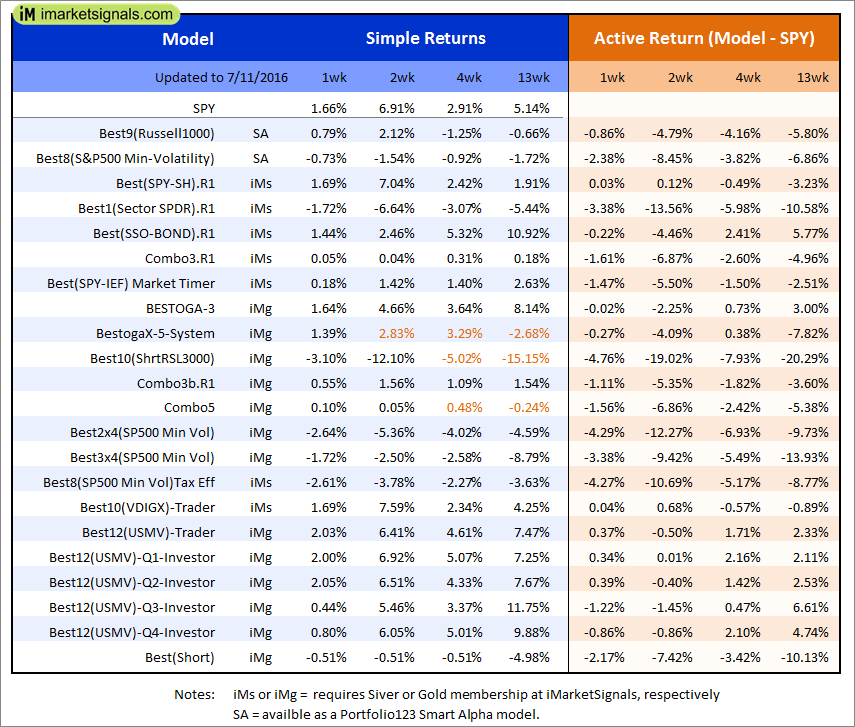
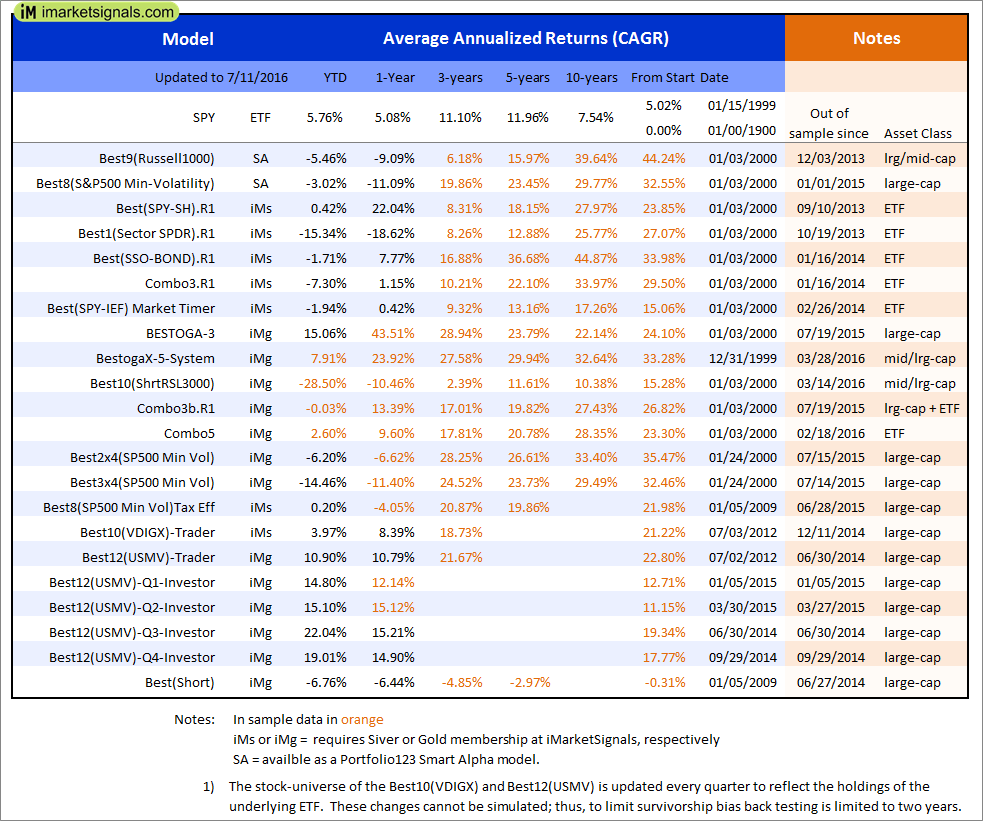
Out of sample performance summary of our models for the past 1, 2, 4 and 13 week periods. The active active return indicates how the models over- or underperformed the benchmark ETF SPY. Also the YTD, and the 1-, 3-, 5- and 10-year annualized returns are shown in the second table |
 |
iM-Best(SPY-SH).R1: The model’s out of sample performance YTD is 0.4%, and for the last 12 months is 22.2%. Over the same period the benchmark SPY performance was 5.8% and 5.1% respectively. Over the previous week the market value of Best(SPY-SH) gained 2.43% at a time when SPY gained 2.39%. A starting capital of $100,000 at inception on 1/2/2009 would have grown to $436,658 which includes -$7,214 cash and excludes $15,358 spent on fees and slippage. |
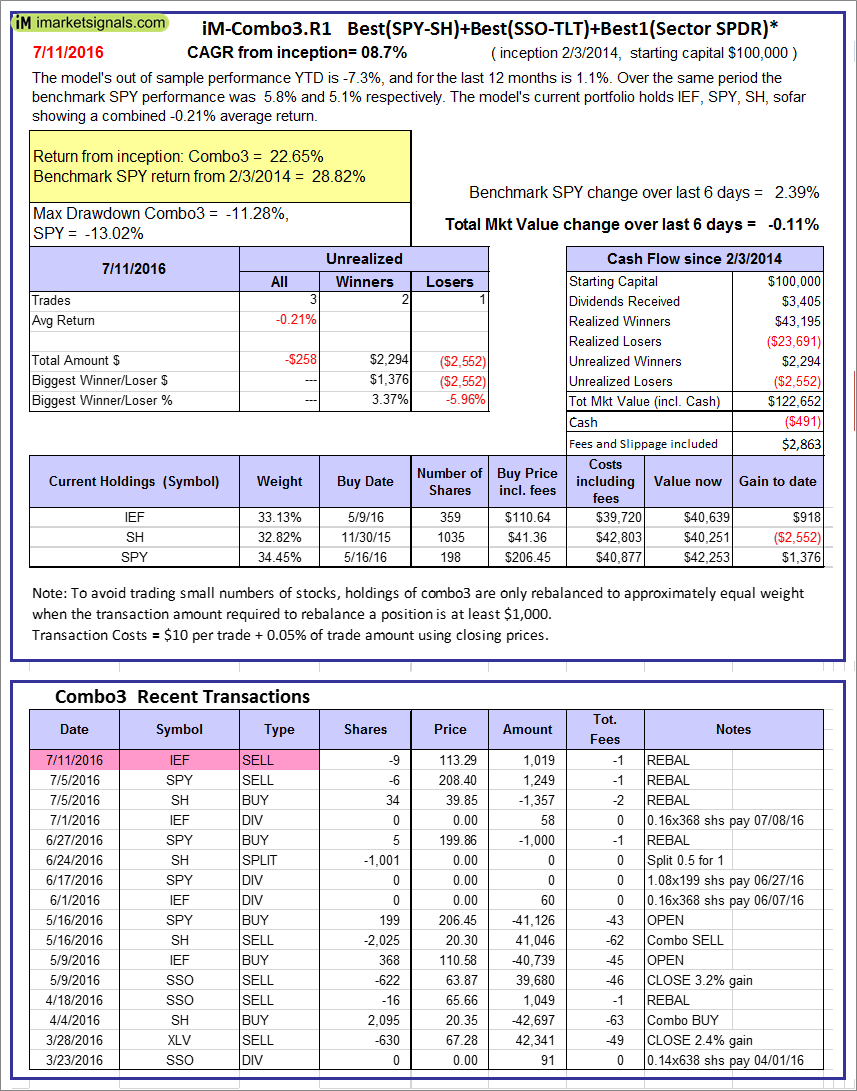 |
iM-Combo3.R1: The model’s out of sample performance YTD is -7.3%, and for the last 12 months is 1.1%. Over the same period the benchmark SPY performance was 5.8% and 5.1% respectively. Over the previous week the market value of iM-Combo3.R1 gained -0.11% at a time when SPY gained 2.39%. A starting capital of $100,000 at inception on 2/3/2014 would have grown to $122,652 which includes -$491 cash and excludes $2,863 spent on fees and slippage. |
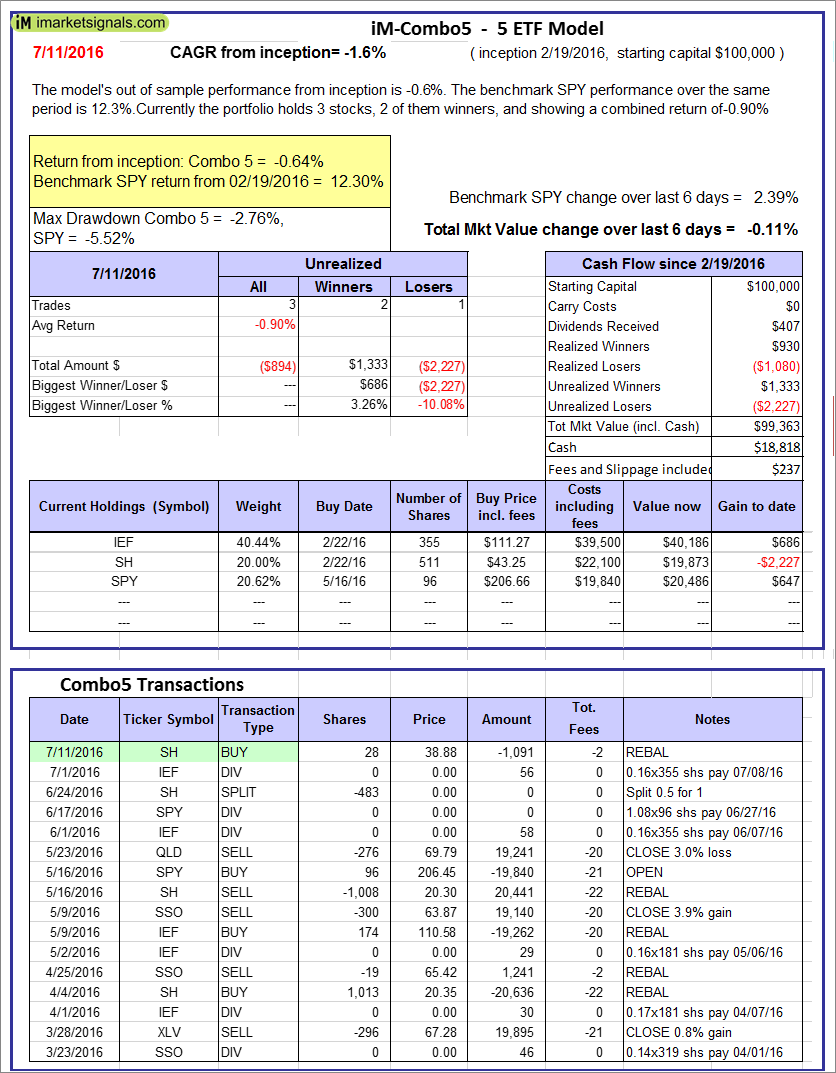 |
iM-Combo5: The model’s out of sample performance from inception is -0.6%. The benchmark SPY performance over the same period is 12.3%. Over the previous week the market value of iM-Combo5 gained -0.11% at a time when SPY gained 2.39%. A starting capital of $100,000 at inception on 2/22/2016 would have grown to $99,363 which includes $18,818 cash and excludes $237 spent on fees and slippage. |
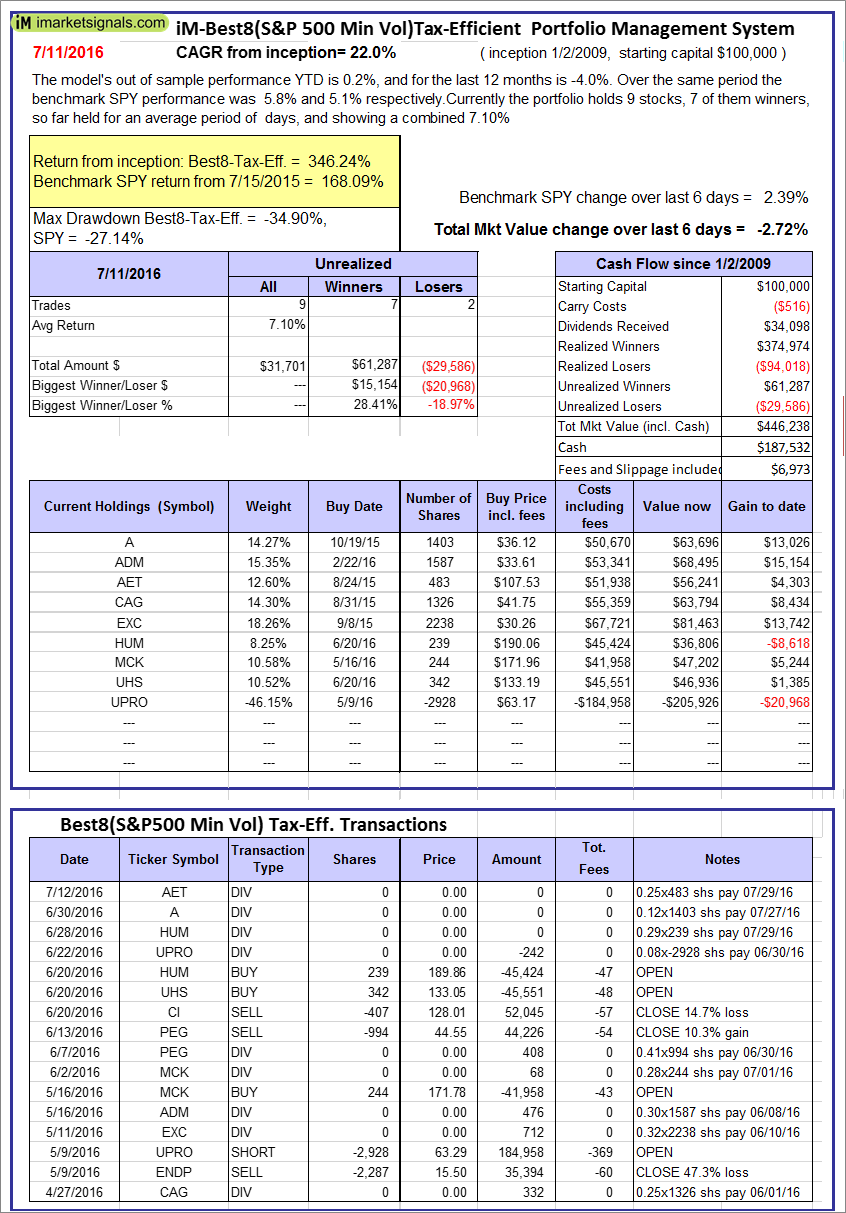 |
The iM-Best8(S&P500 Min Vol)Tax-Efficient The model’s out of sample performance YTD is 0.2%, and for the last 12 months is -4.0%. Over the same period the benchmark SPY performance was 5.8% and 5.1% respectively. Over the previous week the market value of iM-Best8(S&P 500)Tax-Eff. gained -2.72% at a time when SPY gained 2.39%. A starting capital of $100,000 at inception on 1/2/2009 would have grown to $446,238 which includes $187,532 cash and excludes $6,973 spent on fees and slippage. |
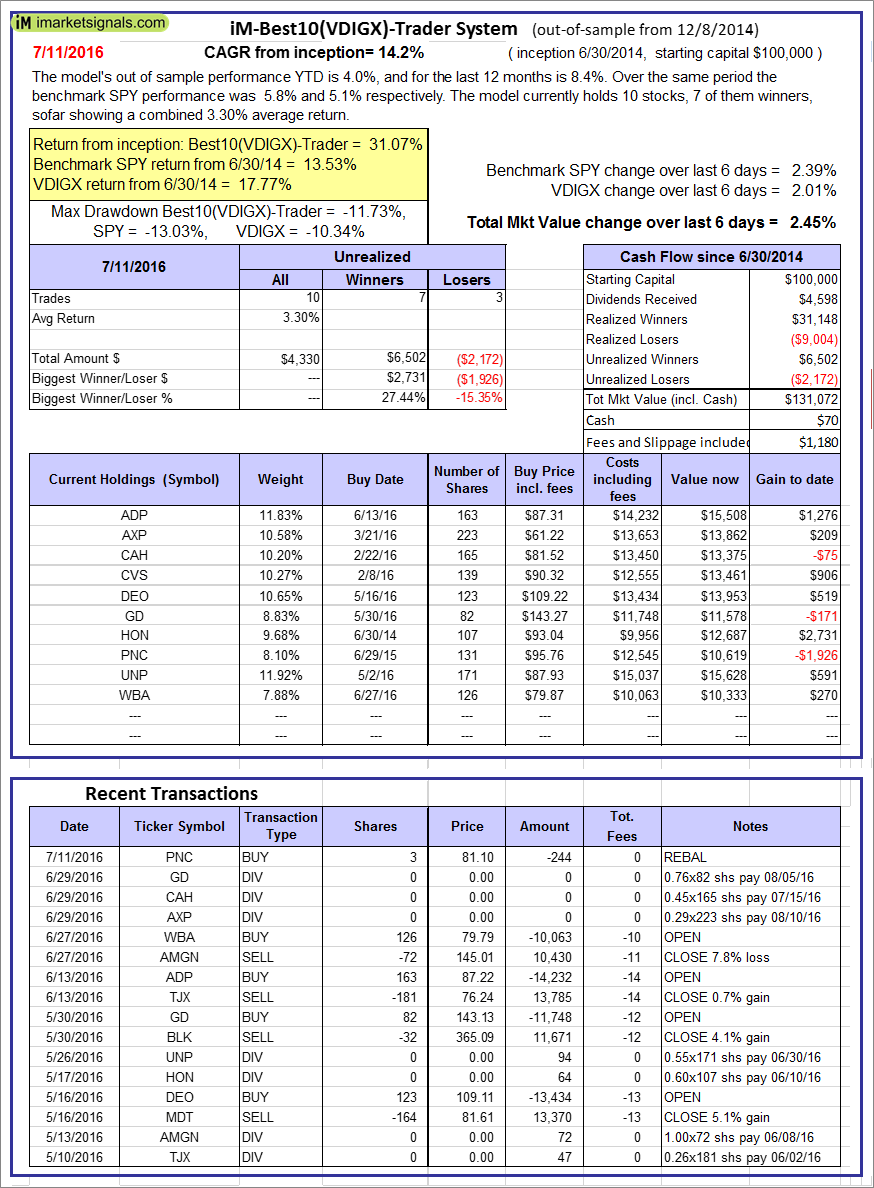 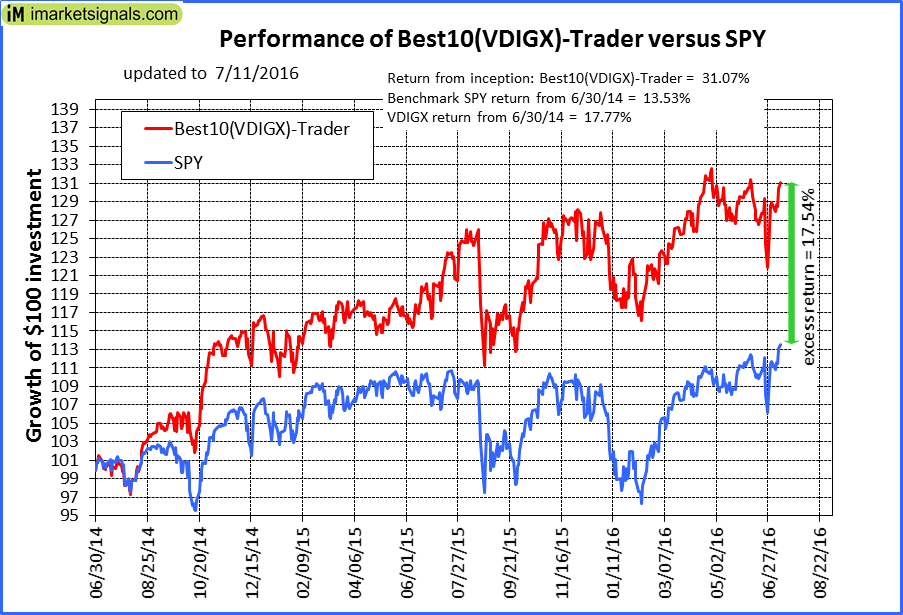 |
iM-Best10(VDIGX)-Trader: The model’s out of sample performance YTD is 4.0%, and for the last 12 months is 8.4%. Over the same period the benchmark SPY performance was 5.8% and 5.1% respectively. Since inception, on 7/1/2014, the model gained 31.07% while the benchmark SPY gained 13.53% and the ETF VDIGX gained 17.77% over the same period. Over the previous week the market value of iM-Best10(VDIGX) gained 2.45% at a time when SPY gained 2.39%. A starting capital of $100,000 at inception on 7/1/2014 would have grown to $131,072 which includes $70 cash and excludes $1,180 spent on fees and slippage. |
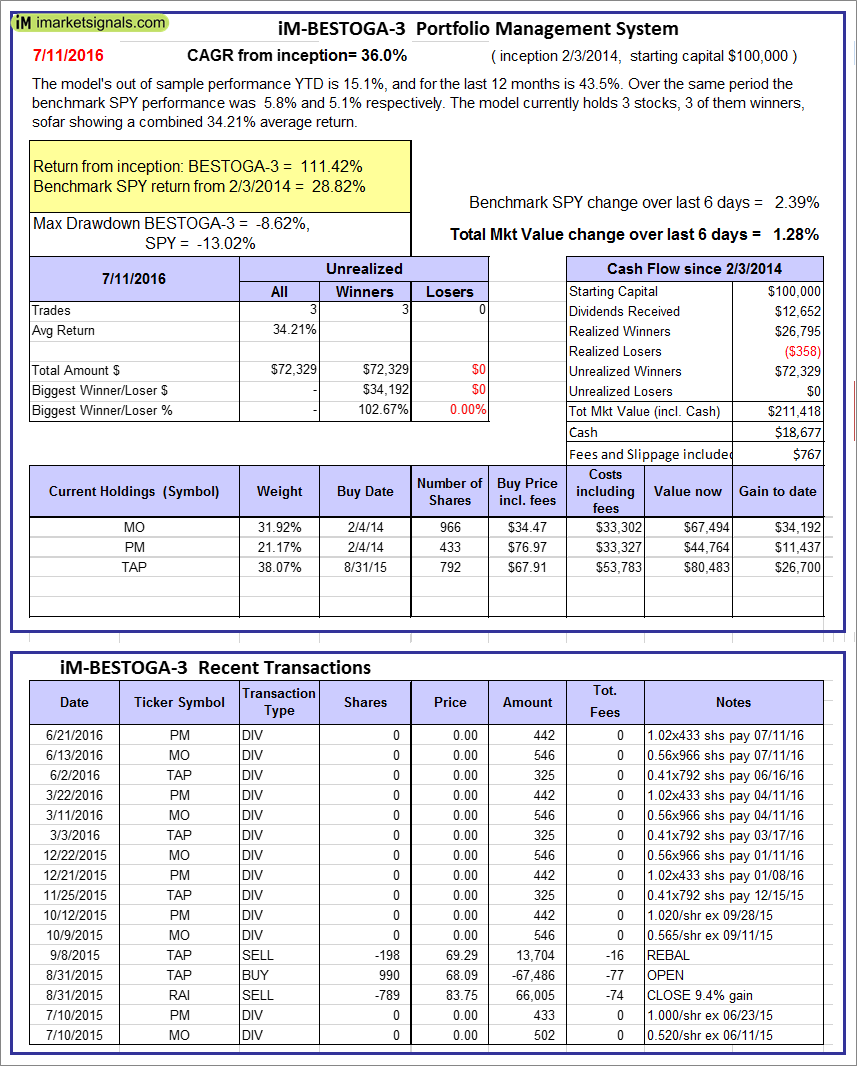 |
iM-BESTOGA-3: The model’s out of sample performance YTD is 15.1%, and for the last 12 months is 43.5%. Over the same period the benchmark SPY performance was 5.8% and 5.1% respectively. Over the previous week the market value of iM-BESTOGA-3 gained 1.28% at a time when SPY gained 2.39%. A starting capital of $100,000 at inception on 2/3/2014 would have grown to $211,418 which includes $18,677 cash and excludes $767 spent on fees and slippage. |
 |
iM-Best10(Short Russell3000): The model’s performance YTD is -28.5%, and for the last 12 months is -10.5%. Over the same period the benchmark SPY performance was 5.8% and 5.1% respectively. Over the previous week the market value of iM-Best10(Short Russell3000) gained -6.61% at a time when SPY gained 2.39%. Over the period 2/3/2014 to 7/11/2016 the starting capital of $100,000 would have grown to $10,159 which includes $20,954 cash and excludes $1,314 spent on fees and slippage. |
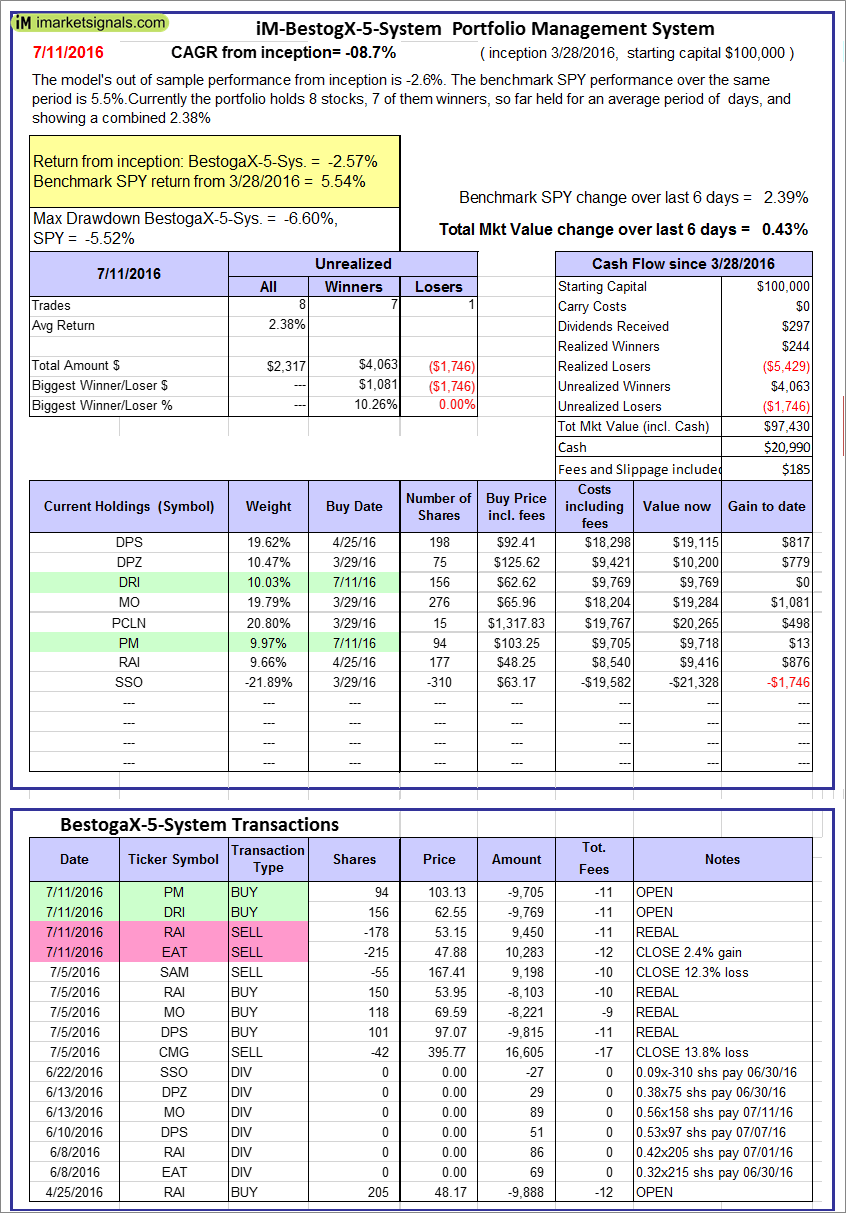 |
iM-BestogaX5-System: The model’s out of sample performance from inception is -2.6%. The benchmark SPY performance over the same period is 5.5%. Over the previous week the market value of iM-Best8(S&P 500)Tax-Eff. gained 0.43% at a time when SPY gained 2.39%. A starting capital of $100,000 at inception on 1/2/2009 would have grown to $97,430 which includes $20,990 cash and excludes $185 spent on fees and slippage. |
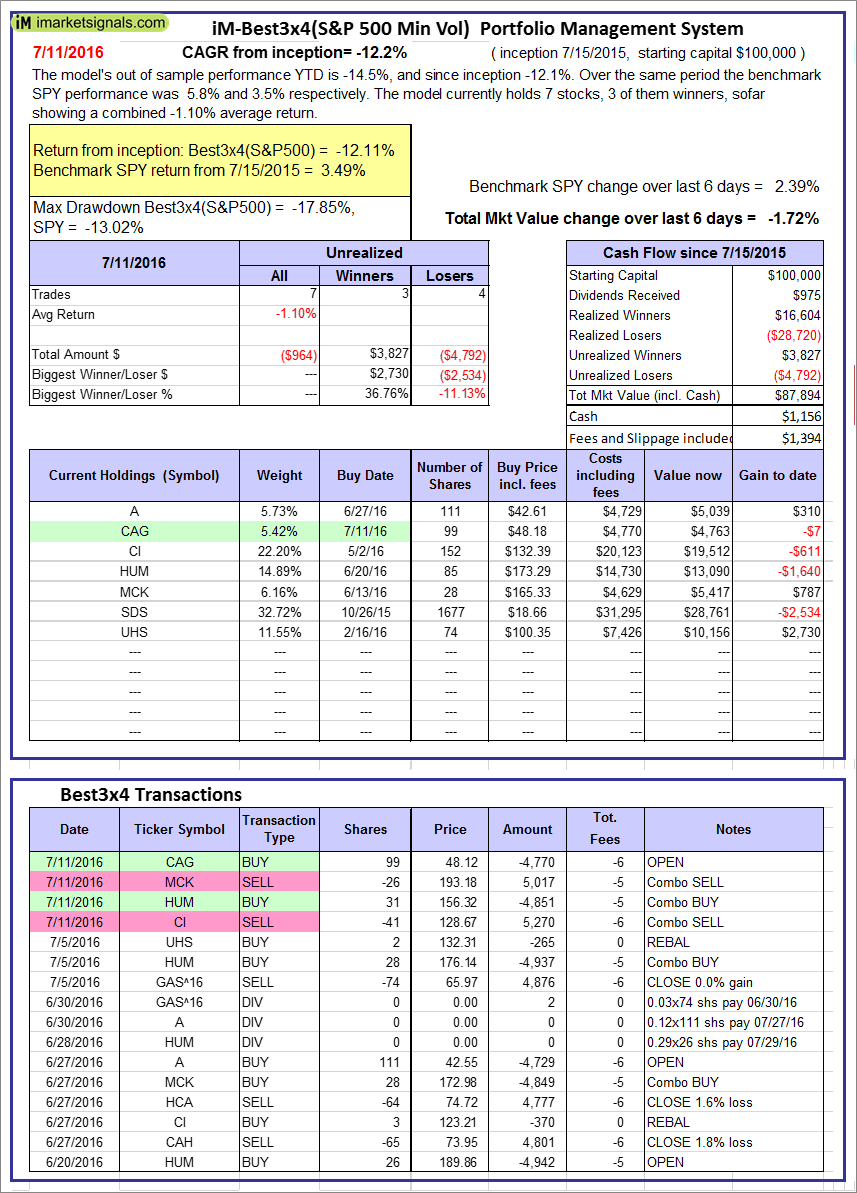 |
iM-Best3x4(S&P 500 Min Vol): The model’s out of sample performance YTD is -14.5%, and since inception -12.1%. Over the same period the benchmark SPY performance was 5.8% and 3.5% respectively. Over the previous week the market value of iM-Best3x4 gained -1.72% at a time when SPY gained 2.39%. A starting capital of $100,000 at inception on 7/15/2015 would have grown to $87,894 which includes $1,156 cash and excludes $1,394 spent on fees and slippage. |
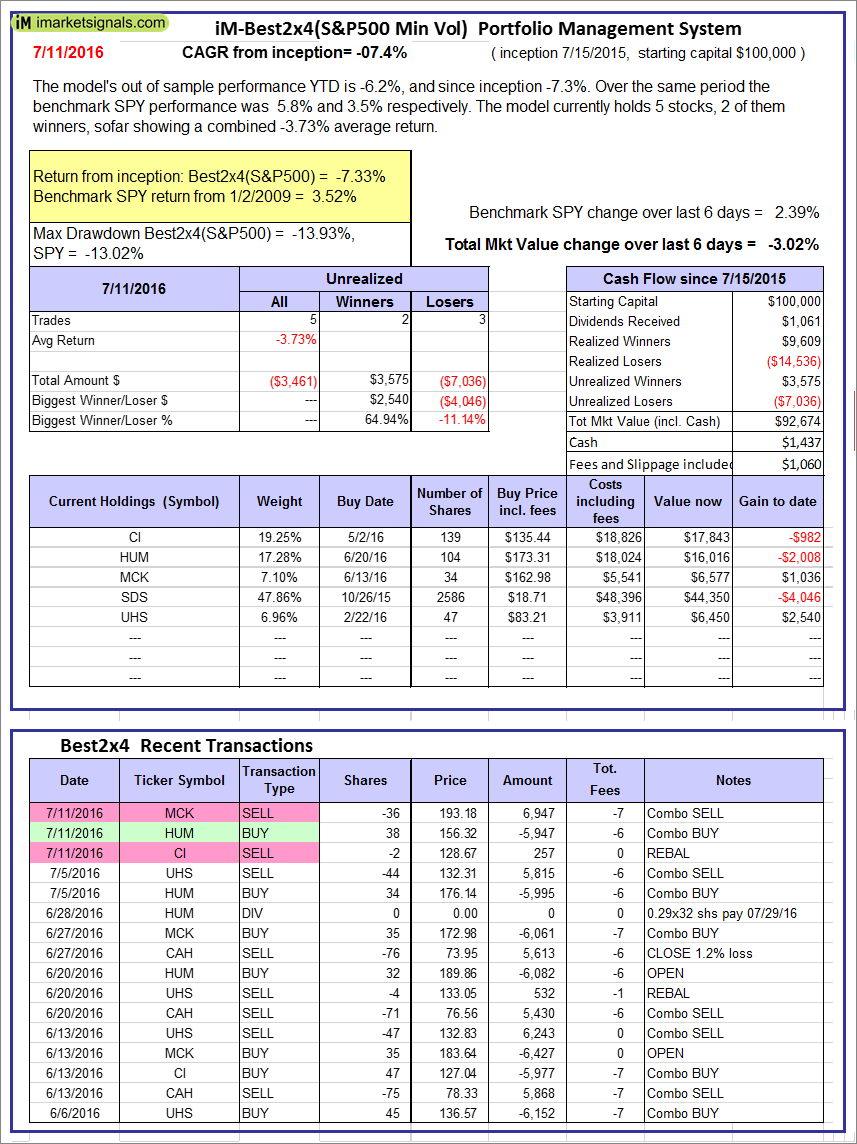 |
iM-Best2x4(S&P 500 Min Vol): The model’s out of sample performance YTD is -6.2%, and since inception -7.3%. Over the same period the benchmark SPY performance was 5.8% and 3.5% respectively. Over the previous week the market value of iM-Best2x4 gained -3.02% at a time when SPY gained 2.39%. A starting capital of $100,000 at inception on 7/16/2015 would have grown to $92,674 which includes $1,437 cash and excludes $1,060 spent on fees and slippage. |
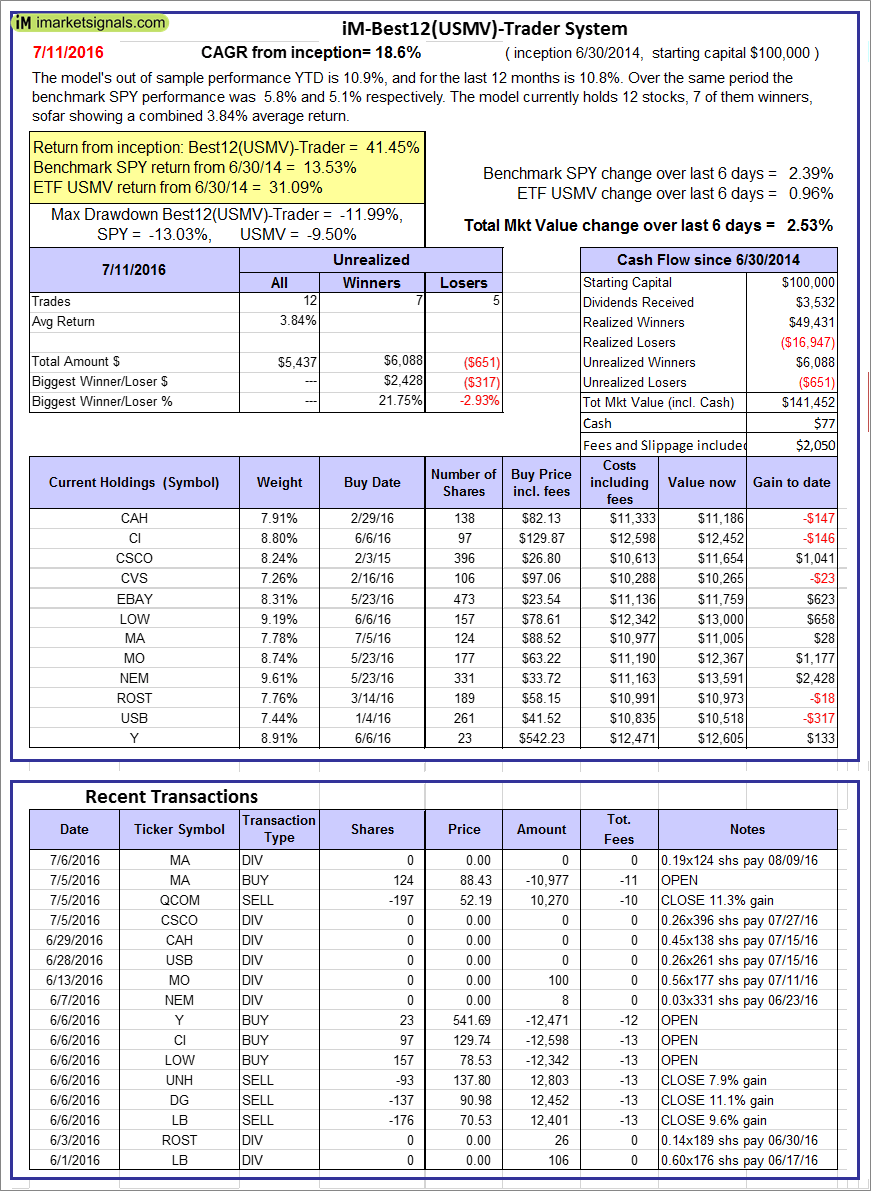 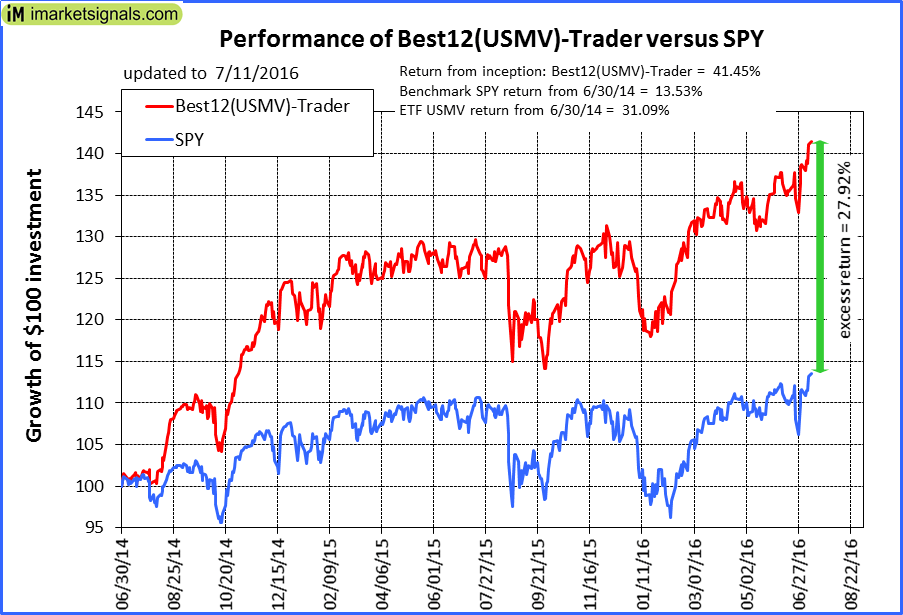 |
iM-Best12(USMV)-Trader: The model’s out of sample performance YTD is 10.9%, and for the last 12 months is 10.8%. Over the same period the benchmark SPY performance was 5.8% and 5.1% respectively. Since inception, on 7/1/2014, the model gained 41.45% while the benchmark SPY gained 13.53% and the ETF USMV gained 31.09% over the same period. Over the previous week the market value of iM-Best12(USMV)-Trader gained 2.53% at a time when SPY gained 2.39%. A starting capital of $100,000 at inception on 7/1/2014 would have grown to $141,452 which includes $77 cash and excludes $2,050 spent on fees and slippage. |
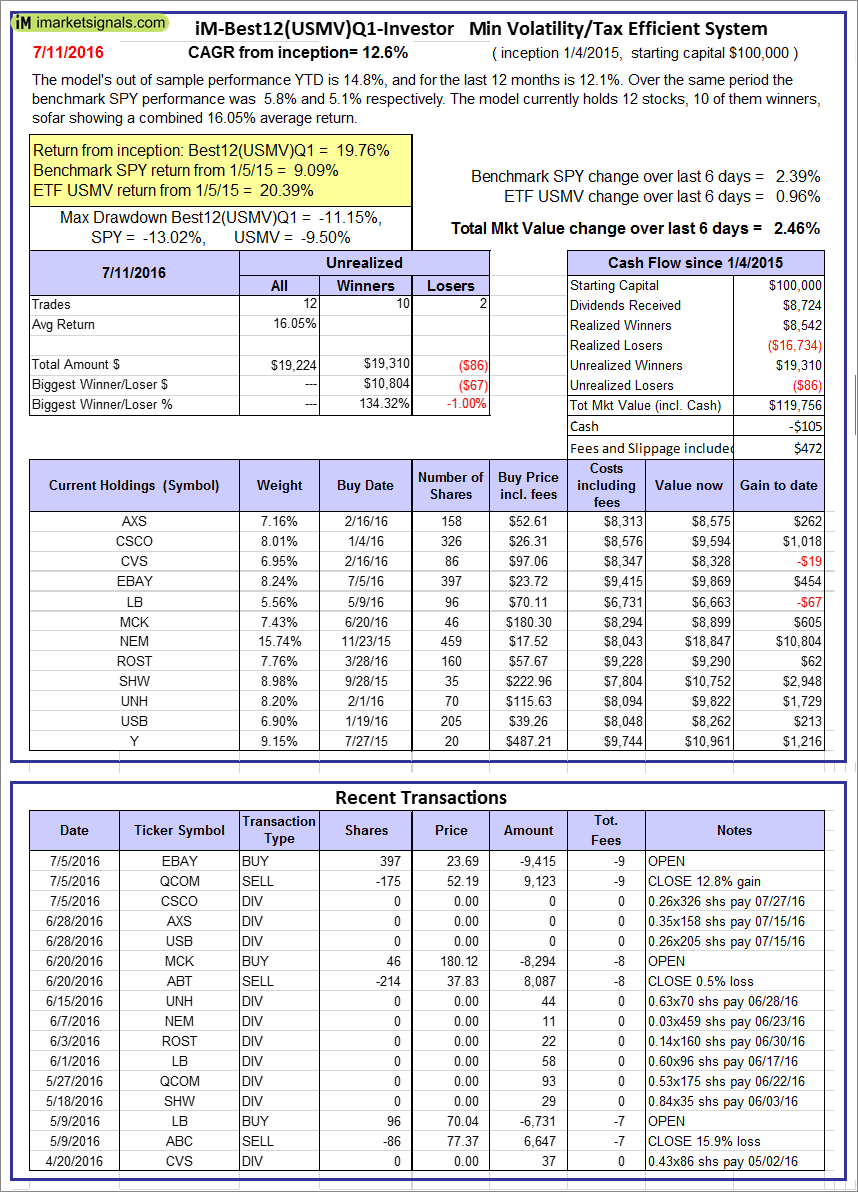 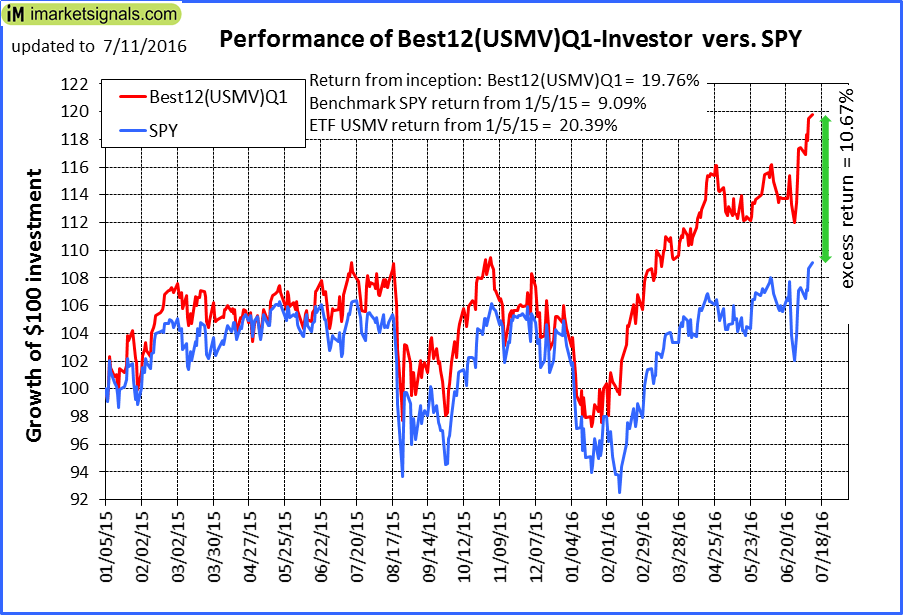 |
iM-Best12(USMV)Q1-Investor: The model’s out of sample performance YTD is 14.8%, and for the last 12 months is 12.1%. Over the same period the benchmark SPY performance was 5.8% and 5.1% respectively. Since inception, on 1/5/2015, the model gained 19.76% while the benchmark SPY gained 9.09% and the ETF USMV gained 20.39% over the same period. Over the previous week the market value of iM-Best12(USMV)Q1 gained 2.46% at a time when SPY gained 2.39%. A starting capital of $100,000 at inception on 1/5/2015 would have grown to $119,756 which includes -$105 cash and excludes $472 spent on fees and slippage. |
  |
iM-Best12(USMV)Q2-Investor: The model’s out of sample performance YTD is 15.1%, and for the last 12 months is 15.1%. Over the same period the benchmark SPY performance was 5.8% and 5.1% respectively. Since inception, on 3/31/2015, the model gained 14.50% while the benchmark SPY gained 5.21% and the ETF USMV gained 16.28% over the same period. Over the previous week the market value of iM-Best12(USMV)Q2 gained 2.60% at a time when SPY gained 2.39%. A starting capital of $100,000 at inception on 3/31/2015 would have grown to $114,501 which includes $39 cash and excludes $385 spent on fees and slippage. |
 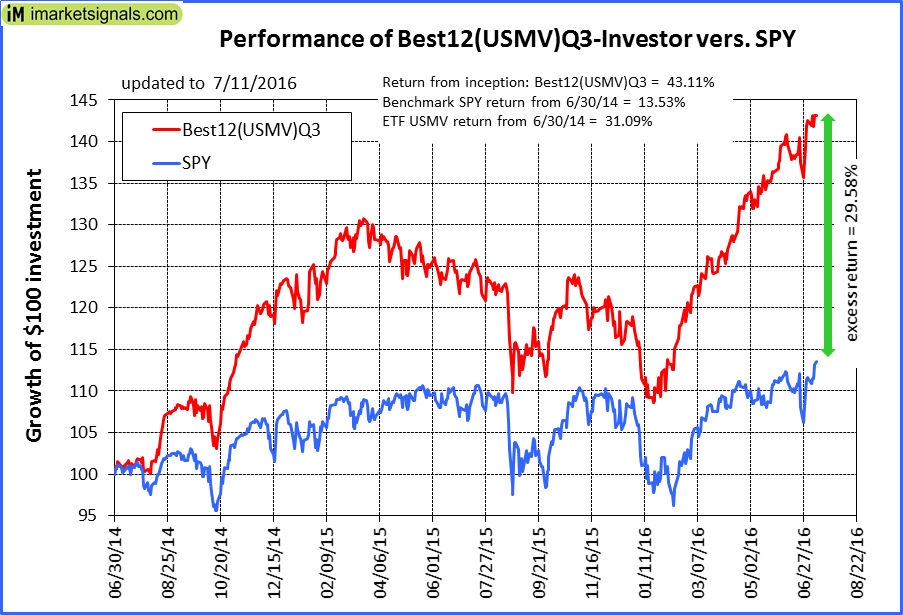 |
iM-Best12(USMV)Q3-Investor: The model’s out of sample performance YTD is 22.0%, and for the last 12 months is 15.2%. Over the same period the benchmark SPY performance was 5.8% and 5.1% respectively. Since inception, on 7/1/2014, the model gained 43.11% while the benchmark SPY gained 13.53% and the ETF USMV gained 31.09% over the same period. Over the previous week the market value of iM-Best12(USMV)Q3 gained 0.83% at a time when SPY gained 2.39%. A starting capital of $100,000 at inception on 7/1/2014 would have grown to $143,111 which includes $24 cash and excludes $583 spent on fees and slippage. |
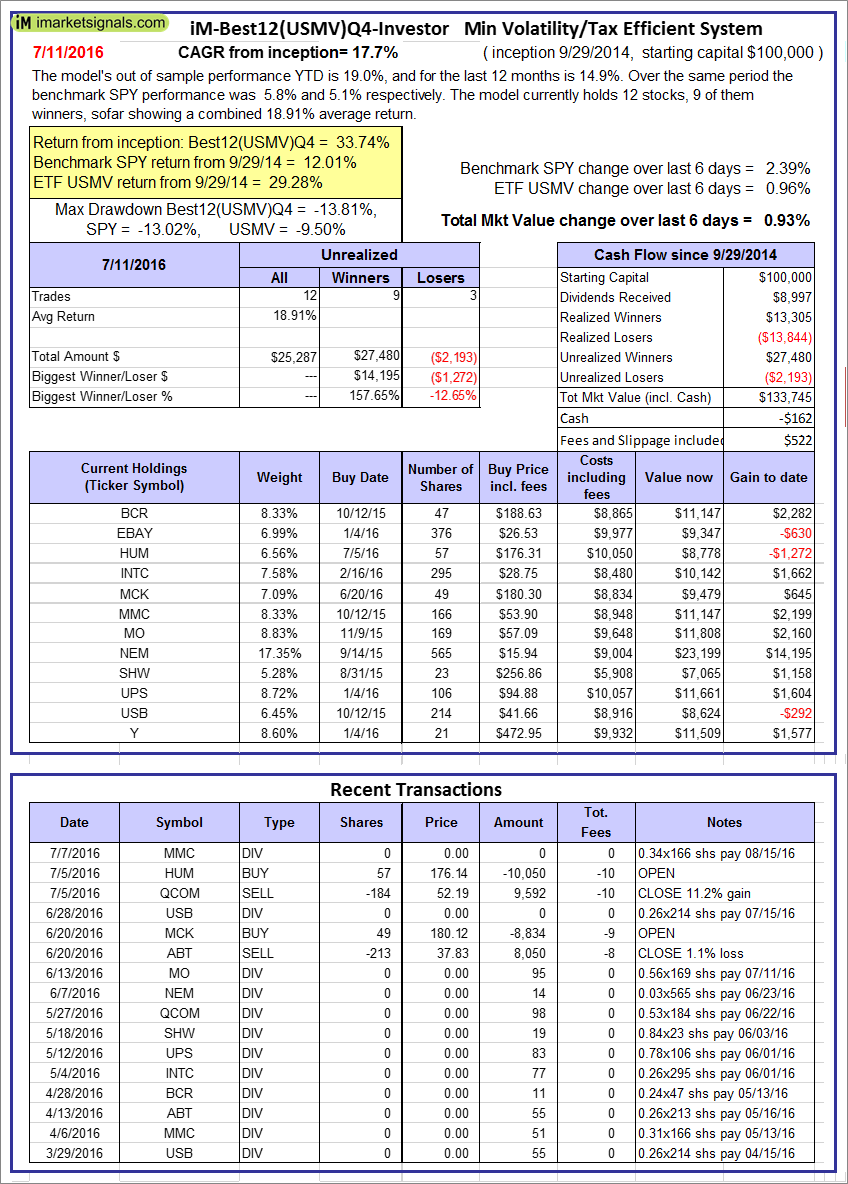 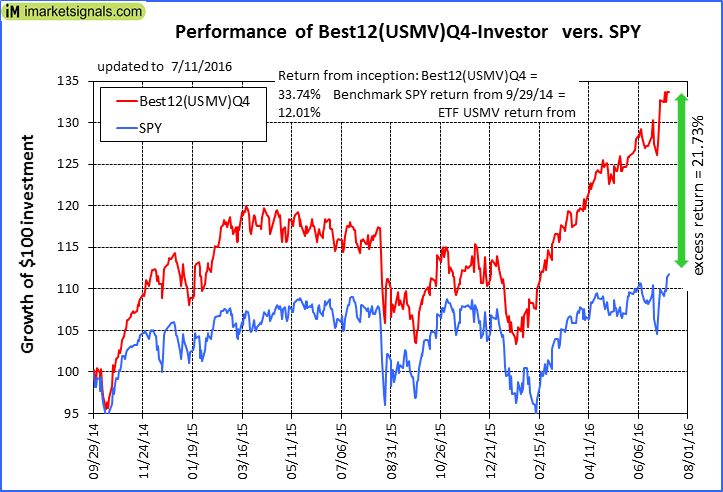 |
iM-Best12(USMV)Q4-Investor: Since inception, on 9/30/2014, the model gained 33.74% while the benchmark SPY gained 12.01% and the ETF USMV gained 29.28% over the same period. Over the previous week the market value of iM-Best12(USMV)Q4 gained 0.93% at a time when SPY gained 2.39%. A starting capital of $100,000 at inception on 9/30/2014 would have grown to $133,745 which includes -$162 cash and excludes $522 spent on fees and slippage. |
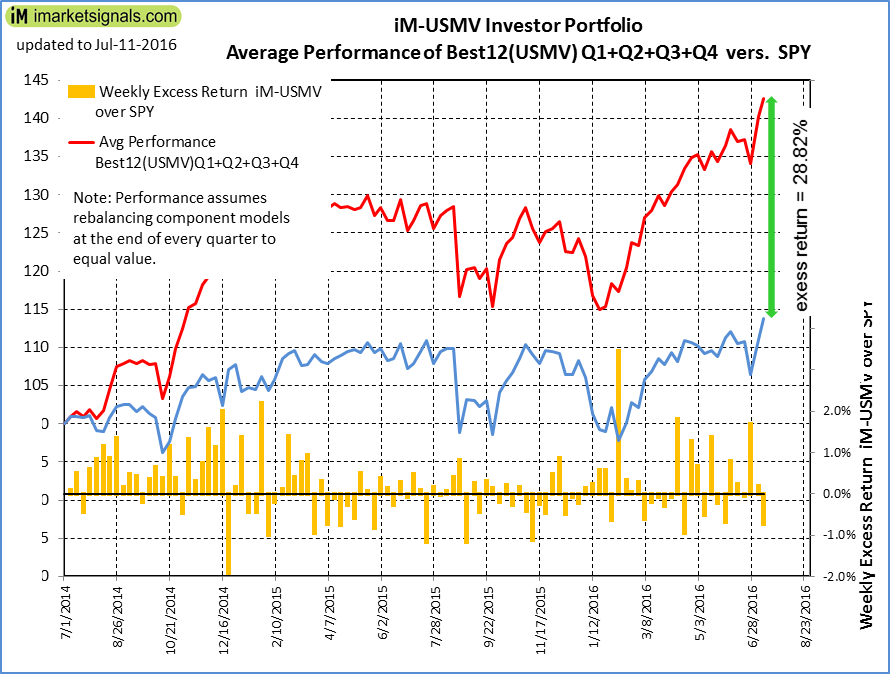 |
Average Performance of iM-Best12(USMV)Q1+Q2+Q3+Q4-Investor resulted in an excess return of 28.82% over SPY. (see iM-USMV Investor Portfolio) |
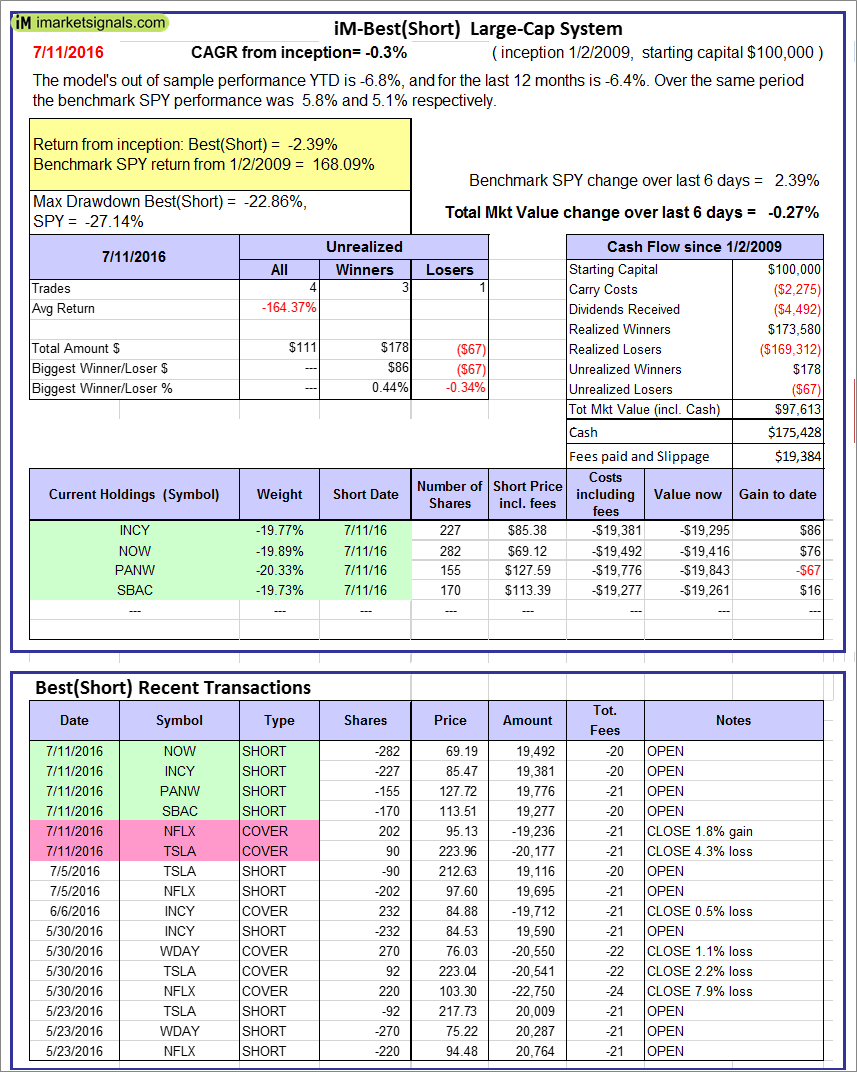 |
iM-Best(Short): The model’s out of sample performance YTD is -6.8%, and for the last 12 months is -6.4%. Over the same period the benchmark SPY performance was 5.8% and 5.1% respectively. Over the previous week the market value of iM-Best(Short) gained -0.27% at a time when SPY gained 2.39%. Over the period 1/2/2009 to 7/11/2016 the starting capital of $100,000 would have grown to $97,613 which includes $175,428 cash and excludes $19,384 spent on fees and slippage. |
iM-Best Reports – 7/11/2016
Posted in pmp SPY-SH
Leave a Reply
You must be logged in to post a comment.