
  |
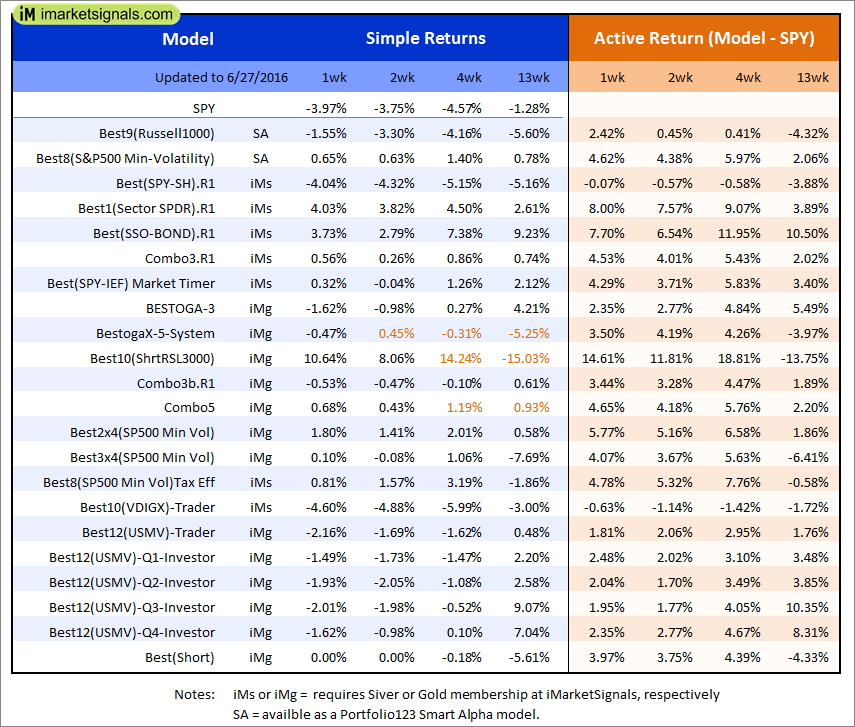
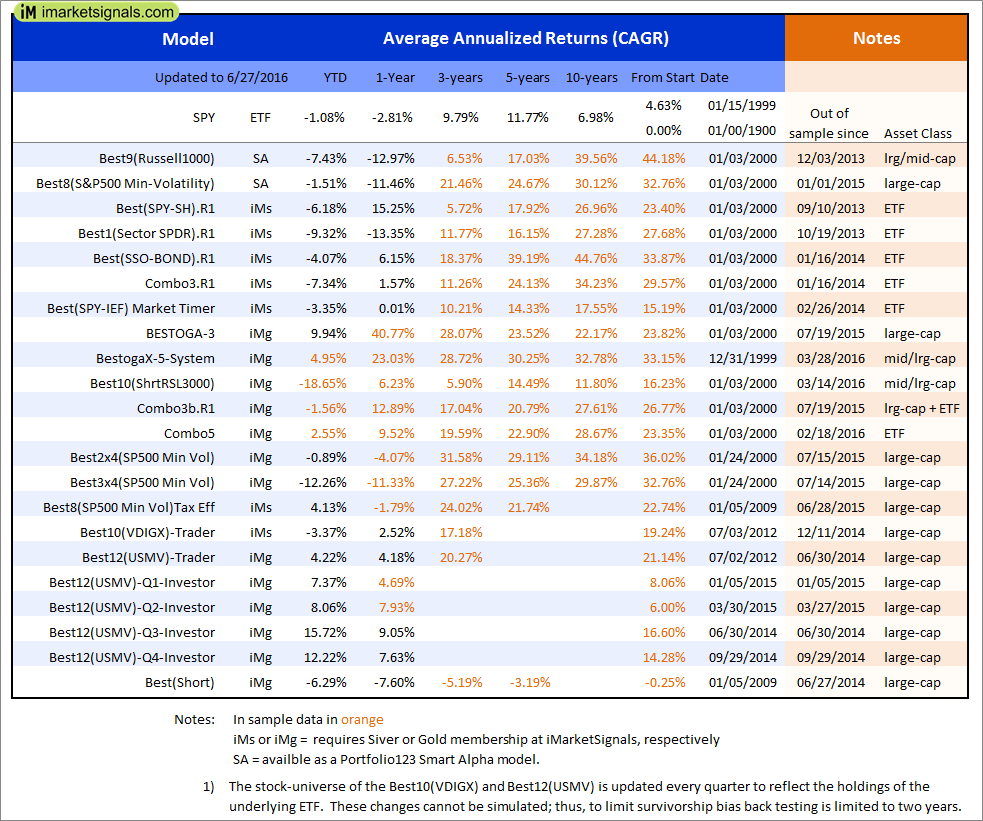
Out of sample performance summary of our models for the past 1, 2, 4 and 13 week periods. The active active return indicates how the models over- or underperformed the benchmark ETF SPY. Also the YTD, and the 1-, 3-, 5- and 10-year annualized returns are shown in the second table |
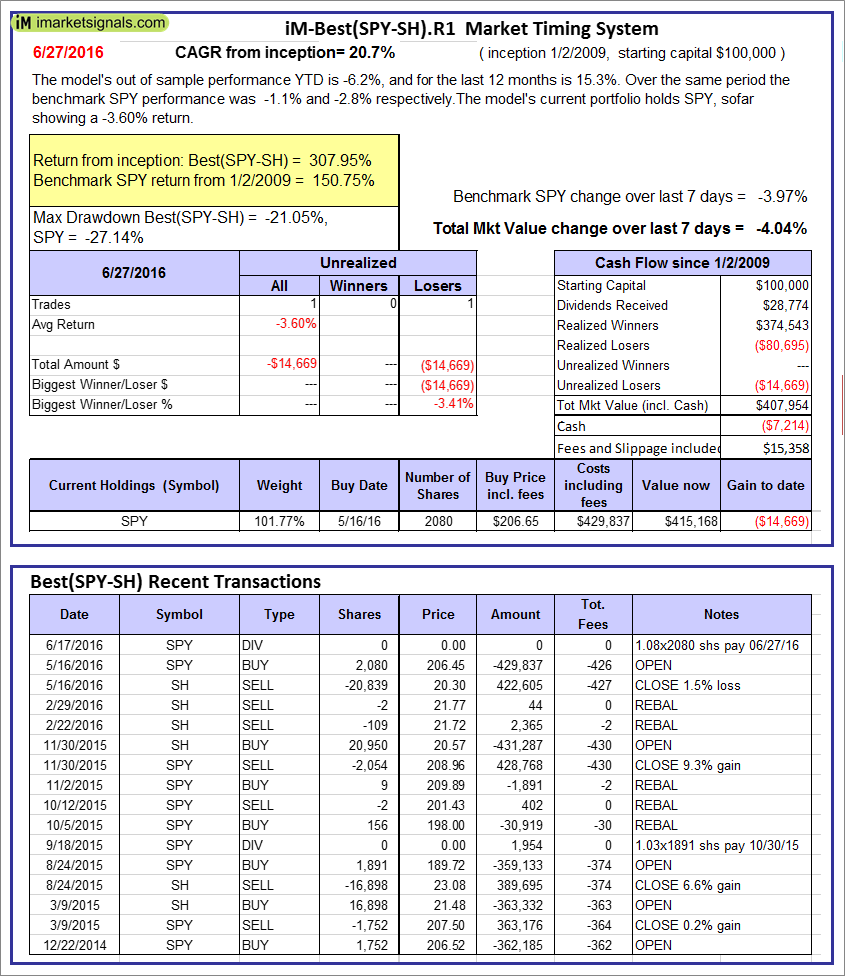 |
iM-Best(SPY-SH).R1: The model’s out of sample performance YTD is -6.2%, and for the last 12 months is 15.3%. Over the same period the benchmark SPY performance was -1.1% and -2.8% respectively. Over the previous week the market value of Best(SPY-SH) gained -4.04% at a time when SPY gained -3.97%. A starting capital of $100,000 at inception on 1/2/2009 would have grown to $407,954 which includes -$7,214 cash and excludes $15,358 spent on fees and slippage. |
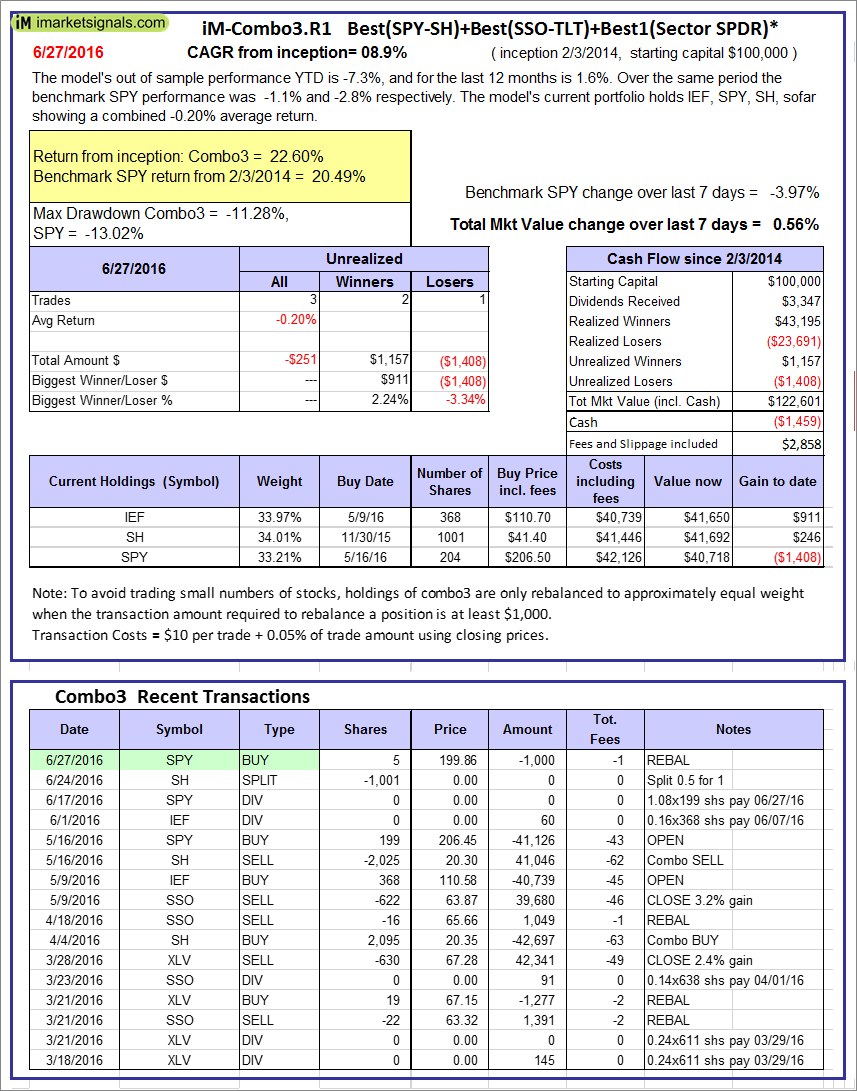 |
iM-Combo3.R1: The model’s out of sample performance YTD is -7.3%, and for the last 12 months is 1.6%. Over the same period the benchmark SPY performance was -1.1% and -2.8% respectively. Over the previous week the market value of iM-Combo3.R1 gained 0.56% at a time when SPY gained -3.97%. A starting capital of $100,000 at inception on 2/3/2014 would have grown to $122,601 which includes -$1,459 cash and excludes $2,858 spent on fees and slippage. |
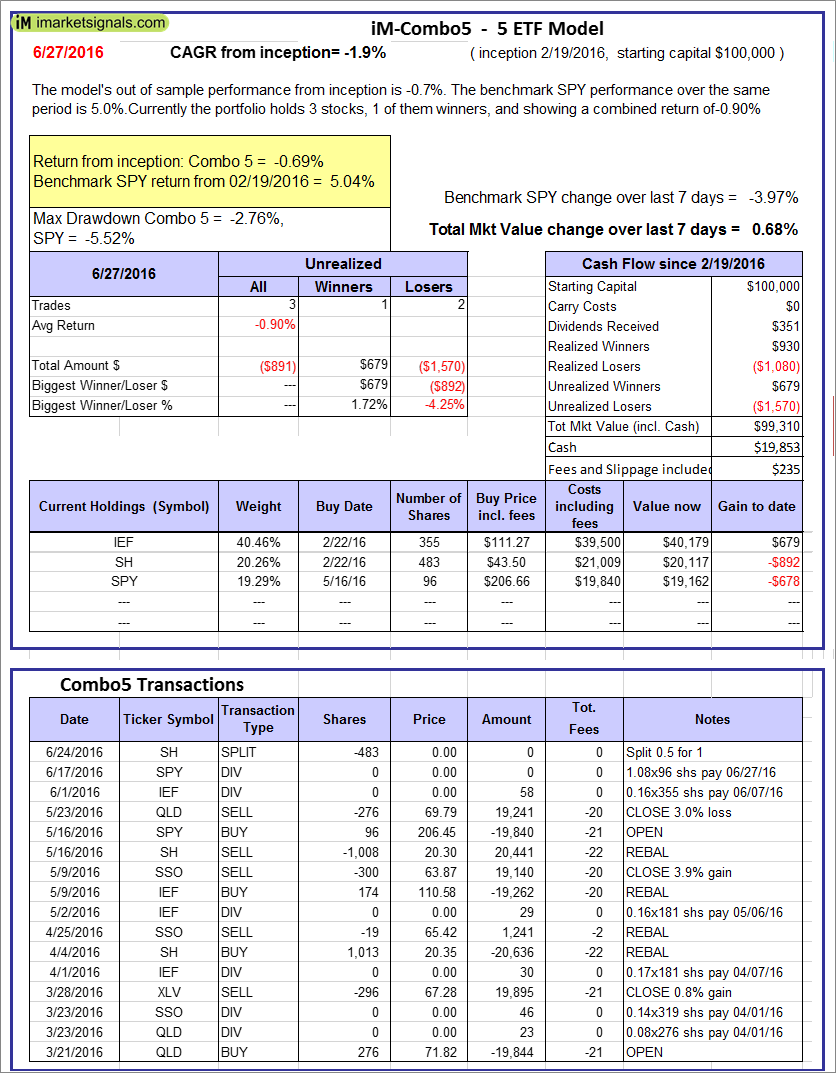 |
iM-Combo5: The model’s out of sample performance from inception is -0.7%. The benchmark SPY performance over the same period is 5.0%. Over the previous week the market value of iM-Combo5 gained 0.68% at a time when SPY gained -3.97%. A starting capital of $100,000 at inception on 2/22/2016 would have grown to $99,310 which includes $19,853 cash and excludes $235 spent on fees and slippage. |
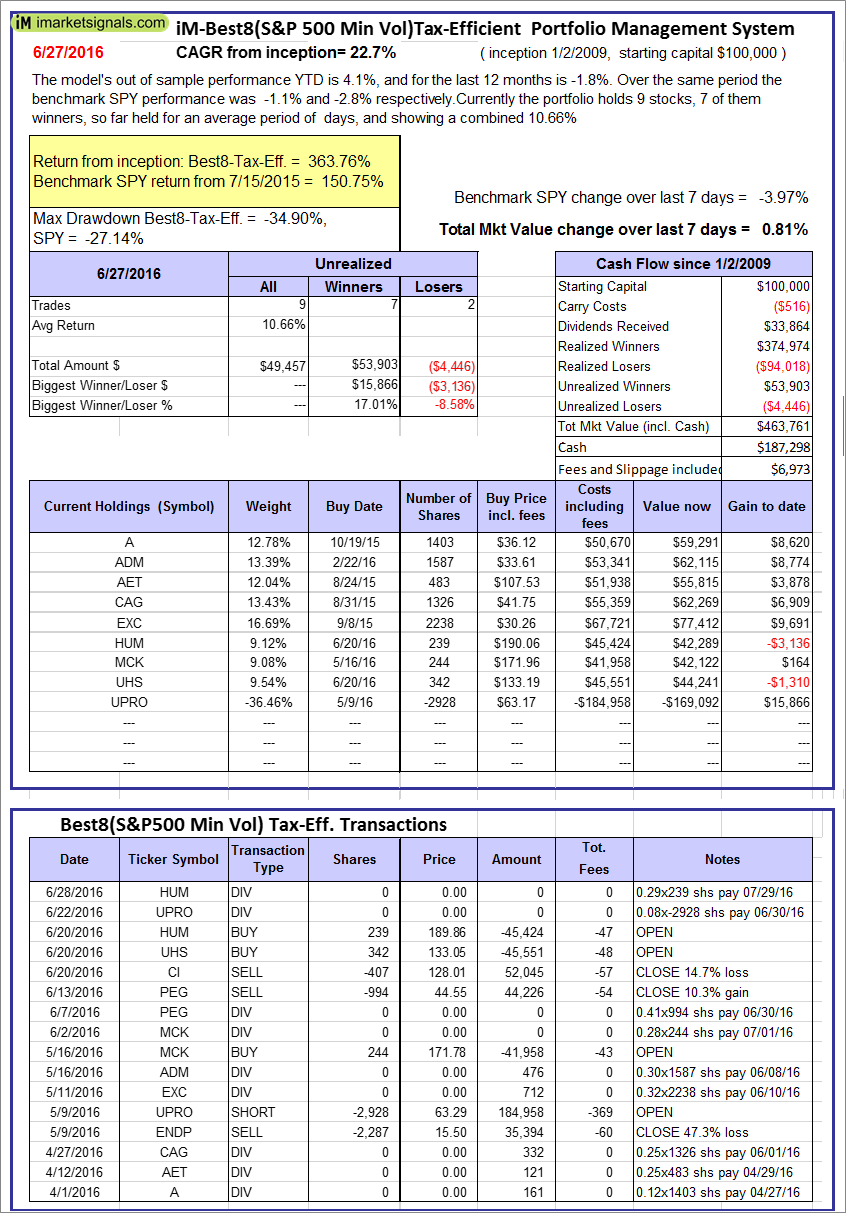 |
The iM-Best8(S&P500 Min Vol)Tax-Efficient The model’s out of sample performance YTD is 4.1%, and for the last 12 months is -1.8%. Over the same period the benchmark SPY performance was -1.1% and -2.8% respectively. Over the previous week the market value of iM-Best8(S&P 500)Tax-Eff. gained 0.81% at a time when SPY gained -3.97%. A starting capital of $100,000 at inception on 1/2/2009 would have grown to $463,761 which includes $187,298 cash and excludes $6,973 spent on fees and slippage. |
 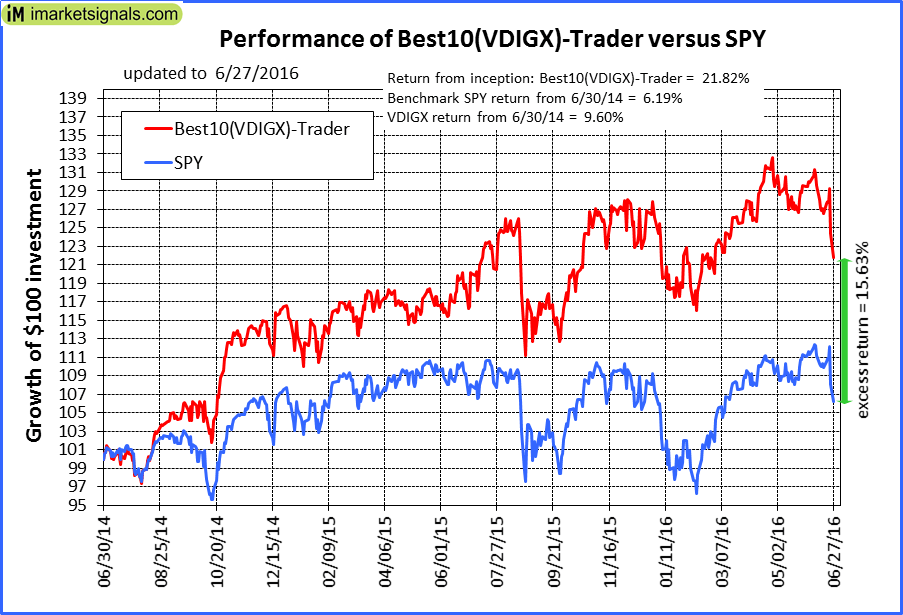 |
iM-Best10(VDIGX)-Trader: The model’s out of sample performance YTD is -3.4%, and for the last 12 months is 2.5%. Over the same period the benchmark SPY performance was -1.1% and -2.8% respectively. Since inception, on 7/1/2014, the model gained 21.82% while the benchmark SPY gained 6.19% and the ETF VDIGX gained 9.60% over the same period. Over the previous week the market value of iM-Best10(VDIGX) gained -4.60% at a time when SPY gained -3.97%. A starting capital of $100,000 at inception on 7/1/2014 would have grown to $121,821 which includes $219 cash and excludes $1,179 spent on fees and slippage. |
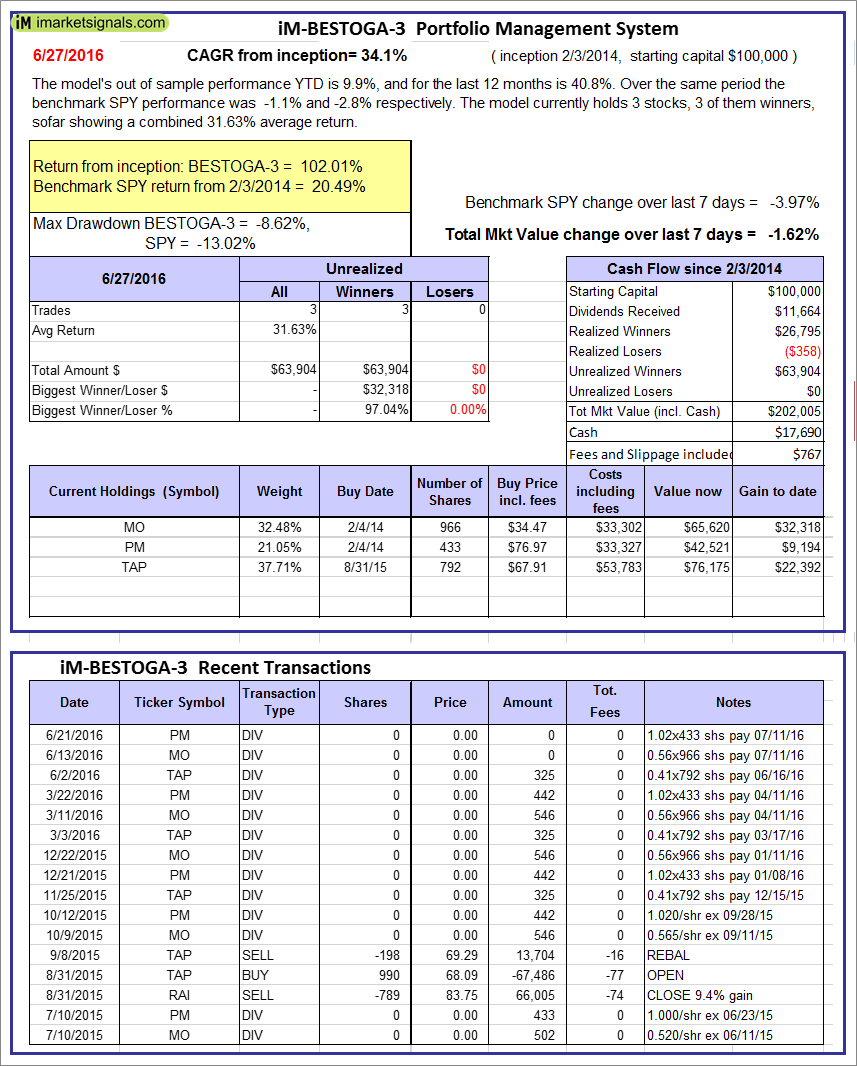 |
iM-BESTOGA-3: The model’s out of sample performance YTD is 9.9%, and for the last 12 months is 40.8%. Over the same period the benchmark SPY performance was -1.1% and -2.8% respectively. Over the previous week the market value of iM-BESTOGA-3 gained -1.62% at a time when SPY gained -3.97%. A starting capital of $100,000 at inception on 2/3/2014 would have grown to $202,005 which includes $17,690 cash and excludes $767 spent on fees and slippage. |
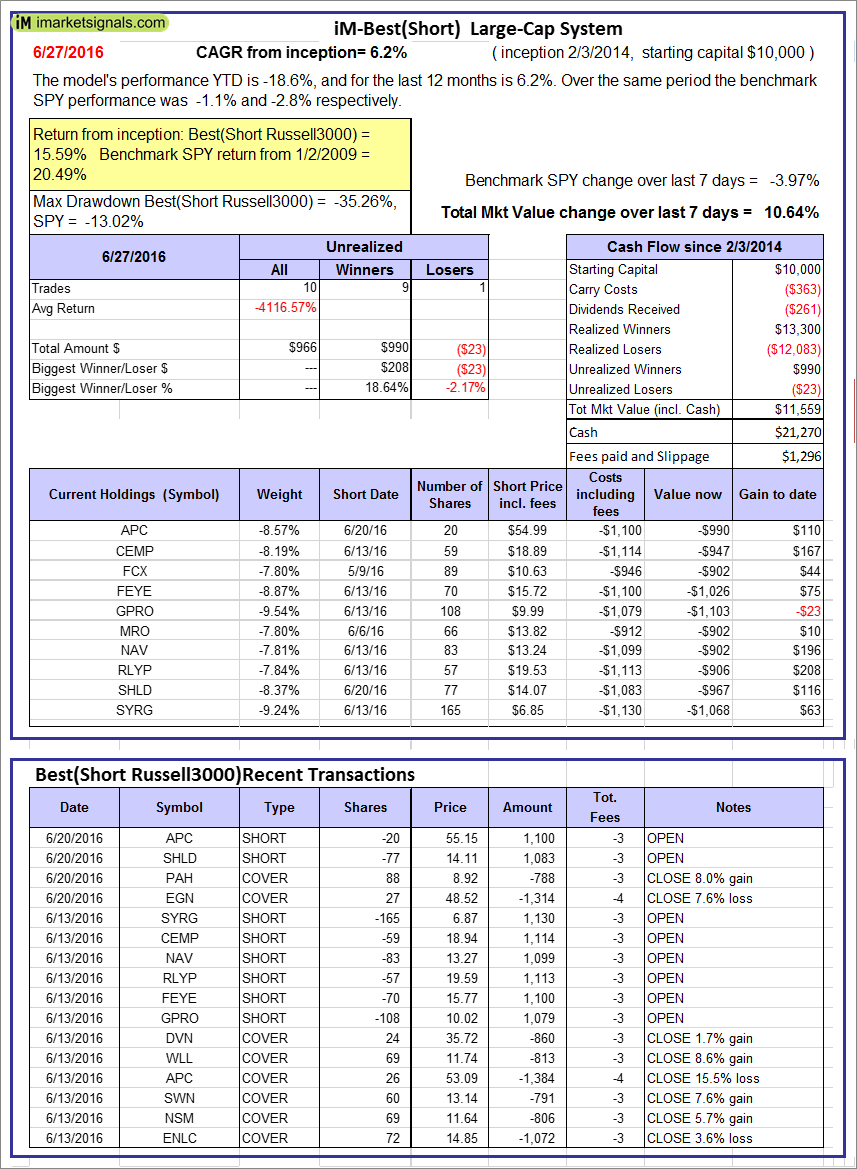 |
iM-Best10(Short Russell3000): The model’s performance YTD is -18.6%, and for the last 12 months is 6.2%. Over the same period the benchmark SPY performance was -1.1% and -2.8% respectively. Over the previous week the market value of iM-Best10(Short Russell3000) gained 10.64% at a time when SPY gained -3.97%. Over the period 2/3/2014 to 6/27/2016 the starting capital of $100,000 would have grown to $11,559 which includes $21,270 cash and excludes $1,296 spent on fees and slippage. |
 |
iM-BestogaX5-System: The model’s out of sample performance from inception is -5.3%. The benchmark SPY performance over the same period is -1.3%. Over the previous week the market value of iM-Best8(S&P 500)Tax-Eff. gained -0.47% at a time when SPY gained -3.97%. A starting capital of $100,000 at inception on 1/2/2009 would have grown to $94,750 which includes $20,770 cash and excludes $82 spent on fees and slippage. |
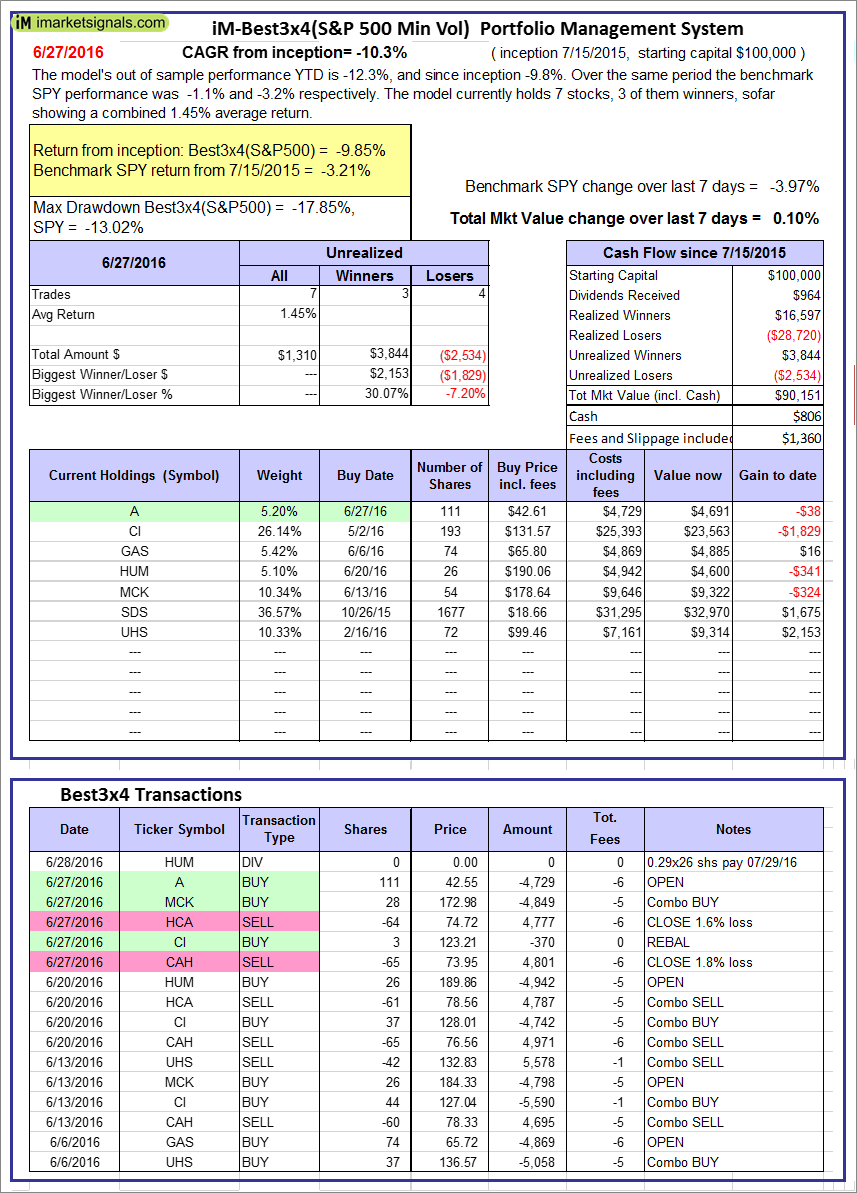 |
iM-Best3x4(S&P 500 Min Vol): The model’s out of sample performance YTD is -12.3%, and since inception -9.8%. Over the same period the benchmark SPY performance was -1.1% and -3.2% respectively. Over the previous week the market value of iM-Best3x4 gained 0.10% at a time when SPY gained -3.97%. A starting capital of $100,000 at inception on 7/15/2015 would have grown to $90,151 which includes $806 cash and excludes $1,360 spent on fees and slippage. |
 |
iM-Best2x4(S&P 500 Min Vol): The model’s out of sample performance YTD is -0.9%, and since inception -2.1%. Over the same period the benchmark SPY performance was -1.1% and -3.2% respectively. Over the previous week the market value of iM-Best2x4 gained 1.80% at a time when SPY gained -3.97%. A starting capital of $100,000 at inception on 7/16/2015 would have grown to $97,923 which includes $350 cash and excludes $1,033 spent on fees and slippage. |
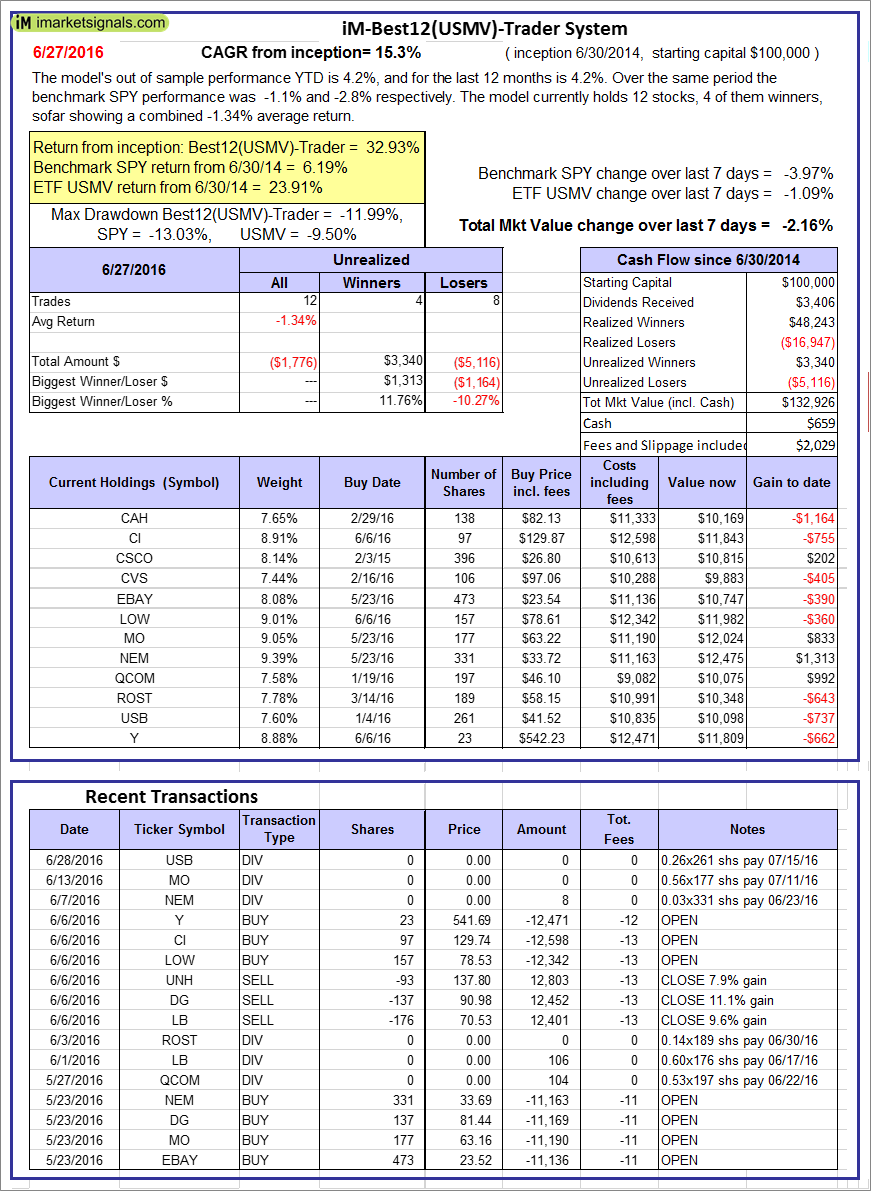  |
iM-Best12(USMV)-Trader: The model’s out of sample performance YTD is 4.2%, and for the last 12 months is 4.2%. Over the same period the benchmark SPY performance was -1.1% and -2.8% respectively. Since inception, on 7/1/2014, the model gained 32.93% while the benchmark SPY gained 6.19% and the ETF USMV gained 23.91% over the same period. Over the previous week the market value of iM-Best12(USMV)-Trader gained -2.16% at a time when SPY gained -3.97%. A starting capital of $100,000 at inception on 7/1/2014 would have grown to $132,926 which includes $659 cash and excludes $2,029 spent on fees and slippage. |
  |
iM-Best12(USMV)Q1-Investor: The model’s out of sample performance YTD is 7.4%, and for the last 12 months is 4.7%. Over the same period the benchmark SPY performance was -1.1% and -2.8% respectively. Since inception, on 1/5/2015, the model gained 12.01% while the benchmark SPY gained 2.05% and the ETF USMV gained 13.79% over the same period. Over the previous week the market value of iM-Best12(USMV)Q1 gained -1.49% at a time when SPY gained -3.97%. A starting capital of $100,000 at inception on 1/5/2015 would have grown to $112,010 which includes $122 cash and excludes $453 spent on fees and slippage. |
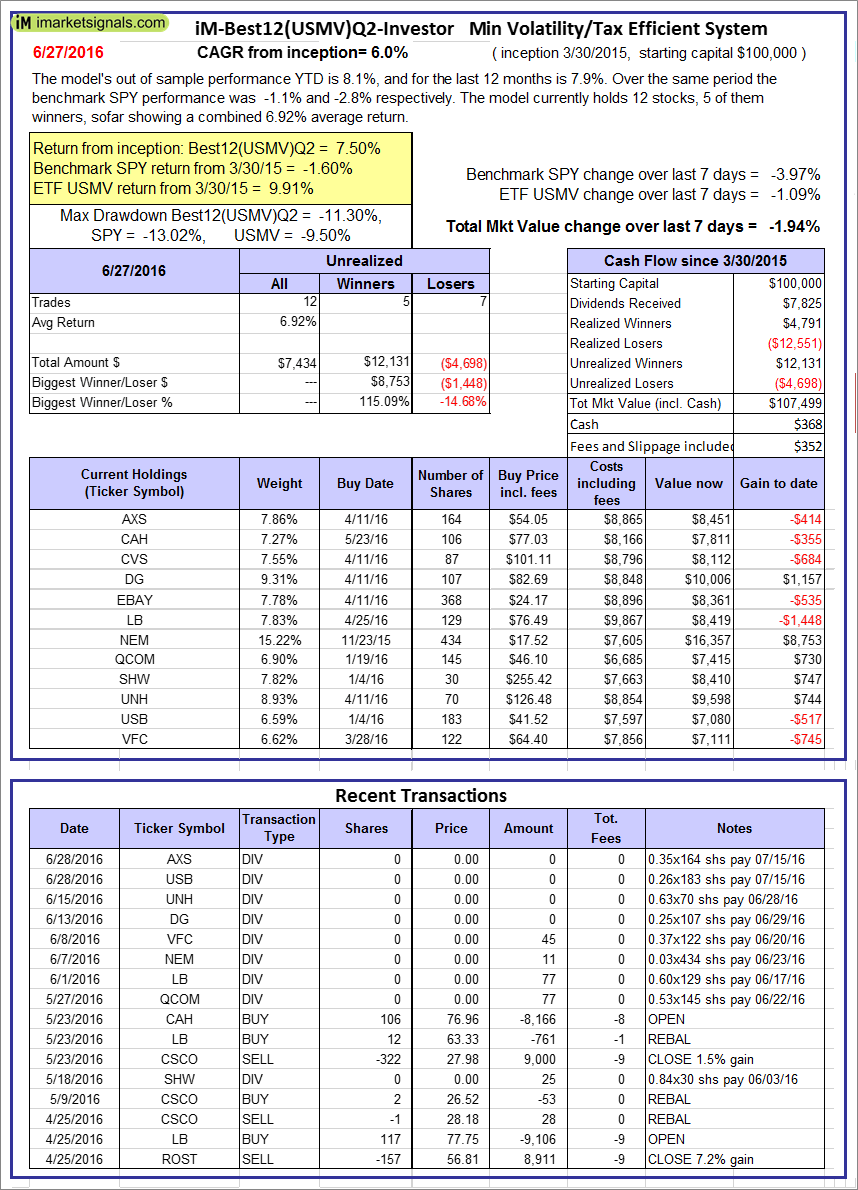 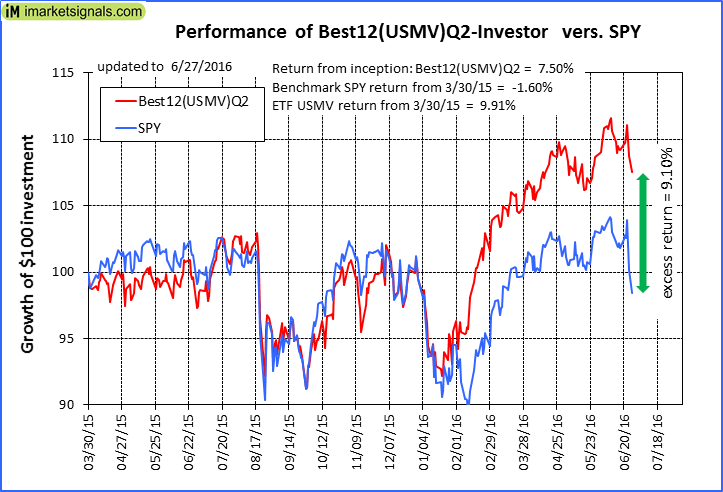 |
iM-Best12(USMV)Q2-Investor: The model’s out of sample performance YTD is 8.1%, and for the last 12 months is 7.9%. Over the same period the benchmark SPY performance was -1.1% and -2.8% respectively. Since inception, on 3/31/2015, the model gained 7.50% while the benchmark SPY gained -1.60% and the ETF USMV gained 9.91% over the same period. Over the previous week the market value of iM-Best12(USMV)Q2 gained -1.94% at a time when SPY gained -3.97%. A starting capital of $100,000 at inception on 3/31/2015 would have grown to $107,499 which includes $368 cash and excludes $352 spent on fees and slippage. |
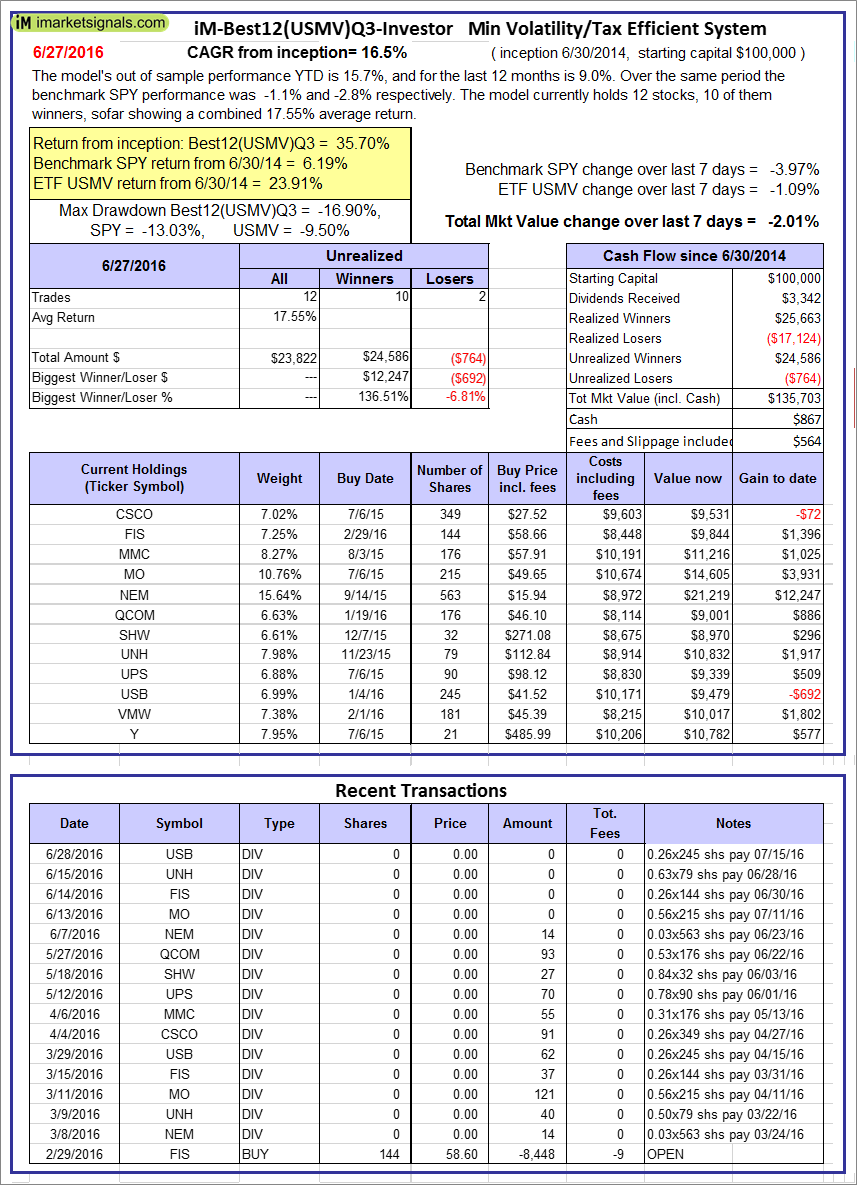 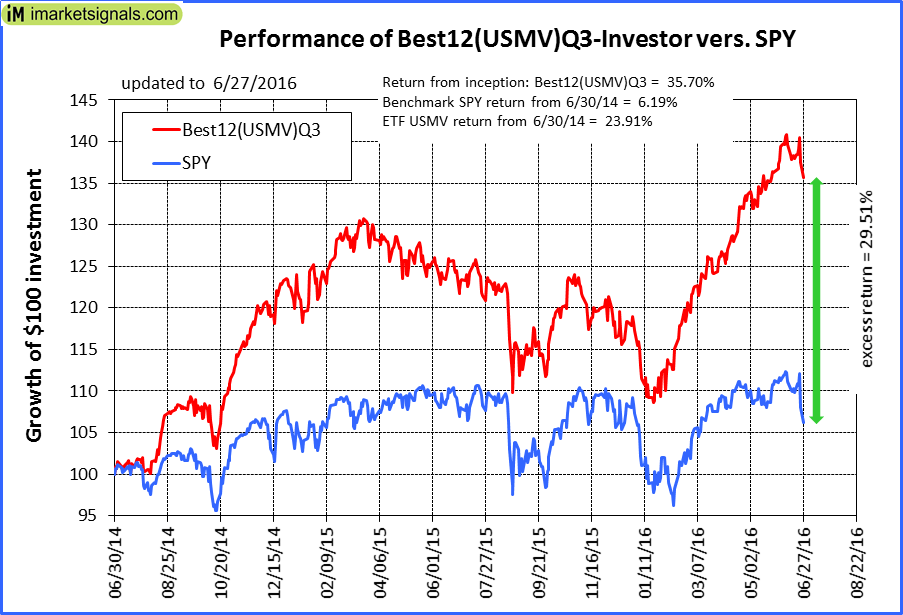 |
iM-Best12(USMV)Q3-Investor: The model’s out of sample performance YTD is 15.7%, and for the last 12 months is 9.0%. Over the same period the benchmark SPY performance was -1.1% and -2.8% respectively. Since inception, on 7/1/2014, the model gained 35.70% while the benchmark SPY gained 6.19% and the ETF USMV gained 23.91% over the same period. Over the previous week the market value of iM-Best12(USMV)Q3 gained -2.01% at a time when SPY gained -3.97%. A starting capital of $100,000 at inception on 7/1/2014 would have grown to $135,703 which includes $867 cash and excludes $564 spent on fees and slippage. |
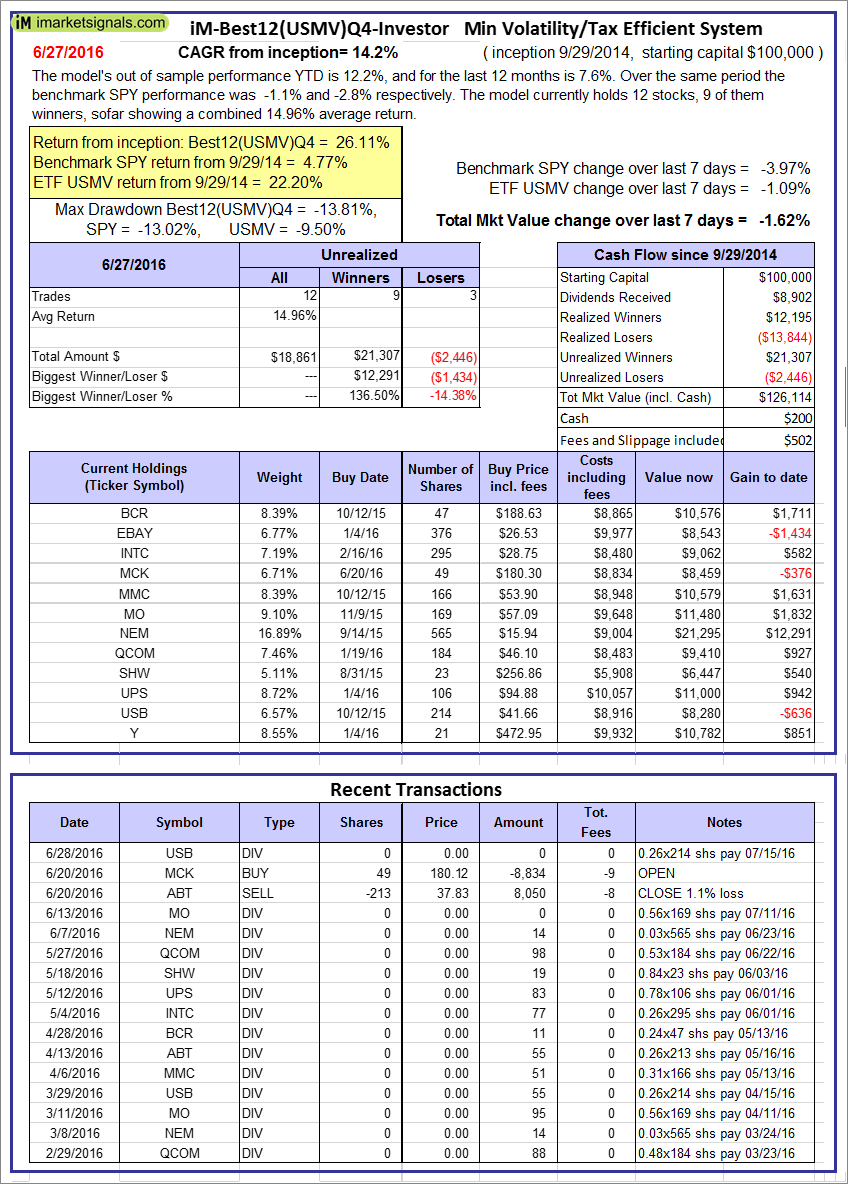 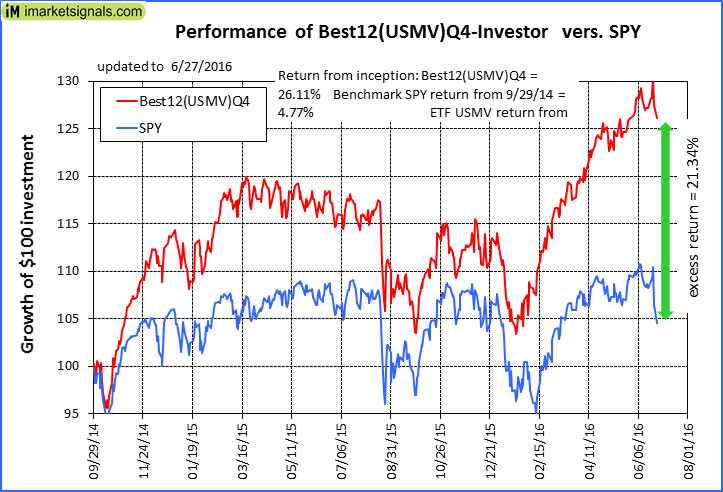 |
iM-Best12(USMV)Q4-Investor: Since inception, on 9/30/2014, the model gained 26.11% while the benchmark SPY gained 4.77% and the ETF USMV gained 22.20% over the same period. Over the previous week the market value of iM-Best12(USMV)Q4 gained -1.62% at a time when SPY gained -3.97%. A starting capital of $100,000 at inception on 9/30/2014 would have grown to $126,114 which includes $200 cash and excludes $502 spent on fees and slippage. |
 |
Average Performance of iM-Best12(USMV)Q1+Q2+Q3+Q4-Investor resulted in an excess return of 27.68% over SPY. (see iM-USMV Investor Portfolio) |
 |
iM-Best(Short): The model’s out of sample performance YTD is -6.3%, and for the last 12 months is -7.6%. Over the same period the benchmark SPY performance was -1.1% and -2.8% respectively. Over the previous week the market value of iM-Best(Short) gained 0.00% at a time when SPY gained -3.97%. Over the period 1/2/2009 to 6/27/2016 the starting capital of $100,000 would have grown to $98,105 which includes $98,105 cash and excludes $19,220 spent on fees and slippage. |
iM-Best Reports – 6/27/2016
Posted in pmp SPY-SH
Leave a Reply
You must be logged in to post a comment.