
  |
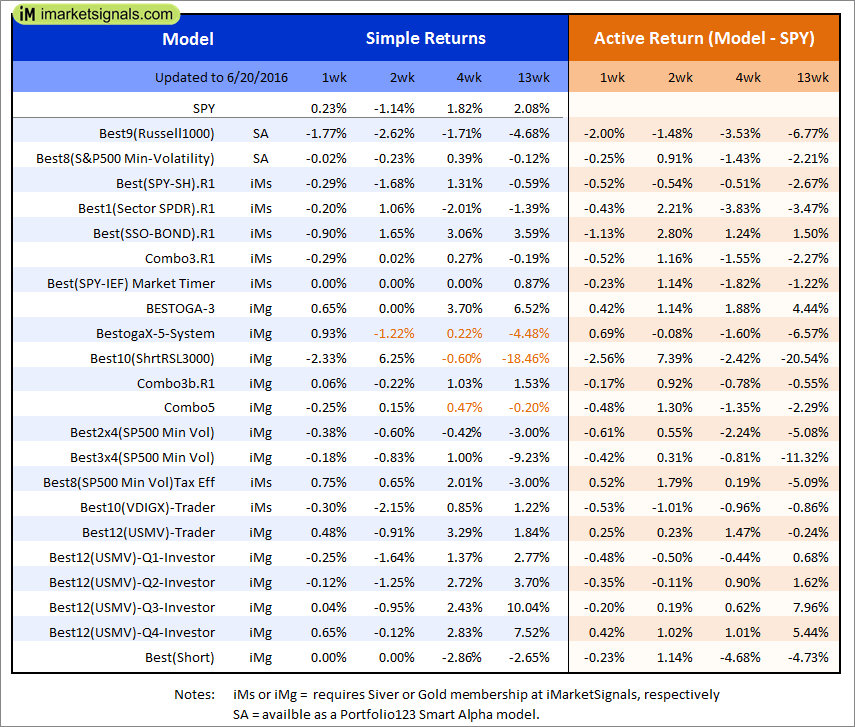
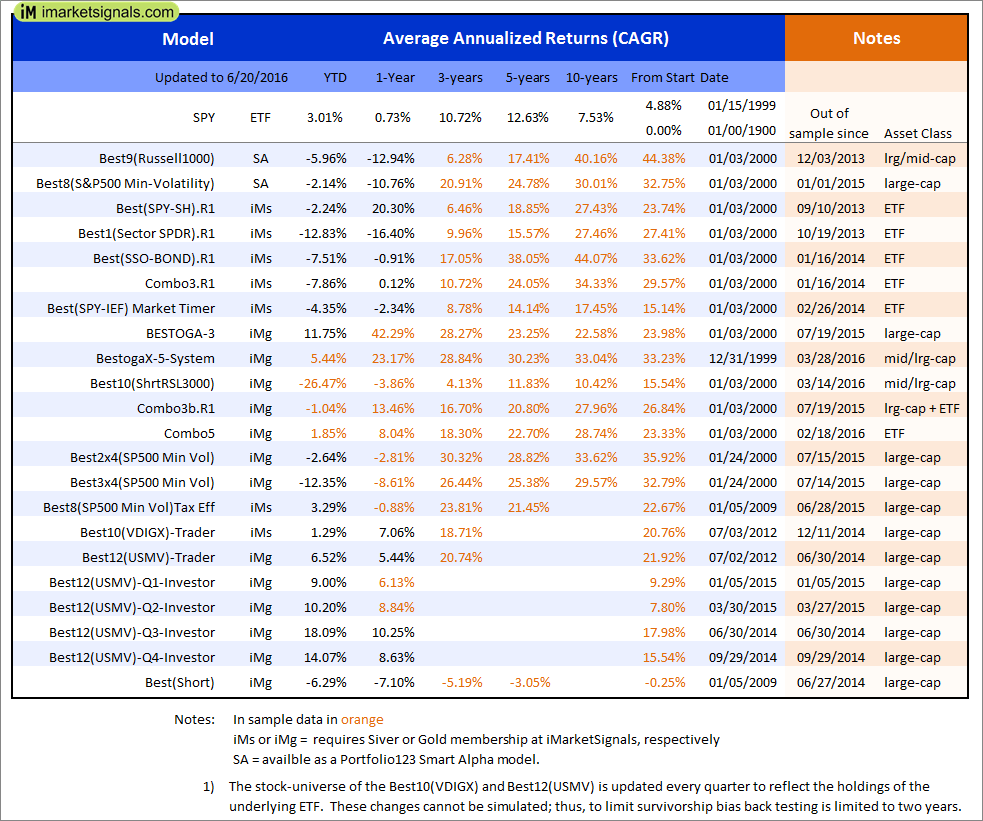
Out of sample performance summary of our models for the past 1, 2, 4 and 13 week periods. The active active return indicates how the models over- or underperformed the benchmark ETF SPY. Also the YTD, and the 1-, 3-, 5- and 10-year annualized returns are shown in the second table |
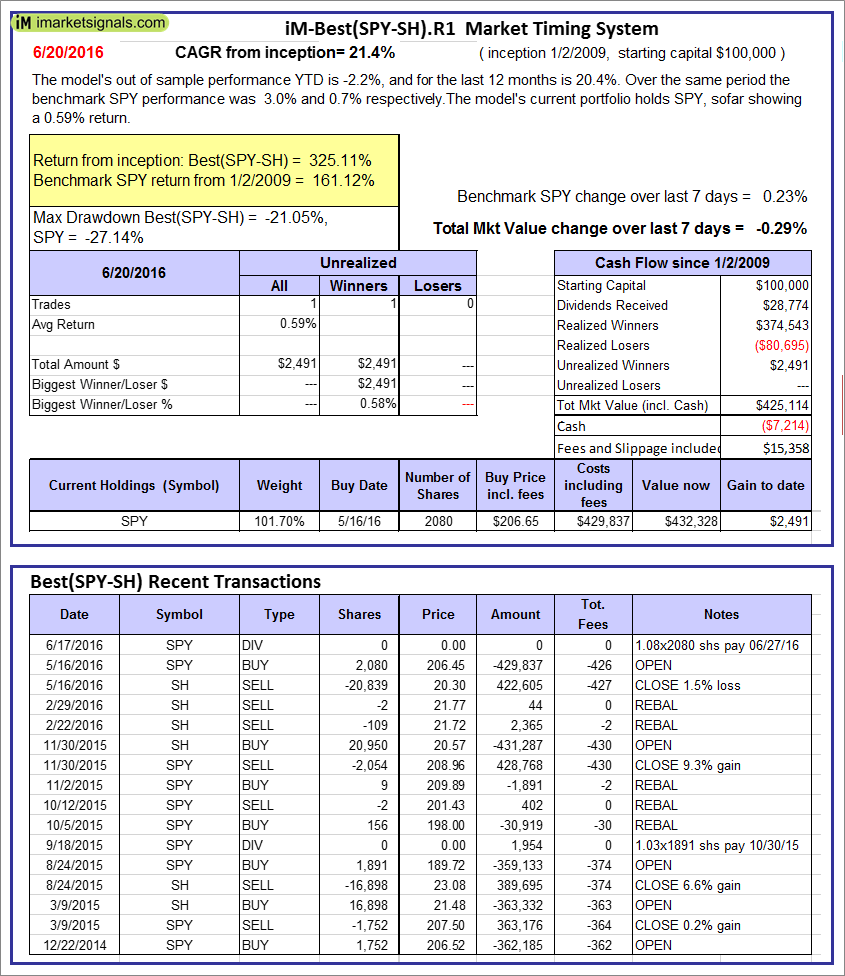 |
iM-Best(SPY-SH).R1: The model’s out of sample performance YTD is -2.2%, and for the last 12 months is 20.4%. Over the same period the benchmark SPY performance was 3.0% and 0.7% respectively. Over the previous week the market value of Best(SPY-SH) gained -0.29% at a time when SPY gained 0.23%. A starting capital of $100,000 at inception on 1/2/2009 would have grown to $425,114 which includes -$7,214 cash and excludes $15,358 spent on fees and slippage. |
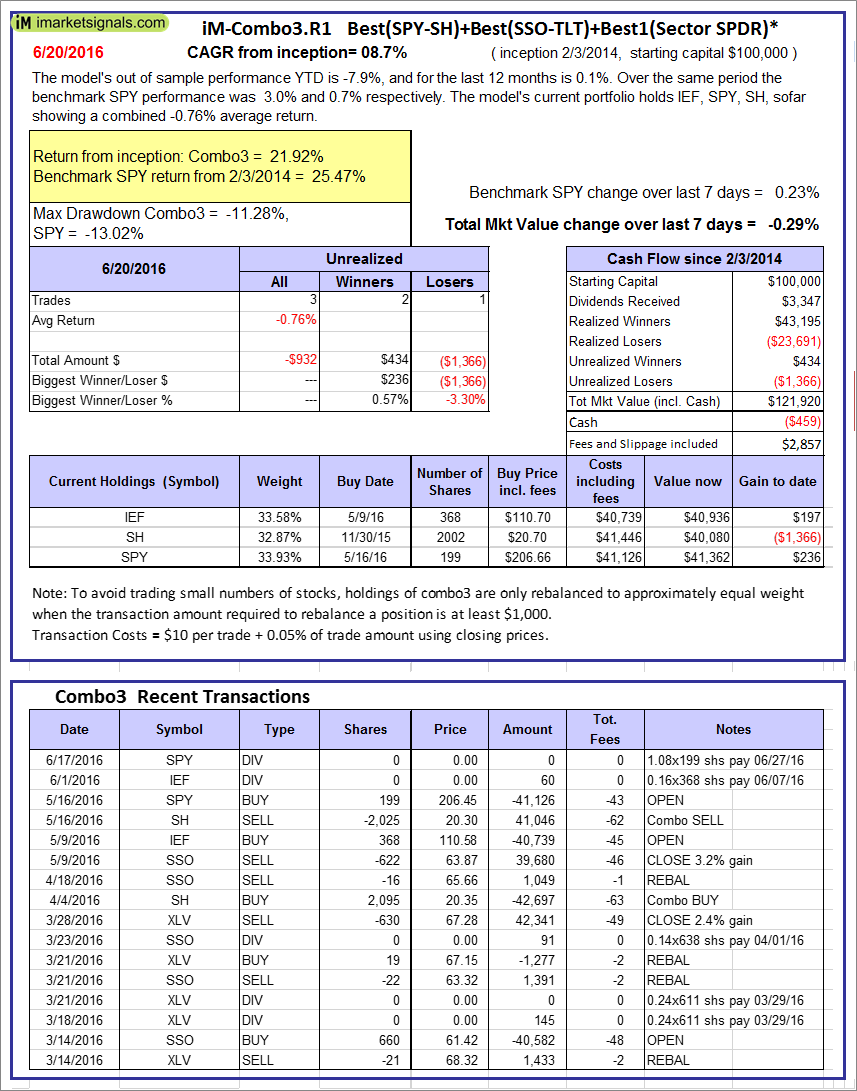 |
iM-Combo3.R1: The model’s out of sample performance YTD is -7.9%, and for the last 12 months is 0.1%. Over the same period the benchmark SPY performance was 3.0% and 0.7% respectively. Over the previous week the market value of iM-Combo3.R1 gained -0.29% at a time when SPY gained 0.23%. A starting capital of $100,000 at inception on 2/3/2014 would have grown to $121,920 which includes -$459 cash and excludes $2,857 spent on fees and slippage. |
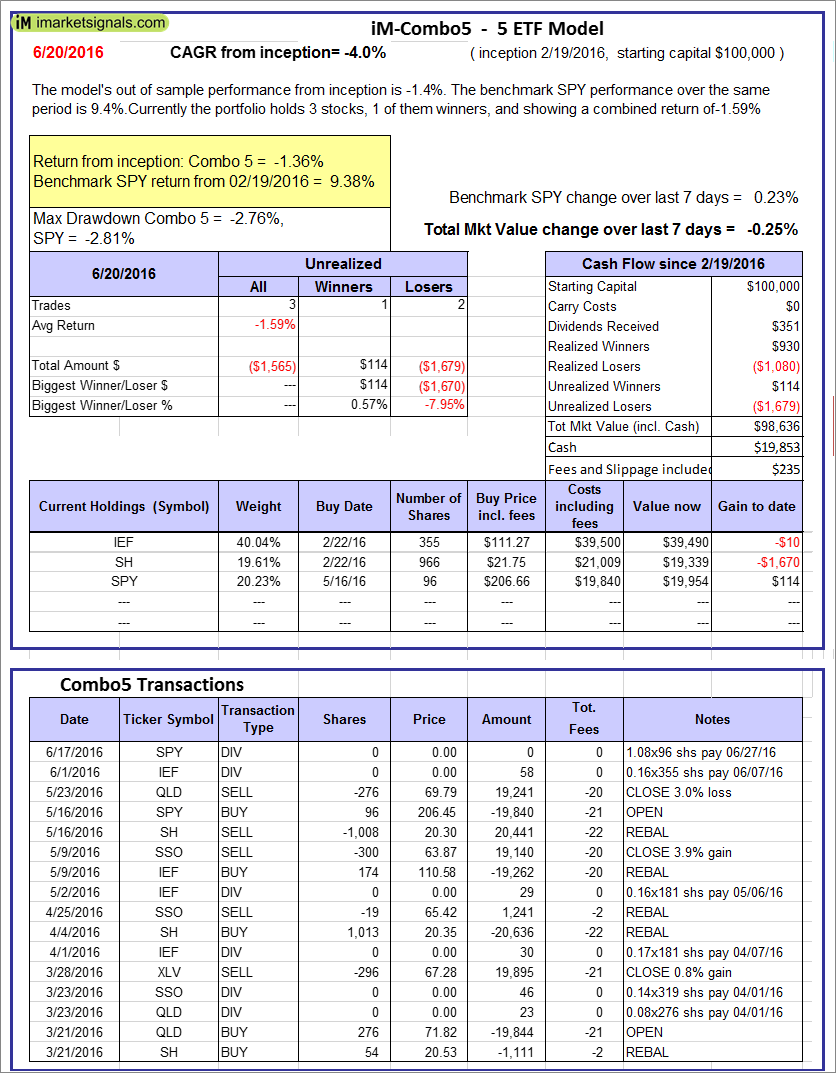 |
iM-Combo5: The model’s out of sample performance from inception is -1.4%. The benchmark SPY performance over the same period is 9.4%. Over the previous week the market value of iM-Combo5 gained -0.25% at a time when SPY gained 0.23%. A starting capital of $100,000 at inception on 2/22/2016 would have grown to $98,636 which includes $19,853 cash and excludes $235 spent on fees and slippage. |
 |
The iM-Best8(S&P500 Min Vol)Tax-Efficient The model’s out of sample performance YTD is 3.3%, and for the last 12 months is -0.9%. Over the same period the benchmark SPY performance was 3.0% and 0.7% respectively. Over the previous week the market value of iM-Best8(S&P 500)Tax-Eff. gained 0.75% at a time when SPY gained 0.23%. A starting capital of $100,000 at inception on 1/2/2009 would have grown to $460,029 which includes $187,298 cash and excludes $6,973 spent on fees and slippage. |
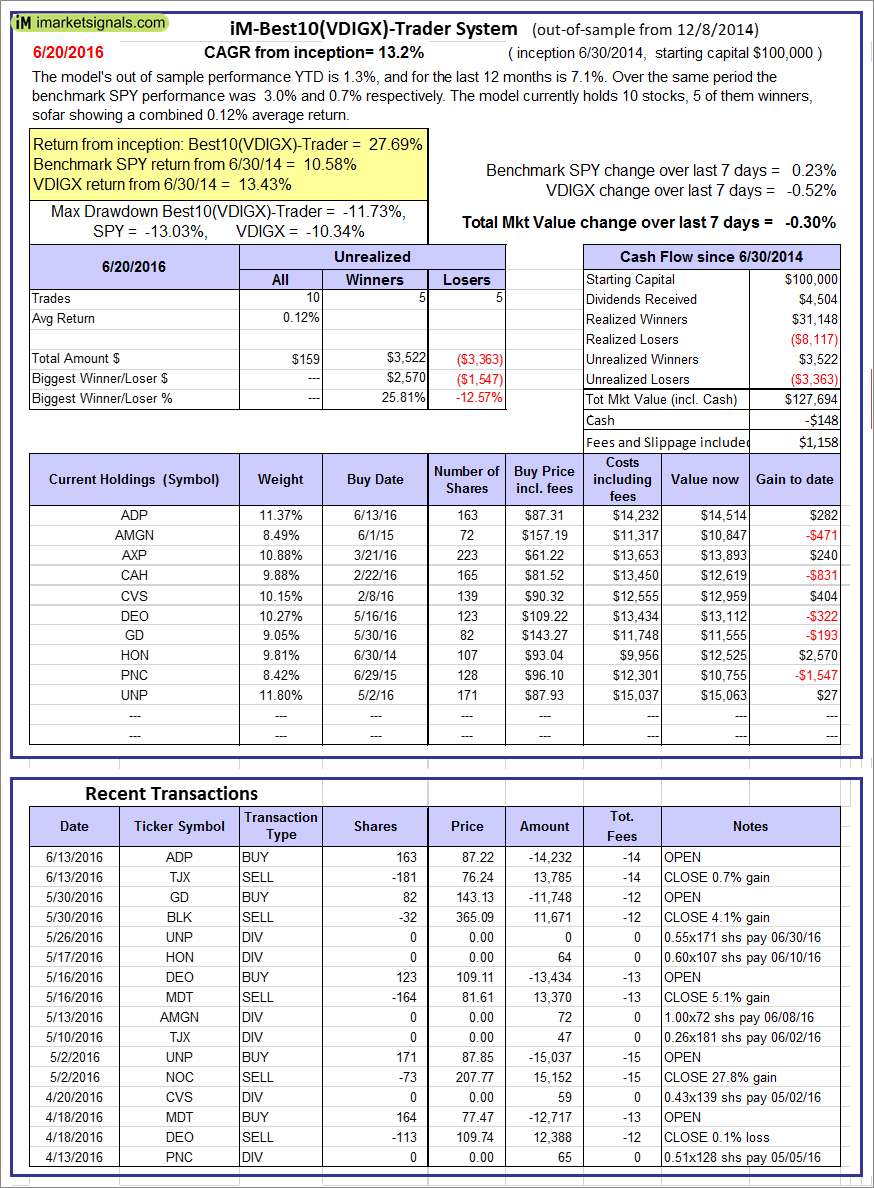 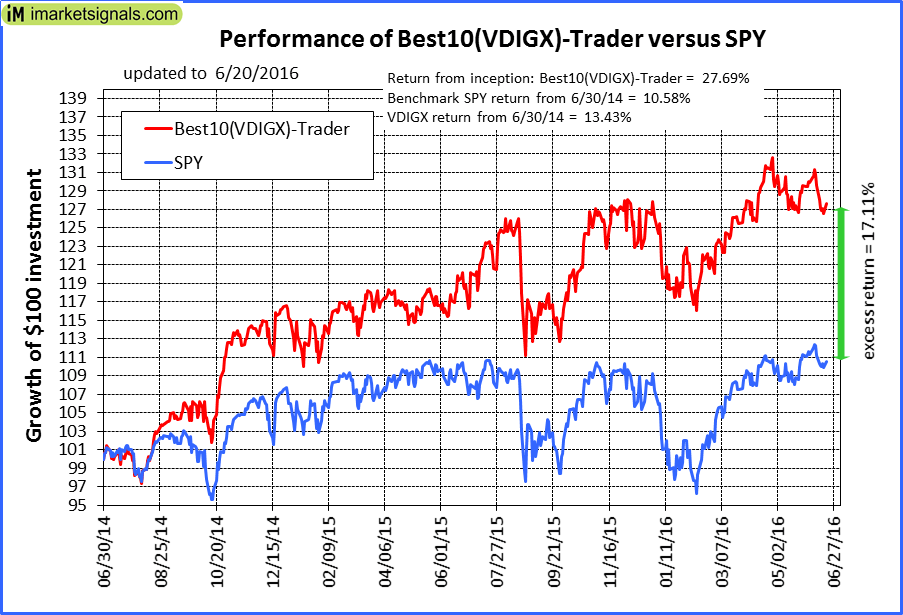 |
iM-Best10(VDIGX)-Trader: The model’s out of sample performance YTD is 1.3%, and for the last 12 months is 7.1%. Over the same period the benchmark SPY performance was 3.0% and 0.7% respectively. Since inception, on 7/1/2014, the model gained 27.69% while the benchmark SPY gained 10.58% and the ETF VDIGX gained 13.43% over the same period. Over the previous week the market value of iM-Best10(VDIGX) gained -0.30% at a time when SPY gained 0.23%. A starting capital of $100,000 at inception on 7/1/2014 would have grown to $127,694 which includes -$148 cash and excludes $1,158 spent on fees and slippage. |
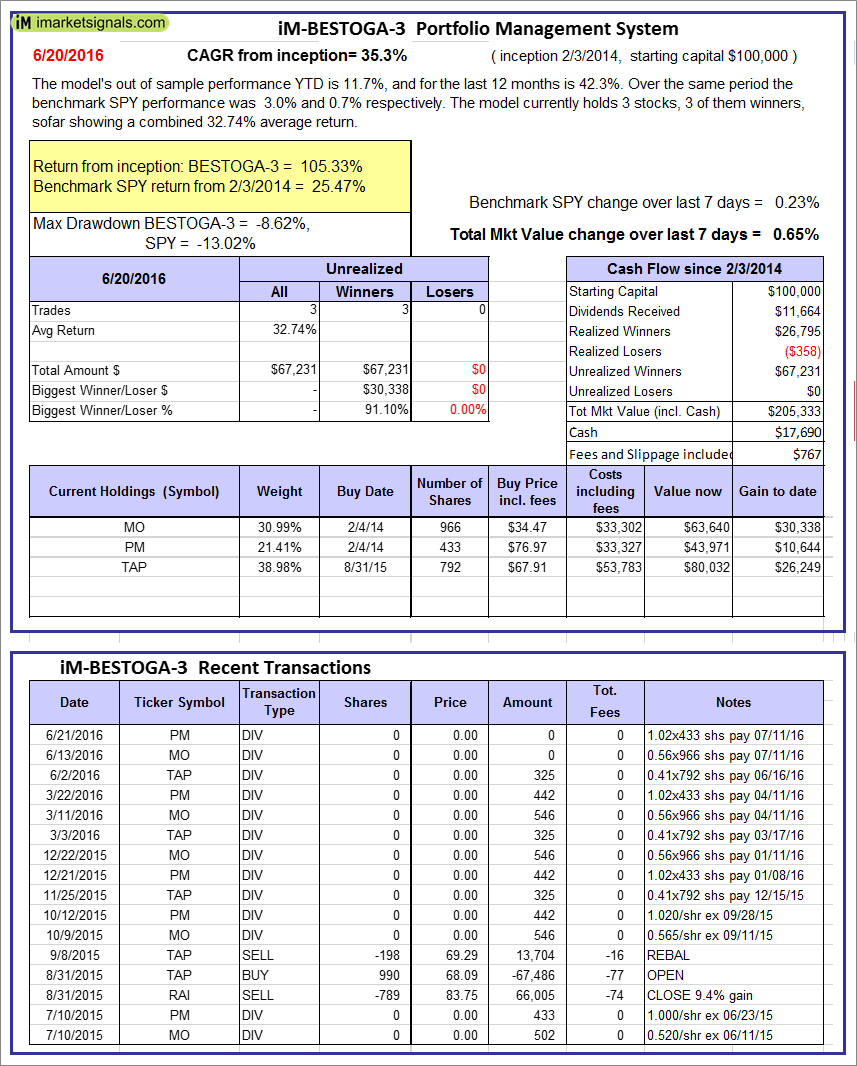 |
iM-BESTOGA-3: The model’s out of sample performance YTD is 11.7%, and for the last 12 months is 42.3%. Over the same period the benchmark SPY performance was 3.0% and 0.7% respectively. Over the previous week the market value of iM-BESTOGA-3 gained 0.65% at a time when SPY gained 0.23%. A starting capital of $100,000 at inception on 2/3/2014 would have grown to $205,333 which includes $17,690 cash and excludes $767 spent on fees and slippage. |
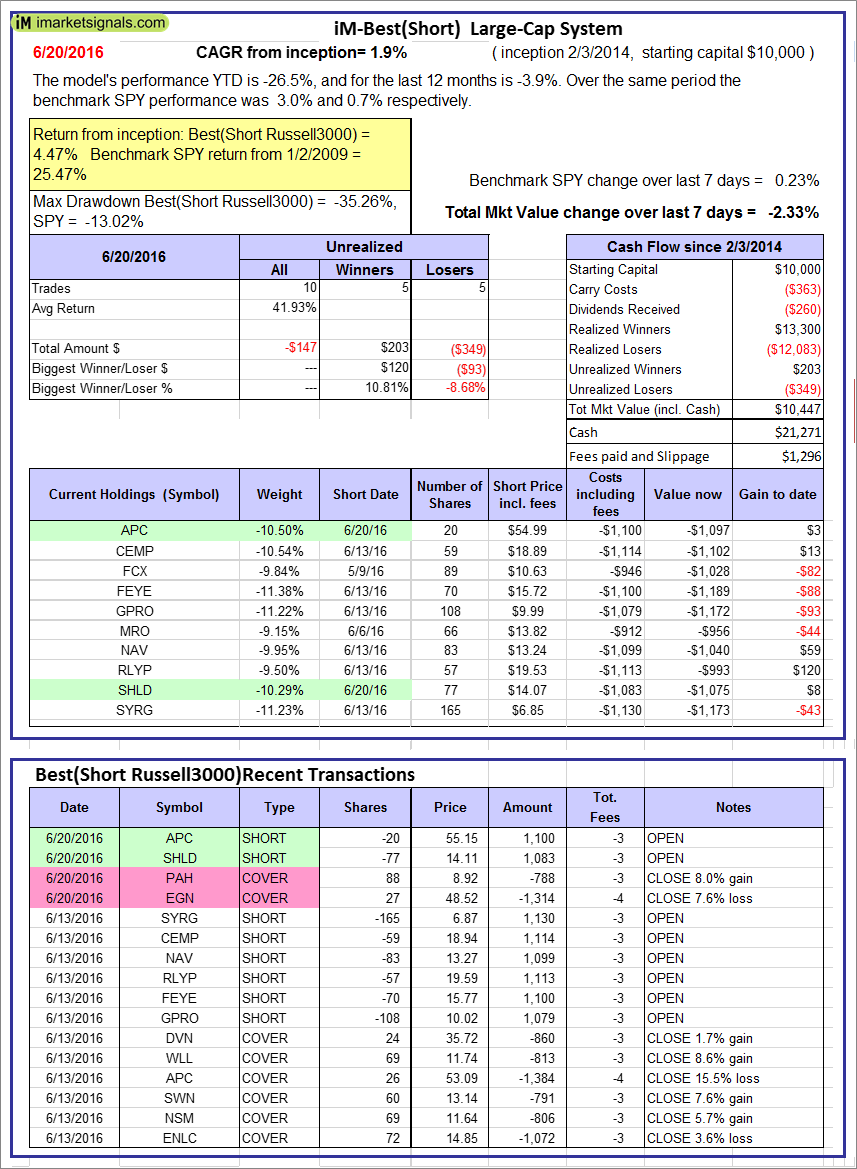 |
iM-Best10(Short Russell3000): The model’s performance YTD is -26.5%, and for the last 12 months is -3.9%. Over the same period the benchmark SPY performance was 3.0% and 0.7% respectively. Over the previous week the market value of iM-Best10(Short Russell3000) gained -2.33% at a time when SPY gained 0.23%. Over the period 2/3/2014 to 6/20/2016 the starting capital of $100,000 would have grown to $10,447 which includes $21,271 cash and excludes $1,296 spent on fees and slippage. |
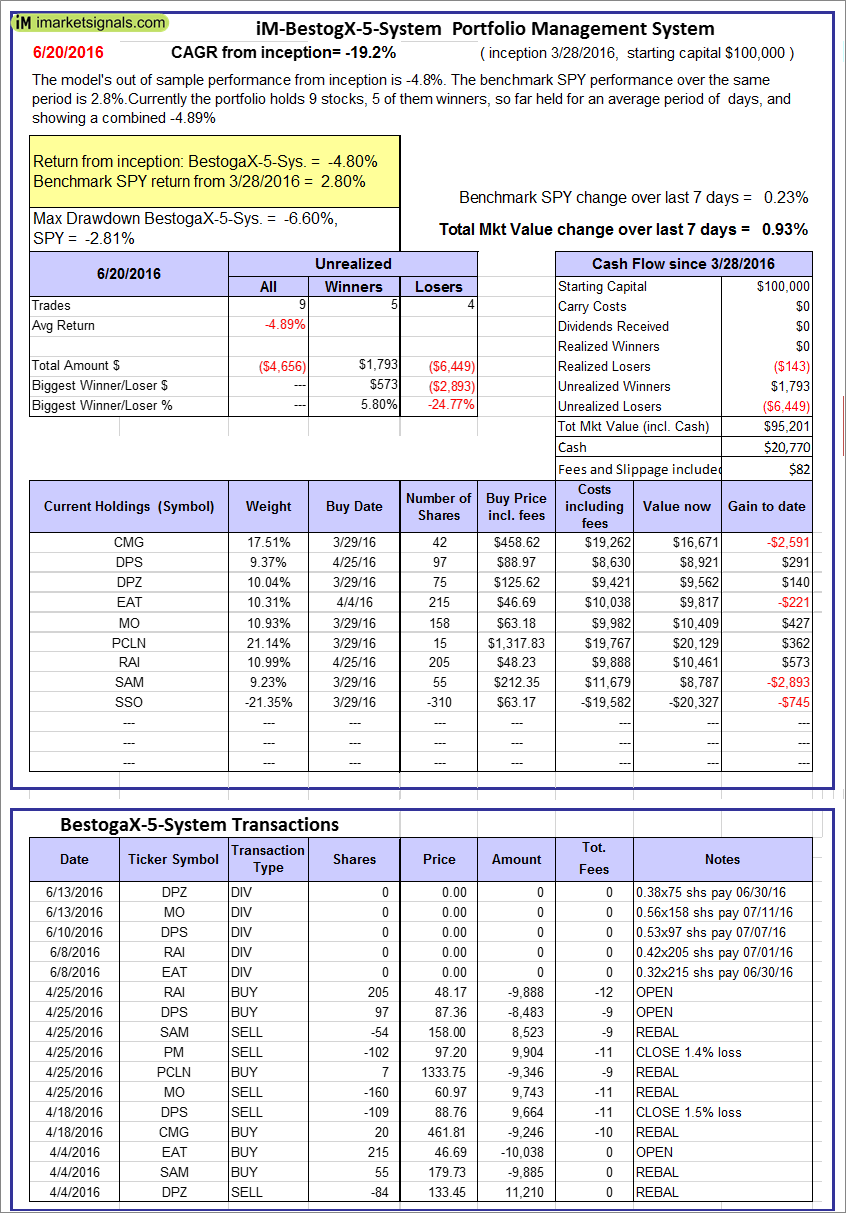 |
iM-BestogaX5-System: The model’s out of sample performance from inception is -4.8%. The benchmark SPY performance over the same period is 2.8%. Over the previous week the market value of iM-Best8(S&P 500)Tax-Eff. gained 0.93% at a time when SPY gained 0.23%. A starting capital of $100,000 at inception on 1/2/2009 would have grown to $95,201 which includes $20,770 cash and excludes $82 spent on fees and slippage. |
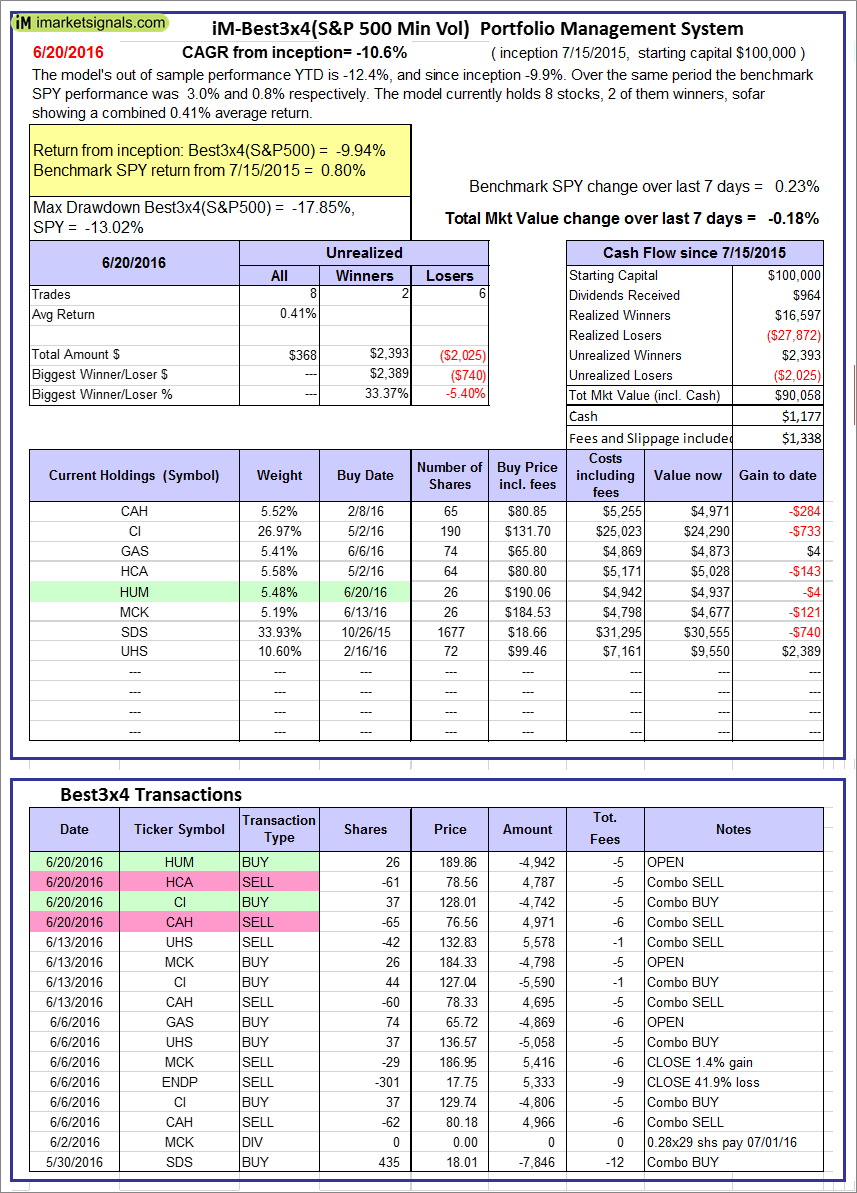 |
iM-Best3x4(S&P 500 Min Vol): The model’s out of sample performance YTD is -12.4%, and since inception -9.9%. Over the same period the benchmark SPY performance was 3.0% and 0.8% respectively. Over the previous week the market value of iM-Best3x4 gained -0.18% at a time when SPY gained 0.23%. A starting capital of $100,000 at inception on 7/15/2015 would have grown to $90,058 which includes $1,177 cash and excludes $1,338 spent on fees and slippage. |
 |
iM-Best2x4(S&P 500 Min Vol): The model’s out of sample performance YTD is -2.6%, and since inception -3.8%. Over the same period the benchmark SPY performance was 3.0% and 0.8% respectively. Over the previous week the market value of iM-Best2x4 gained -0.38% at a time when SPY gained 0.23%. A starting capital of $100,000 at inception on 7/16/2015 would have grown to $96,195 which includes $797 cash and excludes $1,020 spent on fees and slippage. |
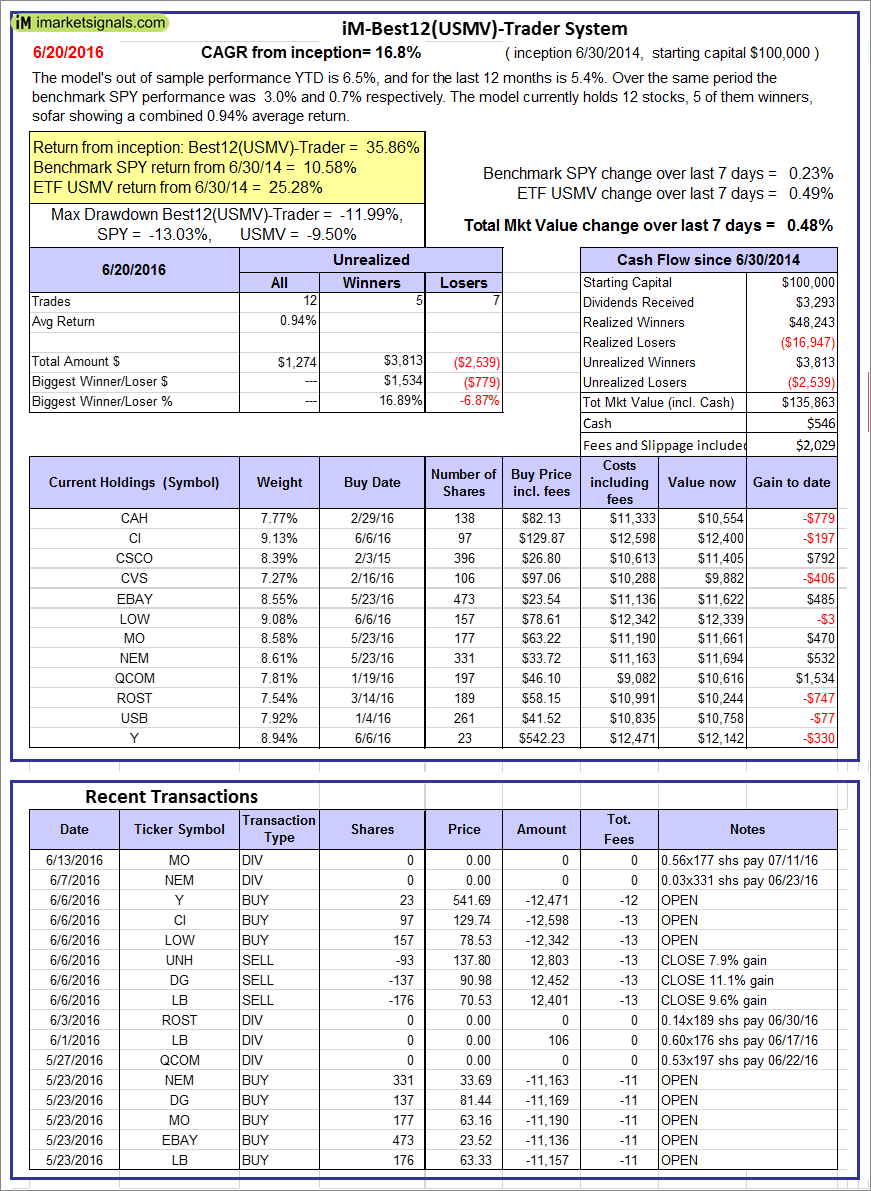 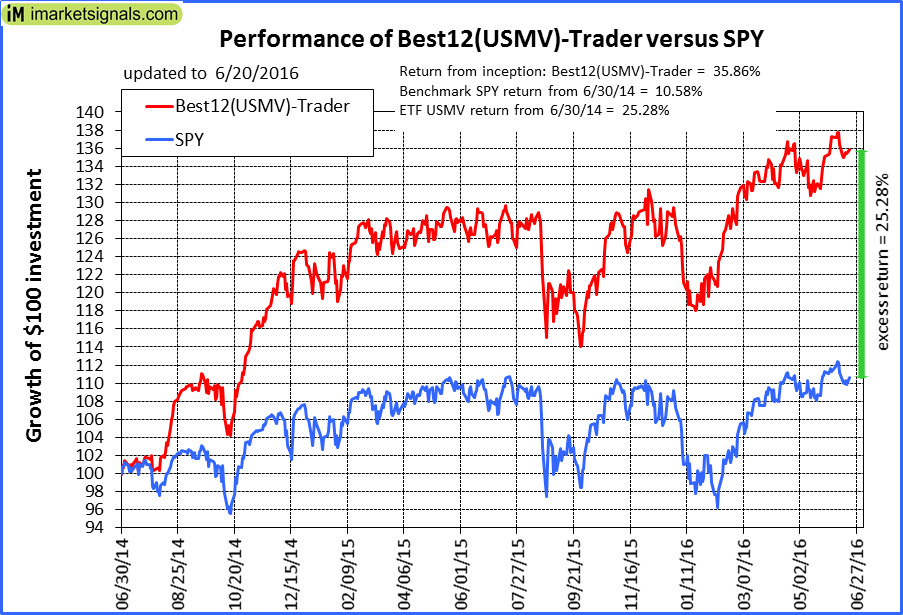 |
iM-Best12(USMV)-Trader: The model’s out of sample performance YTD is 6.5%, and for the last 12 months is 5.4%. Over the same period the benchmark SPY performance was 3.0% and 0.7% respectively. Since inception, on 7/1/2014, the model gained 35.86% while the benchmark SPY gained 10.58% and the ETF USMV gained 25.28% over the same period. Over the previous week the market value of iM-Best12(USMV)-Trader gained 0.48% at a time when SPY gained 0.23%. A starting capital of $100,000 at inception on 7/1/2014 would have grown to $135,863 which includes $546 cash and excludes $2,029 spent on fees and slippage. |
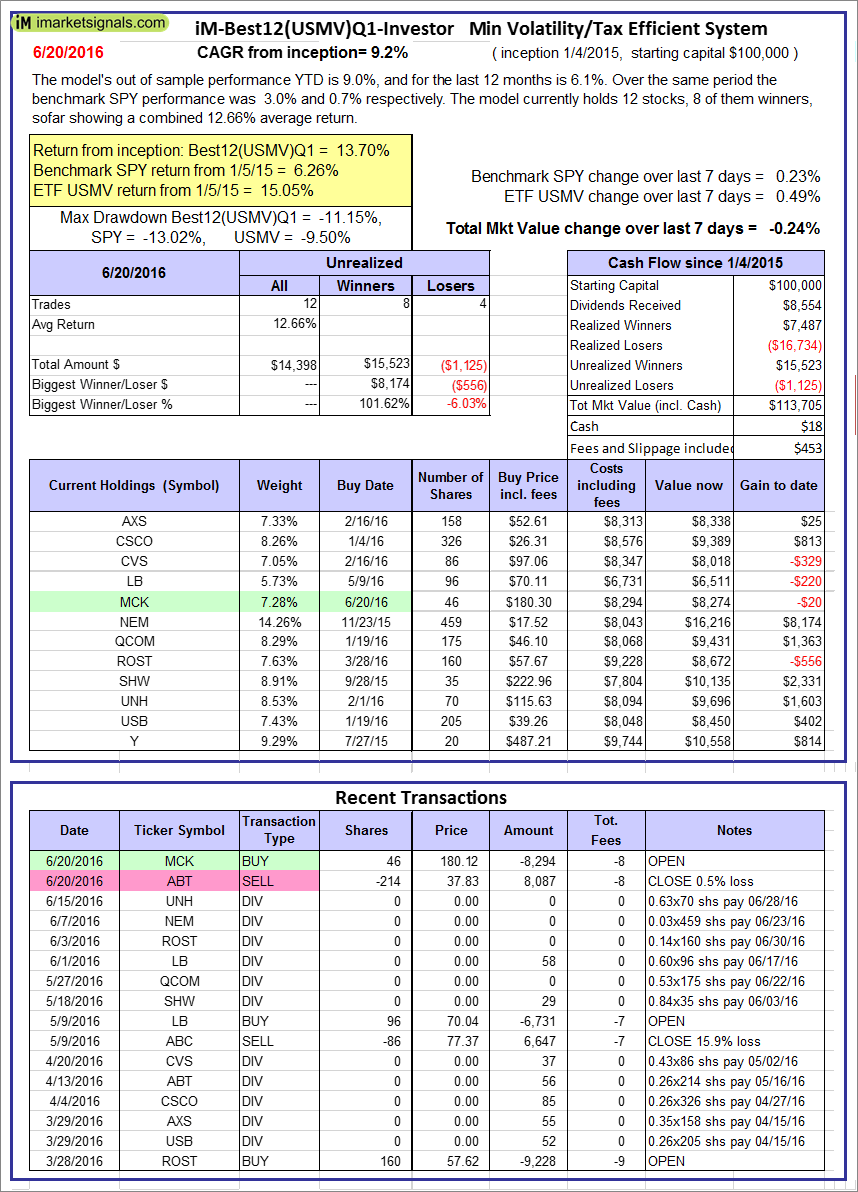  |
iM-Best12(USMV)Q1-Investor: The model’s out of sample performance YTD is 9.0%, and for the last 12 months is 6.1%. Over the same period the benchmark SPY performance was 3.0% and 0.7% respectively. Since inception, on 1/5/2015, the model gained 13.70% while the benchmark SPY gained 6.26% and the ETF USMV gained 15.05% over the same period. Over the previous week the market value of iM-Best12(USMV)Q1 gained -0.24% at a time when SPY gained 0.23%. A starting capital of $100,000 at inception on 1/5/2015 would have grown to $113,705 which includes $18 cash and excludes $453 spent on fees and slippage. |
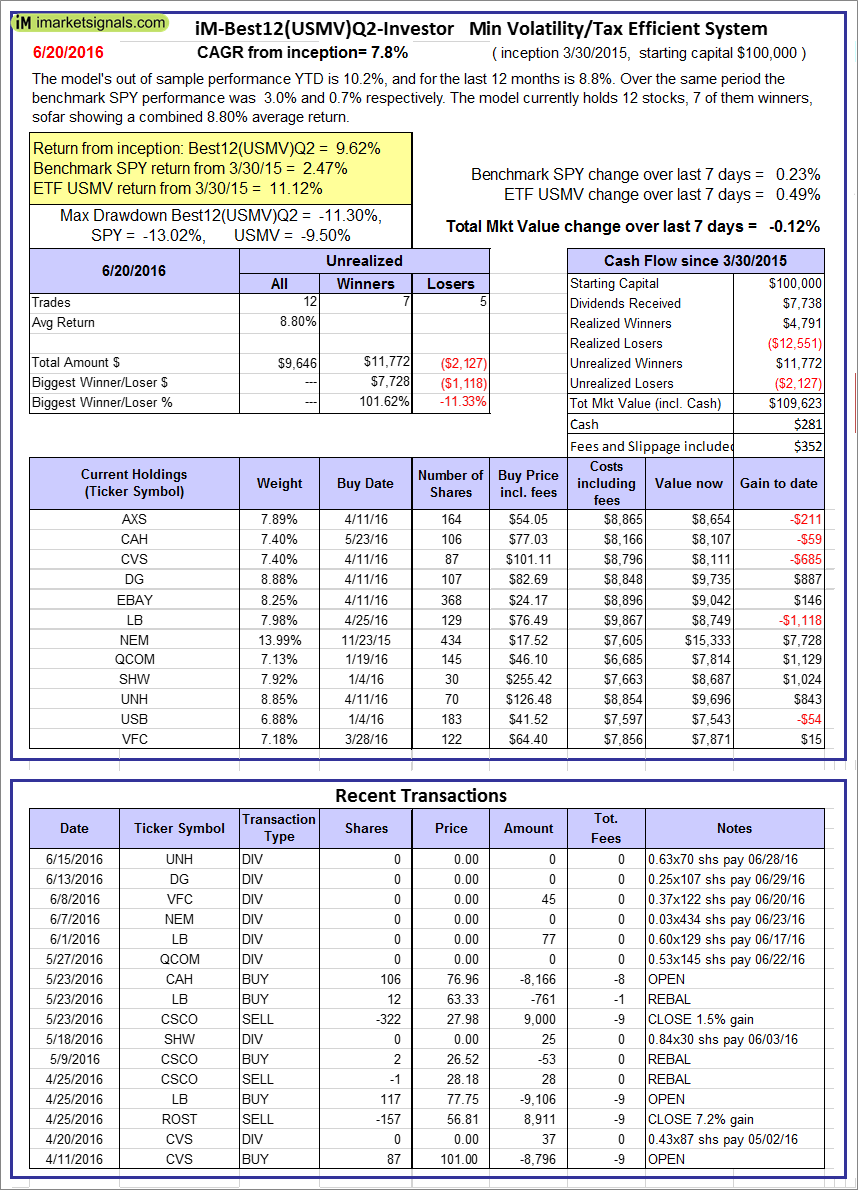 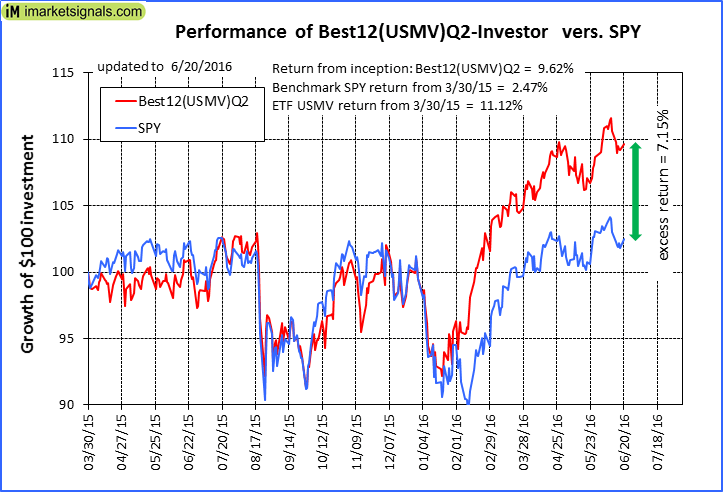 |
iM-Best12(USMV)Q2-Investor: The model’s out of sample performance YTD is 10.2%, and for the last 12 months is 8.8%. Over the same period the benchmark SPY performance was 3.0% and 0.7% respectively. Since inception, on 3/31/2015, the model gained 9.62% while the benchmark SPY gained 2.47% and the ETF USMV gained 11.12% over the same period. Over the previous week the market value of iM-Best12(USMV)Q2 gained -0.12% at a time when SPY gained 0.23%. A starting capital of $100,000 at inception on 3/31/2015 would have grown to $109,623 which includes $281 cash and excludes $352 spent on fees and slippage. |
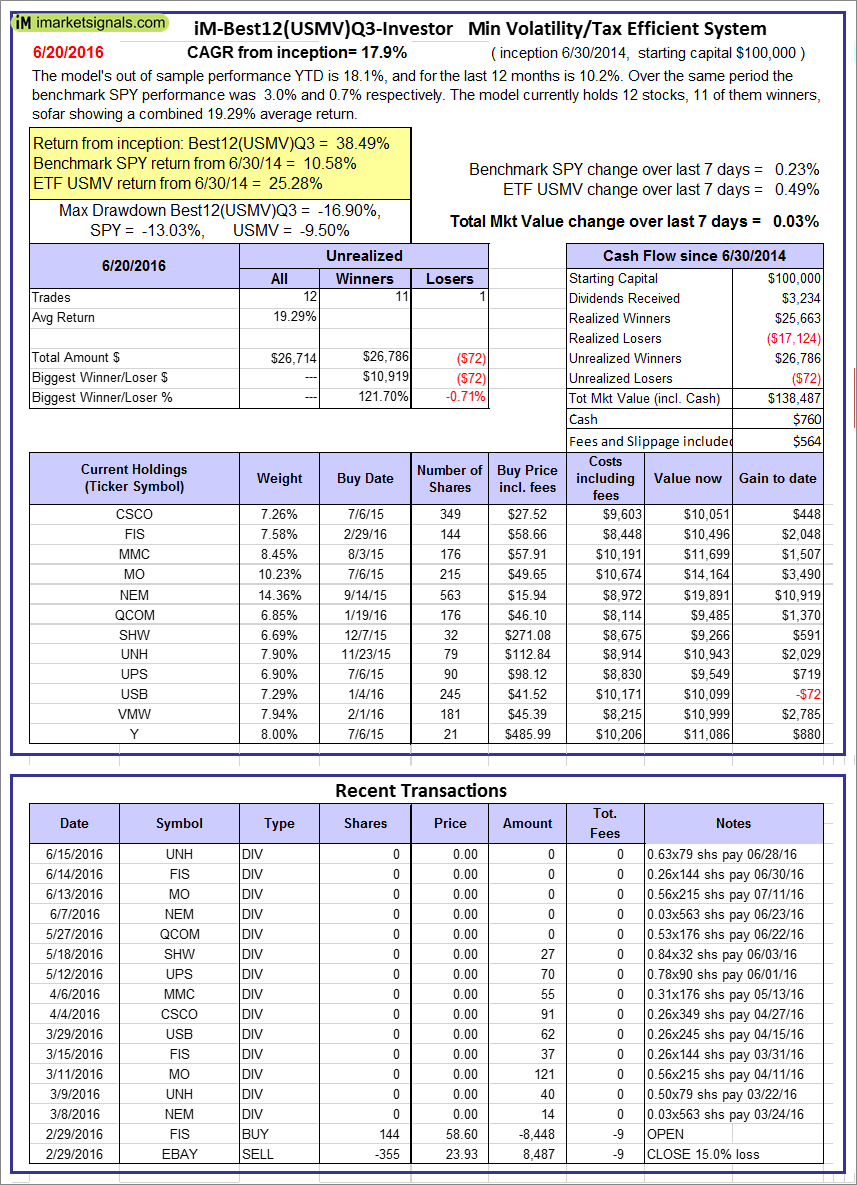 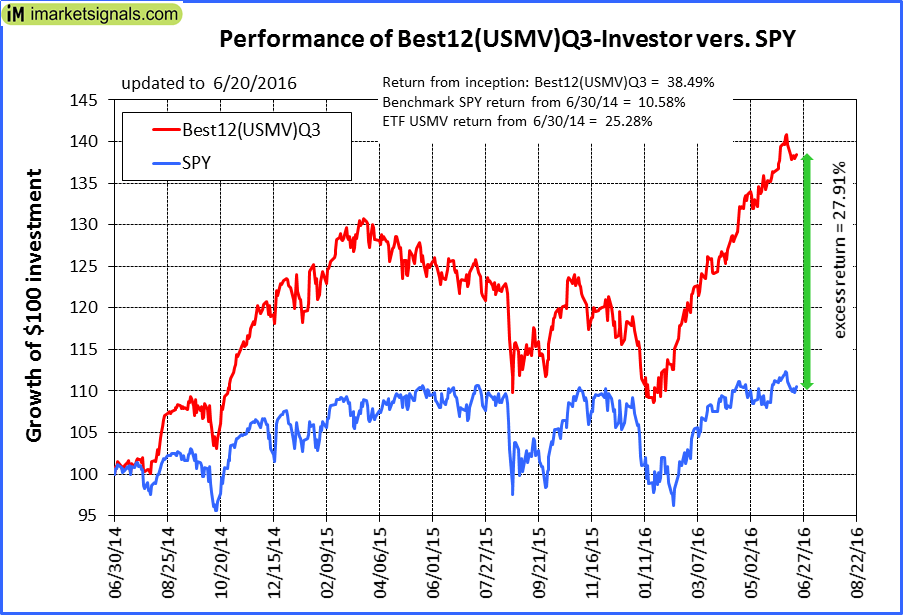 |
iM-Best12(USMV)Q3-Investor: The model’s out of sample performance YTD is 18.1%, and for the last 12 months is 10.2%. Over the same period the benchmark SPY performance was 3.0% and 0.7% respectively. Since inception, on 7/1/2014, the model gained 38.49% while the benchmark SPY gained 10.58% and the ETF USMV gained 25.28% over the same period. Over the previous week the market value of iM-Best12(USMV)Q3 gained 0.03% at a time when SPY gained 0.23%. A starting capital of $100,000 at inception on 7/1/2014 would have grown to $138,487 which includes $760 cash and excludes $564 spent on fees and slippage. |
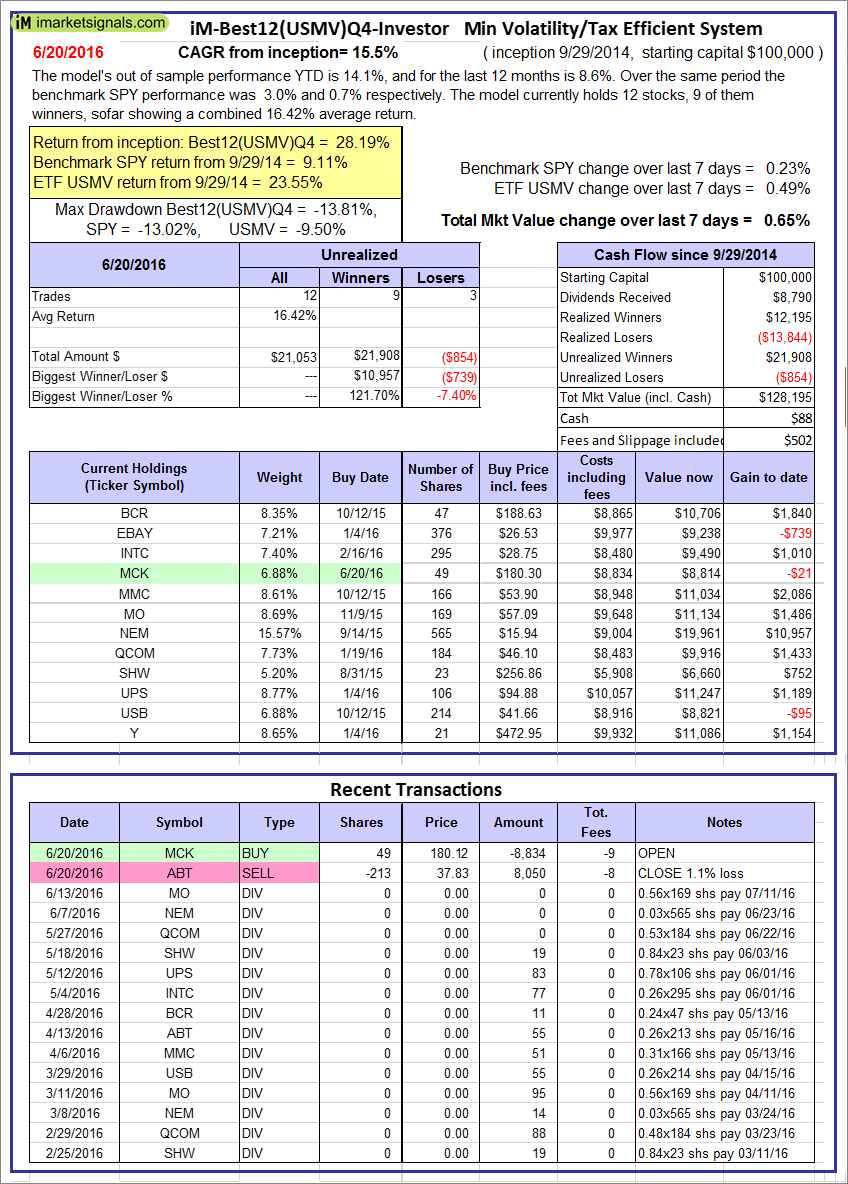  |
iM-Best12(USMV)Q4-Investor: Since inception, on 9/30/2014, the model gained 28.19% while the benchmark SPY gained 9.11% and the ETF USMV gained 23.55% over the same period. Over the previous week the market value of iM-Best12(USMV)Q4 gained 0.65% at a time when SPY gained 0.23%. A starting capital of $100,000 at inception on 9/30/2014 would have grown to $128,195 which includes $88 cash and excludes $502 spent on fees and slippage. |
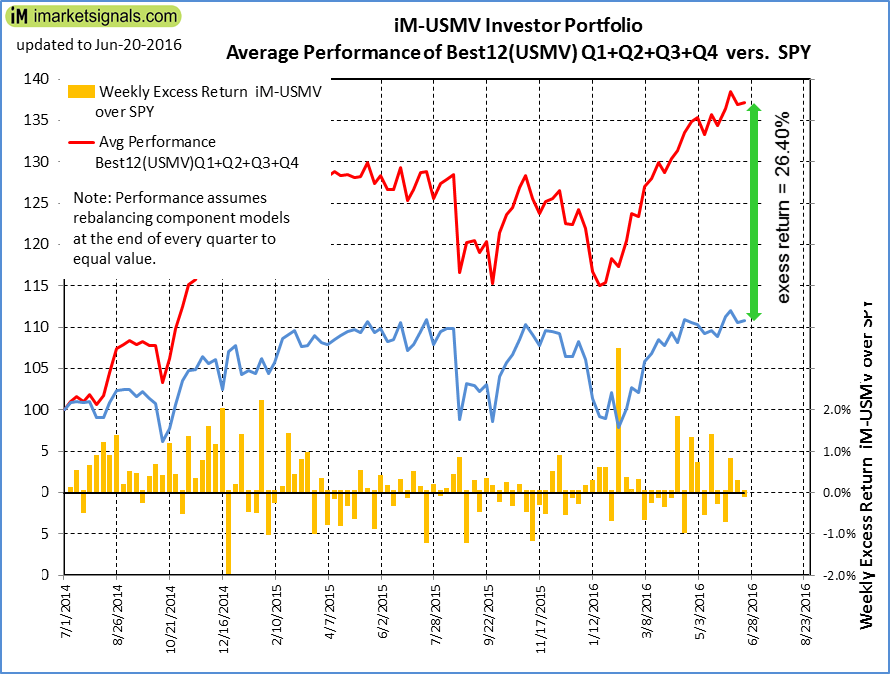 |
Average Performance of iM-Best12(USMV)Q1+Q2+Q3+Q4-Investor resulted in an excess return of 26.40% over SPY. (see iM-USMV Investor Portfolio) |
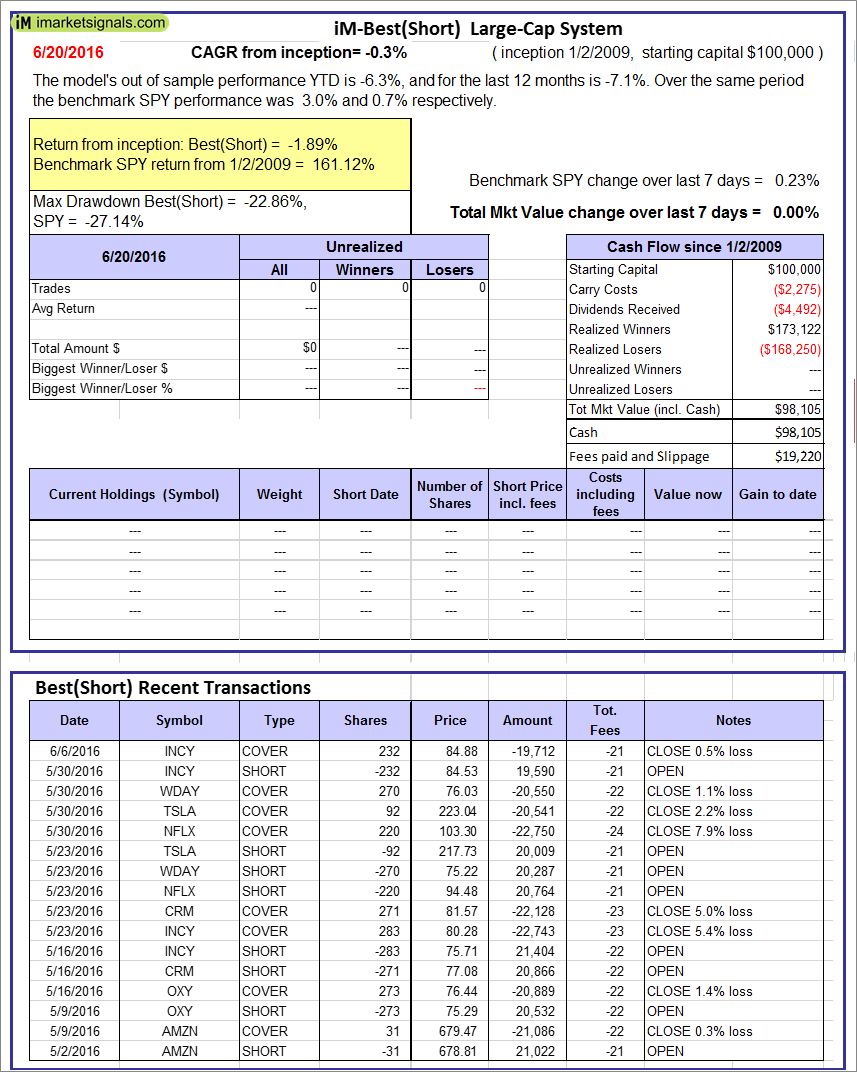 |
iM-Best(Short): The model’s out of sample performance YTD is -6.3%, and for the last 12 months is -7.1%. Over the same period the benchmark SPY performance was 3.0% and 0.7% respectively. Over the previous week the market value of iM-Best(Short) gained 0.00% at a time when SPY gained 0.23%. Over the period 1/2/2009 to 6/20/2016 the starting capital of $100,000 would have grown to $98,105 which includes $98,105 cash and excludes $19,220 spent on fees and slippage. |
iM-Best Reports – 6/20/2016
Posted in pmp SPY-SH
Leave a Reply
You must be logged in to post a comment.