
  |
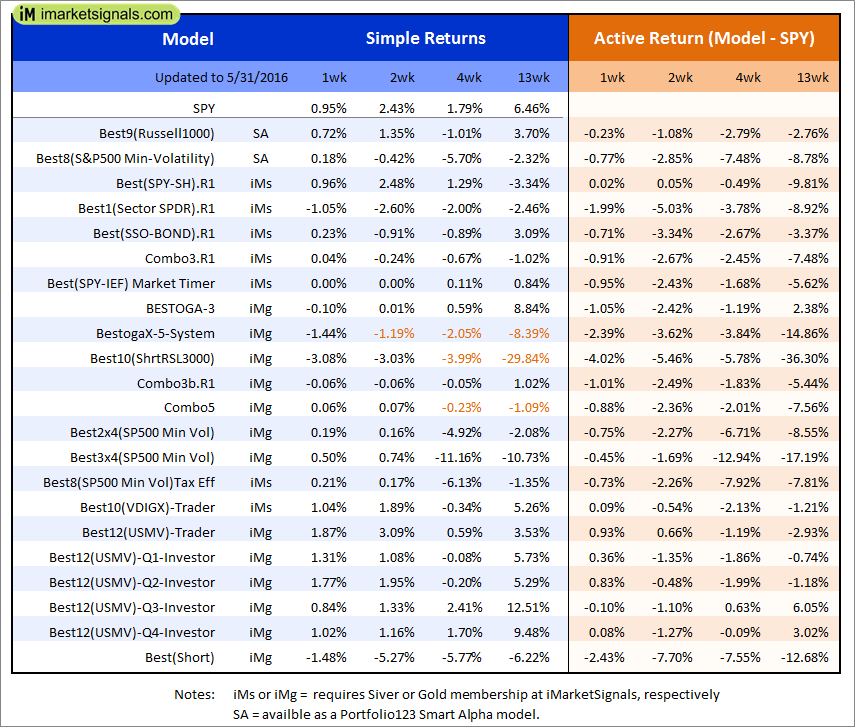
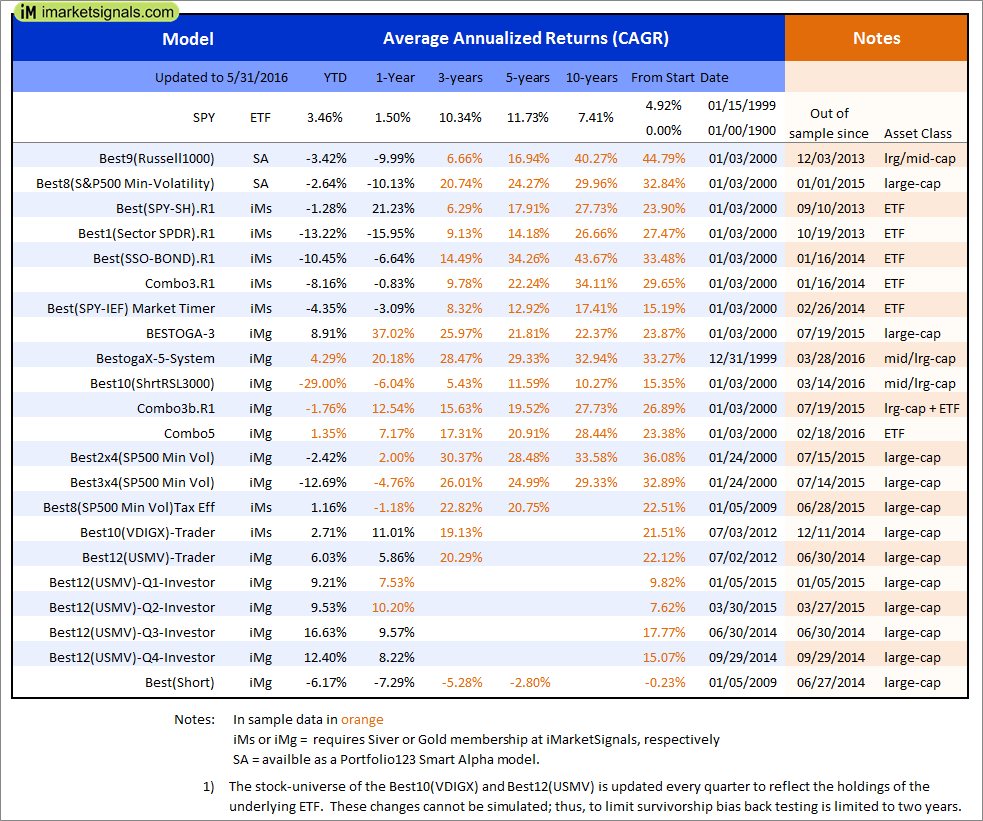
Out of sample performance summary of our models for the past 1, 2, 4 and 13 week periods. The active active return indicates how the models over- or underperformed the benchmark ETF SPY. Also the YTD, and the 1-, 3-, 5- and 10-year annualized returns are shown in the second table |
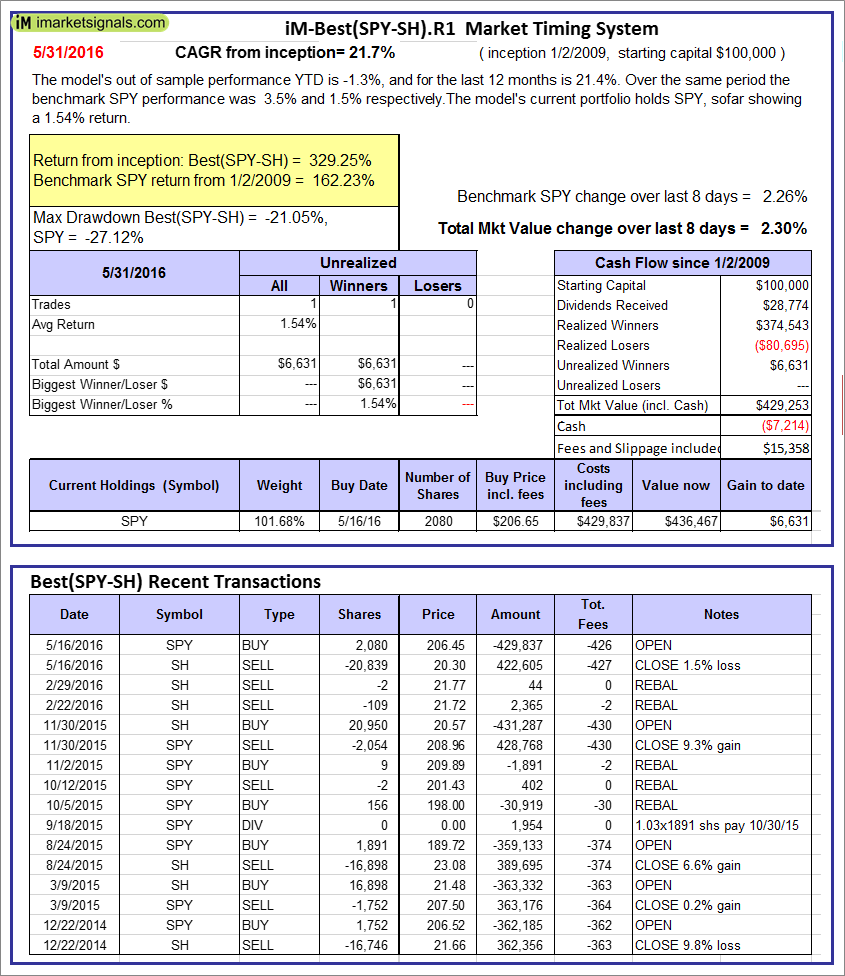 |
iM-Best(SPY-SH).R1: The model’s out of sample performance YTD is -1.3%, and for the last 12 months is 21.4%. Over the same period the benchmark SPY performance was 3.5% and 1.5% respectively. Over the previous week the market value of Best(SPY-SH) gained 2.30% at a time when SPY gained 2.26%. A starting capital of $100,000 at inception on 1/2/2009 would have grown to $429,253 which includes -$7,214 cash and excludes $15,358 spent on fees and slippage. |
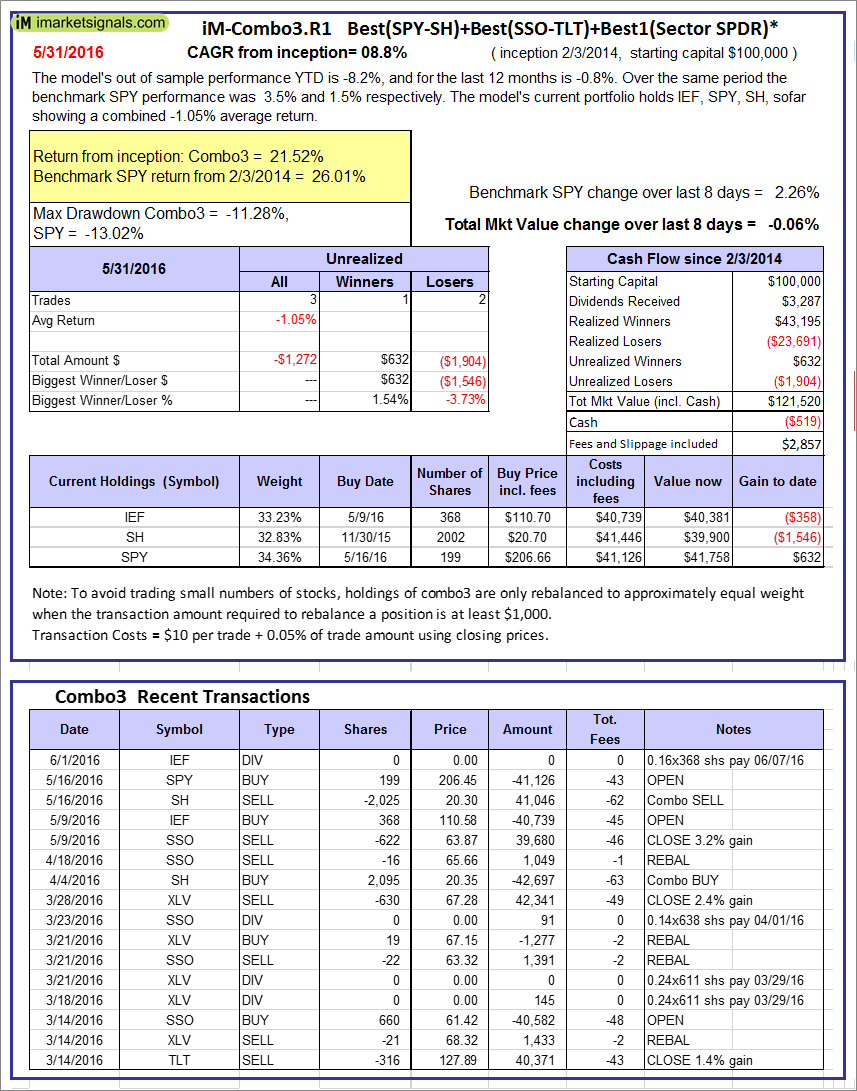 |
iM-Combo3.R1: The model’s out of sample performance YTD is -8.2%, and for the last 12 months is -0.8%. Over the same period the benchmark SPY performance was 3.5% and 1.5% respectively. Over the previous week the market value of iM-Combo3.R1 gained -0.06% at a time when SPY gained 2.26%. A starting capital of $100,000 at inception on 2/3/2014 would have grown to $121,520 which includes -$519 cash and excludes $2,857 spent on fees and slippage. |
 |
iM-Combo5: The model’s out of sample performance from inception is -1.9%. The benchmark SPY performance over the same period is 9.9%. Over the previous week the market value of iM-Combo5 gained -0.03% at a time when SPY gained 2.26%. A starting capital of $100,000 at inception on 2/22/2016 would have grown to $98,146 which includes $19,794 cash and excludes $235 spent on fees and slippage. |
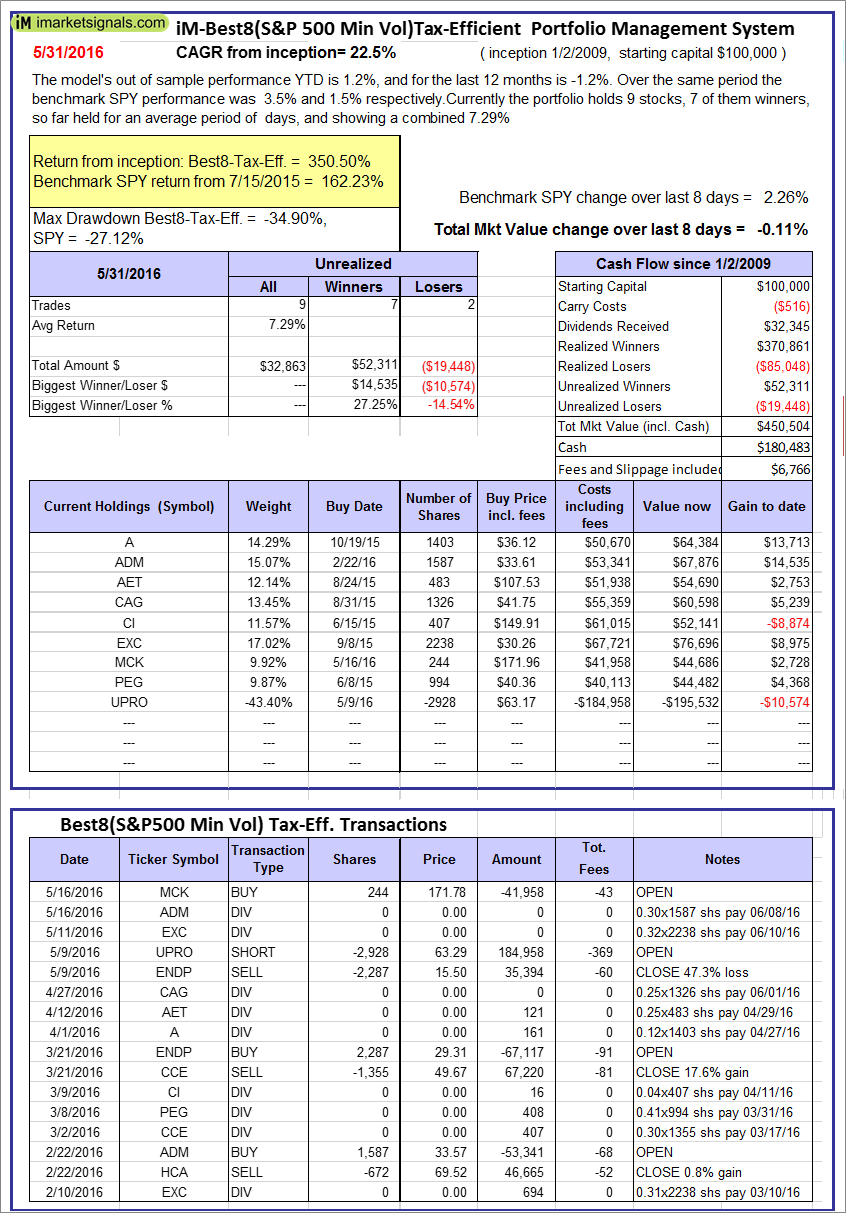 |
The iM-Best8(S&P500 Min Vol)Tax-Efficient The model’s out of sample performance YTD is 1.2%, and for the last 12 months is -1.2%. Over the same period the benchmark SPY performance was 3.5% and 1.5% respectively. Over the previous week the market value of iM-Best8(S&P 500)Tax-Eff. gained -0.11% at a time when SPY gained 2.26%. A starting capital of $100,000 at inception on 1/2/2009 would have grown to $450,504 which includes $180,483 cash and excludes $6,766 spent on fees and slippage. |
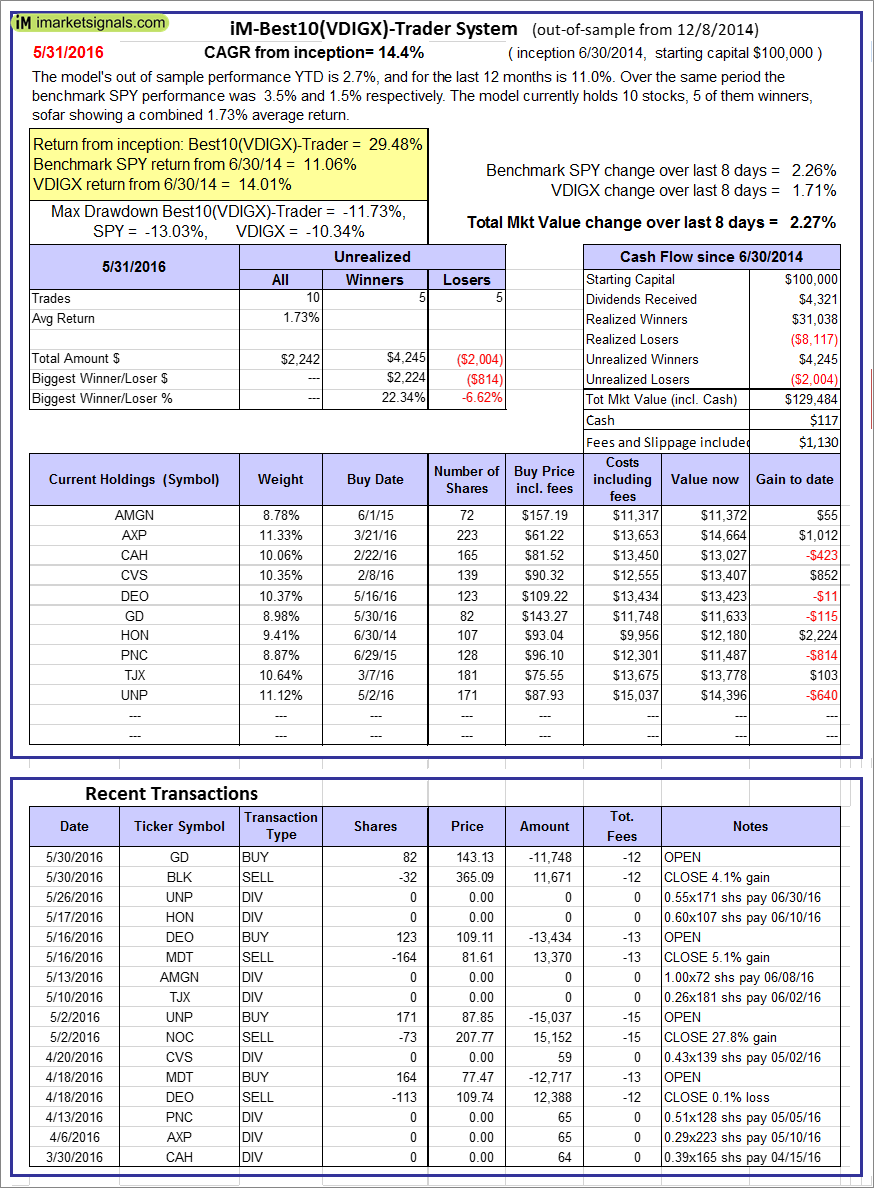  |
iM-Best10(VDIGX)-Trader: The model’s out of sample performance YTD is 2.7%, and for the last 12 months is 11.0%. Over the same period the benchmark SPY performance was 3.5% and 1.5% respectively. Since inception, on 7/1/2014, the model gained 29.48% while the benchmark SPY gained 11.06% and the ETF VDIGX gained 14.01% over the same period. Over the previous week the market value of iM-Best10(VDIGX) gained 2.27% at a time when SPY gained 2.26%. A starting capital of $100,000 at inception on 7/1/2014 would have grown to $129,484 which includes $117 cash and excludes $1,130 spent on fees and slippage. |
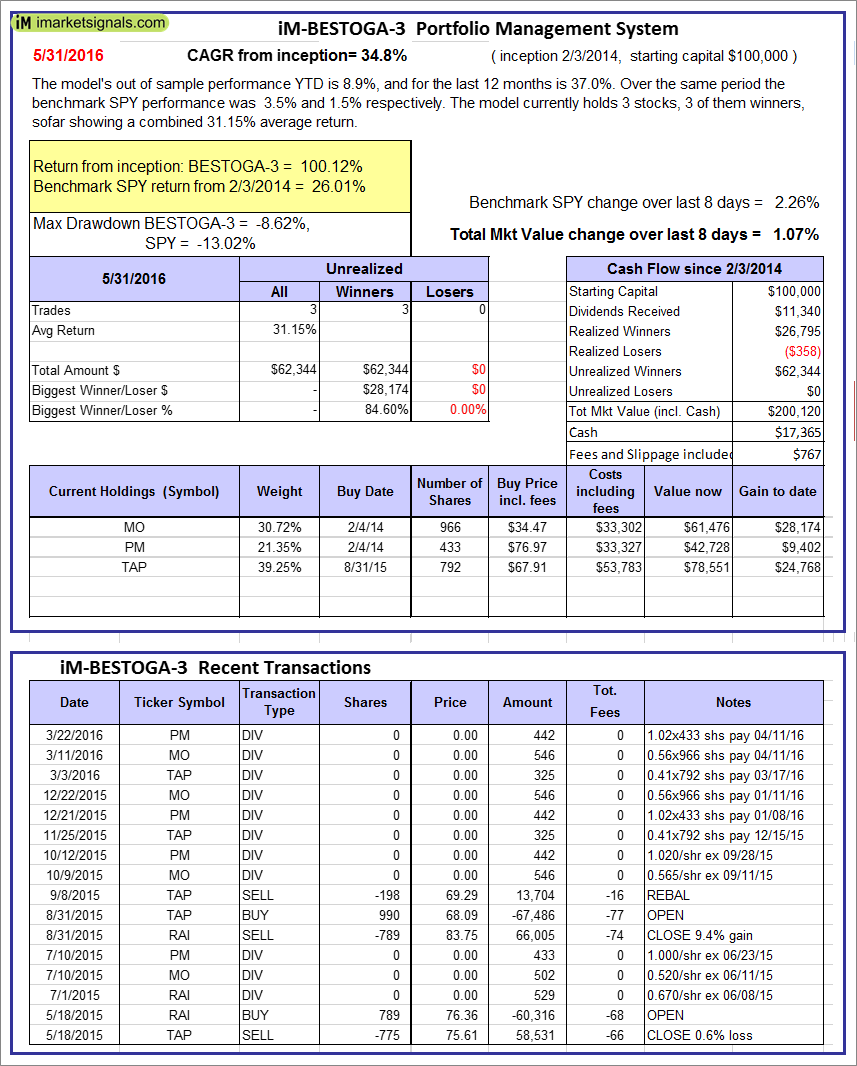 |
iM-BESTOGA-3: The model’s out of sample performance YTD is 8.9%, and for the last 12 months is 37.0%. Over the same period the benchmark SPY performance was 3.5% and 1.5% respectively. Over the previous week the market value of iM-BESTOGA-3 gained 1.07% at a time when SPY gained 2.26%. A starting capital of $100,000 at inception on 2/3/2014 would have grown to $200,120 which includes $17,365 cash and excludes $767 spent on fees and slippage. |
 |
iM-Best10(Short Russell3000): The model’s performance YTD is -29.0%, and for the last 12 months is -6.0%. Over the same period the benchmark SPY performance was 3.5% and 1.5% respectively. Over the previous week the market value of iM-Best10(Short Russell3000) gained -3.87% at a time when SPY gained 2.26%. Over the period 2/3/2014 to 5/31/2016 the starting capital of $100,000 would have grown to $10,087 which includes $15,738 cash and excludes $1,232 spent on fees and slippage. |
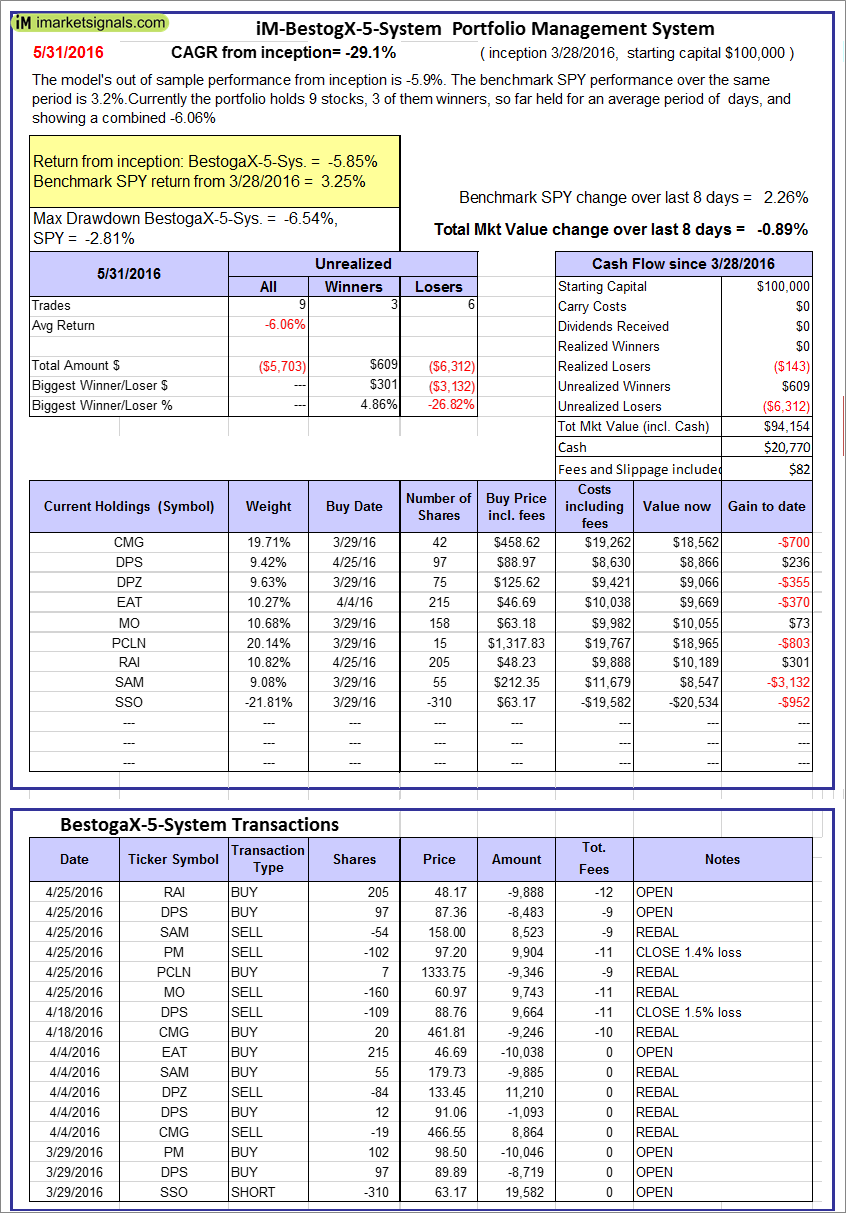 |
iM-BestogaX5-System: The model’s out of sample performance from inception is -5.9%. The benchmark SPY performance over the same period is 3.2%. Over the previous week the market value of iM-Best8(S&P 500)Tax-Eff. gained -0.89% at a time when SPY gained 2.26%. A starting capital of $100,000 at inception on 1/2/2009 would have grown to $94,154 which includes $20,770 cash and excludes $82 spent on fees and slippage. |
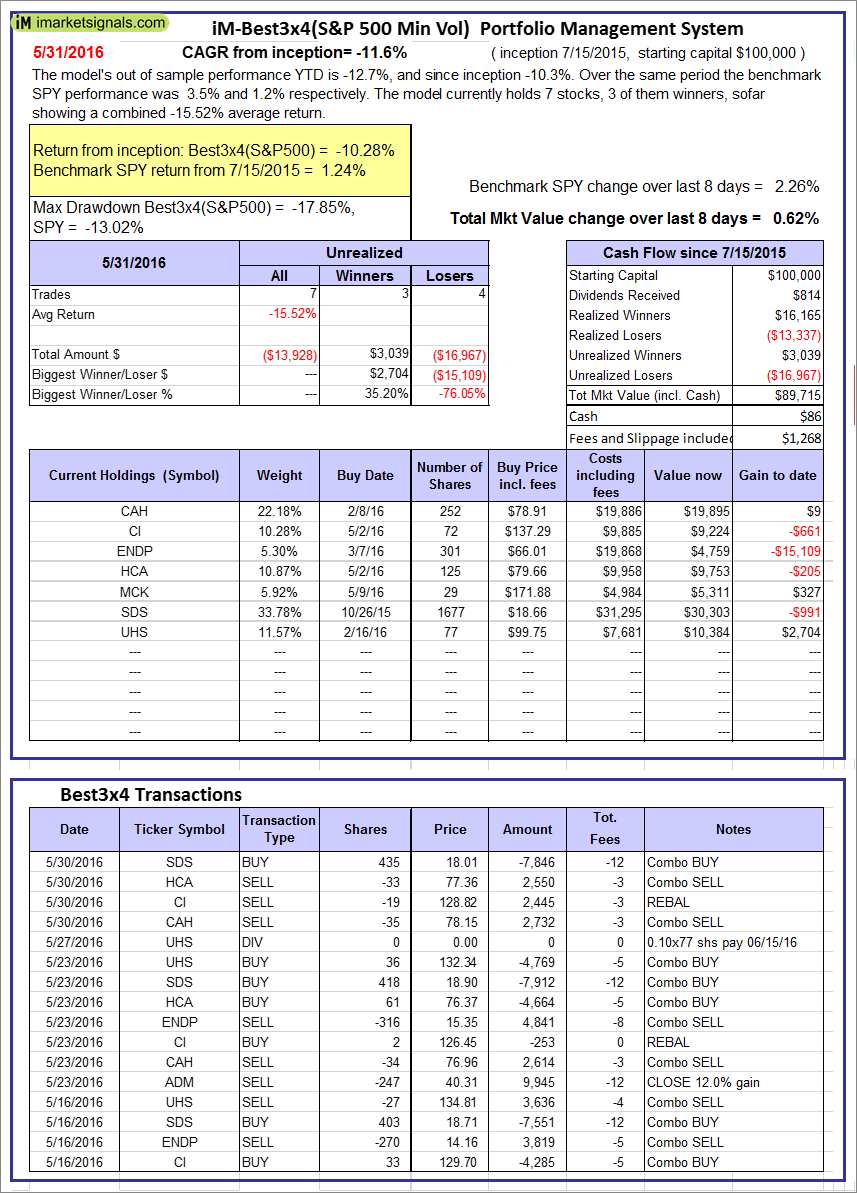 |
iM-Best3x4(S&P 500 Min Vol): The model’s out of sample performance YTD is -12.7%, and since inception -10.3%. Over the same period the benchmark SPY performance was 3.5% and 1.2% respectively. Over the previous week the market value of iM-Best3x4 gained 0.62% at a time when SPY gained 2.26%. A starting capital of $100,000 at inception on 7/15/2015 would have grown to $89,715 which includes $86 cash and excludes $1,268 spent on fees and slippage. |
 |
iM-Best2x4(S&P 500 Min Vol): The model’s out of sample performance YTD is -2.4%, and since inception -3.6%. Over the same period the benchmark SPY performance was 3.5% and 1.3% respectively. Over the previous week the market value of iM-Best2x4 gained -0.20% at a time when SPY gained 2.26%. A starting capital of $100,000 at inception on 7/16/2015 would have grown to $96,405 which includes $271 cash and excludes $966 spent on fees and slippage. |
  |
iM-Best12(USMV)-Trader: The model’s out of sample performance YTD is 6.0%, and for the last 12 months is 5.9%. Over the same period the benchmark SPY performance was 3.5% and 1.5% respectively. Since inception, on 7/1/2014, the model gained 35.24% while the benchmark SPY gained 11.06% and the ETF USMV gained 23.72% over the same period. Over the previous week the market value of iM-Best12(USMV)-Trader gained 2.82% at a time when SPY gained 2.26%. A starting capital of $100,000 at inception on 7/1/2014 would have grown to $135,241 which includes $157 cash and excludes $1,954 spent on fees and slippage. |
 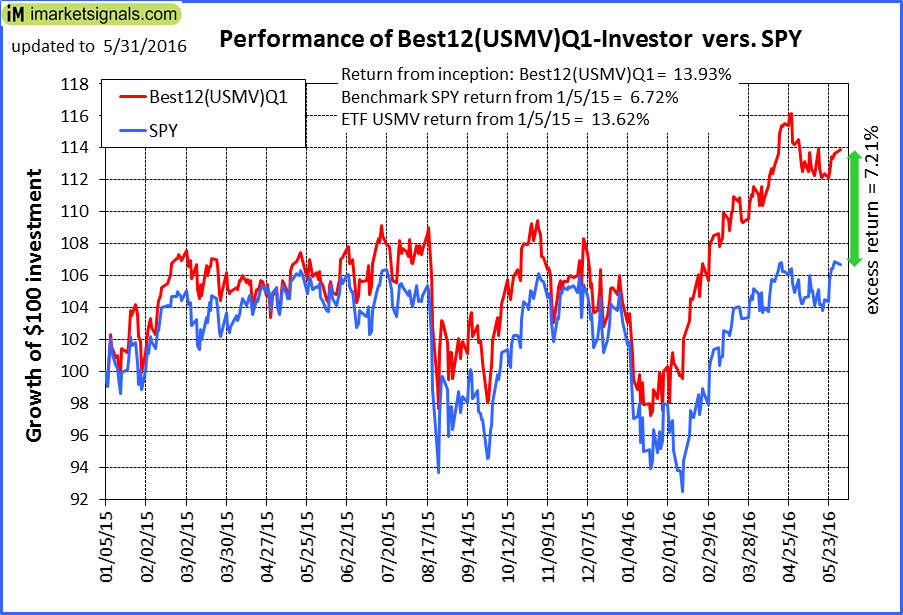 |
iM-Best12(USMV)Q1-Investor: The model’s out of sample performance YTD is 9.2%, and for the last 12 months is 7.5%. Over the same period the benchmark SPY performance was 3.5% and 1.5% respectively. Since inception, on 1/5/2015, the model gained 13.93% while the benchmark SPY gained 6.72% and the ETF USMV gained 13.62% over the same period. Over the previous week the market value of iM-Best12(USMV)Q1 gained 1.57% at a time when SPY gained 2.26%. A starting capital of $100,000 at inception on 1/5/2015 would have grown to $113,928 which includes $137 cash and excludes $437 spent on fees and slippage. |
 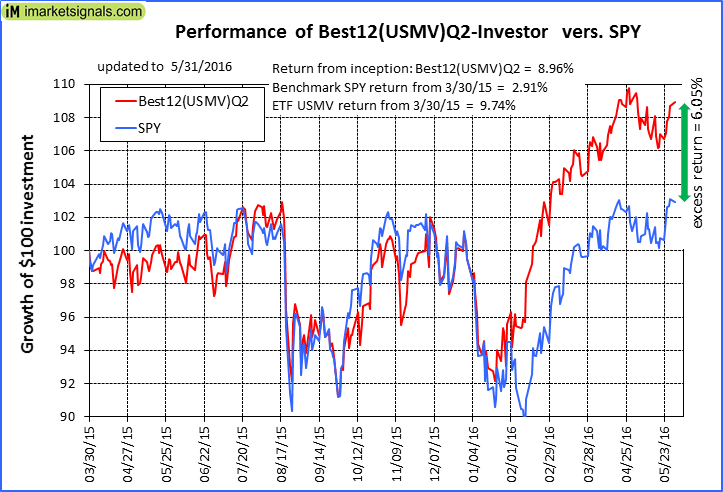 |
iM-Best12(USMV)Q2-Investor: The model’s out of sample performance YTD is 9.5%, and for the last 12 months is 10.2%. Over the same period the benchmark SPY performance was 3.5% and 1.5% respectively. Since inception, on 3/31/2015, the model gained 8.96% while the benchmark SPY gained 2.91% and the ETF USMV gained 9.74% over the same period. Over the previous week the market value of iM-Best12(USMV)Q2 gained 2.09% at a time when SPY gained 2.26%. A starting capital of $100,000 at inception on 3/31/2015 would have grown to $108,959 which includes $133 cash and excludes $352 spent on fees and slippage. |
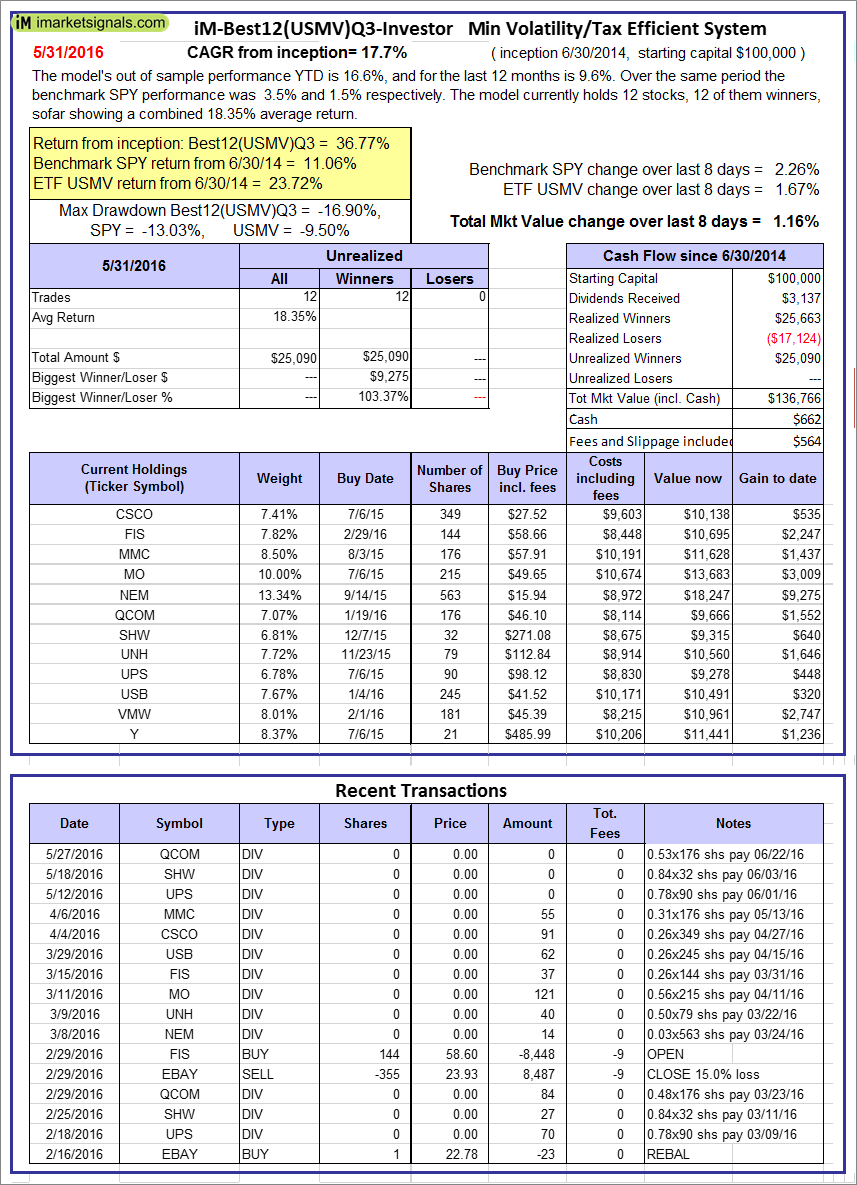 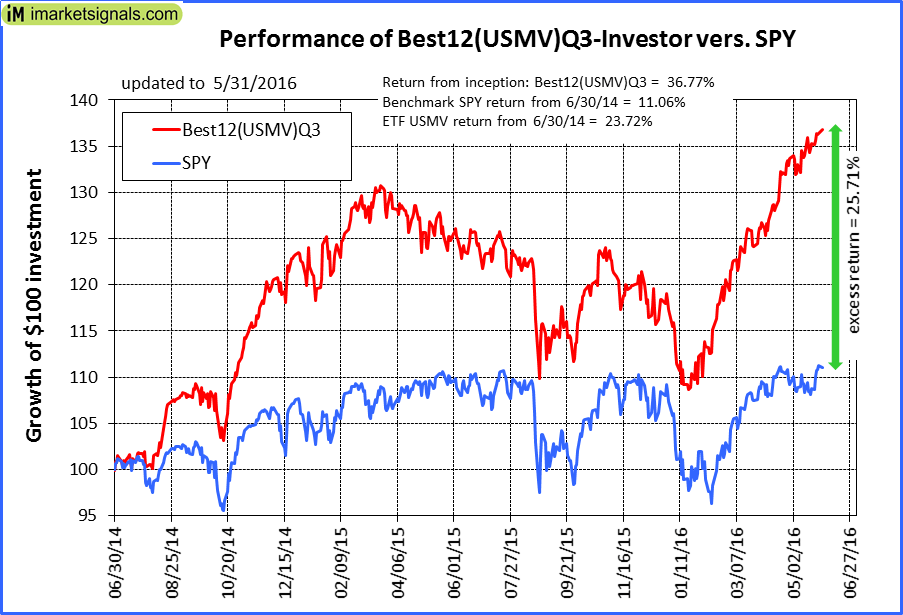 |
iM-Best12(USMV)Q3-Investor: The model’s out of sample performance YTD is 16.6%, and for the last 12 months is 9.6%. Over the same period the benchmark SPY performance was 3.5% and 1.5% respectively. Since inception, on 7/1/2014, the model gained 36.77% while the benchmark SPY gained 11.06% and the ETF USMV gained 23.72% over the same period. Over the previous week the market value of iM-Best12(USMV)Q3 gained 1.16% at a time when SPY gained 2.26%. A starting capital of $100,000 at inception on 7/1/2014 would have grown to $136,766 which includes $662 cash and excludes $564 spent on fees and slippage. |
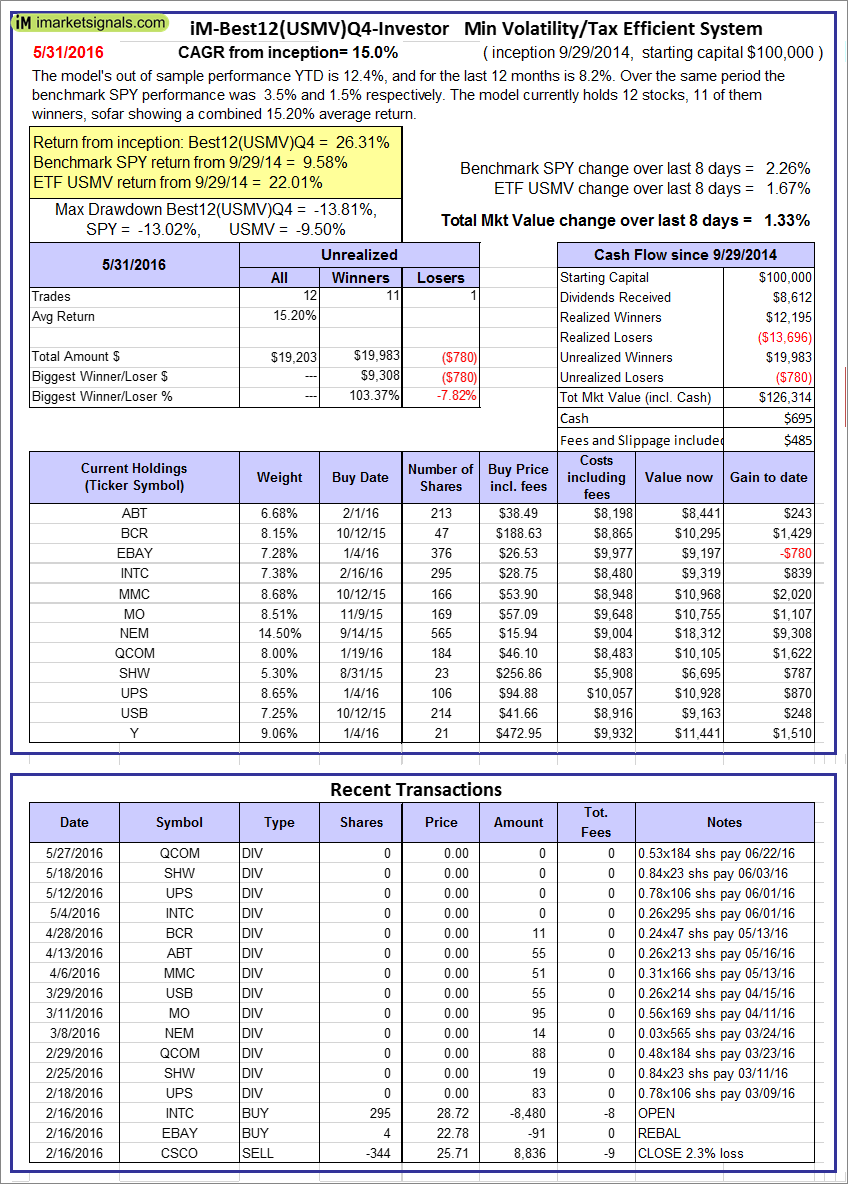  |
iM-Best12(USMV)Q4-Investor: Since inception, on 9/30/2014, the model gained 26.31% while the benchmark SPY gained 9.58% and the ETF USMV gained 22.01% over the same period. Over the previous week the market value of iM-Best12(USMV)Q4 gained 1.33% at a time when SPY gained 2.26%. A starting capital of $100,000 at inception on 9/30/2014 would have grown to $126,314 which includes $695 cash and excludes $485 spent on fees and slippage. |
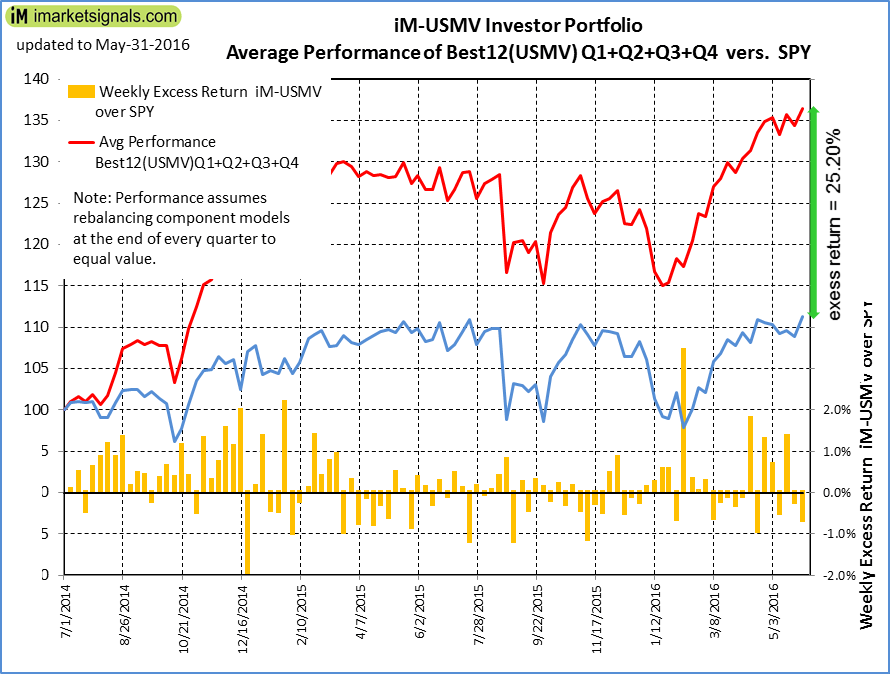 |
Average Performance of iM-Best12(USMV)Q1+Q2+Q3+Q4-Investor resulted in an excess return of 25.20% over SPY. (see iM-USMV Investor Portfolio) |
 |
iM-Best(Short): The model’s out of sample performance YTD is -6.2%, and for the last 12 months is -7.3%. Over the same period the benchmark SPY performance was 3.5% and 1.5% respectively. Over the previous week the market value of iM-Best(Short) gained -2.74% at a time when SPY gained 2.26%. Over the period 1/2/2009 to 5/31/2016 the starting capital of $100,000 would have grown to $98,234 which includes $117,817 cash and excludes $19,199 spent on fees and slippage. |
iM-Best Reports – 5/31/2016
Posted in pmp SPY-SH
Leave a Reply
You must be logged in to post a comment.