
  |
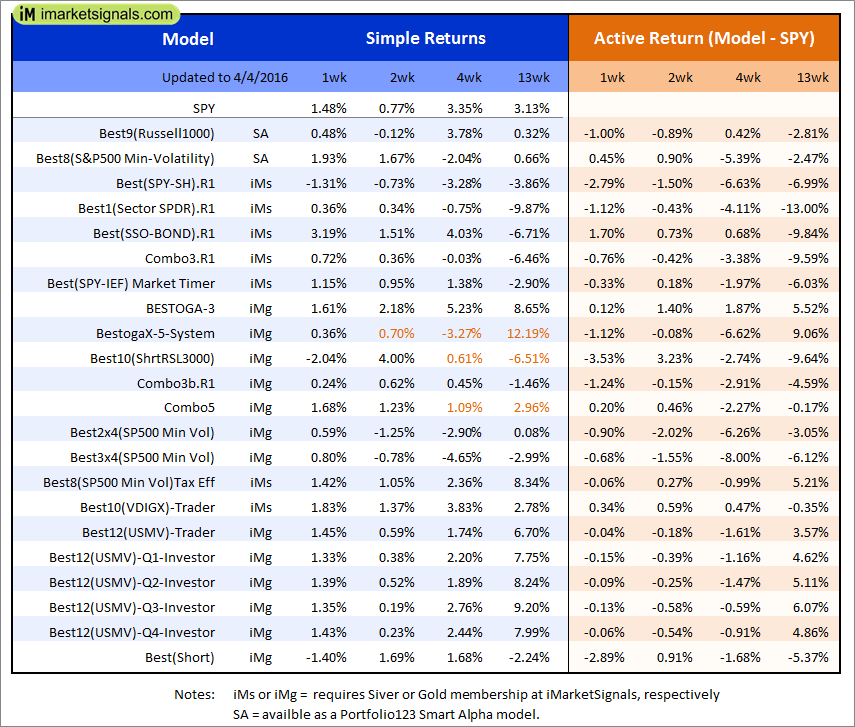
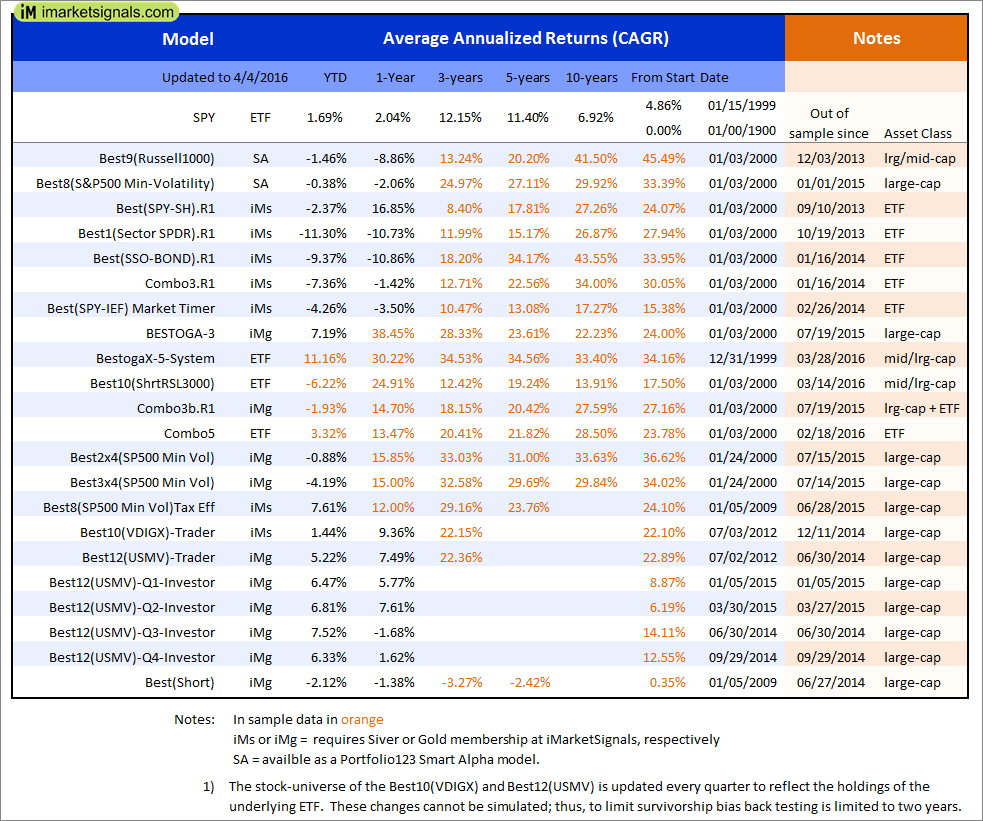
Out of sample performance summary of our models for the past 1, 2, 4 and 13 week periods. The active active return indicates how the models over- or underperformed the benchmark ETF SPY. Also the YTD, and the 1-, 3-, 5- and 10-year annualized returns are shown in the second table |
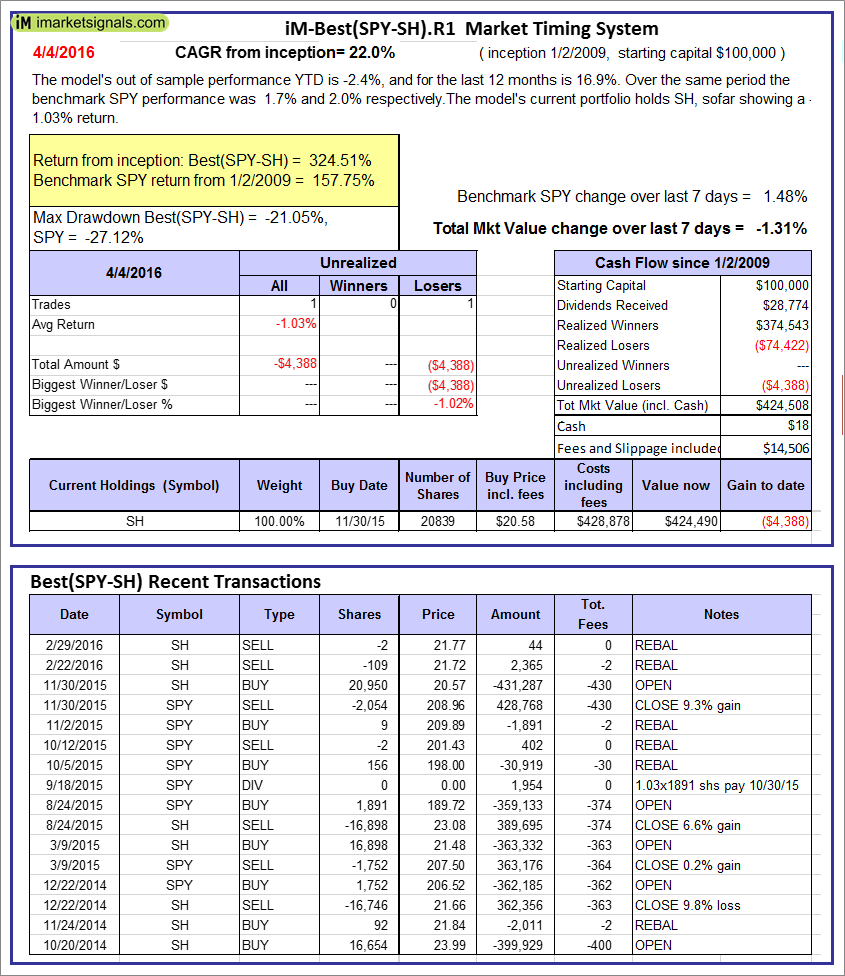 |
iM-Best(SPY-SH).R1: The model’s out of sample performance YTD is -2.4%, and for the last 12 months is 16.9%. Over the same period the benchmark SPY performance was 1.7% and 2.0% respectively. Over the previous week the market value of Best(SPY-SH) gained -1.31% at a time when SPY gained 1.48%. A starting capital of $100,000 at inception on 1/2/2009 would have grown to $424,508 which includes $18 cash and excludes $14,506 spent on fees and slippage. |
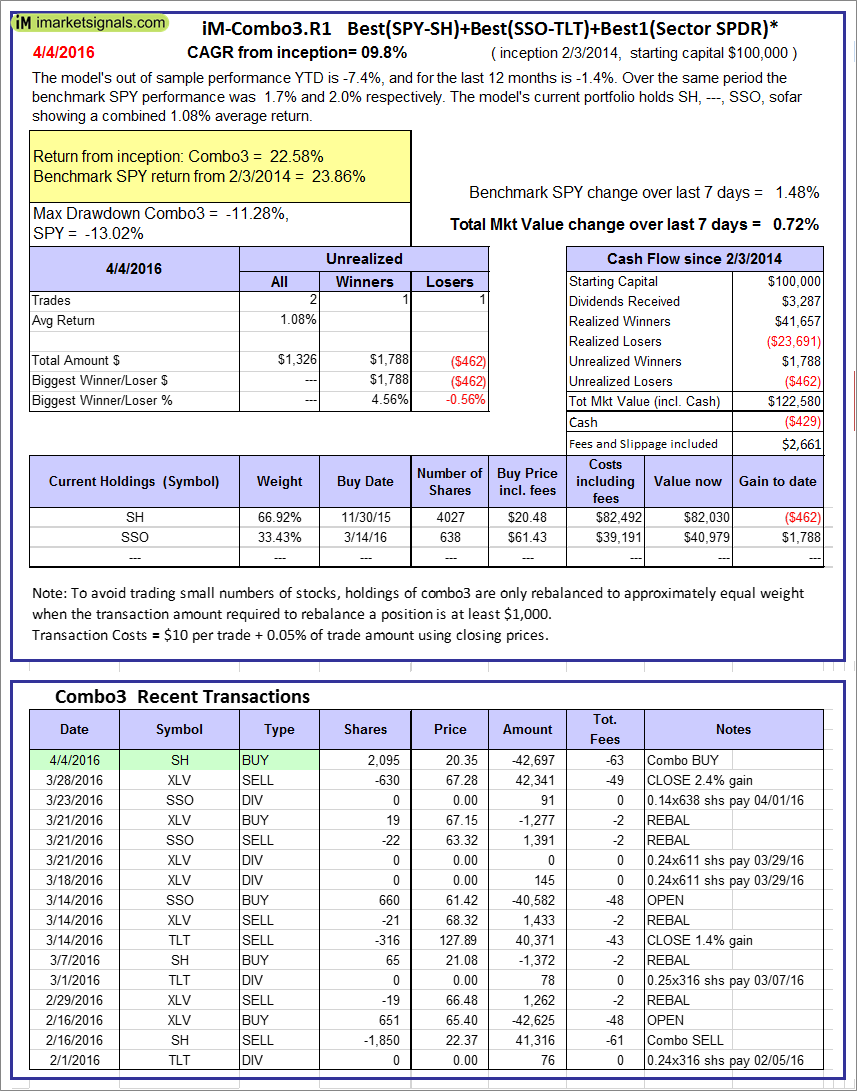 |
iM-Combo3.R1: The model’s out of sample performance YTD is -7.4%, and for the last 12 months is -1.4%. Over the same period the benchmark SPY performance was 1.7% and 2.0% respectively. Over the previous week the market value of iM-Combo3.R1 gained 0.72% at a time when SPY gained 1.48%. A starting capital of $100,000 at inception on 2/3/2014 would have grown to $122,580 which includes -$429 cash and excludes $2,661 spent on fees and slippage. |
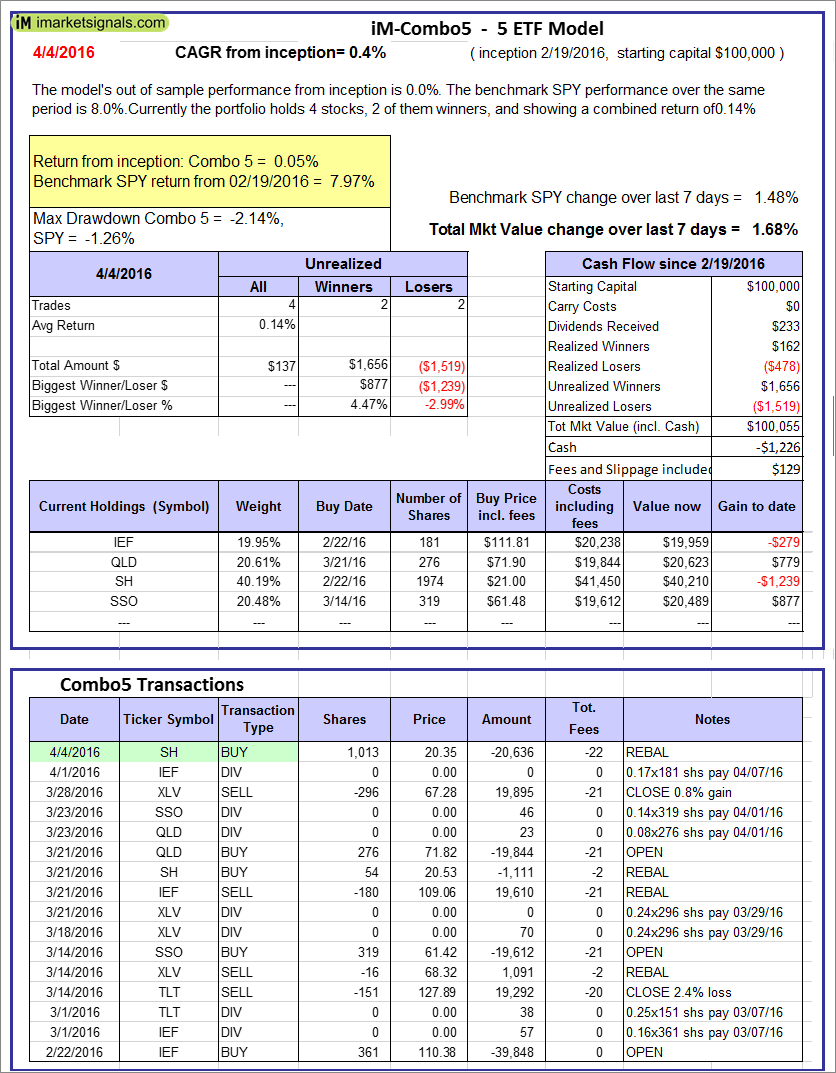 |
iM-Combo5: The model’s out of sample performance from inception is 0.0%. The benchmark SPY performance over the same period is 8.0%. Over the previous week the market value of iM-Combo5 gained 1.68% at a time when SPY gained 1.48%. A starting capital of $100,000 at inception on 2/22/2016 would have grown to $100,055 which includes -$1,226 cash and excludes $129 spent on fees and slippage. |
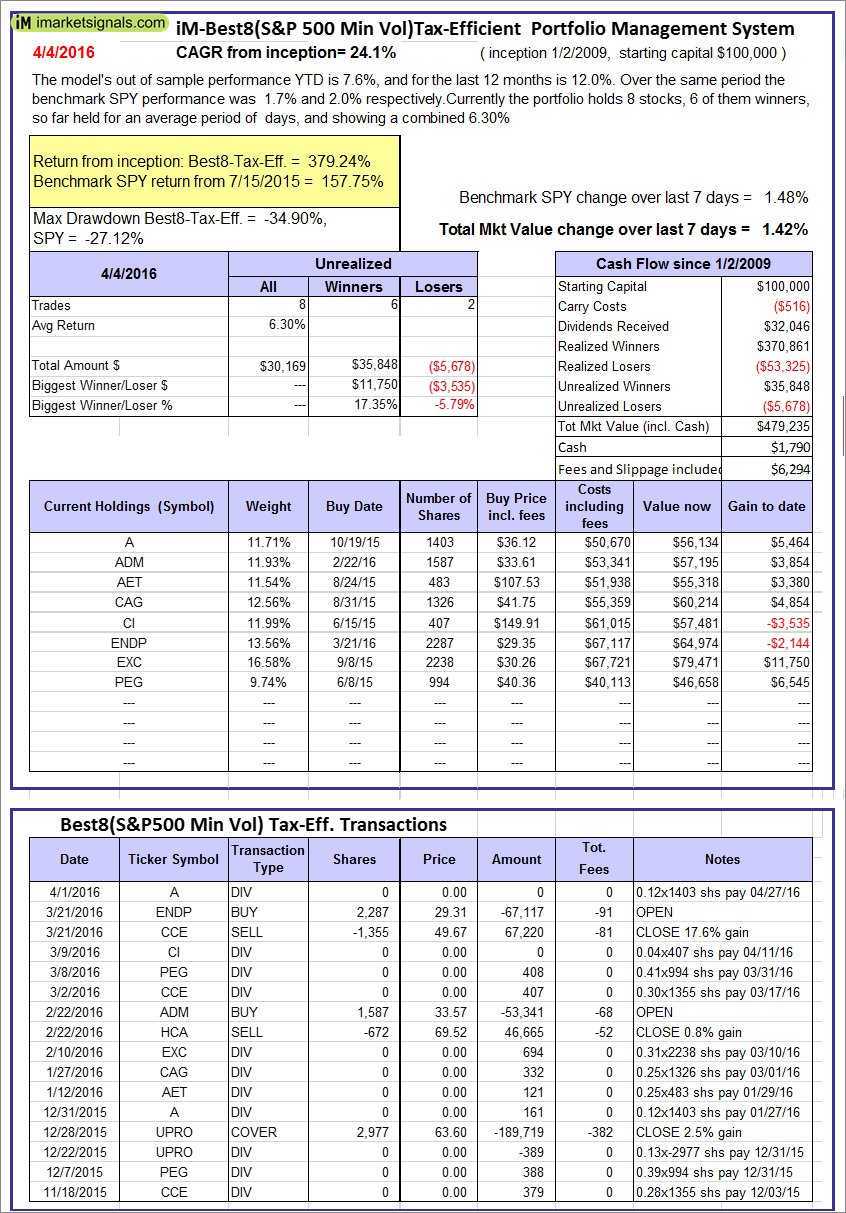 |
The iM-Best8(S&P500 Min Vol)Tax-Efficient The model’s out of sample performance YTD is 7.6%, and for the last 12 months is 12.0%. Over the same period the benchmark SPY performance was 1.7% and 2.0% respectively. Over the previous week the market value of iM-Best8(S&P 500)Tax-Eff. gained 1.42% at a time when SPY gained 1.48%. A starting capital of $100,000 at inception on 1/2/2009 would have grown to $479,235 which includes $1,790 cash and excludes $6,294 spent on fees and slippage. |
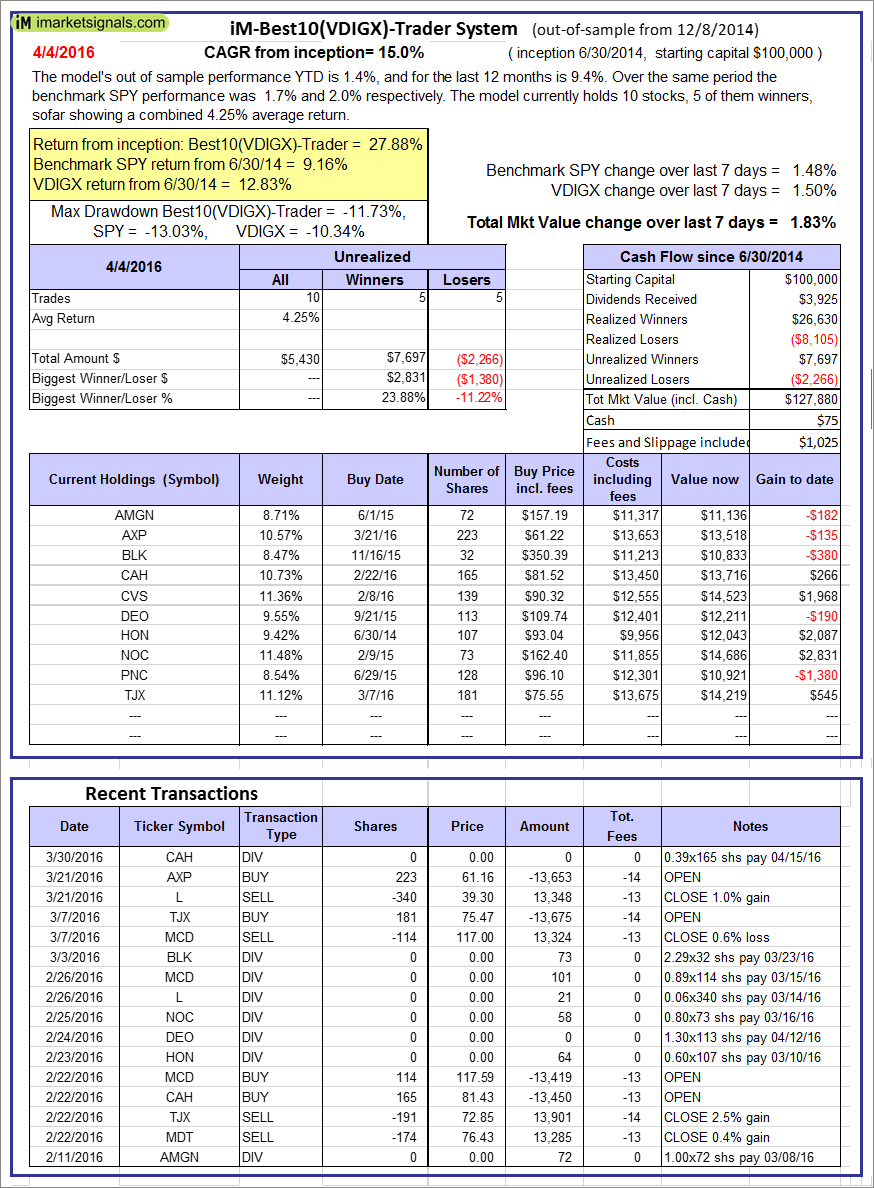 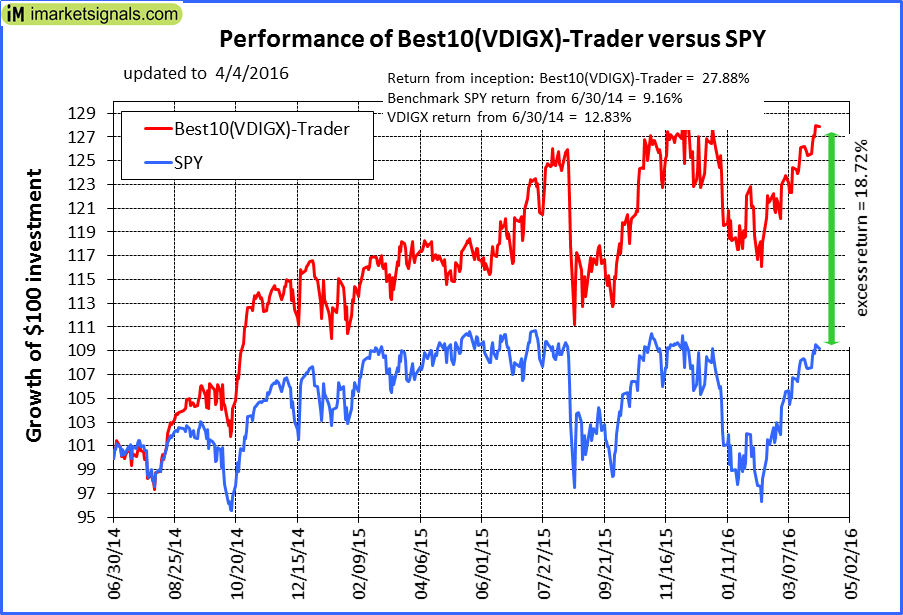 |
iM-Best10(VDIGX)-Trader: The model’s out of sample performance YTD is 1.4%, and for the last 12 months is 9.4%. Over the same period the benchmark SPY performance was 1.7% and 2.0% respectively. Since inception, on 7/1/2014, the model gained 27.88% while the benchmark SPY gained 9.16% and the ETF VDIGX gained 12.83% over the same period. Over the previous week the market value of iM-Best10(VDIGX) gained 1.83% at a time when SPY gained 1.48%. A starting capital of $100,000 at inception on 7/1/2014 would have grown to $127,880 which includes $75 cash and excludes $1,025 spent on fees and slippage. |
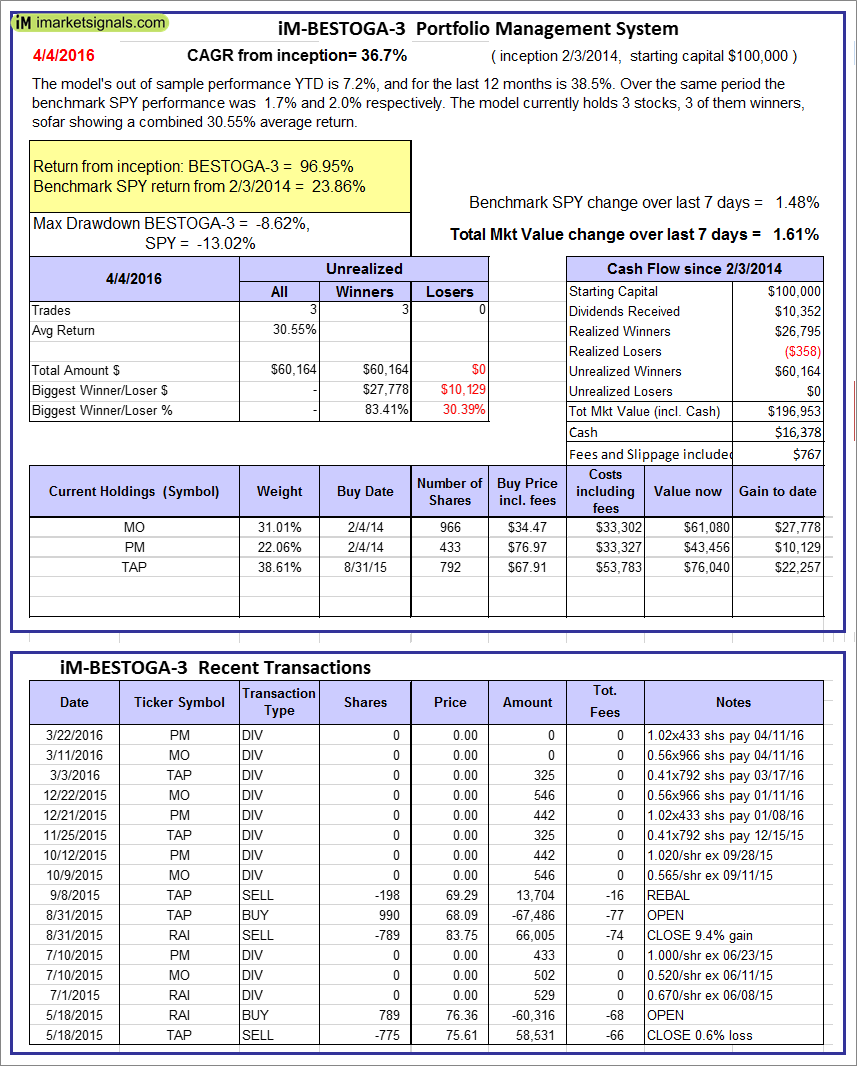 |
iM-BESTOGA-3: The model’s out of sample performance YTD is 7.2%, and for the last 12 months is 38.5%. Over the same period the benchmark SPY performance was 1.7% and 2.0% respectively. Over the previous week the market value of iM-BESTOGA-3 gained 1.61% at a time when SPY gained 1.48%. A starting capital of $100,000 at inception on 2/3/2014 would have grown to $196,953 which includes $16,378 cash and excludes $767 spent on fees and slippage. |
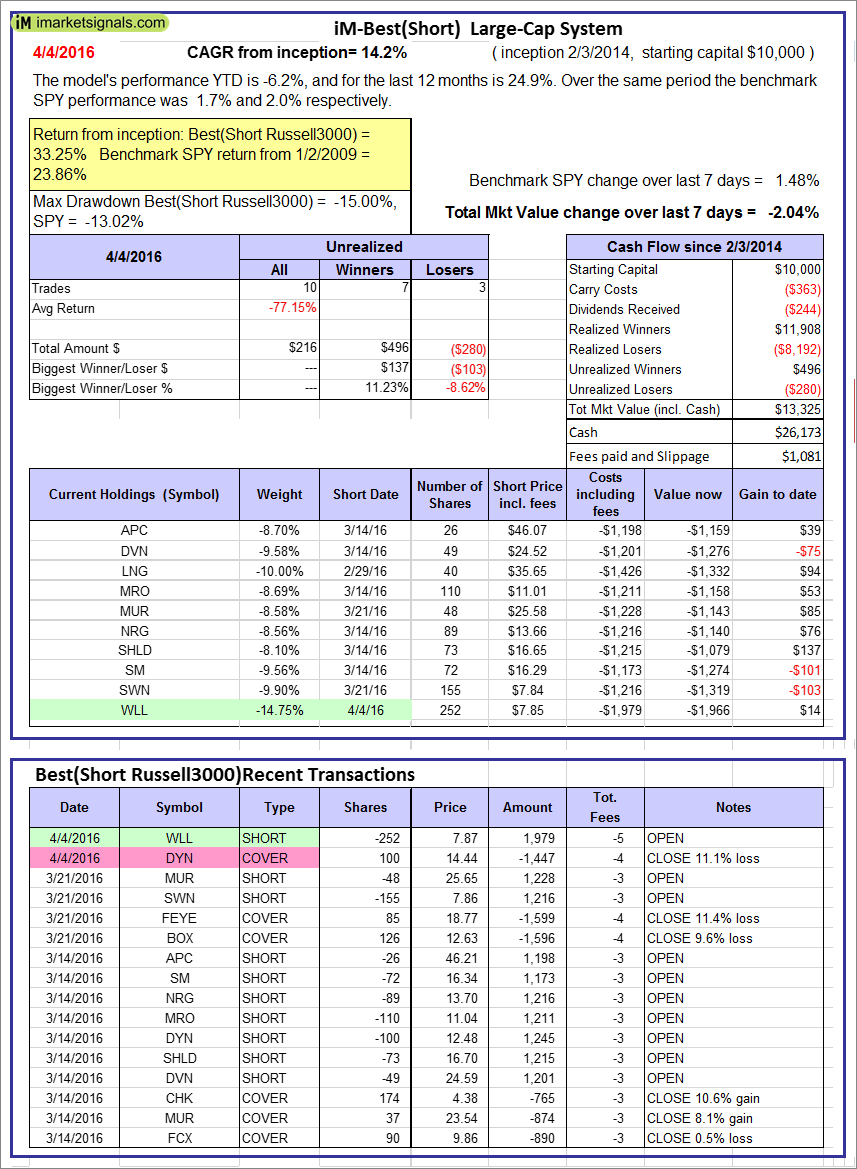 |
iM-Best10(Short Russell3000): The model’s performance YTD is -6.2%, and for the last 12 months is 24.9%. Over the same period the benchmark SPY performance was 1.7% and 2.0% respectively. Over the previous week the market value of iM-Best10(Short Russell3000) gained -2.04% at a time when SPY gained 1.48%. Over the period 2/3/2014 to 4/4/2016 the starting capital of $100,000 would have grown to $13,325 which includes $26,173 cash and excludes $1,081 spent on fees and slippage. |
 |
iM-BestogaX5-System: The model’s out of sample performance from inception is 0.4%. The benchmark SPY performance over the same period is 1.5%. Over the previous week the market value of iM-Best8(S&P 500)Tax-Eff. gained 0.36% at a time when SPY gained 1.48%. A starting capital of $100,000 at inception on 1/2/2009 would have grown to $100,363 which includes $19,898 cash and excludes $00 spent on fees and slippage. |
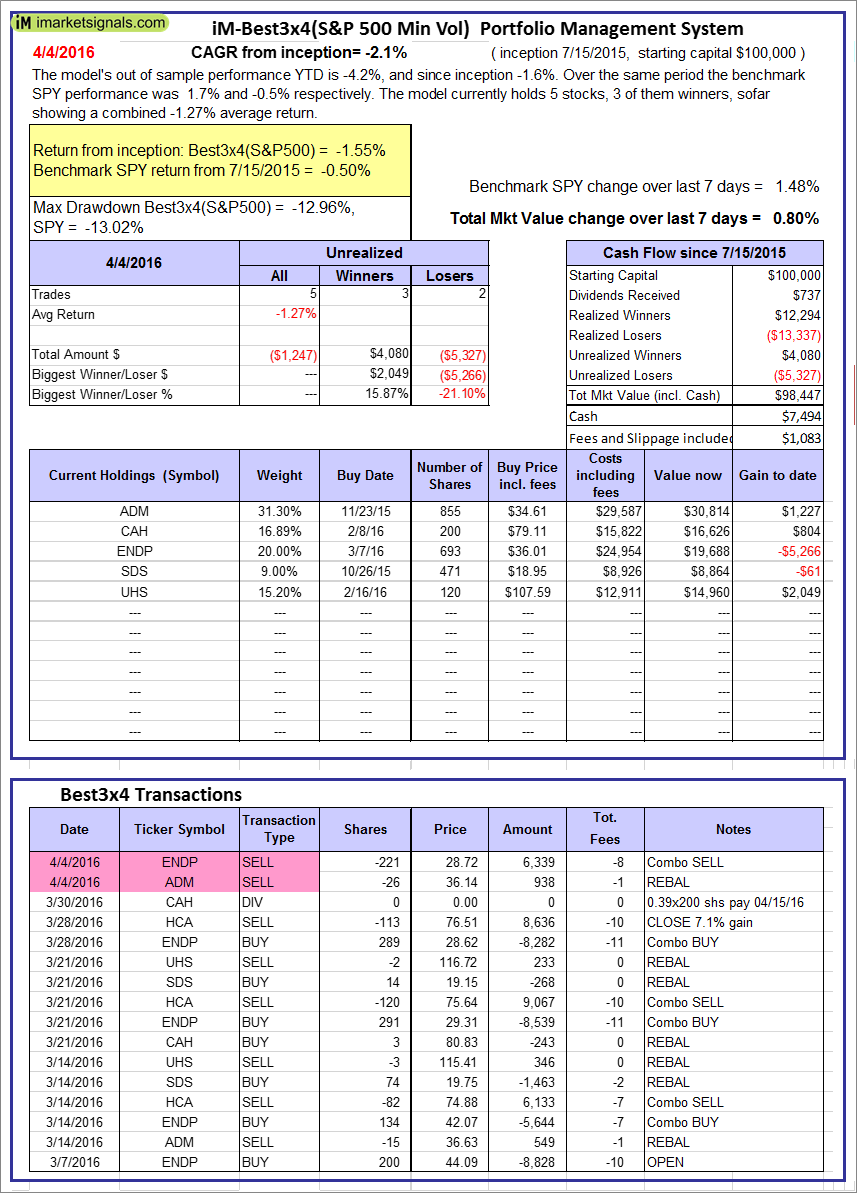 |
iM-Best3x4(S&P 500 Min Vol): The model’s out of sample performance YTD is -4.2%, and since inception -1.6%. Over the same period the benchmark SPY performance was 1.7% and -0.5% respectively. Over the previous week the market value of iM-Best3x4 gained 0.80% at a time when SPY gained 1.48%. A starting capital of $100,000 at inception on 7/15/2015 would have grown to $98,447 which includes $7,494 cash and excludes $1,083 spent on fees and slippage. |
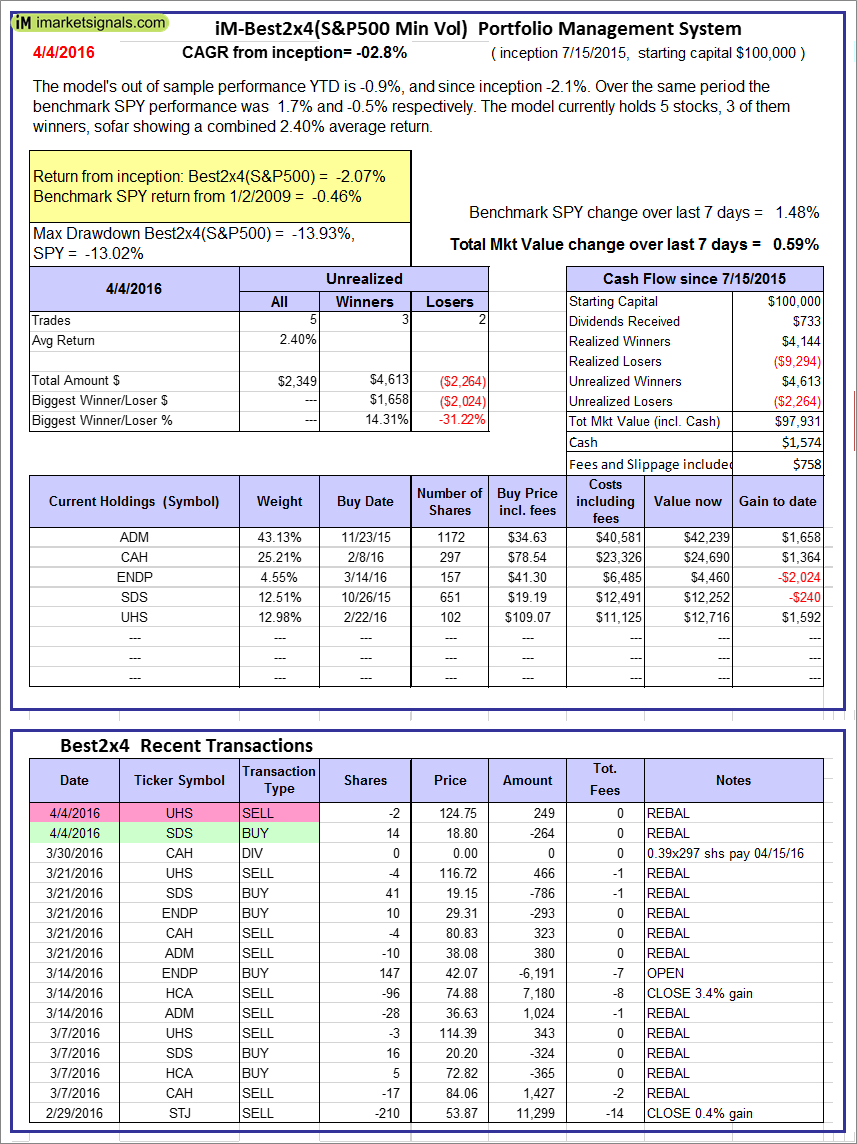 |
iM-Best2x4(S&P 500 Min Vol): The model’s out of sample performance YTD is -0.9%, and since inception -2.1%. Over the same period the benchmark SPY performance was 1.7% and -0.5% respectively. Over the previous week the market value of iM-Best2x4 gained 0.59% at a time when SPY gained 1.48%. A starting capital of $100,000 at inception on 7/16/2015 would have grown to $97,931 which includes $1,574 cash and excludes $758 spent on fees and slippage. |
 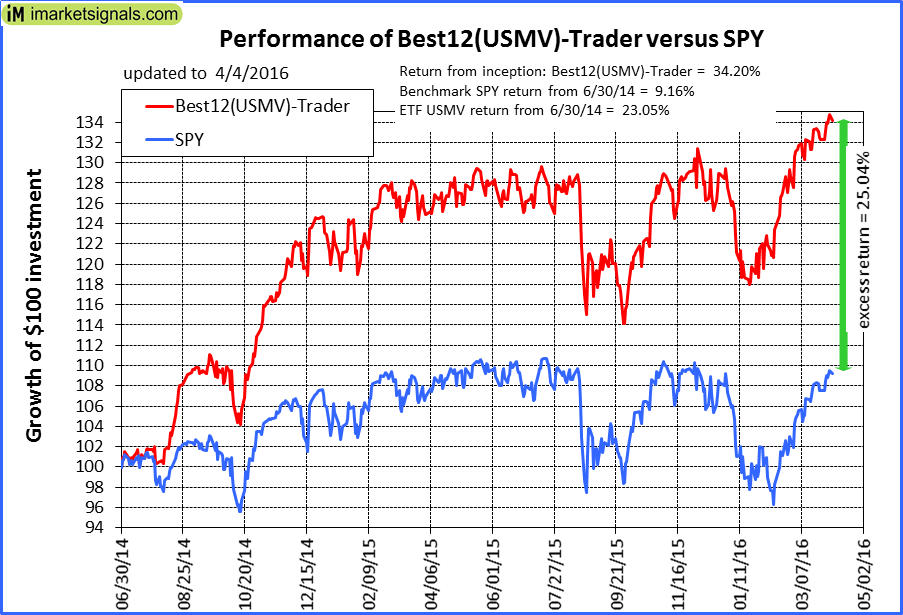 |
iM-Best12(USMV)-Trader: The model’s out of sample performance YTD is 5.2%, and for the last 12 months is 7.5%. Over the same period the benchmark SPY performance was 1.7% and 2.0% respectively. Since inception, on 7/1/2014, the model gained 34.20% while the benchmark SPY gained 9.16% and the ETF USMV gained 23.05% over the same period. Over the previous week the market value of iM-Best12(USMV)-Trader gained 1.45% at a time when SPY gained 1.48%. A starting capital of $100,000 at inception on 7/1/2014 would have grown to $134,202 which includes -$160 cash and excludes $1,818 spent on fees and slippage. |
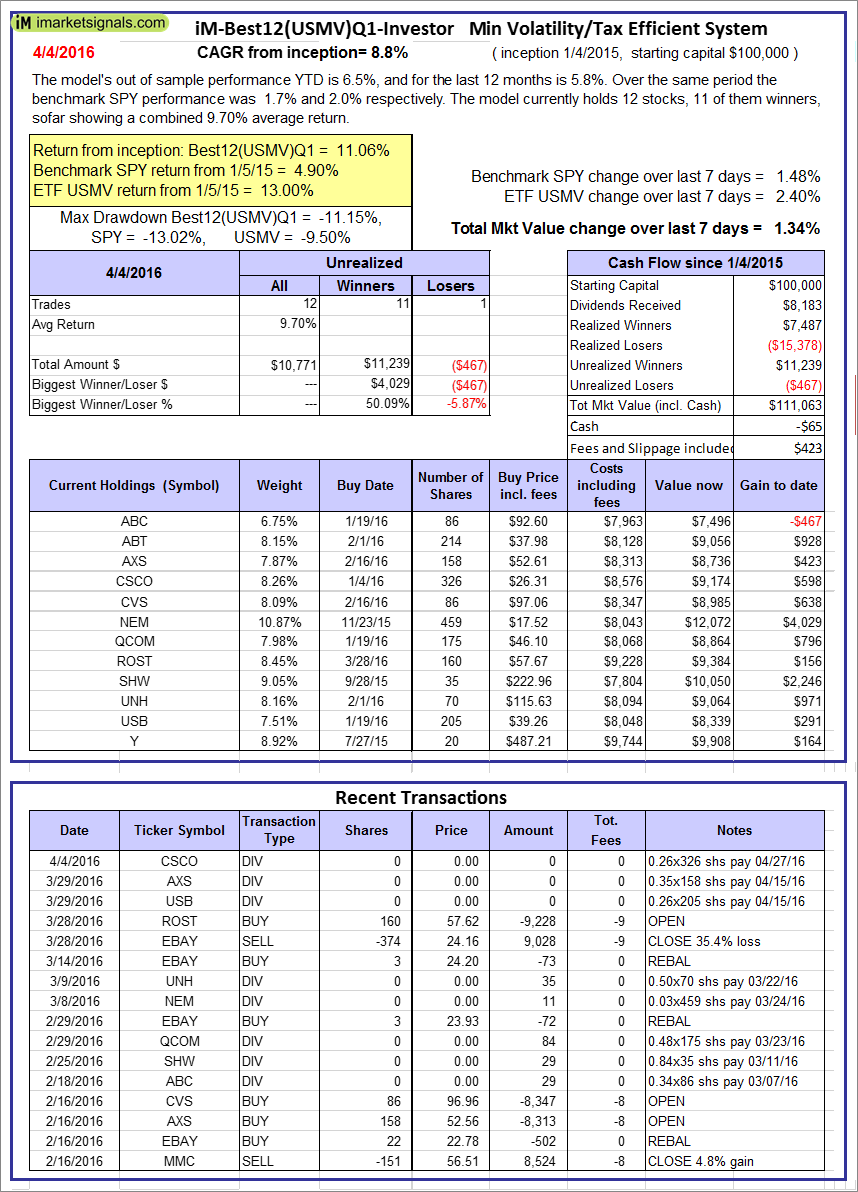 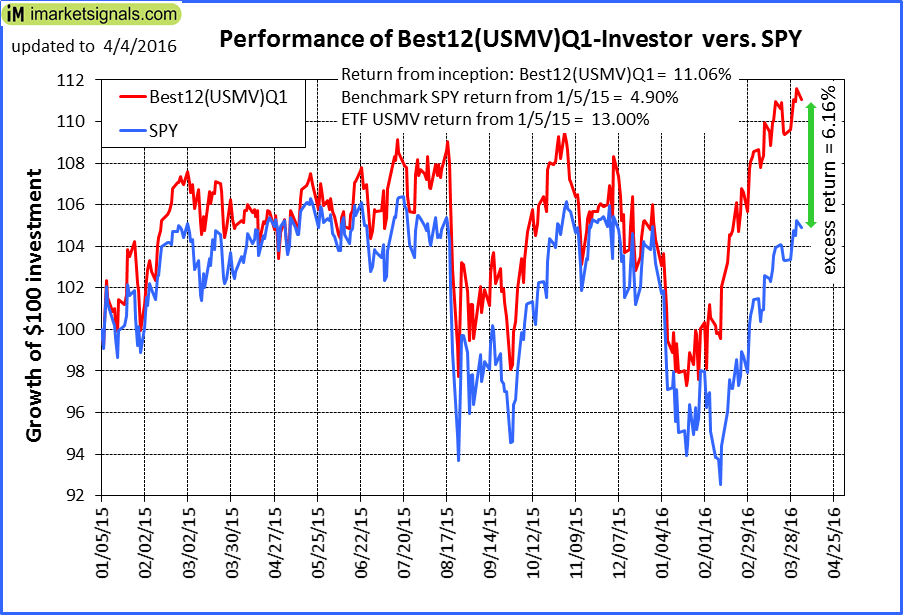 |
iM-Best12(USMV)Q1-Investor: The model’s out of sample performance YTD is 6.5%, and for the last 12 months is 5.8%. Over the same period the benchmark SPY performance was 1.7% and 2.0% respectively. Since inception, on 1/5/2015, the model gained 11.06% while the benchmark SPY gained 4.90% and the ETF USMV gained 13.00% over the same period. Over the previous week the market value of iM-Best12(USMV)Q1 gained 1.34% at a time when SPY gained 1.48%. A starting capital of $100,000 at inception on 1/5/2015 would have grown to $111,063 which includes -$65 cash and excludes $423 spent on fees and slippage. |
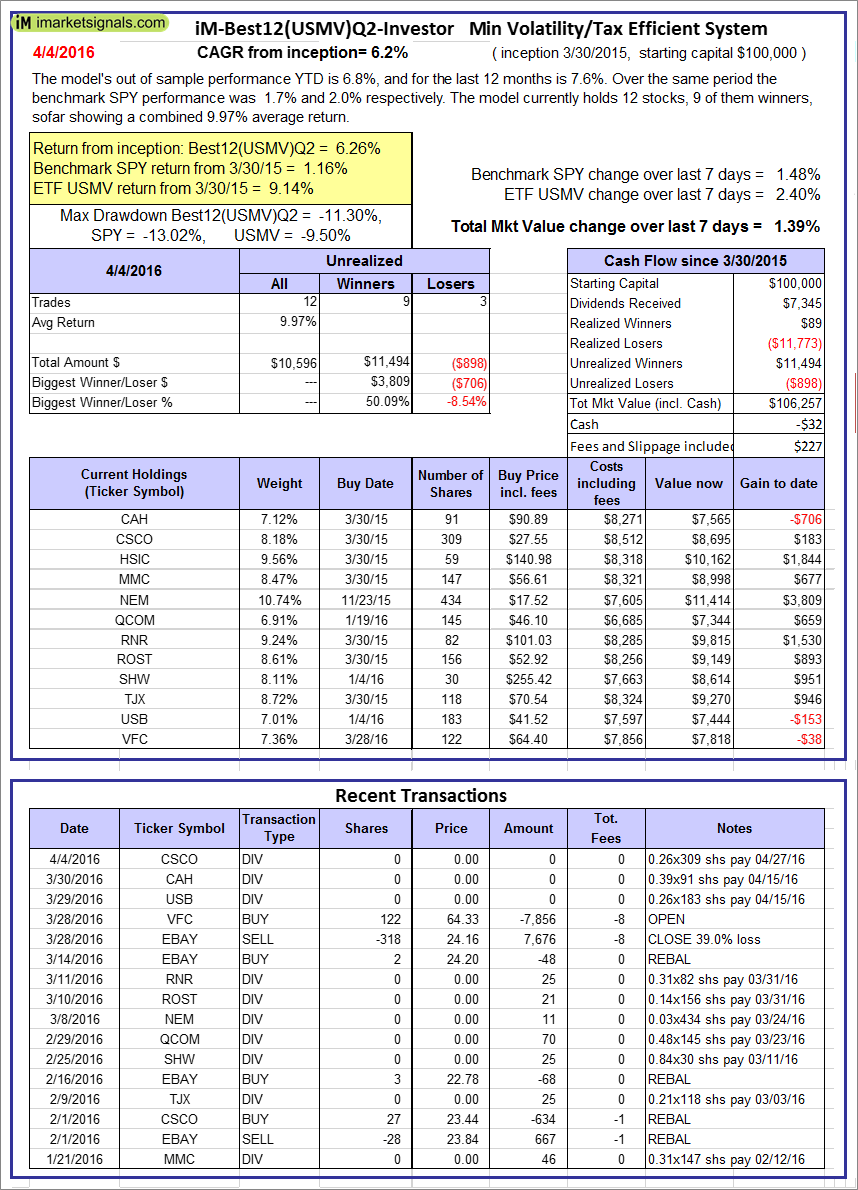 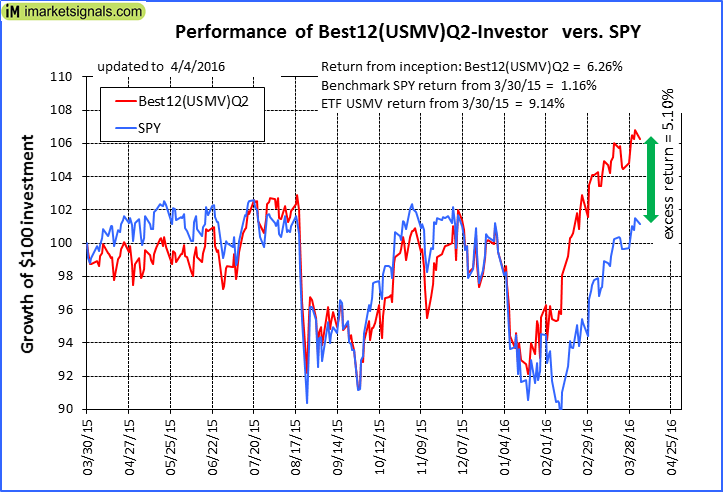 |
iM-Best12(USMV)Q2-Investor: The model’s out of sample performance YTD is 6.8%, and for the last 12 months is 7.6%. Over the same period the benchmark SPY performance was 1.7% and 2.0% respectively. Since inception, on 3/31/2015, the model gained 6.26% while the benchmark SPY gained 1.16% and the ETF USMV gained 9.14% over the same period. Over the previous week the market value of iM-Best12(USMV)Q2 gained 1.39% at a time when SPY gained 1.48%. A starting capital of $100,000 at inception on 3/31/2015 would have grown to $106,257 which includes -$32 cash and excludes $227 spent on fees and slippage. |
 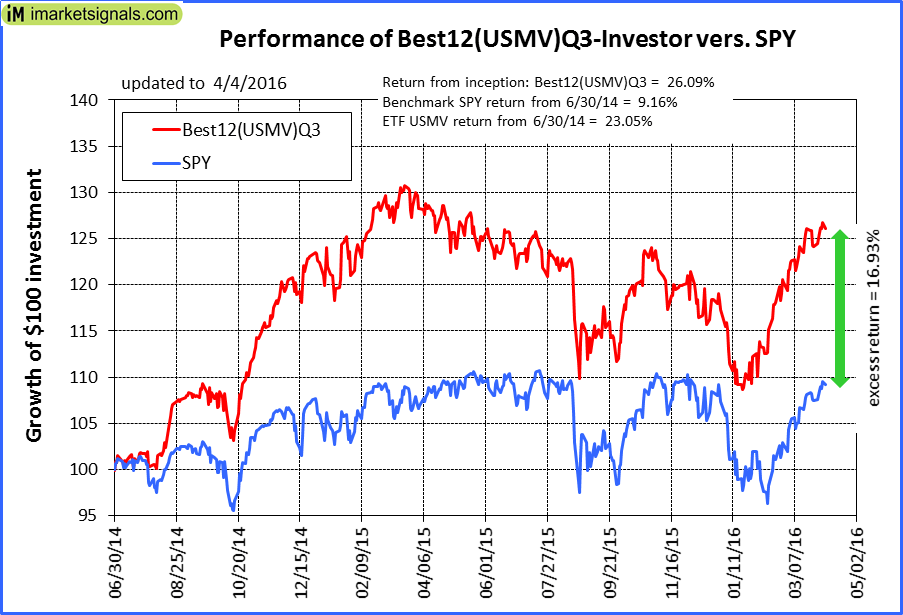 |
iM-Best12(USMV)Q3-Investor: The model’s out of sample performance YTD is 7.5%, and for the last 12 months is -1.7%. Over the same period the benchmark SPY performance was 1.7% and 2.0% respectively. Since inception, on 7/1/2014, the model gained 26.09% while the benchmark SPY gained 9.16% and the ETF USMV gained 23.05% over the same period. Over the previous week the market value of iM-Best12(USMV)Q3 gained 1.36% at a time when SPY gained 1.48%. A starting capital of $100,000 at inception on 7/1/2014 would have grown to $126,093 which includes $333 cash and excludes $564 spent on fees and slippage. |
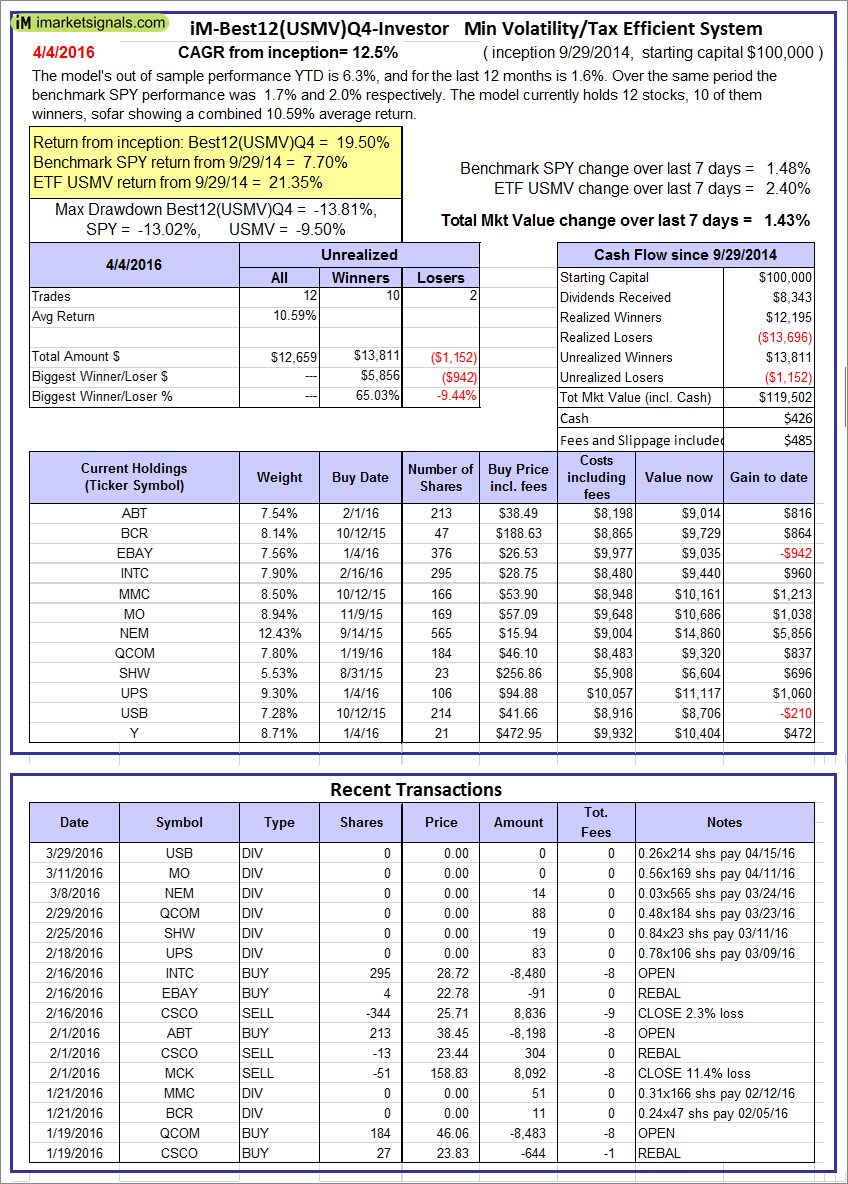 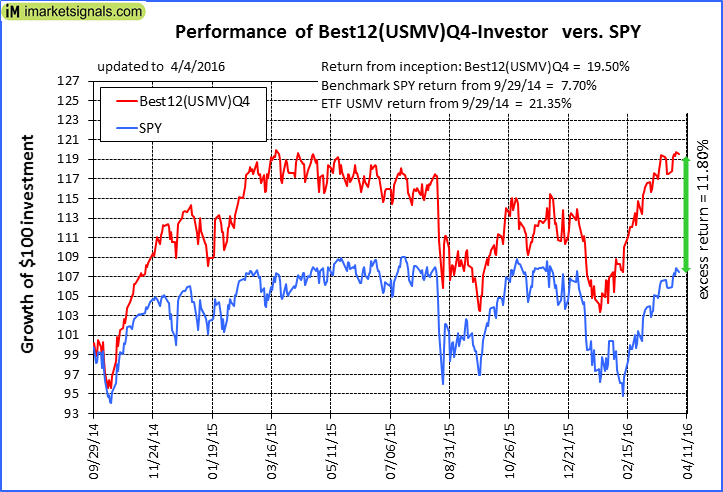 |
iM-Best12(USMV)Q4-Investor: Since inception, on 9/30/2014, the model gained 19.50% while the benchmark SPY gained 7.70% and the ETF USMV gained 21.35% over the same period. Over the previous week the market value of iM-Best12(USMV)Q4 gained 1.43% at a time when SPY gained 1.48%. A starting capital of $100,000 at inception on 9/30/2014 would have grown to $119,502 which includes $426 cash and excludes $485 spent on fees and slippage. |
 |
Average Performance of iM-Best12(USMV)Q1+Q2+Q3+Q4-Investor resulted in an excess return of 21.08% over SPY. (see iM-USMV Investor Portfolio) |
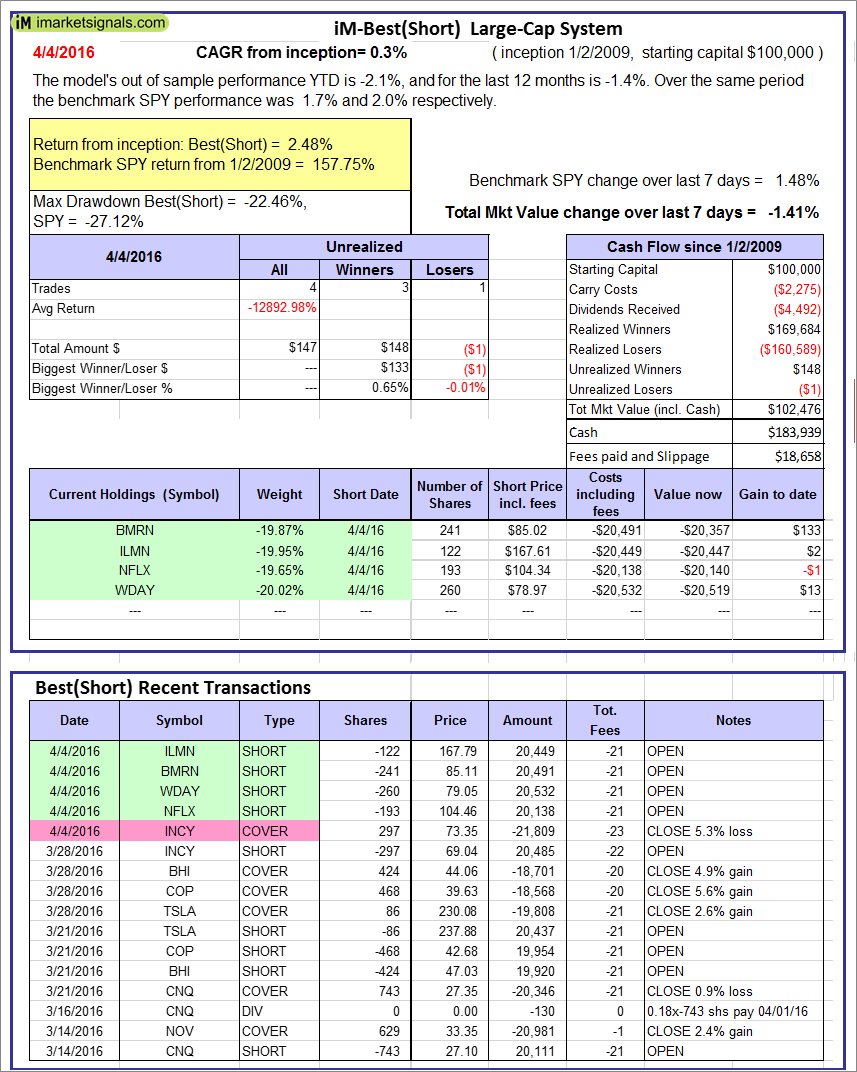 |
iM-Best(Short): The model’s out of sample performance YTD is -2.1%, and for the last 12 months is -1.4%. Over the same period the benchmark SPY performance was 1.7% and 2.0% respectively. Over the previous week the market value of iM-Best(Short) gained -1.41% at a time when SPY gained 1.48%. Over the period 1/2/2009 to 4/4/2016 the starting capital of $100,000 would have grown to $102,476 which includes $183,939 cash and excludes $18,658 spent on fees and slippage. |
iM-Best Reports – 4/5/2016
Posted in pmp SPY-SH
Leave a Reply
You must be logged in to post a comment.