
  |
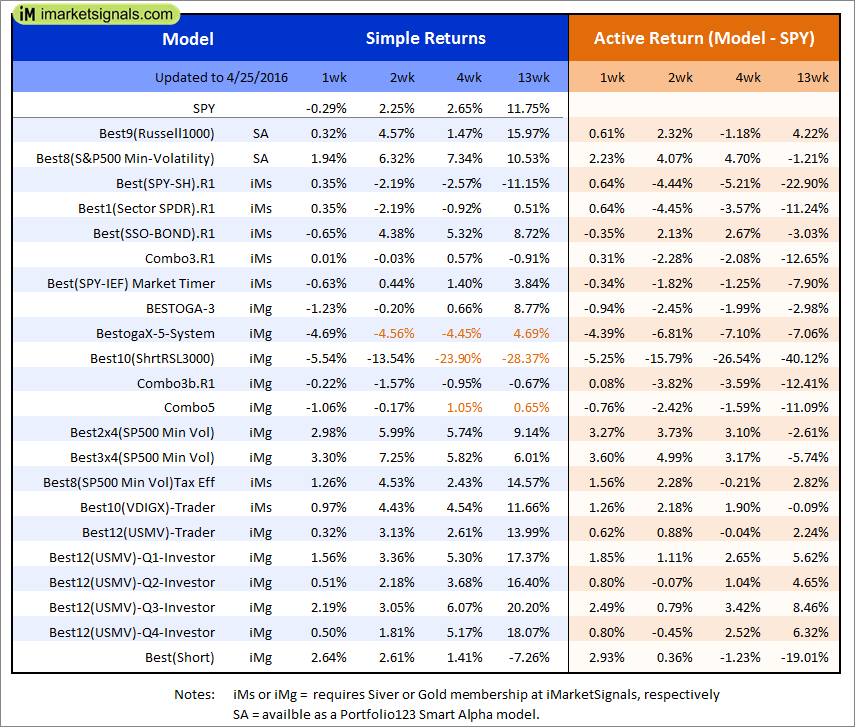
Out of sample performance summary of our models for the past 1, 2, 4 and 13 week periods. The active active return indicates how the models over- or underperformed the benchmark ETF SPY. Also the YTD, and the 1-, 3-, 5- and 10-year annualized returns are shown in the second table |
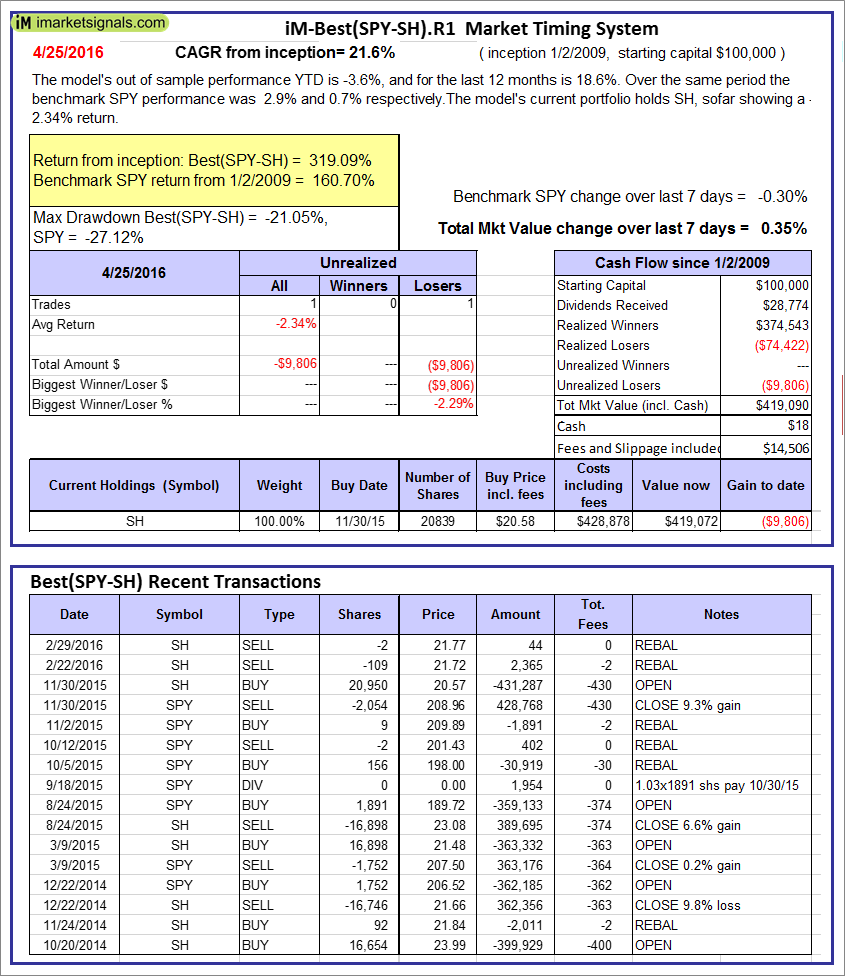 |
iM-Best(SPY-SH).R1: The model’s out of sample performance YTD is -3.6%, and for the last 12 months is 18.6%. Over the same period the benchmark SPY performance was 2.9% and 0.7% respectively. Over the previous week the market value of Best(SPY-SH) gained 0.35% at a time when SPY gained -0.30%. A starting capital of $100,000 at inception on 1/2/2009 would have grown to $419,090 which includes $18 cash and excludes $14,506 spent on fees and slippage. |
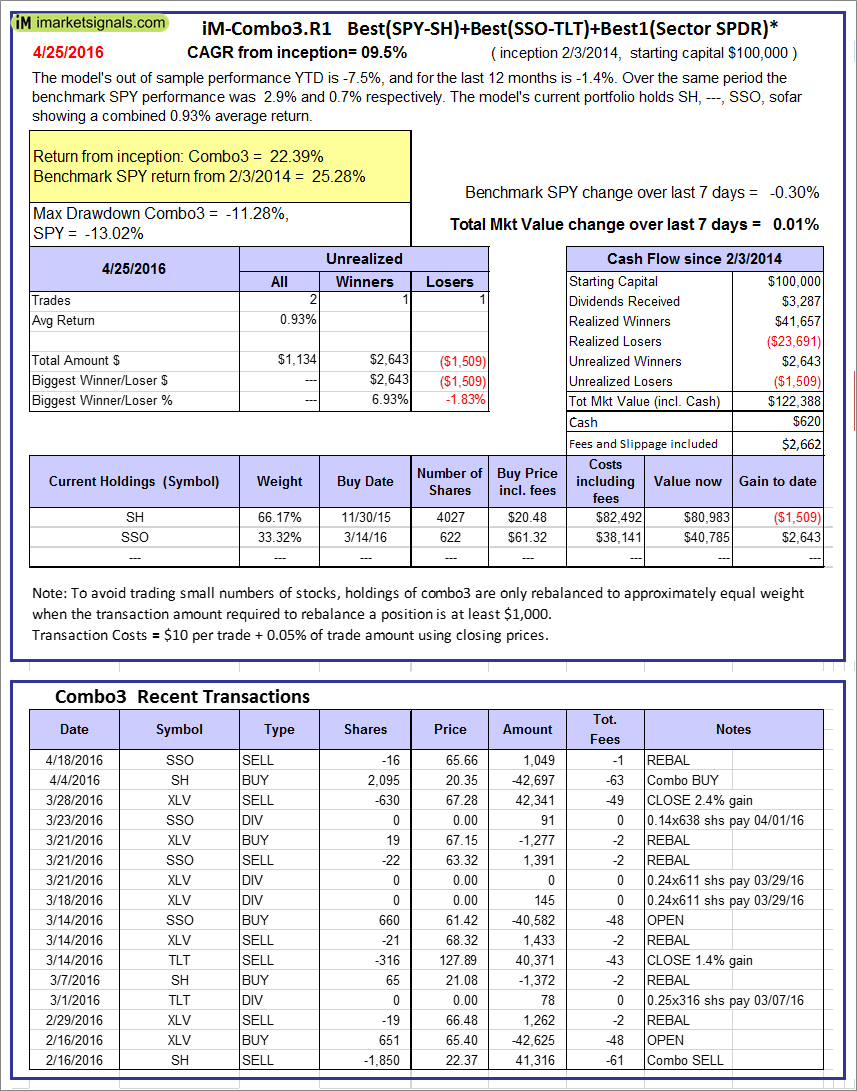 |
iM-Combo3.R1: The model’s out of sample performance YTD is -7.5%, and for the last 12 months is -1.4%. Over the same period the benchmark SPY performance was 2.9% and 0.7% respectively. Over the previous week the market value of iM-Combo3.R1 gained 0.01% at a time when SPY gained -0.30%. A starting capital of $100,000 at inception on 2/3/2014 would have grown to $122,388 which includes $620 cash and excludes $2,662 spent on fees and slippage. |
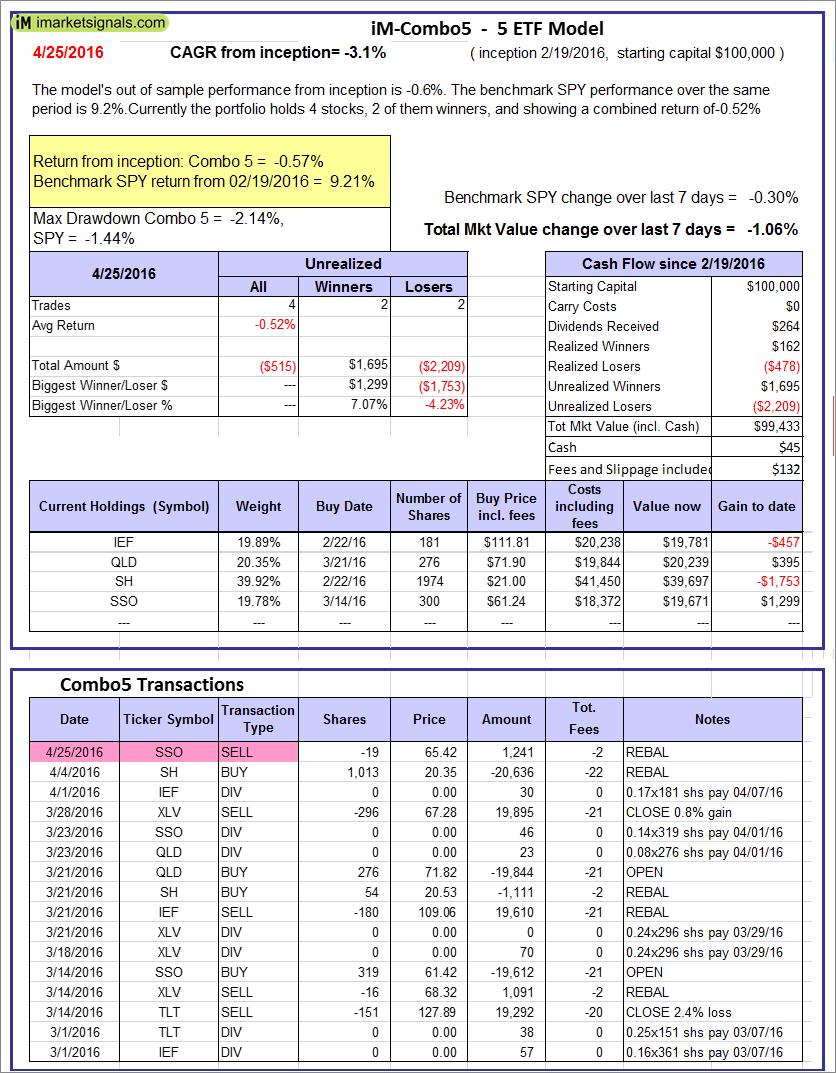 |
iM-Combo5: The model’s out of sample performance from inception is -0.6%. The benchmark SPY performance over the same period is 9.2%. Over the previous week the market value of iM-Combo5 gained -1.06% at a time when SPY gained -0.30%. A starting capital of $100,000 at inception on 2/22/2016 would have grown to $99,433 which includes $45 cash and excludes $132 spent on fees and slippage. |
 |
The iM-Best8(S&P500 Min Vol)Tax-Efficient The model’s out of sample performance YTD is 8.7%, and for the last 12 months is 9.7%. Over the same period the benchmark SPY performance was 2.9% and 0.7% respectively. Over the previous week the market value of iM-Best8(S&P 500)Tax-Eff. gained 1.26% at a time when SPY gained -0.30%. A starting capital of $100,000 at inception on 1/2/2009 would have grown to $484,023 which includes $1,806 cash and excludes $6,294 spent on fees and slippage. |
  |
iM-Best10(VDIGX)-Trader: The model’s out of sample performance YTD is 4.1%, and for the last 12 months is 12.3%. Over the same period the benchmark SPY performance was 2.9% and 0.7% respectively. Since inception, on 7/1/2014, the model gained 31.29% while the benchmark SPY gained 10.41% and the ETF VDIGX gained 14.60% over the same period. Over the previous week the market value of iM-Best10(VDIGX) gained 0.97% at a time when SPY gained -0.30%. A starting capital of $100,000 at inception on 7/1/2014 would have grown to $131,294 which includes -$47 cash and excludes $1,050 spent on fees and slippage. |
 |
iM-BESTOGA-3: The model’s out of sample performance YTD is 6.2%, and for the last 12 months is 33.4%. Over the same period the benchmark SPY performance was 2.9% and 0.7% respectively. Over the previous week the market value of iM-BESTOGA-3 gained -1.23% at a time when SPY gained -0.30%. A starting capital of $100,000 at inception on 2/3/2014 would have grown to $195,114 which includes $17,365 cash and excludes $767 spent on fees and slippage. |
 |
iM-Best10(Short Russell3000): The model’s performance YTD is -27.1%, and for the last 12 months is 0.3%. Over the same period the benchmark SPY performance was 2.9% and 0.7% respectively. Over the previous week the market value of iM-Best10(Short Russell3000) gained -5.54% at a time when SPY gained -0.30%. Over the period 2/3/2014 to 4/25/2016 the starting capital of $100,000 would have grown to $10,353 which includes $20,174 cash and excludes $1,128 spent on fees and slippage. |
 |
iM-BestogaX5-System: The model’s out of sample performance from inception is -4.5%. The benchmark SPY performance over the same period is 2.6%. Over the previous week the market value of iM-Best8(S&P 500)Tax-Eff. gained -4.69% at a time when SPY gained -0.30%. A starting capital of $100,000 at inception on 1/2/2009 would have grown to $95,547 which includes $20,770 cash and excludes $82 spent on fees and slippage. |
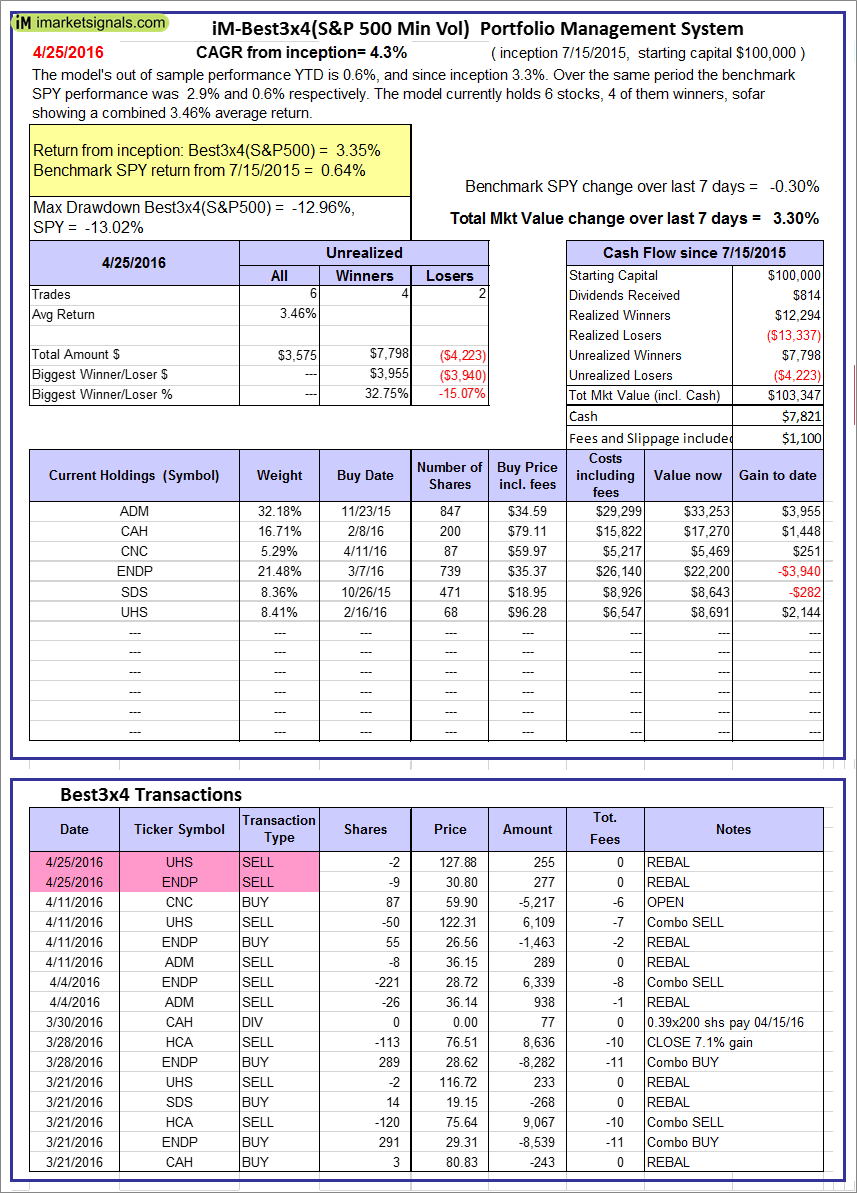 |
iM-Best3x4(S&P 500 Min Vol): The model’s out of sample performance YTD is 0.6%, and since inception 3.3%. Over the same period the benchmark SPY performance was 2.9% and 0.6% respectively. Over the previous week the market value of iM-Best3x4 gained 3.30% at a time when SPY gained -0.30%. A starting capital of $100,000 at inception on 7/15/2015 would have grown to $103,347 which includes $7,821 cash and excludes $1,100 spent on fees and slippage. |
 |
iM-Best2x4(S&P 500 Min Vol): The model’s out of sample performance YTD is 4.2%, and since inception 3.0%. Over the same period the benchmark SPY performance was 2.9% and 0.7% respectively. Over the previous week the market value of iM-Best2x4 gained 2.98% at a time when SPY gained -0.30%. A starting capital of $100,000 at inception on 7/16/2015 would have grown to $102,951 which includes $806 cash and excludes $780 spent on fees and slippage. |
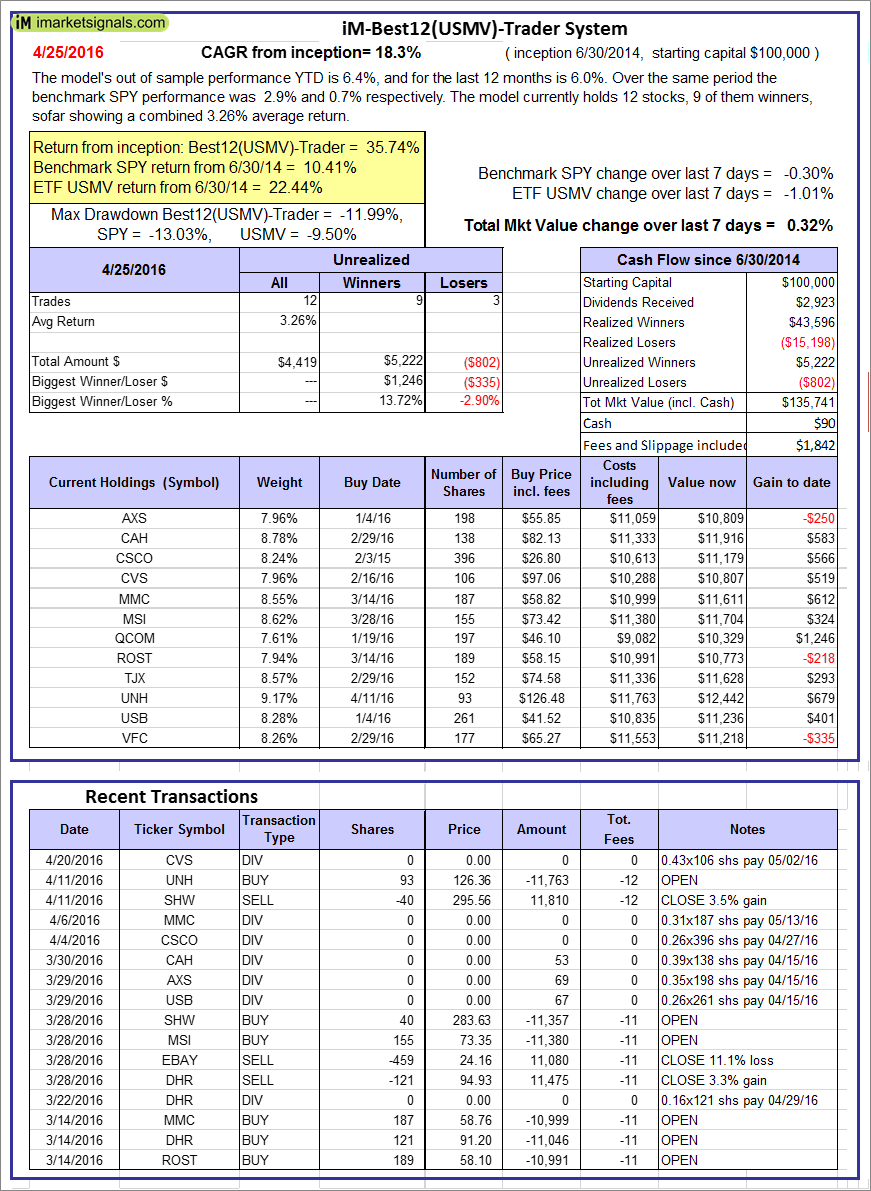 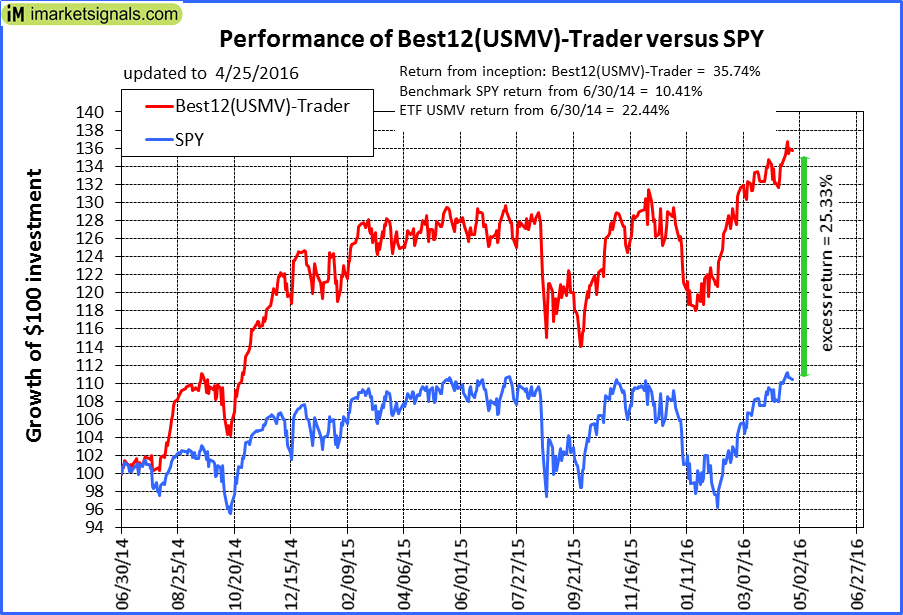 |
iM-Best12(USMV)-Trader: The model’s out of sample performance YTD is 6.4%, and for the last 12 months is 6.0%. Over the same period the benchmark SPY performance was 2.9% and 0.7% respectively. Since inception, on 7/1/2014, the model gained 35.74% while the benchmark SPY gained 10.41% and the ETF USMV gained 22.44% over the same period. Over the previous week the market value of iM-Best12(USMV)-Trader gained 0.32% at a time when SPY gained -0.30%. A starting capital of $100,000 at inception on 7/1/2014 would have grown to $135,741 which includes $90 cash and excludes $1,842 spent on fees and slippage. |
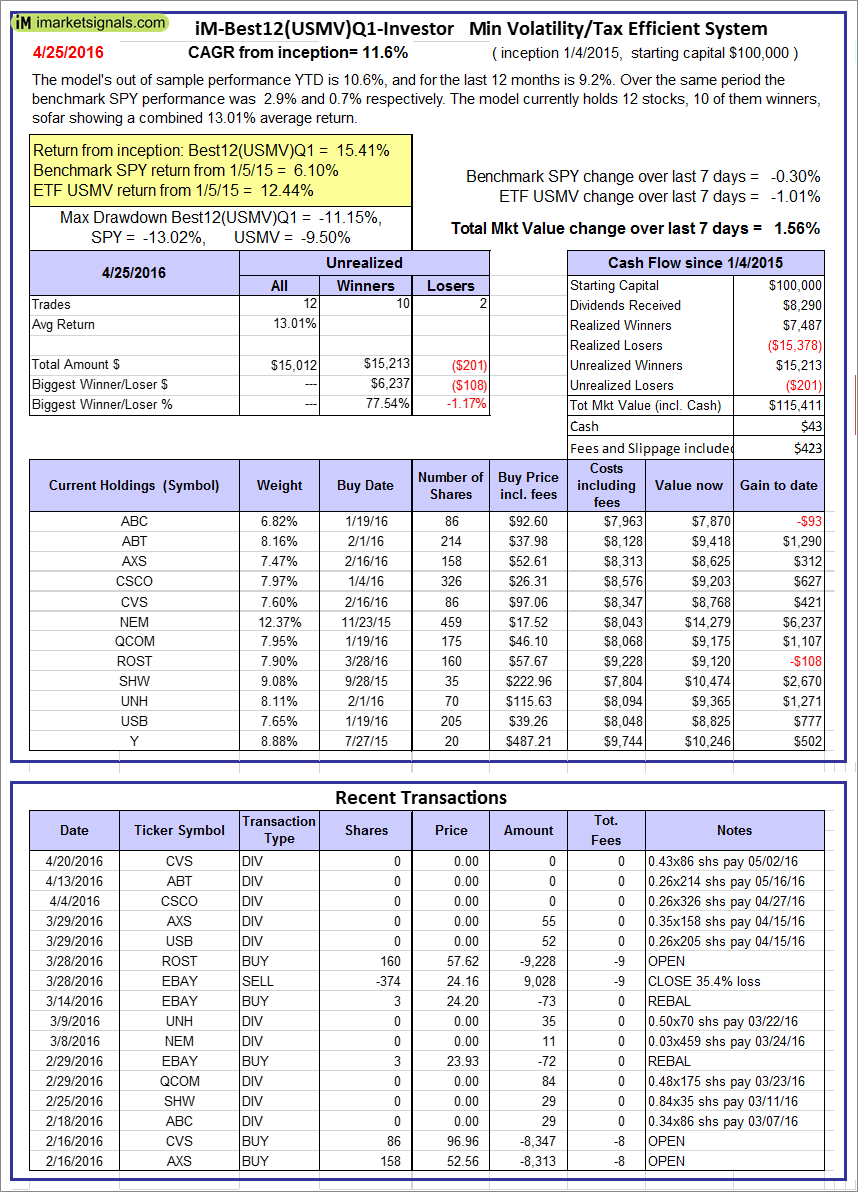 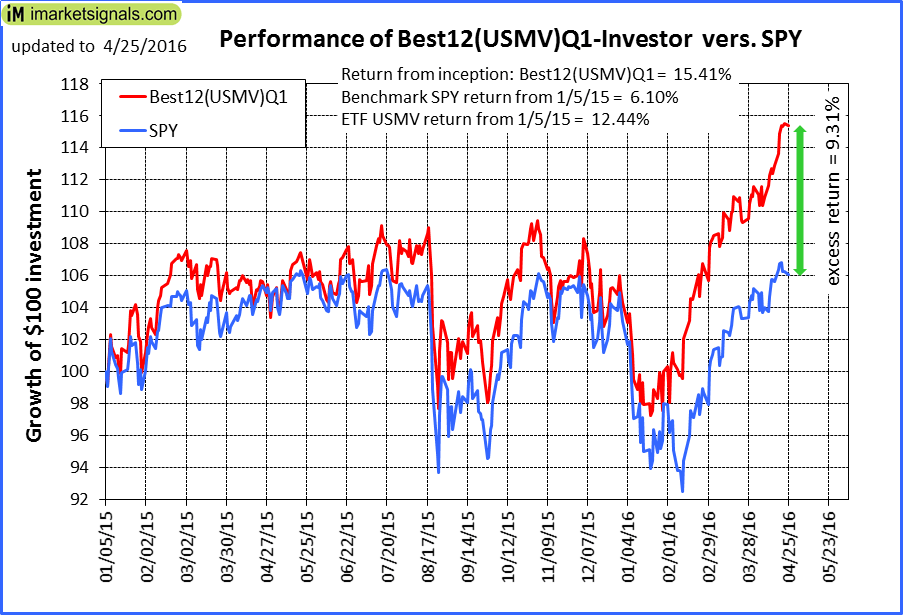 |
iM-Best12(USMV)Q1-Investor: The model’s out of sample performance YTD is -4.0%, and for the last 12 months is -2.5%. Over the same period the benchmark SPY performance was -9.0% and -7.9% respectively. Since inception, on 1/5/2015, the model gained 0.17% while the benchmark SPY gained -6.18% and the ETF USMV gained 1.97% over the same period. Over the previous week the market value of iM-Best12(USMV)Q1 gained -0.18% at a time when SPY gained -4.25%. A starting capital of $100,000 at inception on 1/5/2015 would have grown to $100,167 which includes -$69 cash and excludes $371 spent on fees and slippage. |
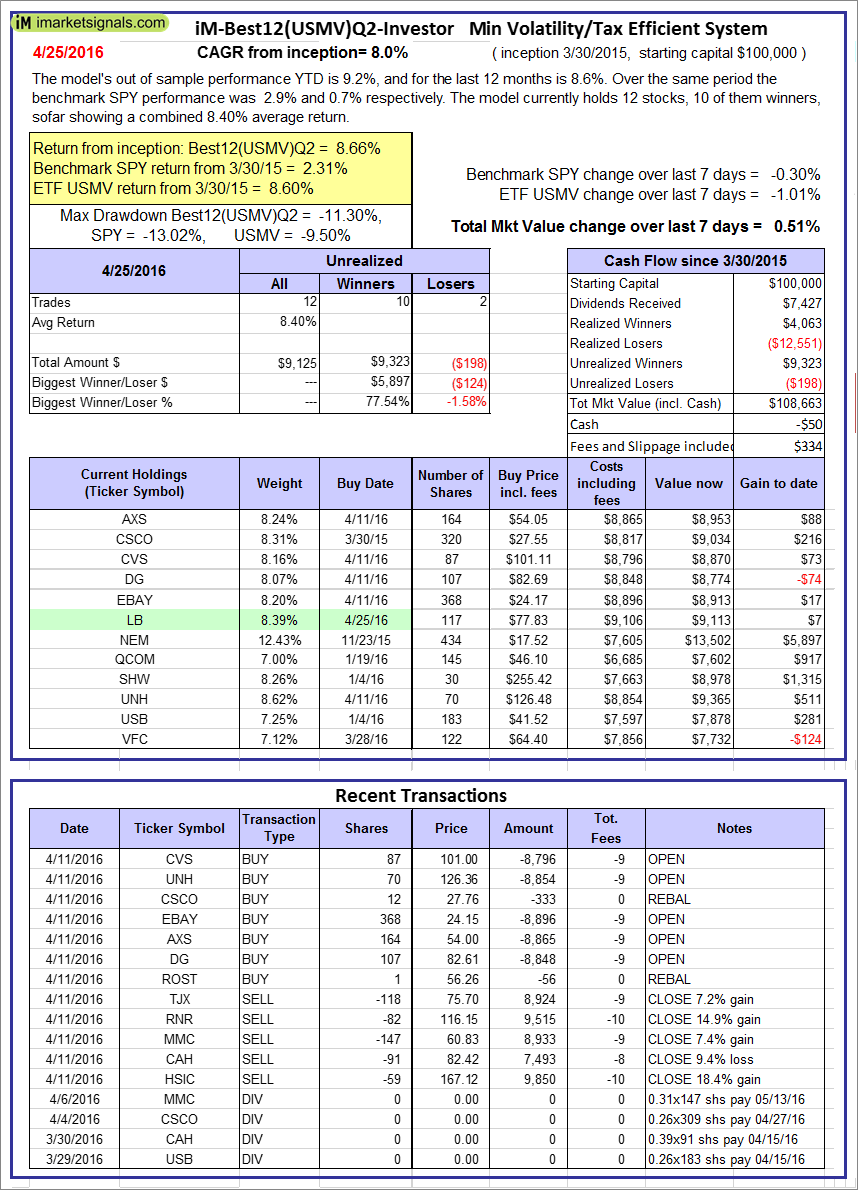 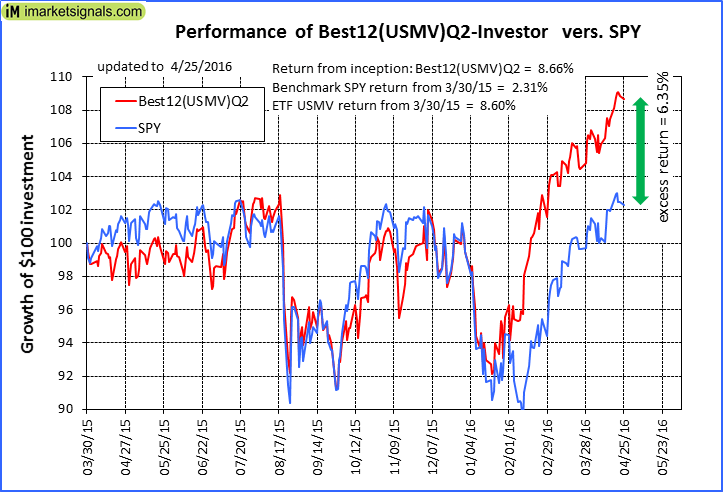 |
iM-Best12(USMV)Q2-Investor: The model’s out of sample performance YTD is -4.2%, and since inception -4.7%. Over the same period the benchmark SPY performance was -9.0% and -8.4% respectively. Since inception, on 3/31/2015, the model gained -4.68% while the benchmark SPY gained -9.53% and the ETF USMV gained -1.51% over the same period. Over the previous week the market value of iM-Best12(USMV)Q2 gained -1.02% at a time when SPY gained -4.25%. A starting capital of $100,000 at inception on 3/31/2015 would have grown to $95,321 which includes $43 cash and excludes $211 spent on fees and slippage. |
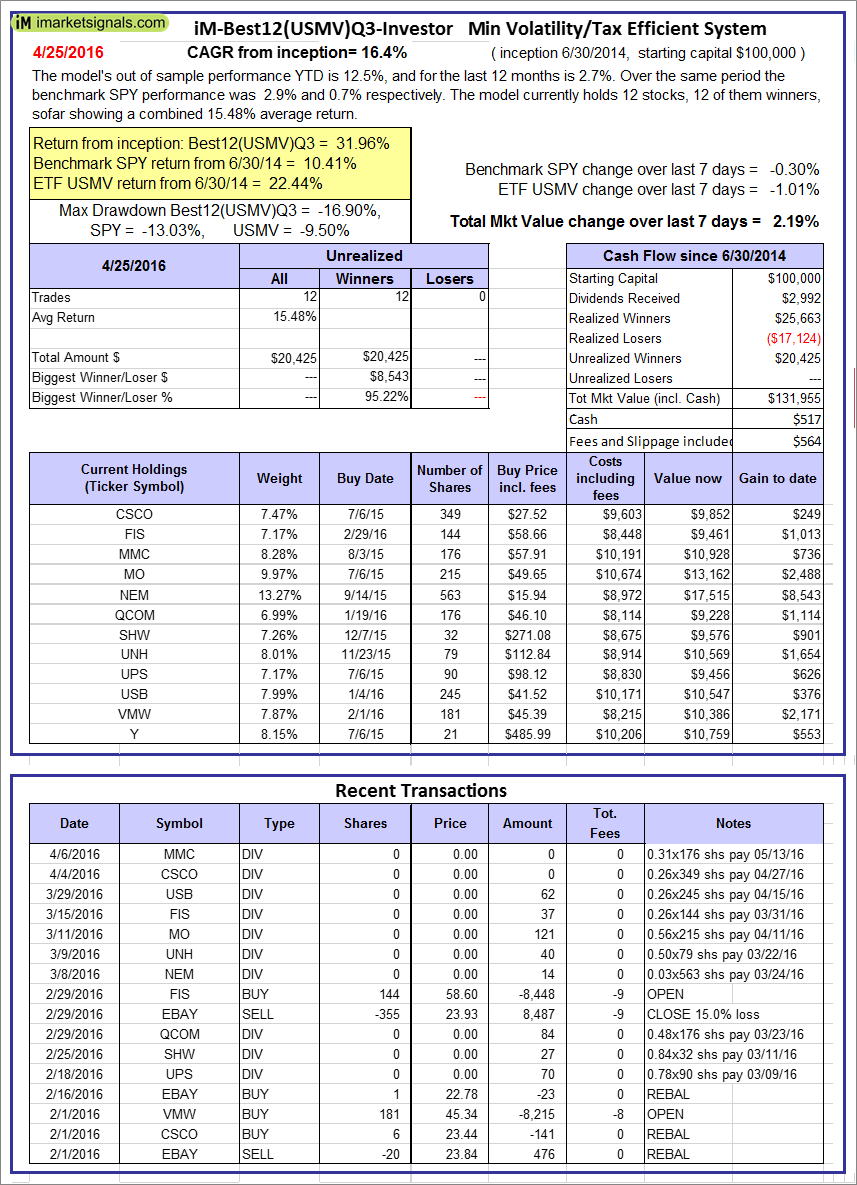 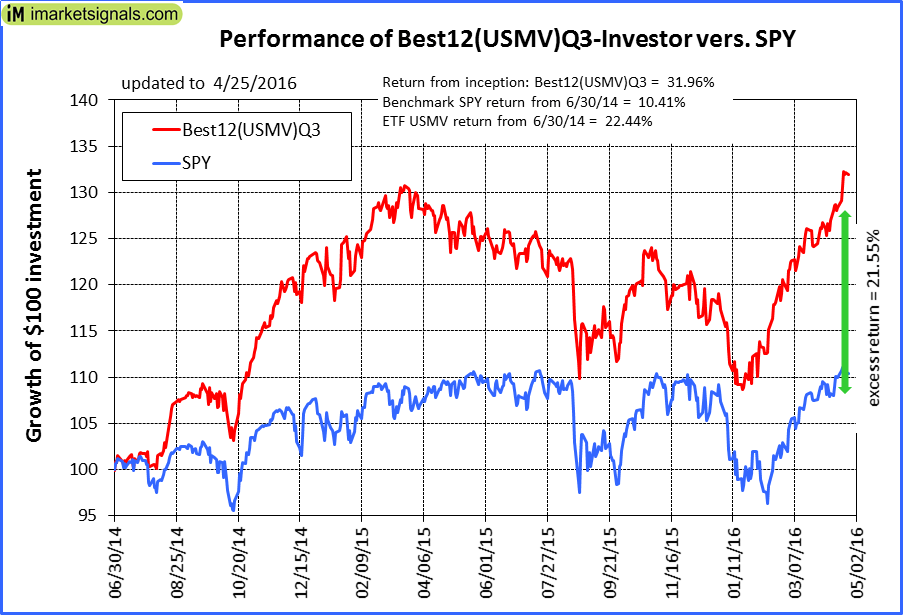 |
iM-Best12(USMV)Q3-Investor: The model’s out of sample performance YTD is -3.5%, and for the last 12 months is -8.7%. Over the same period the benchmark SPY performance was -9.0% and -7.9% respectively. Since inception, on 7/1/2014, the model gained 13.16% while the benchmark SPY gained -2.37% and the ETF USMV gained 11.04% over the same period. Over the previous week the market value of iM-Best12(USMV)Q3 gained 0.54% at a time when SPY gained -4.25%. A starting capital of $100,000 at inception on 7/1/2014 would have grown to $113,158 which includes -$10 cash and excludes $547 spent on fees and slippage. |
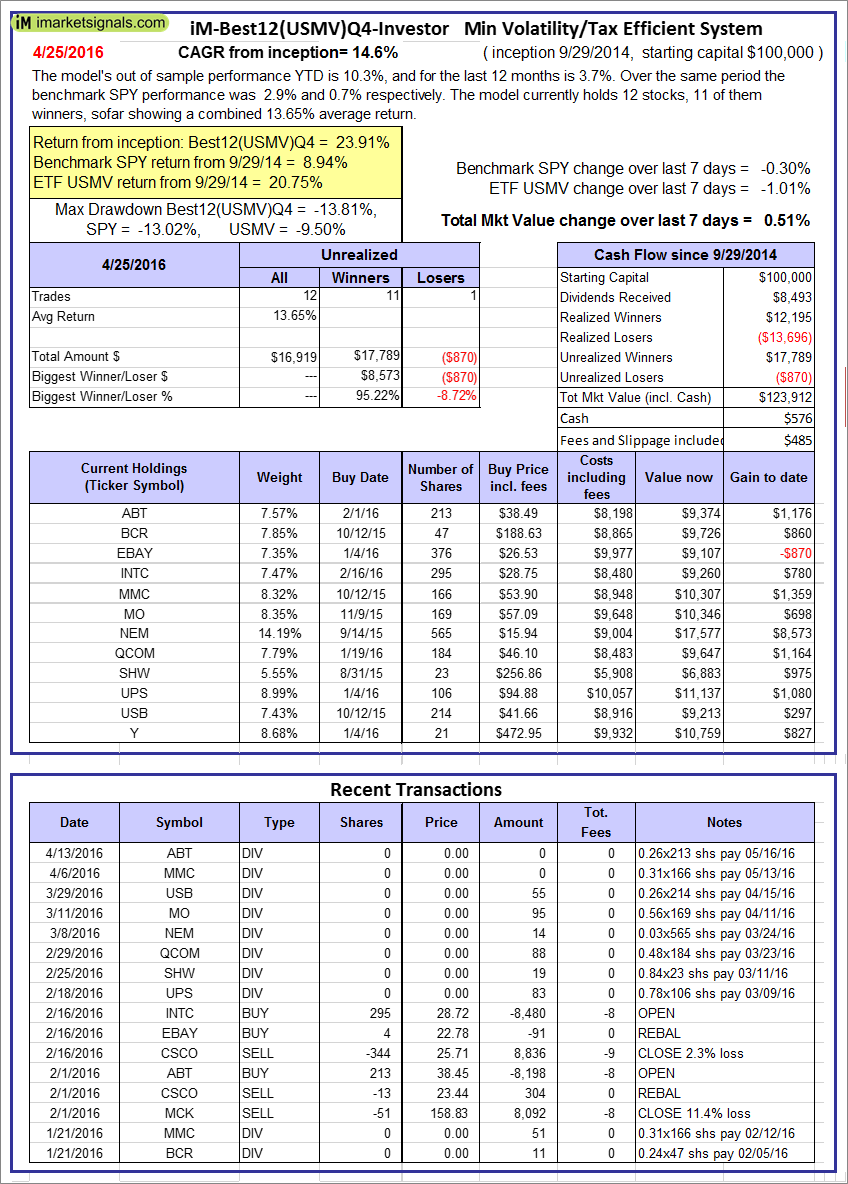 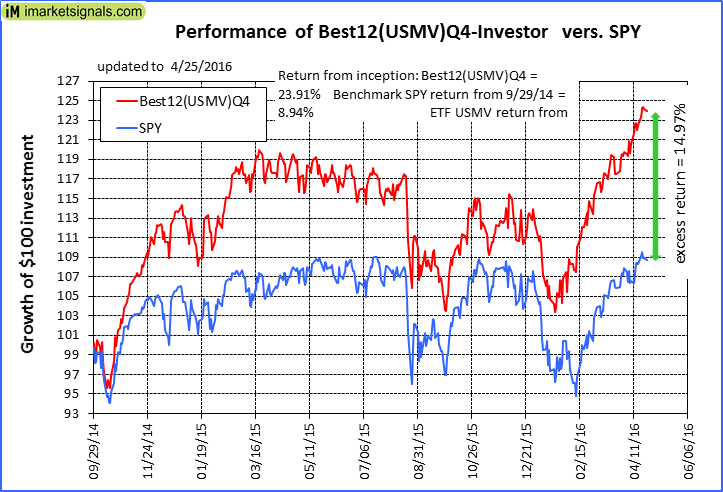 |
iM-Best12(USMV)Q4-Investor: Since inception, on 9/30/2014, the model gained 8.03% while the benchmark SPY gained -3.68% and the ETF USMV gained 9.51% over the same period. Over the previous week the market value of iM-Best12(USMV)Q4 gained 0.51% at a time when SPY gained -4.25%. A starting capital of $100,000 at inception on 9/30/2014 would have grown to $108,029 which includes -$106 cash and excludes $468 spent on fees and slippage. |
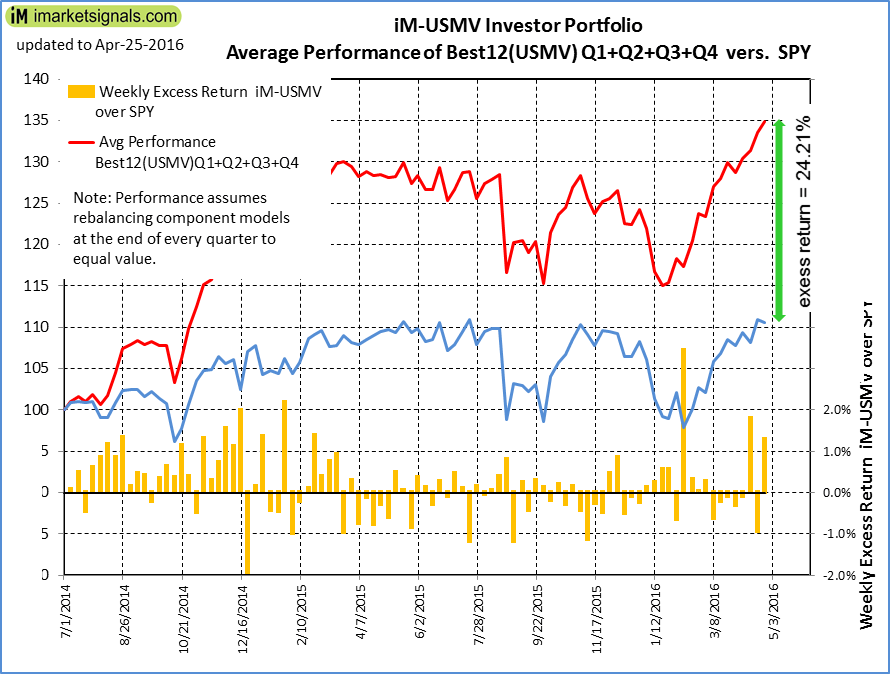 |
Average Performance of iM-Best12(USMV)Q1+Q2+Q3+Q4-Investor resulted in an excess return of 19.51% over SPY. (see iM-USMV Investor Portfolio) |
 |
iM-Best(Short): The model’s out of sample performance YTD is 0.7%, and for the last 12 months is 2.3%. Over the same period the benchmark SPY performance was 2.9% and 0.7% respectively. Over the previous week the market value of iM-Best(Short) gained 2.63% at a time when SPY gained -0.30%. Over the period 1/2/2009 to 4/25/2016 the starting capital of $100,000 would have grown to $105,407 which includes $146,675 cash and excludes $18,828 spent on fees and slippage. |
iM-Best Reports – 4/25/2016
Posted in pmp SPY-SH
Leave a Reply
You must be logged in to post a comment.