
  |
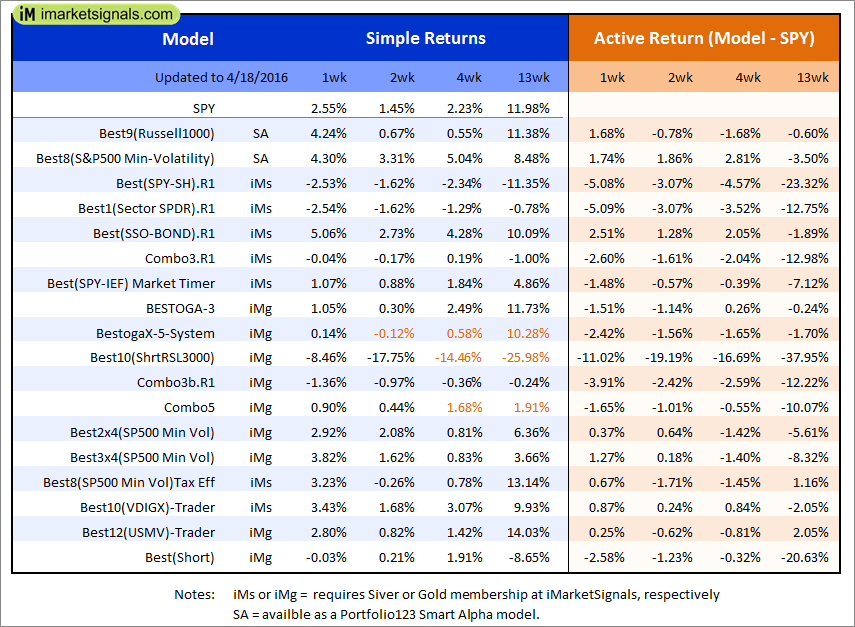
Out of sample performance summary of our models for the past 1, 2, 4 and 13 week periods. The active active return indicates how the models over- or underperformed the benchmark ETF SPY. Also the YTD, and the 1-, 3-, 5- and 10-year annualized returns are shown in the second table |
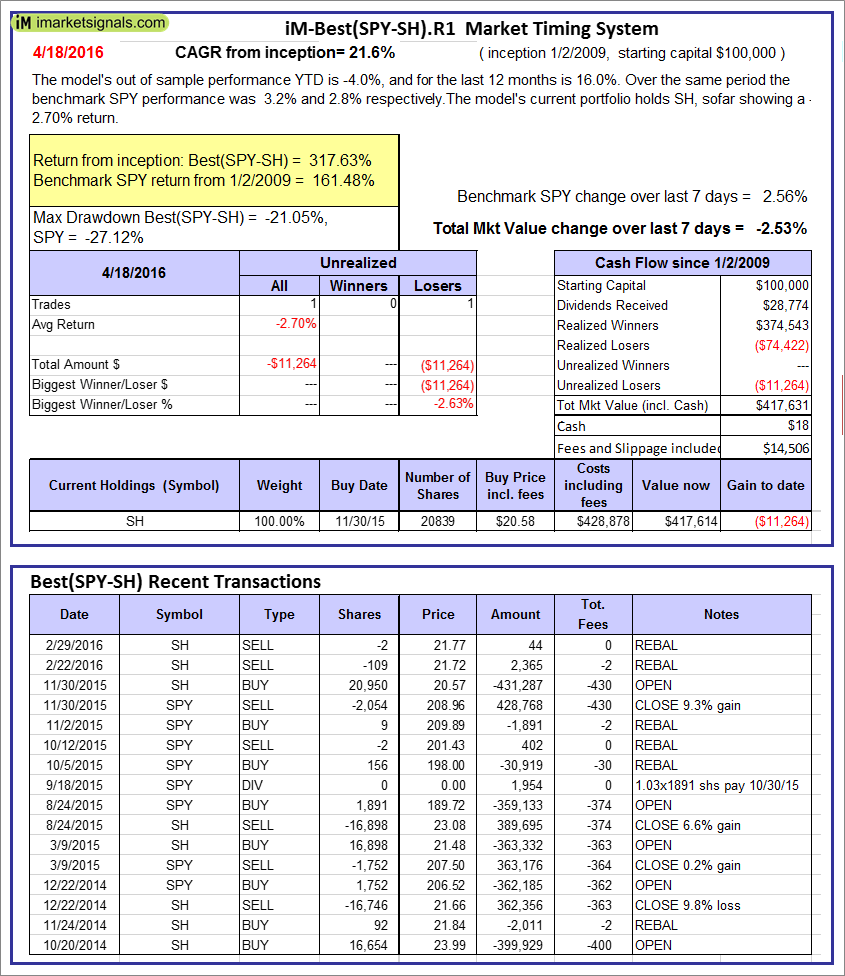 |
iM-Best(SPY-SH).R1: The model’s out of sample performance YTD is -4.0%, and for the last 12 months is 16.0%. Over the same period the benchmark SPY performance was 3.2% and 2.8% respectively. Over the previous week the market value of Best(SPY-SH) gained -2.53% at a time when SPY gained 2.56%. A starting capital of $100,000 at inception on 1/2/2009 would have grown to $417,631 which includes $18 cash and excludes $14,506 spent on fees and slippage. |
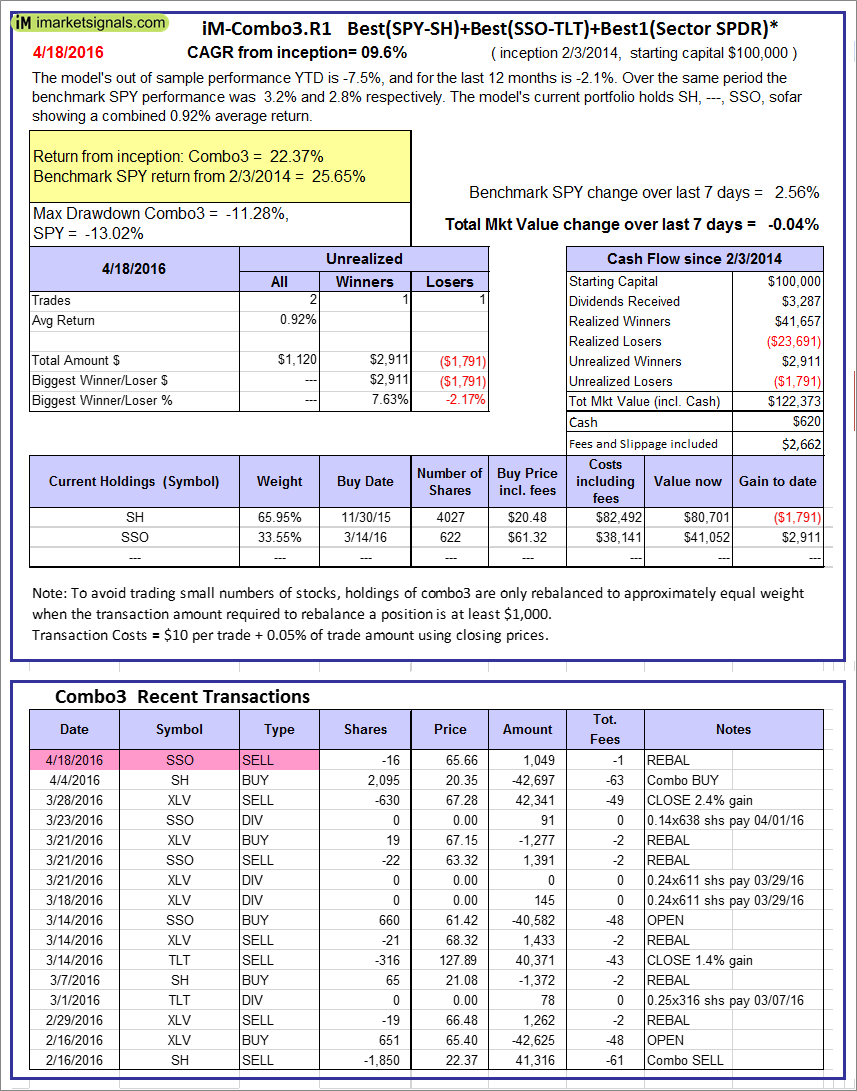 |
iM-Combo3.R1: The model’s out of sample performance YTD is -7.5%, and for the last 12 months is -2.1%. Over the same period the benchmark SPY performance was 3.2% and 2.8% respectively. Over the previous week the market value of iM-Combo3.R1 gained -0.04% at a time when SPY gained 2.56%. A starting capital of $100,000 at inception on 2/3/2014 would have grown to $122,373 which includes $620 cash and excludes $2,662 spent on fees and slippage. |
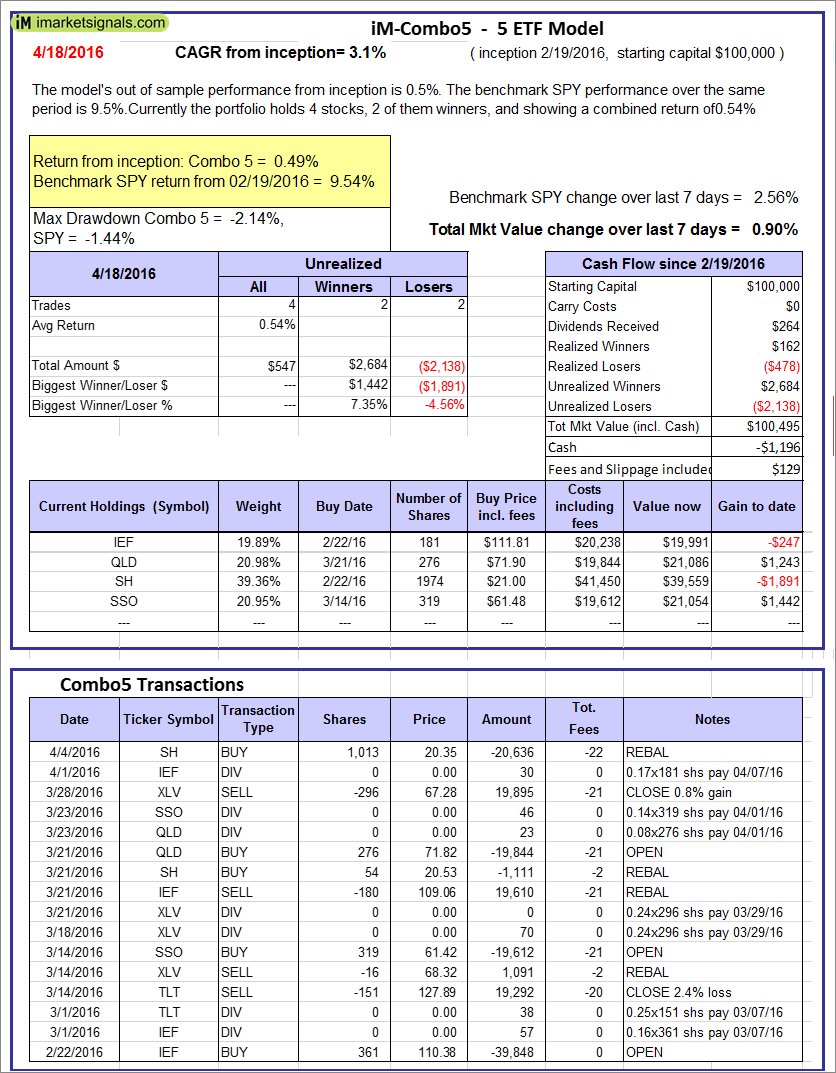 |
iM-Combo5: The model’s out of sample performance from inception is 0.5%. The benchmark SPY performance over the same period is 9.5%. Over the previous week the market value of iM-Combo5 gained 0.90% at a time when SPY gained 2.56%. A starting capital of $100,000 at inception on 2/22/2016 would have grown to $100,495 which includes -$1,196 cash and excludes $129 spent on fees and slippage. |
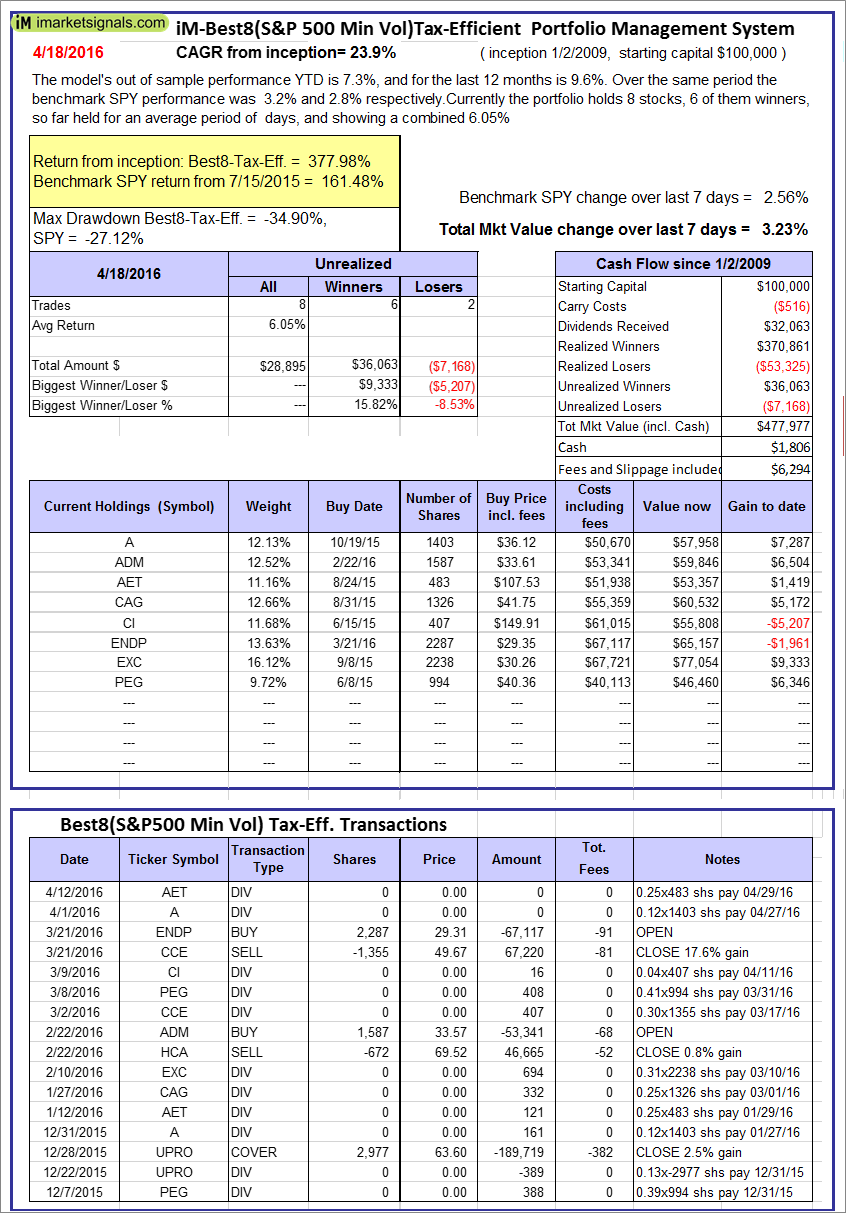 |
The iM-Best8(S&P500 Min Vol)Tax-Efficient The model’s out of sample performance YTD is 7.3%, and for the last 12 months is 9.6%. Over the same period the benchmark SPY performance was 3.2% and 2.8% respectively. Over the previous week the market value of iM-Best8(S&P 500)Tax-Eff. gained 3.23% at a time when SPY gained 2.56%. A starting capital of $100,000 at inception on 1/2/2009 would have grown to $477,977 which includes $1,806 cash and excludes $6,294 spent on fees and slippage. |
  |
iM-Best10(VDIGX)-Trader: The model’s out of sample performance YTD is 3.1%, and for the last 12 months is 11.5%. Over the same period the benchmark SPY performance was 3.2% and 2.8% respectively. Since inception, on 7/1/2014, the model gained 30.03% while the benchmark SPY gained 10.74% and the ETF VDIGX gained 14.70% over the same period. Over the previous week the market value of iM-Best10(VDIGX) gained 3.43% at a time when SPY gained 2.56%. A starting capital of $100,000 at inception on 7/1/2014 would have grown to $130,032 which includes -$47 cash and excludes $1,050 spent on fees and slippage. |
 |
iM-BESTOGA-3: The model’s out of sample performance YTD is 7.5%, and for the last 12 months is 33.1%. Over the same period the benchmark SPY performance was 3.2% and 2.8% respectively. Over the previous week the market value of iM-BESTOGA-3 gained 1.05% at a time when SPY gained 2.56%. A starting capital of $100,000 at inception on 2/3/2014 would have grown to $197,552 which includes $17,365 cash and excludes $767 spent on fees and slippage. |
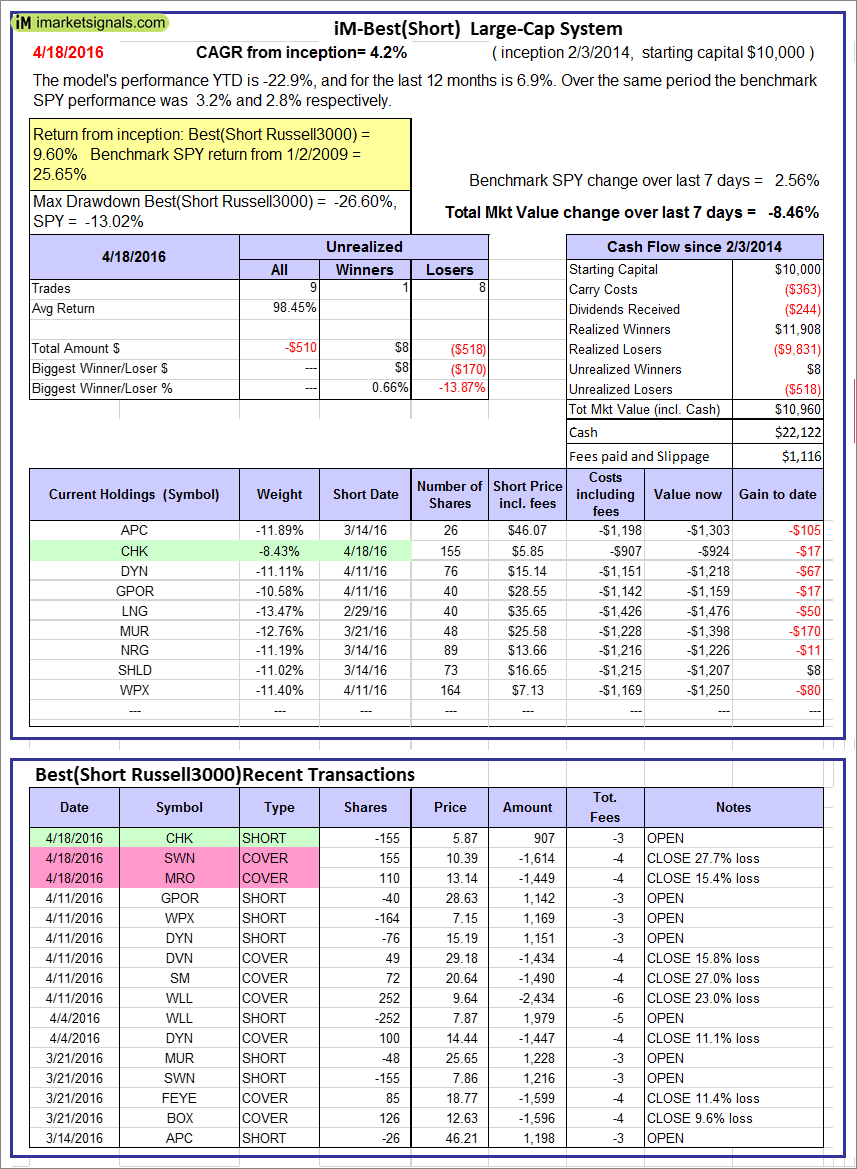 |
iM-Best10(Short Russell3000): The model’s performance YTD is -22.9%, and for the last 12 months is 6.9%. Over the same period the benchmark SPY performance was 3.2% and 2.8% respectively. Over the previous week the market value of iM-Best10(Short Russell3000) gained -8.46% at a time when SPY gained 2.56%. Over the period 2/3/2014 to 4/18/2016 the starting capital of $100,000 would have grown to $10,960 which includes $22,122 cash and excludes $1,116 spent on fees and slippage. |
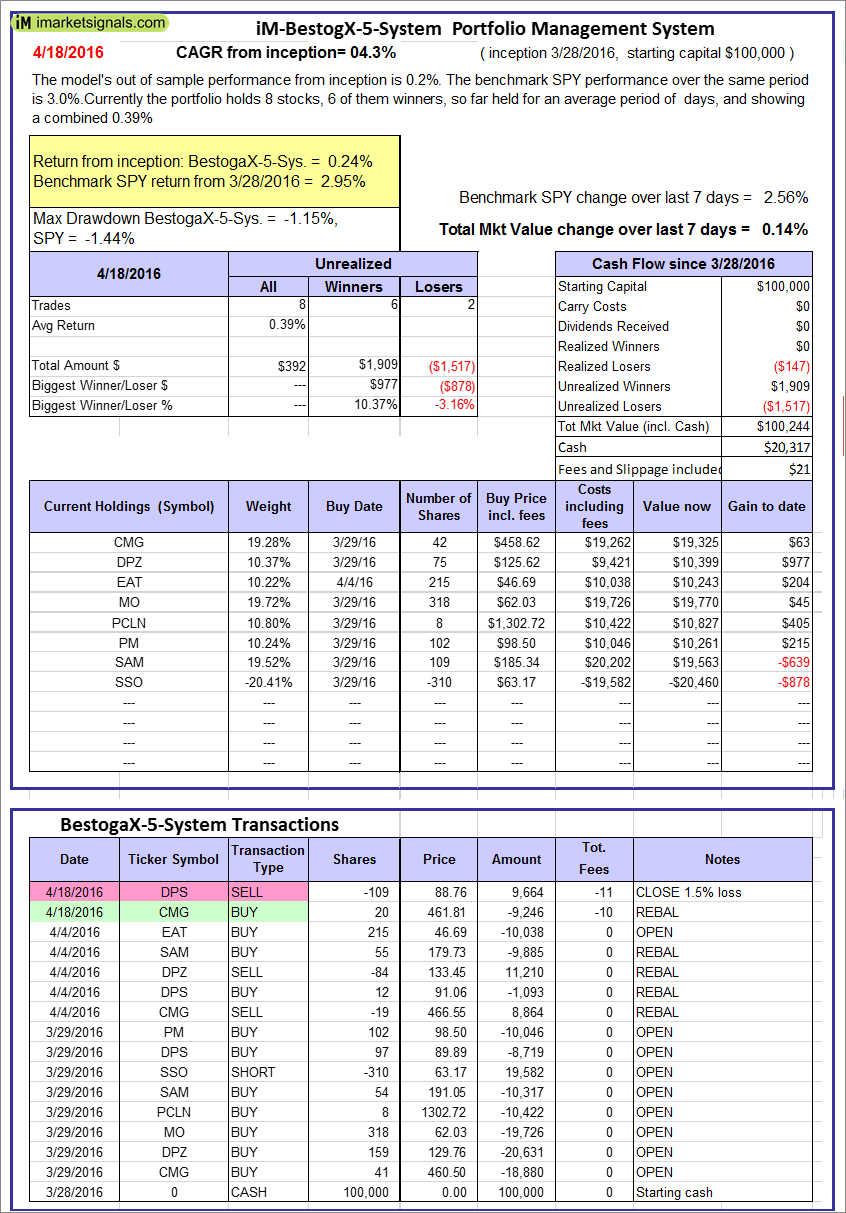 |
iM-BestogaX5-System: The model’s out of sample performance from inception is 0.2%. The benchmark SPY performance over the same period is 3.0%. Over the previous week the market value of iM-Best8(S&P 500)Tax-Eff. gained 0.14% at a time when SPY gained 2.56%. A starting capital of $100,000 at inception on 1/2/2009 would have grown to $100,244 which includes $20,317 cash and excludes $21 spent on fees and slippage. |
 |
iM-Best3x4(S&P 500 Min Vol): The model’s out of sample performance YTD is -2.6%, and since inception 0.0%. Over the same period the benchmark SPY performance was 3.2% and 0.9% respectively. Over the previous week the market value of iM-Best3x4 gained 3.82% at a time when SPY gained 2.56%. A starting capital of $100,000 at inception on 7/15/2015 would have grown to $100,045 which includes $7,289 cash and excludes $1,099 spent on fees and slippage. |
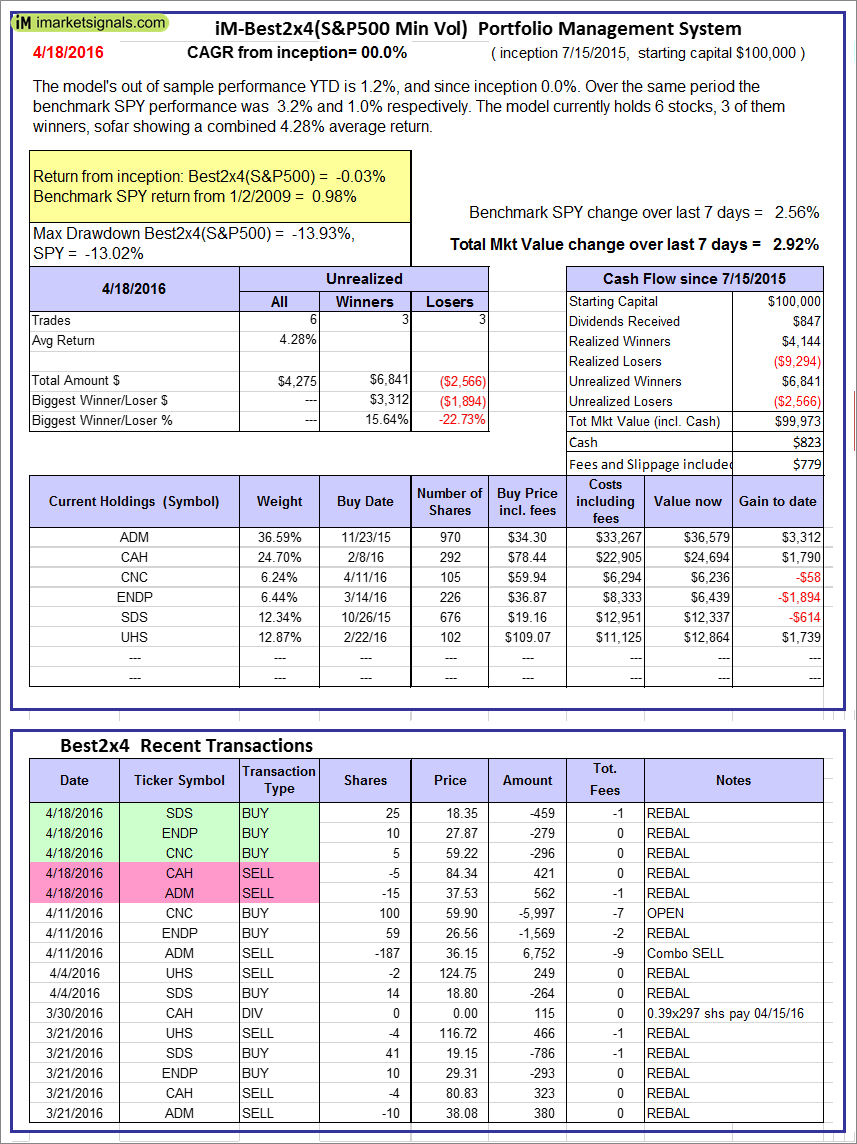 |
iM-Best2x4(S&P 500 Min Vol): The model’s out of sample performance YTD is 1.2%, and since inception 0.0%. Over the same period the benchmark SPY performance was 3.2% and 1.0% respectively. Over the previous week the market value of iM-Best2x4 gained 2.92% at a time when SPY gained 2.56%. A starting capital of $100,000 at inception on 7/16/2015 would have grown to $99,973 which includes $823 cash and excludes $779 spent on fees and slippage. |
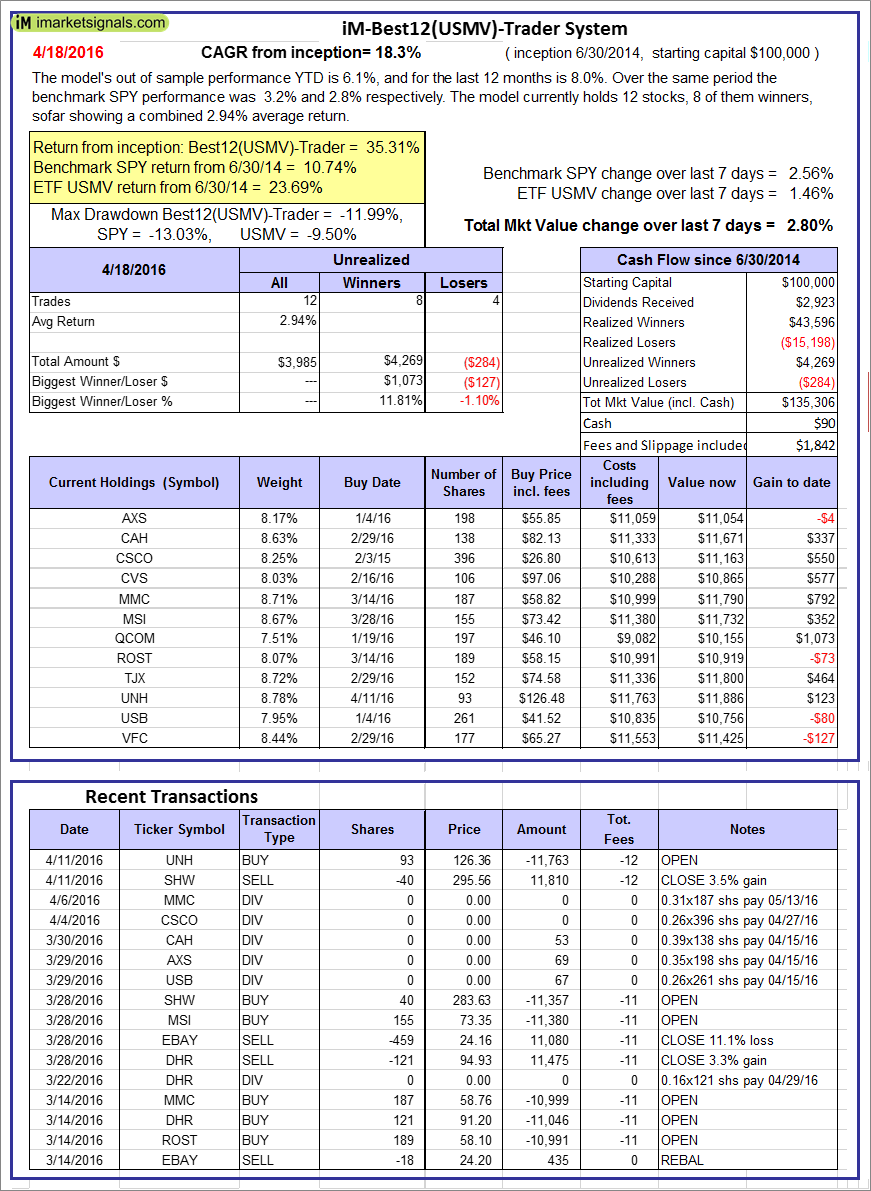 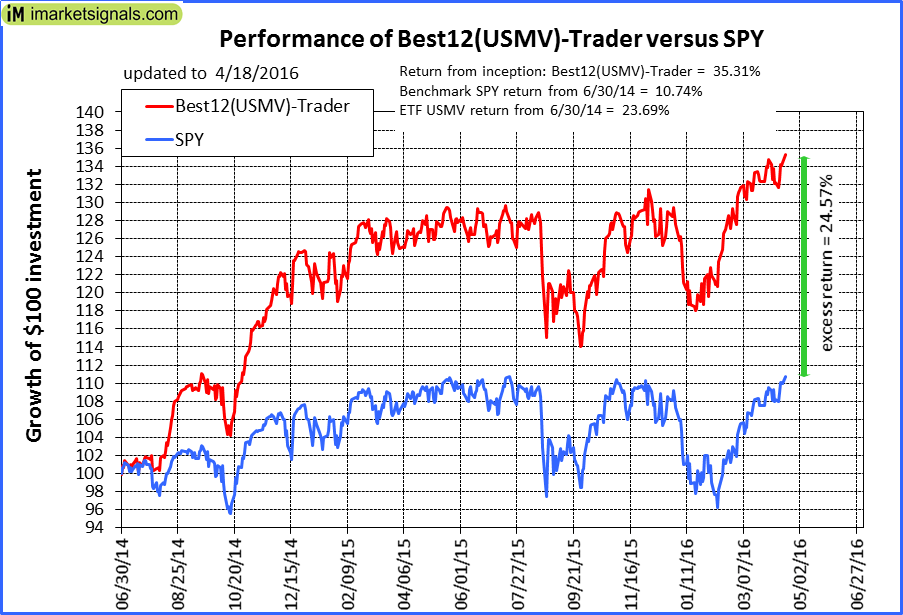 |
iM-Best12(USMV)-Trader: The model’s out of sample performance YTD is 6.1%, and for the last 12 months is 8.0%. Over the same period the benchmark SPY performance was 3.2% and 2.8% respectively. Since inception, on 7/1/2014, the model gained 35.31% while the benchmark SPY gained 10.74% and the ETF USMV gained 23.69% over the same period. Over the previous week the market value of iM-Best12(USMV)-Trader gained 2.80% at a time when SPY gained 2.56%. A starting capital of $100,000 at inception on 7/1/2014 would have grown to $135,306 which includes $90 cash and excludes $1,842 spent on fees and slippage. |
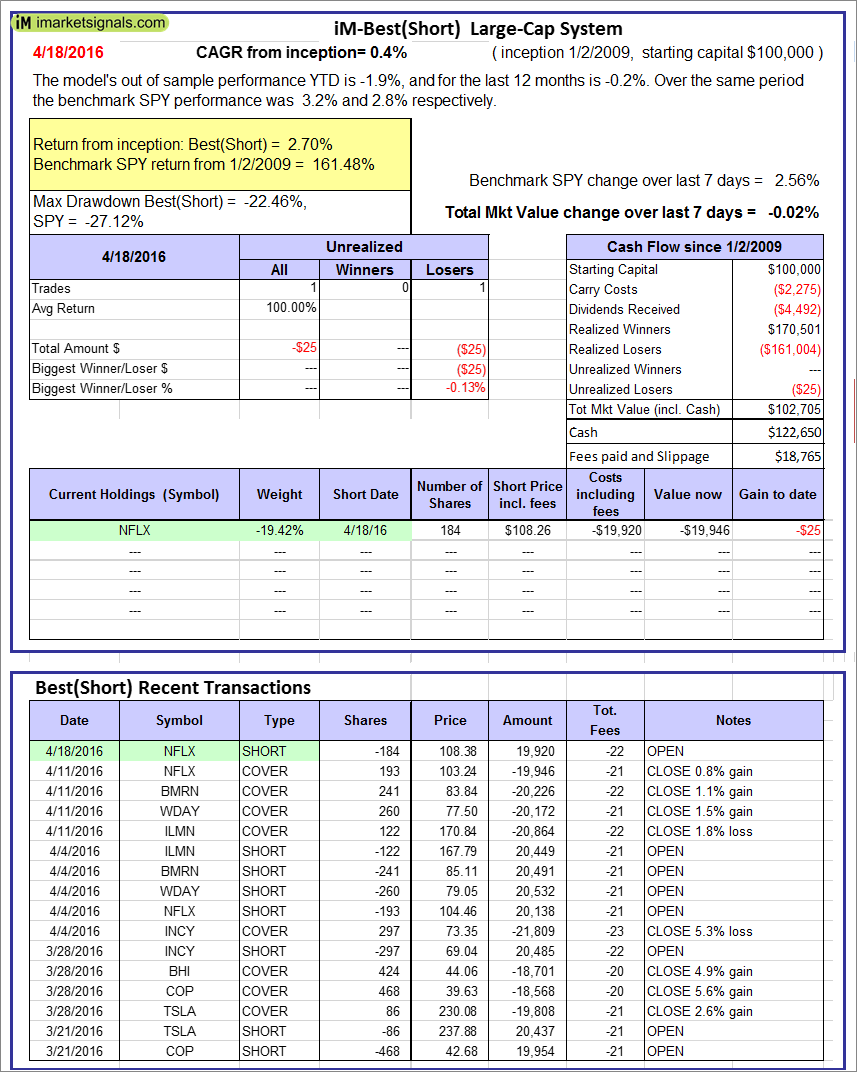 |
iM-Best(Short): The model’s out of sample performance YTD is -1.9%, and for the last 12 months is -0.2%. Over the same period the benchmark SPY performance was 3.2% and 2.8% respectively. Over the previous week the market value of iM-Best(Short) gained -0.02% at a time when SPY gained 2.56%. Over the period 1/2/2009 to 4/18/2016 the starting capital of $100,000 would have grown to $102,705 which includes $122,650 cash and excludes $18,765 spent on fees and slippage. |
iM-Best Reports – 4/18/2016
Posted in pmp SPY-SH
Leave a Reply
You must be logged in to post a comment.