
  |
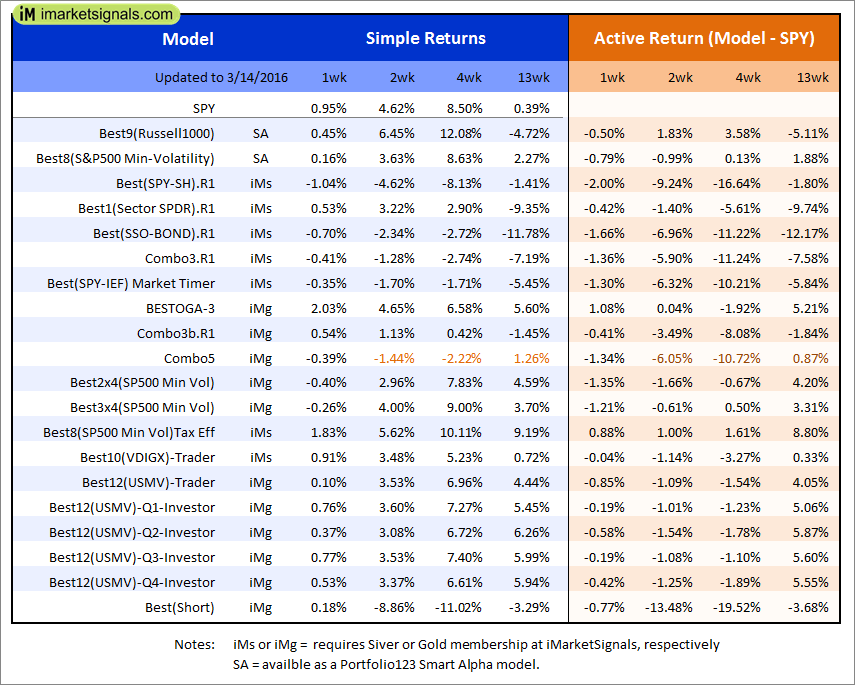
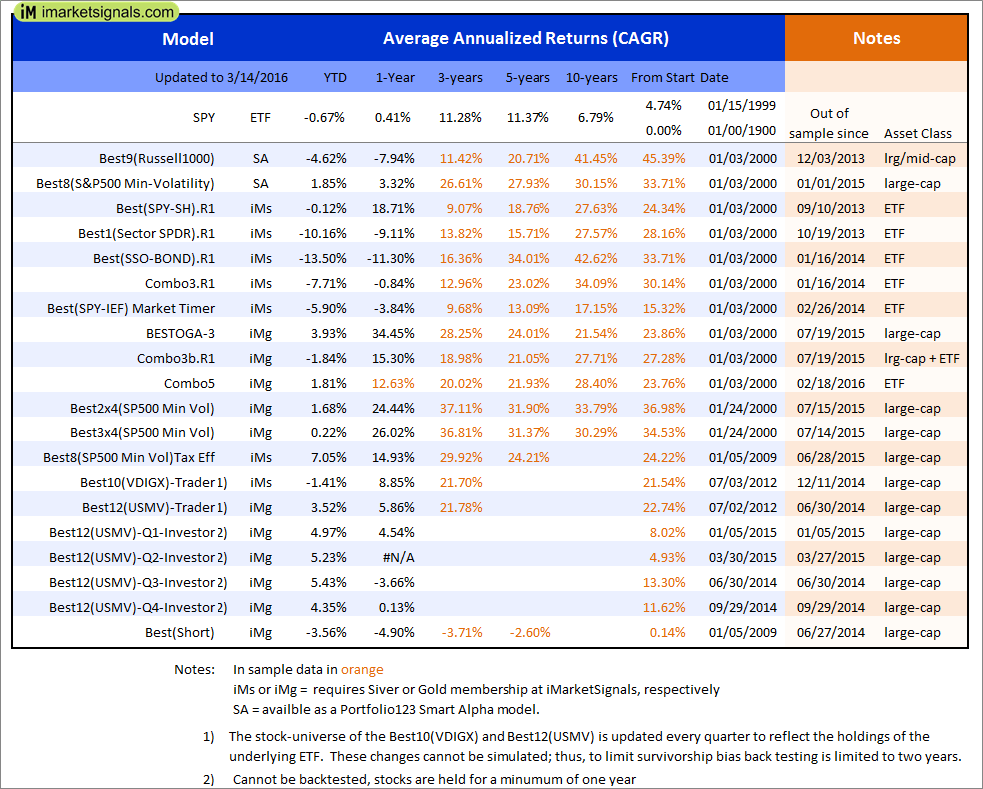
Out of sample performance summary of our models for the past 1, 2, 4 and 13 week periods. The active active return indicates how the models over- or underperformed the benchmark ETF SPY. Also the YTD, and the 1-, 3-, 5- and 10-year annualized returns are shown in the second table |
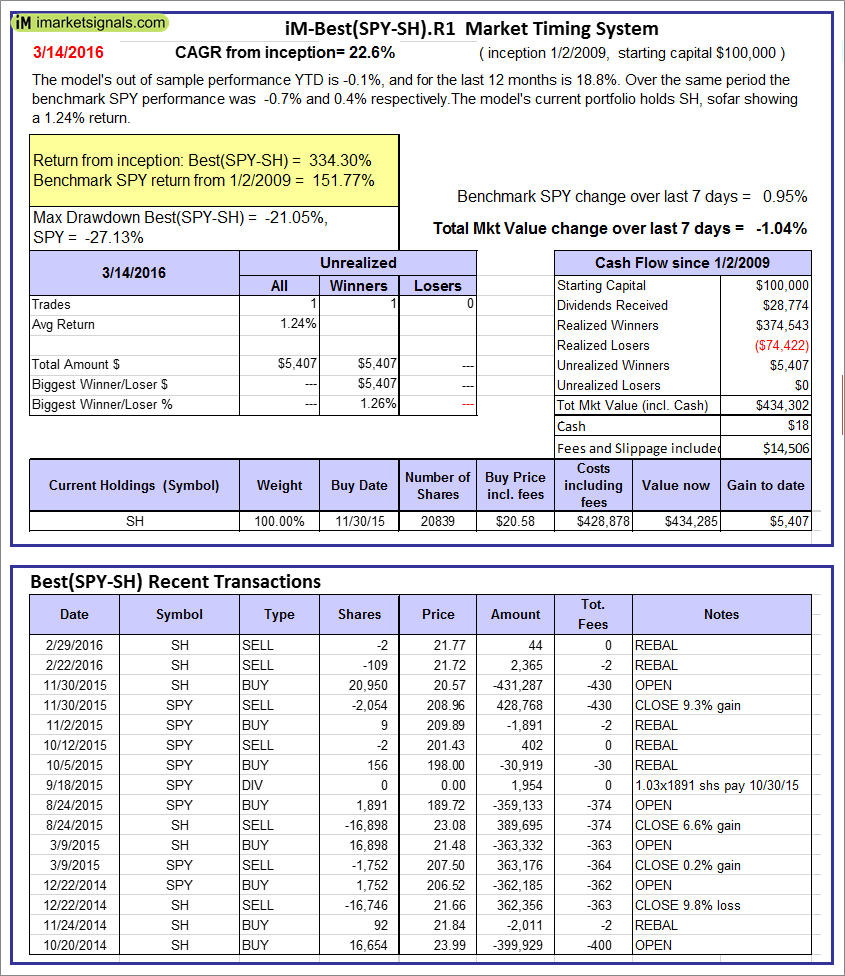 |
iM-Best(SPY-SH).R1: The model’s out of sample performance YTD is -0.1%, and for the last 12 months is 18.8%. Over the same period the benchmark SPY performance was -0.7% and 0.4% respectively. Over the previous week the market value of Best(SPY-SH) gained -1.04% at a time when SPY gained 0.95%. A starting capital of $100,000 at inception on 1/2/2009 would have grown to $434,302 which includes $18 cash and excludes $14,506 spent on fees and slippage. |
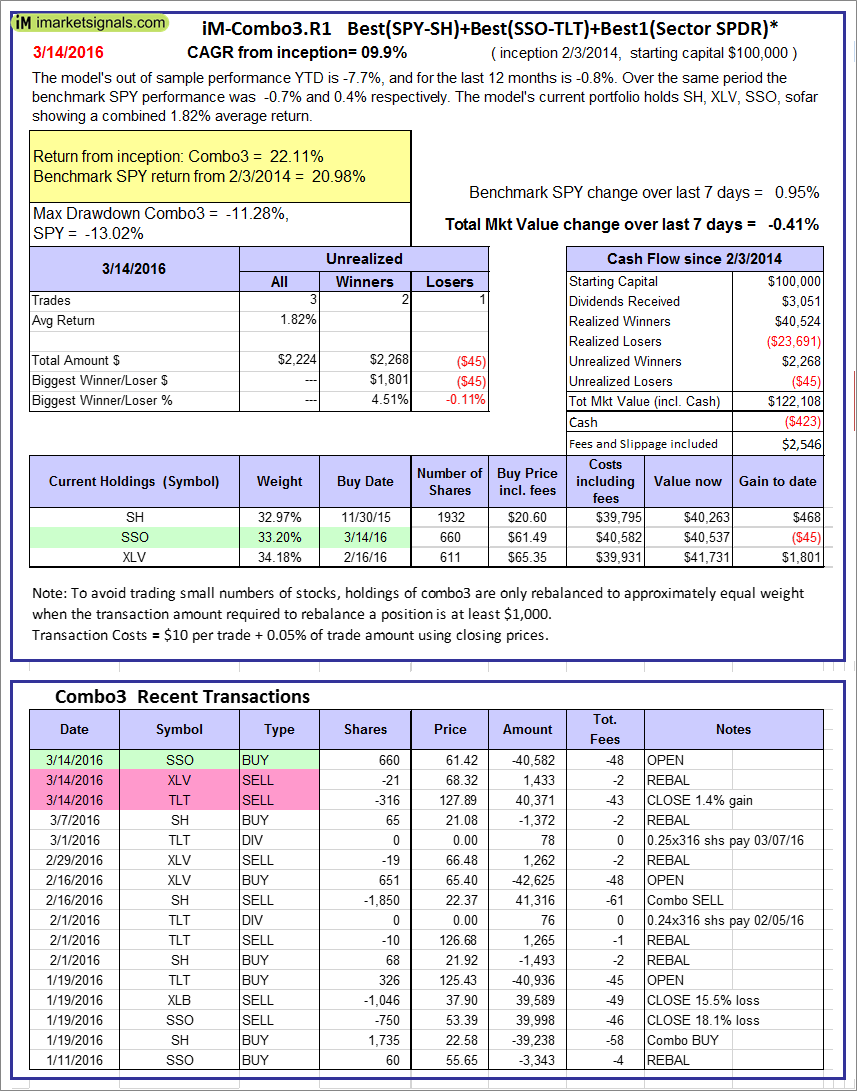 |
iM-Combo3.R1: The model’s out of sample performance YTD is -7.7%, and for the last 12 months is -0.8%. Over the same period the benchmark SPY performance was -0.7% and 0.4% respectively. Over the previous week the market value of iM-Combo-3 gained -0.41% at a time when SPY gained 0.95%[/iM]. A starting capital of $100,000 at inception on 2/3/2014 would have grown to $122,108 which includes -$423 cash and excludes $2,546 spent on fees and slippage. |
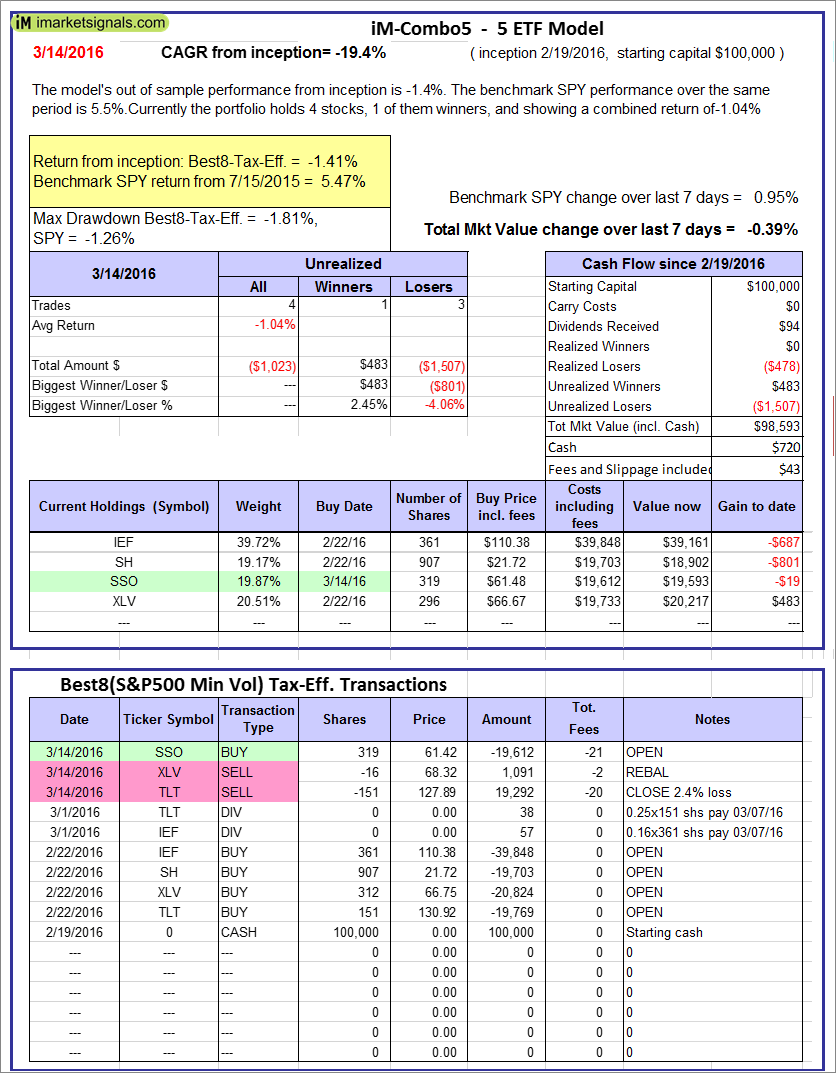 |
iM-Combo5: The model’s out of sample performance from inception is -1.4%. The benchmark SPY performance over the same period is 5.5%. Over the previous week the market value of iM-Combo-3 gained -0.39% at a time when SPY gained 0.95%. A starting capital of $100,000 at inception on 2/22/2016 would have grown to $98,593 which includes $720 cash and excludes $43 spent on fees and slippage. |
 |
The iM-Best8(S&P500 Min Vol)Tax-Efficient The model’s out of sample performance YTD is 7.0%, and for the last 12 months is 14.9%. Over the same period the benchmark SPY performance was -0.7% and 0.4% respectively. Over the previous week the market value of iM-Best8(S&P 500)Tax-Eff. gained 1.83% at a time when SPY gained 0.95%. A starting capital of $100,000 at inception on 1/2/2009 would have grown to $476,745 which includes $873 cash and excludes $6,122 spent on fees and slippage. |
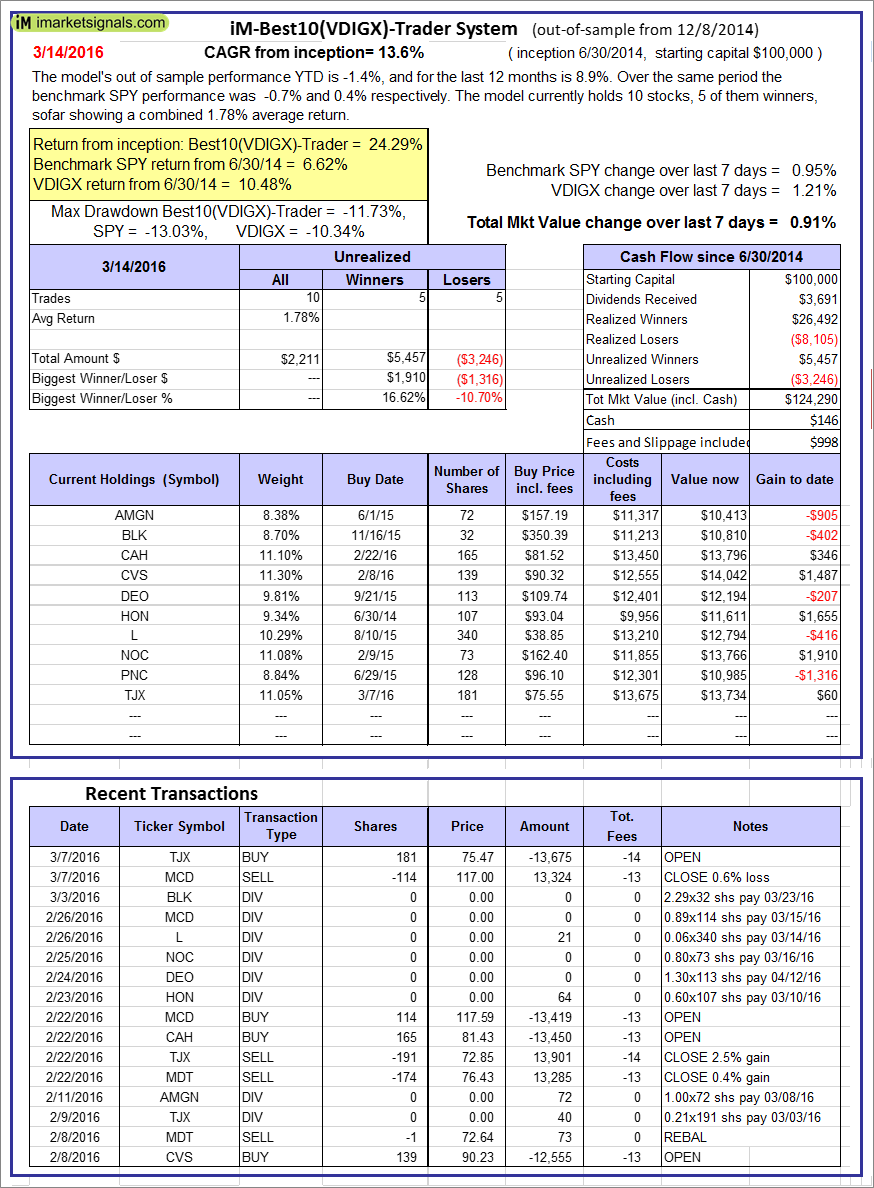 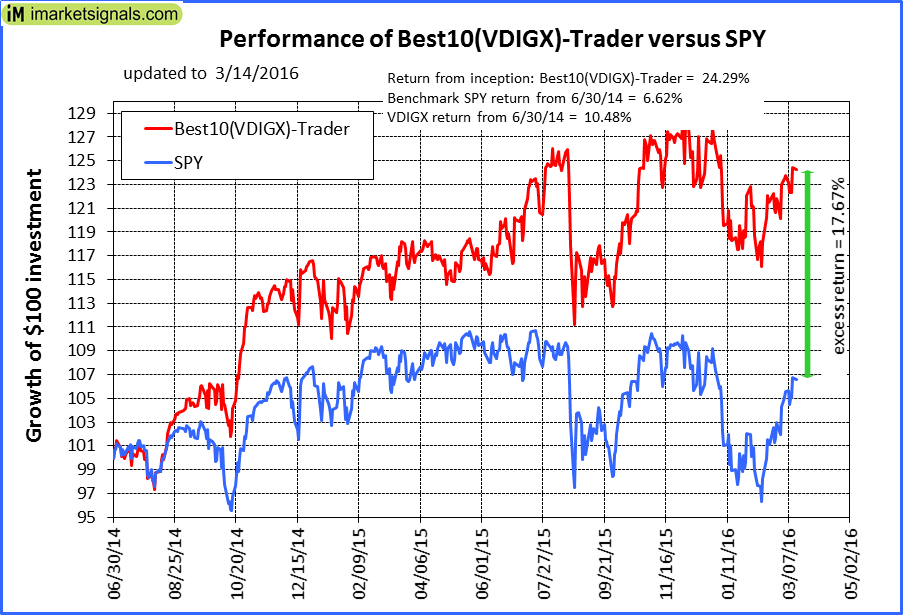 |
iM-Best10(VDIGX)-Trader: The model’s out of sample performance YTD is -1.4%, and for the last 12 months is 8.9%. Over the same period the benchmark SPY performance was -0.7% and 0.4% respectively. Since inception, on 7/1/2014, the model gained 24.29% while the benchmark SPY gained 6.62% and the ETF VDIGX gained 10.48% over the same period. Over the previous week the market value of iM-Best10(VDIGX) gained 0.91% at a time when SPY gained 0.95%. A starting capital of $100,000 at inception on 7/1/2014 would have grown to $124,290 which includes $146 cash and excludes $998 spent on fees and slippage. |
 |
iM-BESTOGA-3: The model’s out of sample performance YTD is 3.9%, and for the last 12 months is 34.4%. Over the same period the benchmark SPY performance was -0.7% and 0.4% respectively. Over the previous week the market value of iM-BESTOGA-3 gained 2.03% at a time when SPY gained 0.95%. A starting capital of $100,000 at inception on 2/3/2014 would have grown to $190,973 which includes $16,053 cash and excludes $767 spent on fees and slippage. |
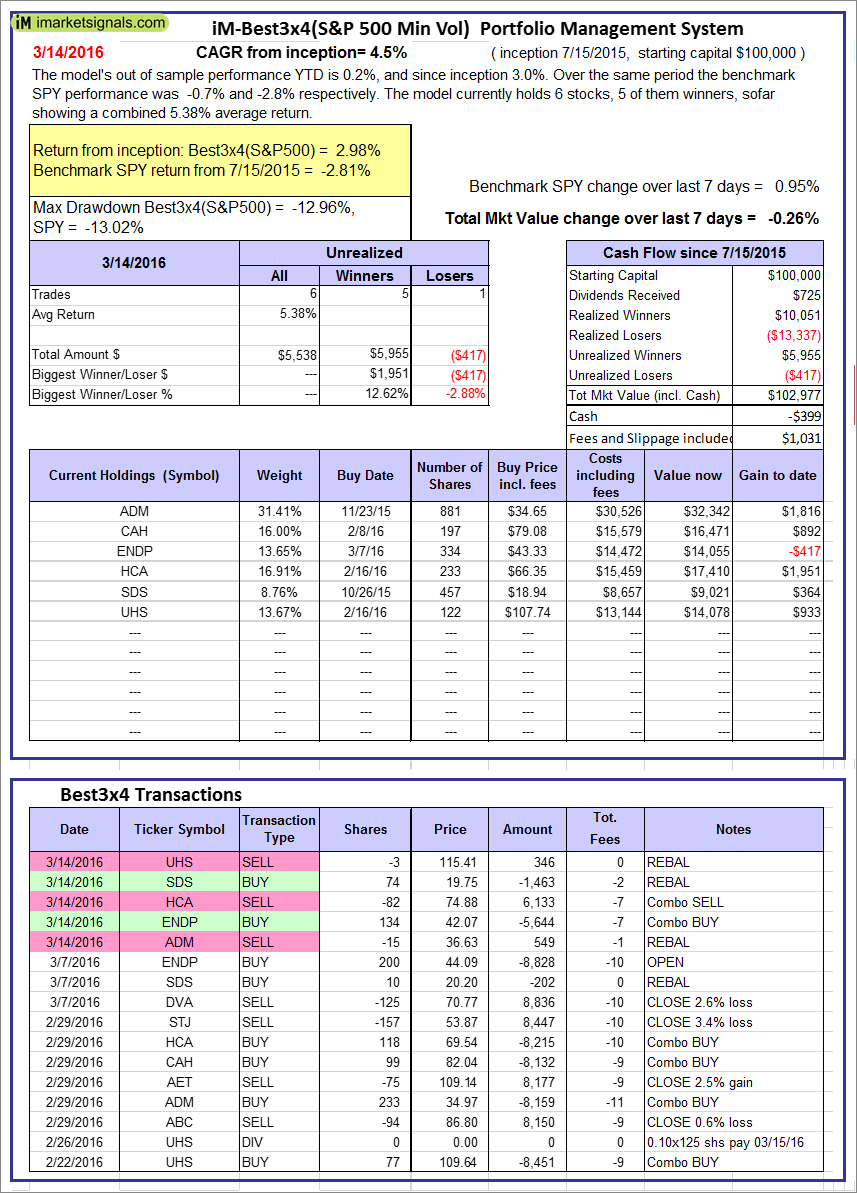 |
iM-Best3x4(S&P 500 Min Vol): The model’s out of sample performance YTD is 0.2%, and since inception 3.0%. Over the same period the benchmark SPY performance was -0.7% and -2.8% respectively. Over the previous week the market value of iM-Best3x4 gained -0.26% at a time when SPY gained 0.95%. A starting capital of $100,000 at inception on 7/15/2015 would have grown to $102,977 which includes -$399 cash and excludes $1,031 spent on fees and slippage. |
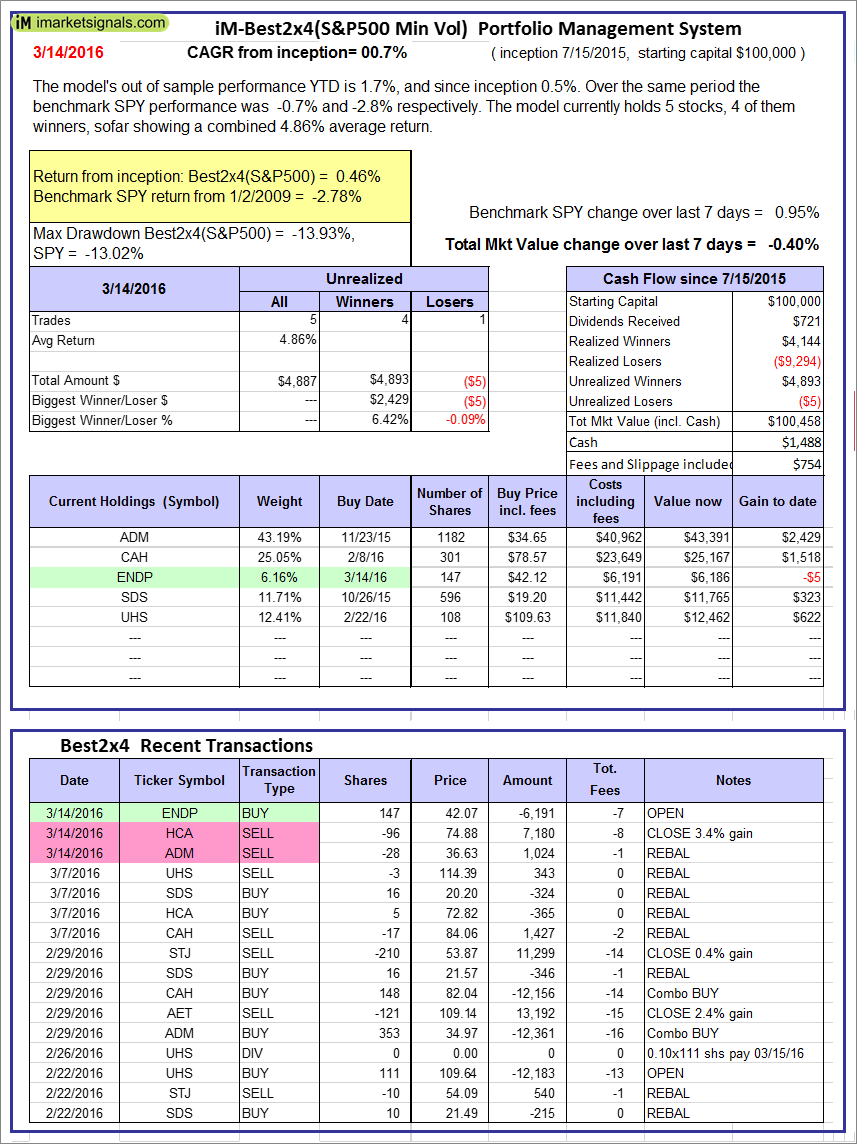 |
iM-Best2x4(S&P 500 Min Vol): The model’s out of sample performance YTD is 1.7%, and since inception 0.5%. Over the same period the benchmark SPY performance was -0.7% and -2.8% respectively. Over the previous week the market value of iM-Best2x4 gained -0.40% at a time when SPY gained 0.95%. A starting capital of $100,000 at inception on 7/16/2015 would have grown to $100,458 which includes $1,488 cash and excludes $754 spent on fees and slippage. |
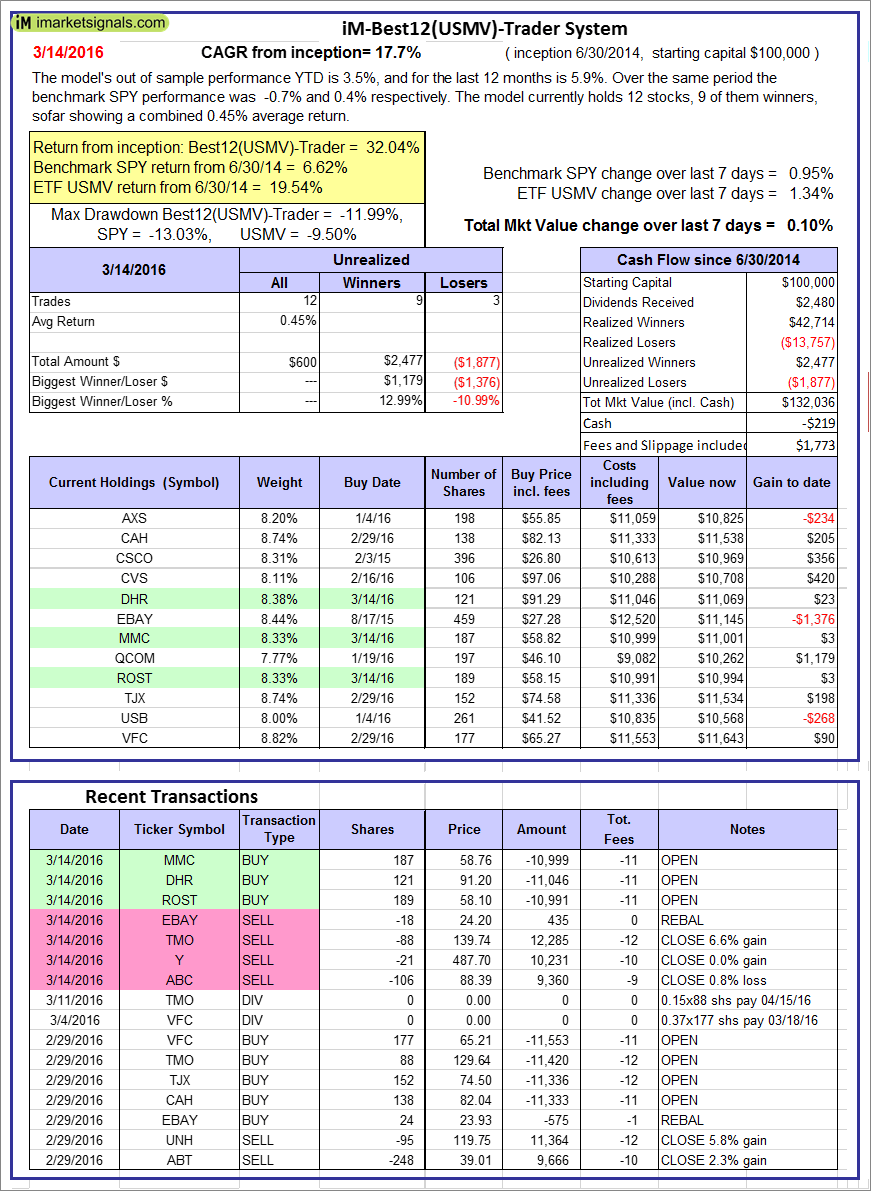 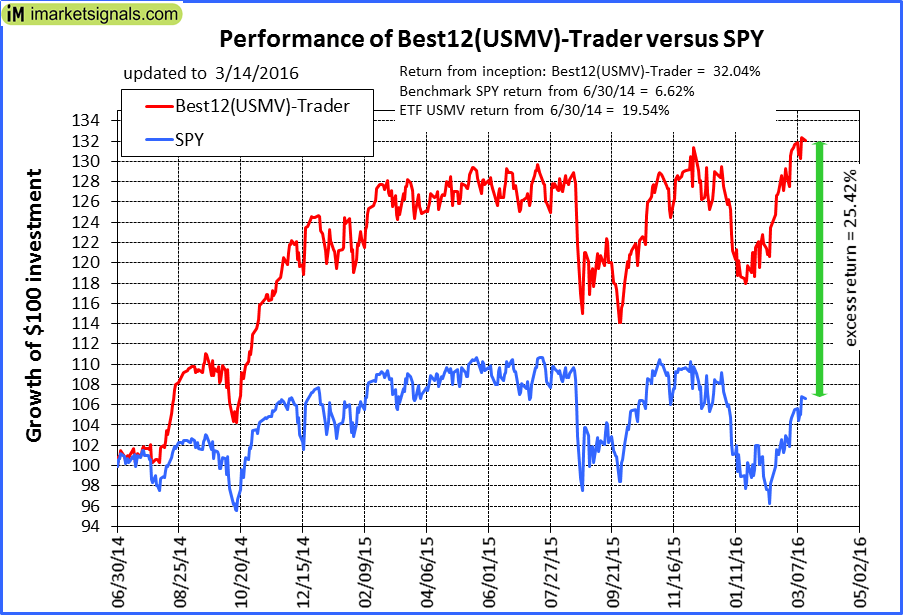 |
iM-Best12(USMV)-Trader: The model’s out of sample performance YTD is 3.5%, and for the last 12 months is 5.9%. Over the same period the benchmark SPY performance was -0.7% and 0.4% respectively. Since inception, on 7/1/2014, the model gained 32.04% while the benchmark SPY gained 6.62% and the ETF USMV gained 19.54% over the same period. Over the previous week the market value of iM-Best12(USMV)-Trader gained 0.10% at a time when SPY gained 0.95%. A starting capital of $100,000 at inception on 7/1/2014 would have grown to $132,036 which includes -$219 cash and excludes $1,773 spent on fees and slippage. |
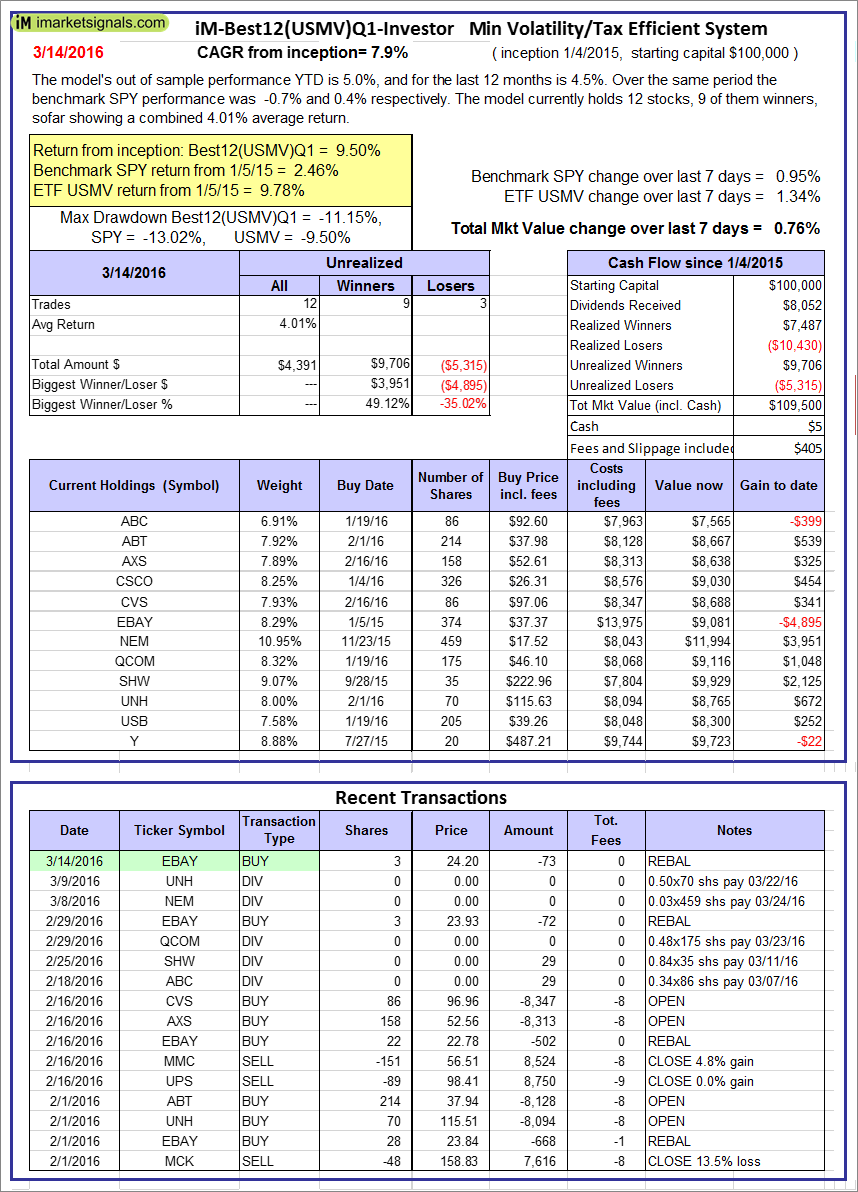 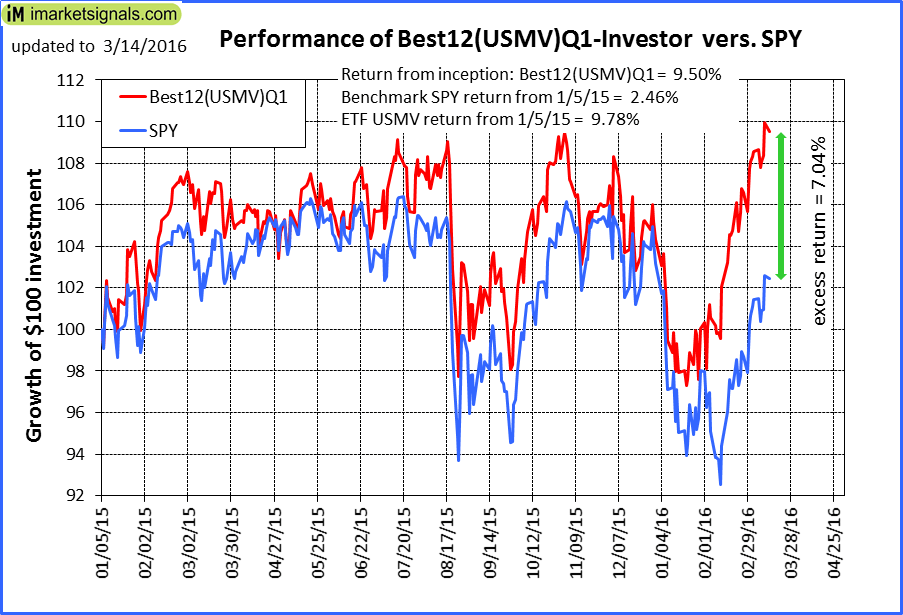 |
iM-Best12(USMV)Q1-Investor: The model’s out of sample performance YTD is 5.0%, and for the last 12 months is 4.5%. Over the same period the benchmark SPY performance was -0.7% and 0.4% respectively. Since inception, on 1/5/2015, the model gained 9.50% while the benchmark SPY gained 2.46% and the ETF USMV gained 9.78% over the same period. Over the previous week the market value of iM-Best12(USMV)Q1 gained 0.76% at a time when SPY gained 0.95%. A starting capital of $100,000 at inception on 1/5/2015 would have grown to $109,500 which includes $5 cash and excludes $405 spent on fees and slippage. |
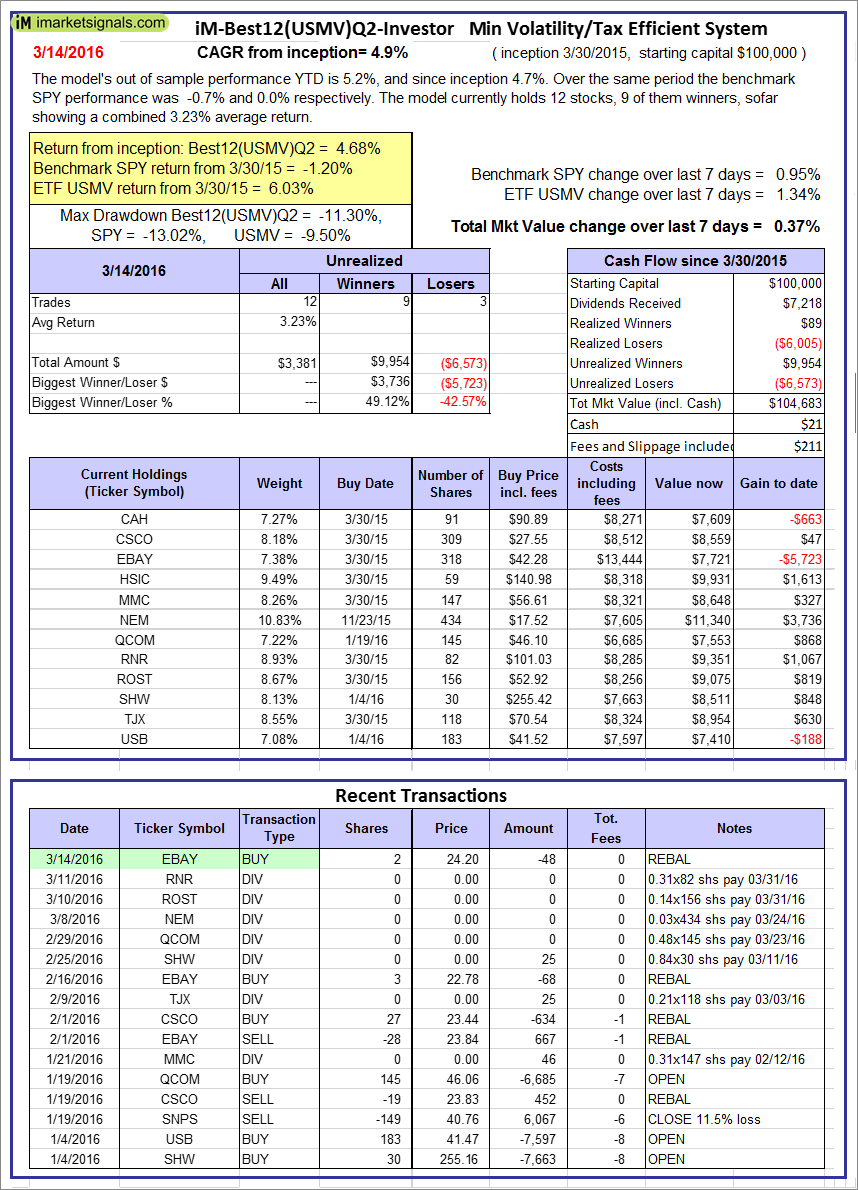 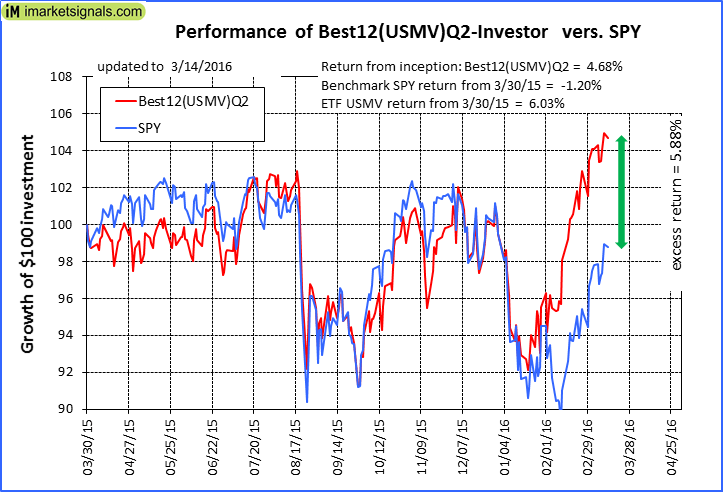 |
iM-Best12(USMV)Q2-Investor: The model’s out of sample performance YTD is 5.2%, and since inception 4.7%. Over the same period the benchmark SPY performance was -0.7% and 0.0% respectively. Since inception, on 3/31/2015, the model gained 4.68% while the benchmark SPY gained -1.20% and the ETF USMV gained 6.03% over the same period. Over the previous week the market value of iM-Best12(USMV)Q2 gained 0.37% at a time when SPY gained 0.95%. A starting capital of $100,000 at inception on 3/31/2015 would have grown to $104,683 which includes $21 cash and excludes $211 spent on fees and slippage. |
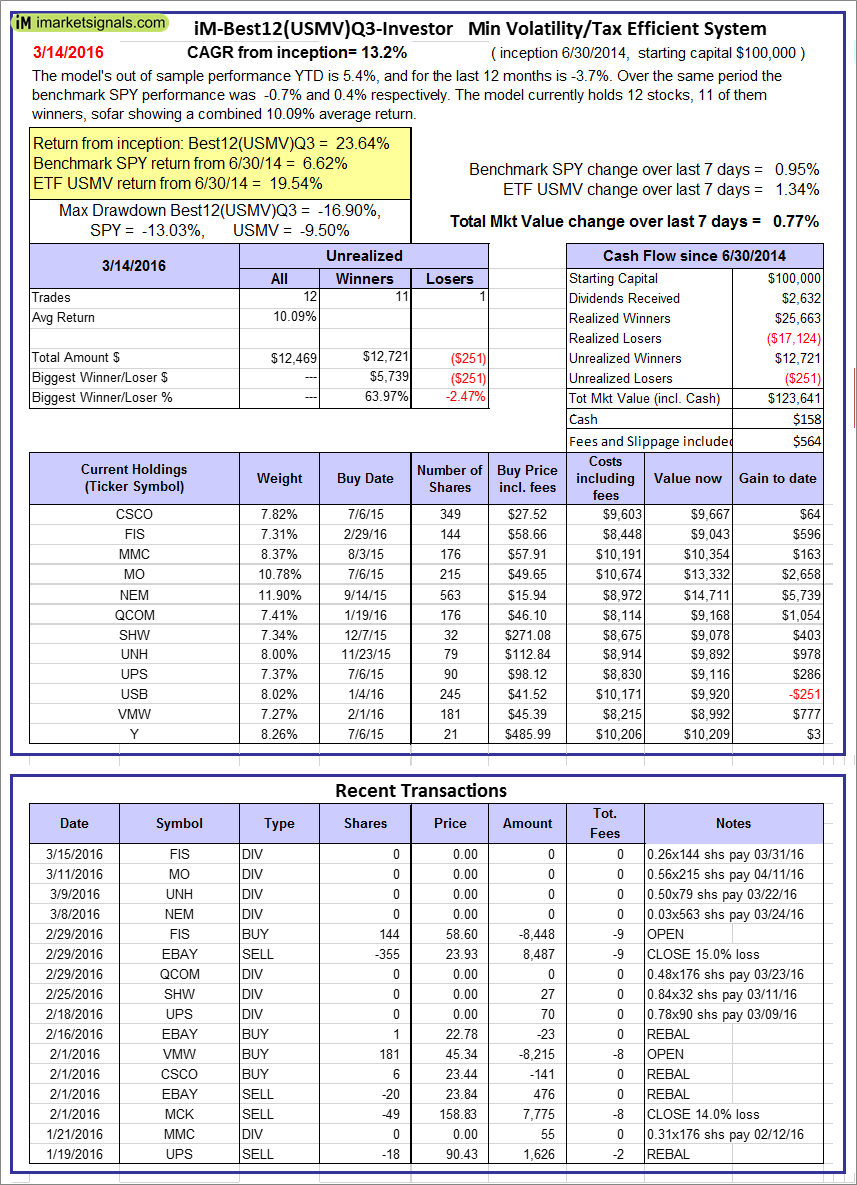 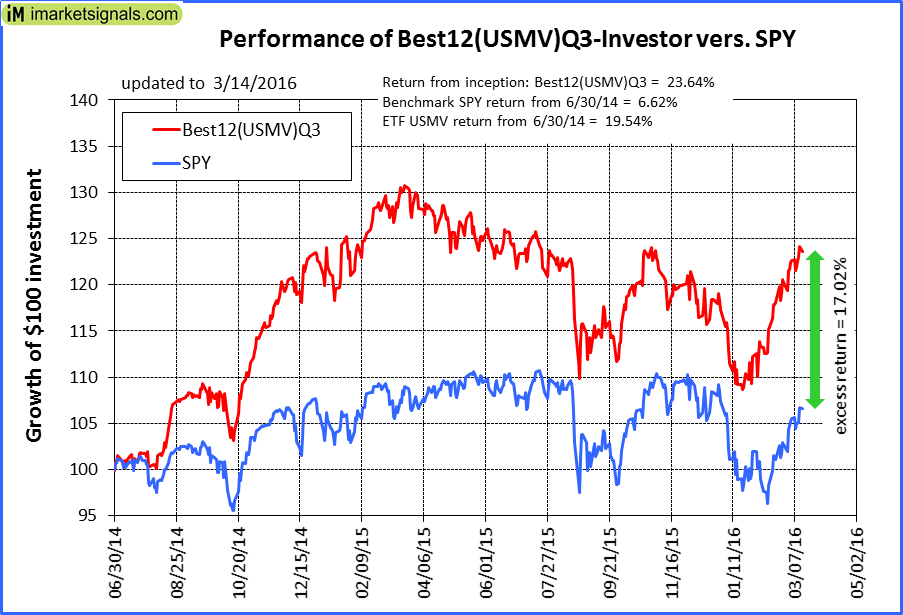 |
iM-Best12(USMV)Q3-Investor: The model’s out of sample performance YTD is 5.4%, and for the last 12 months is -3.7%. Over the same period the benchmark SPY performance was -0.7% and 0.4% respectively. Since inception, on 7/1/2014, the model gained 23.64% while the benchmark SPY gained 6.62% and the ETF USMV gained 19.54% over the same period. Over the previous week the market value of iM-Best12(USMV)Q3 gained 0.77% at a time when SPY gained 0.95%. A starting capital of $100,000 at inception on 7/1/2014 would have grown to $123,641 which includes $158 cash and excludes $564 spent on fees and slippage. |
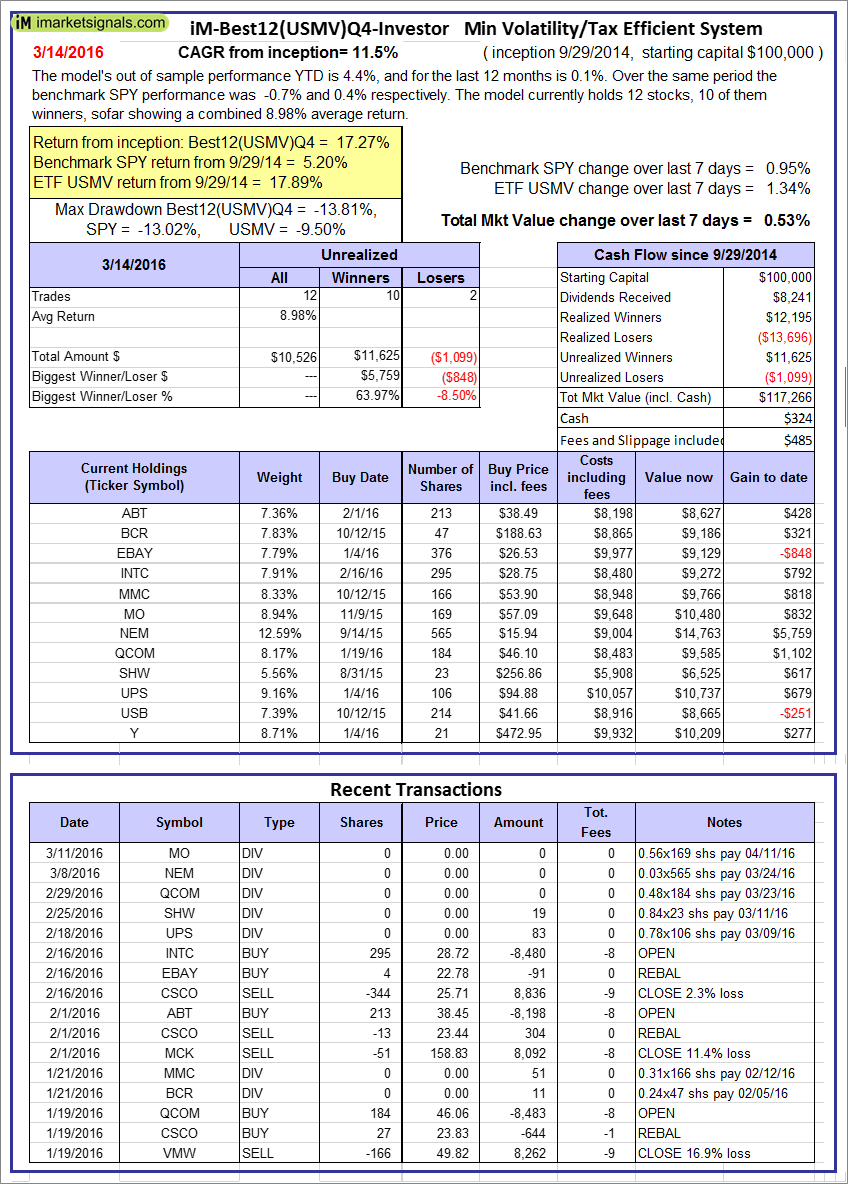 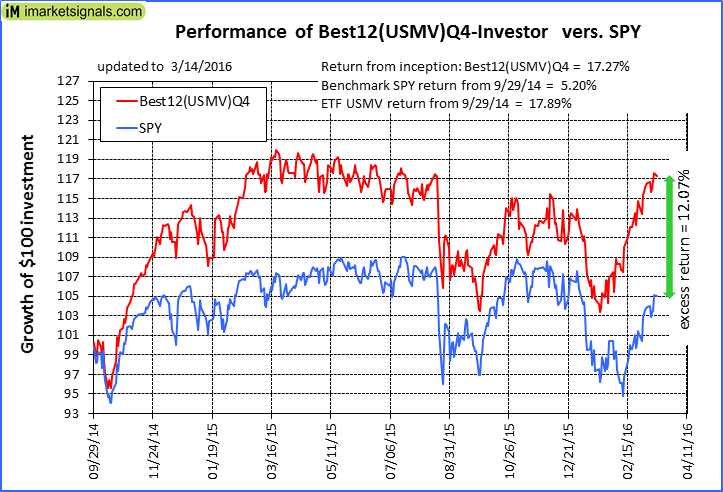 |
iM-Best12(USMV)Q4-Investor: Since inception, on 9/30/2014, the model gained 17.27% while the benchmark SPY gained 5.20% and the ETF USMV gained 17.89% over the same period. Over the previous week the market value of iM-Best12(USMV)Q4 gained 0.53% at a time when SPY gained 0.95%. A starting capital of $100,000 at inception on 9/30/2014 would have grown to $117,266 which includes $324 cash and excludes $485 spent on fees and slippage. |
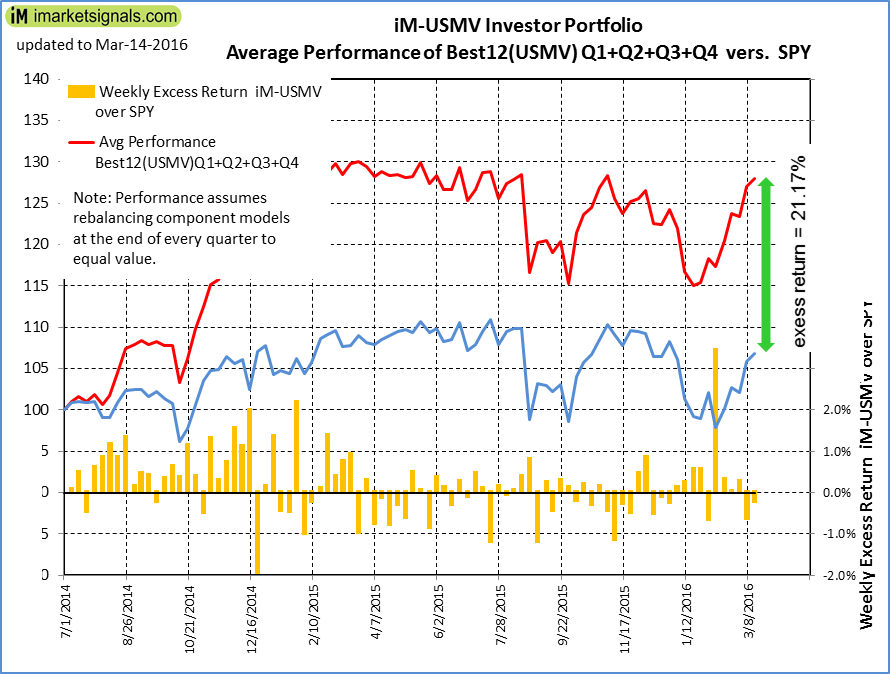 |
Average Performance of iM-Best12(USMV)Q1+Q2+Q3+Q4-Investor resulted in an excess return of 21.17% over SPY. (see iM-USMV Investor Portfolio) |
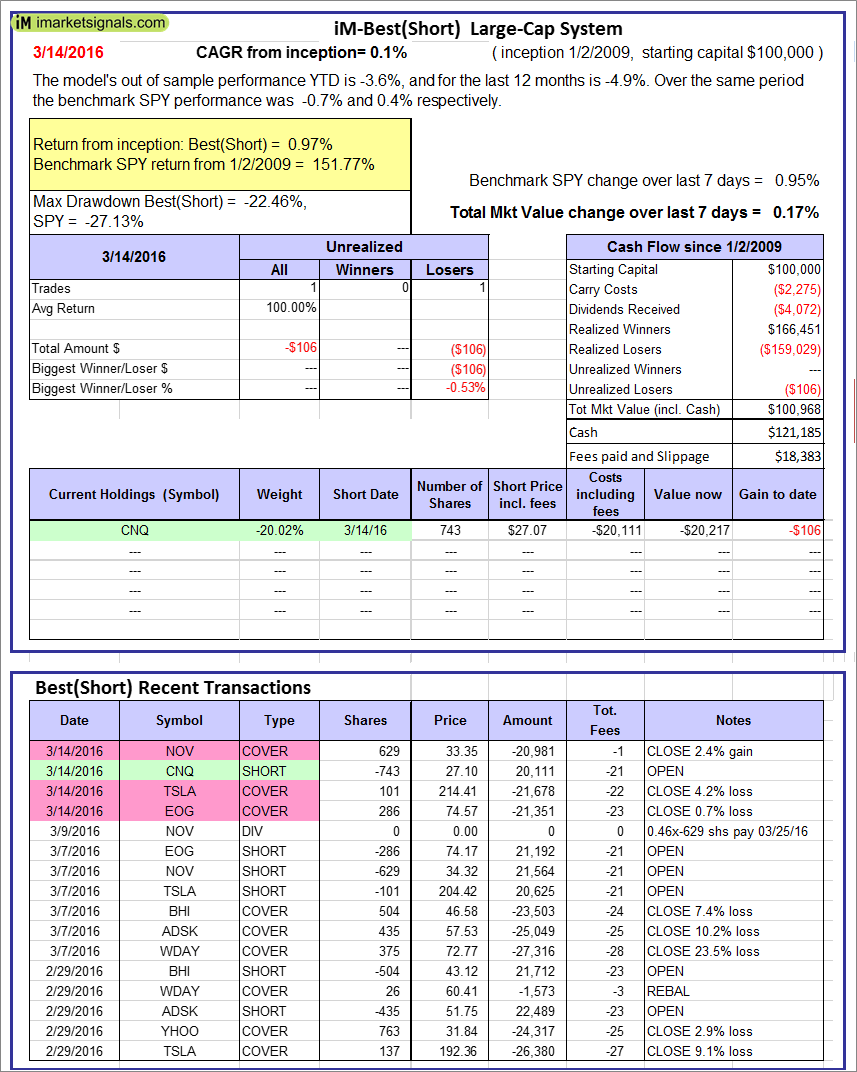 |
iM-Best(Short): The model’s out of sample performance YTD is -3.6%, and for the last 12 months is -4.9%. Over the same period the benchmark SPY performance was -0.7% and 0.4% respectively. Over the previous week the market value of iM-Best(Short) gained 0.17% at a time when SPY gained 0.95%. Over the period 1/2/2009 to 3/14/2016 the starting capital of $100,000 would have grown to $100,968 which includes $121,185 cash and excludes $18,383 spent on fees and slippage. |
iM-Best Reports – 3/14/2016
Posted in pmp SPY-SH
Leave a Reply
You must be logged in to post a comment.