
  |
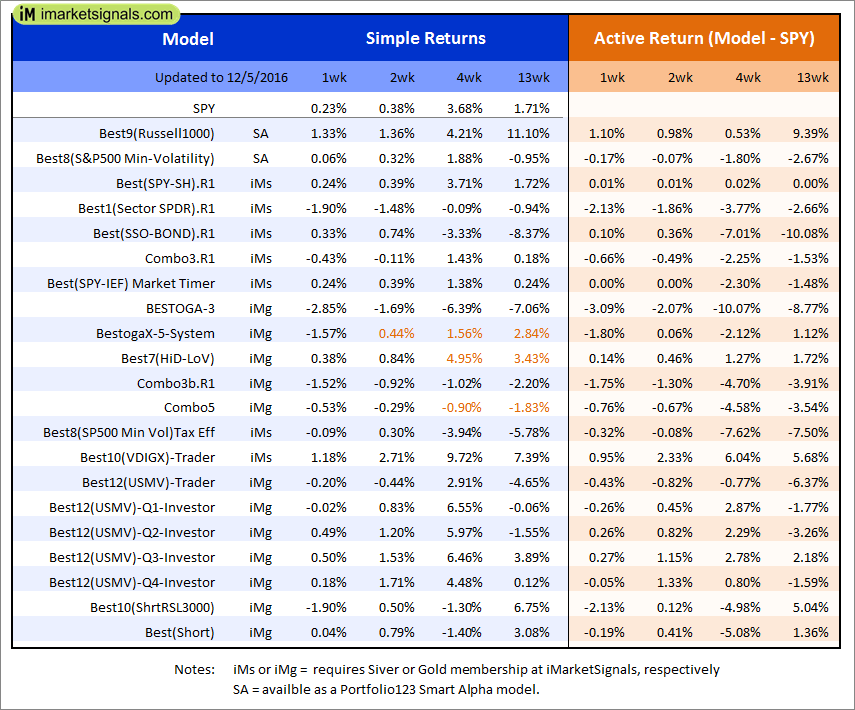
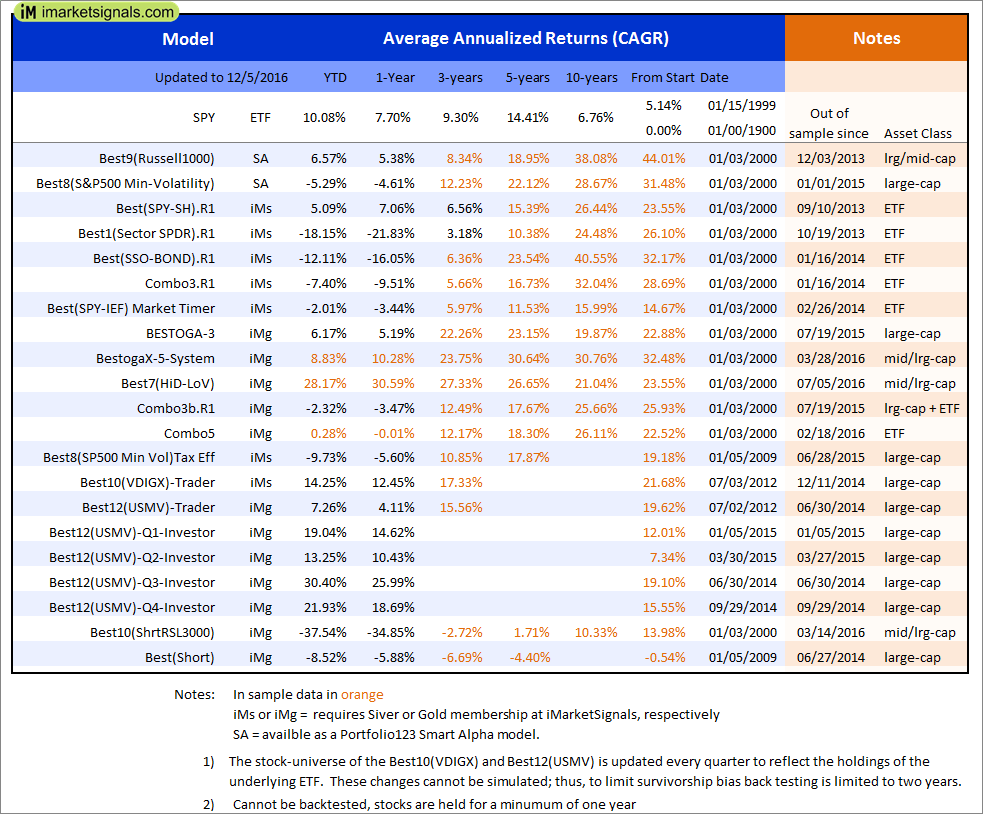
Out of sample performance summary of our models for the past 1, 2, 4 and 13 week periods. The active active return indicates how the models over- or underperformed the benchmark ETF SPY. Also the YTD, and the 1-, 3-, 5- and 10-year annualized returns are shown in the second table |
 |
iM-Best(SPY-SH).R1: The model’s out of sample performance YTD is 5.1%, and for the last 12 months is 7.1%. Over the same period the benchmark SPY performance was 10.1% and 7.7% respectively. Over the previous week the market value of Best(SPY-SH) gained 0.24% at a time when SPY gained 0.24%. A starting capital of $100,000 at inception on 1/2/2009 would have grown to $456,960 which includes -$2,720 cash and excludes $15,358 spent on fees and slippage. |
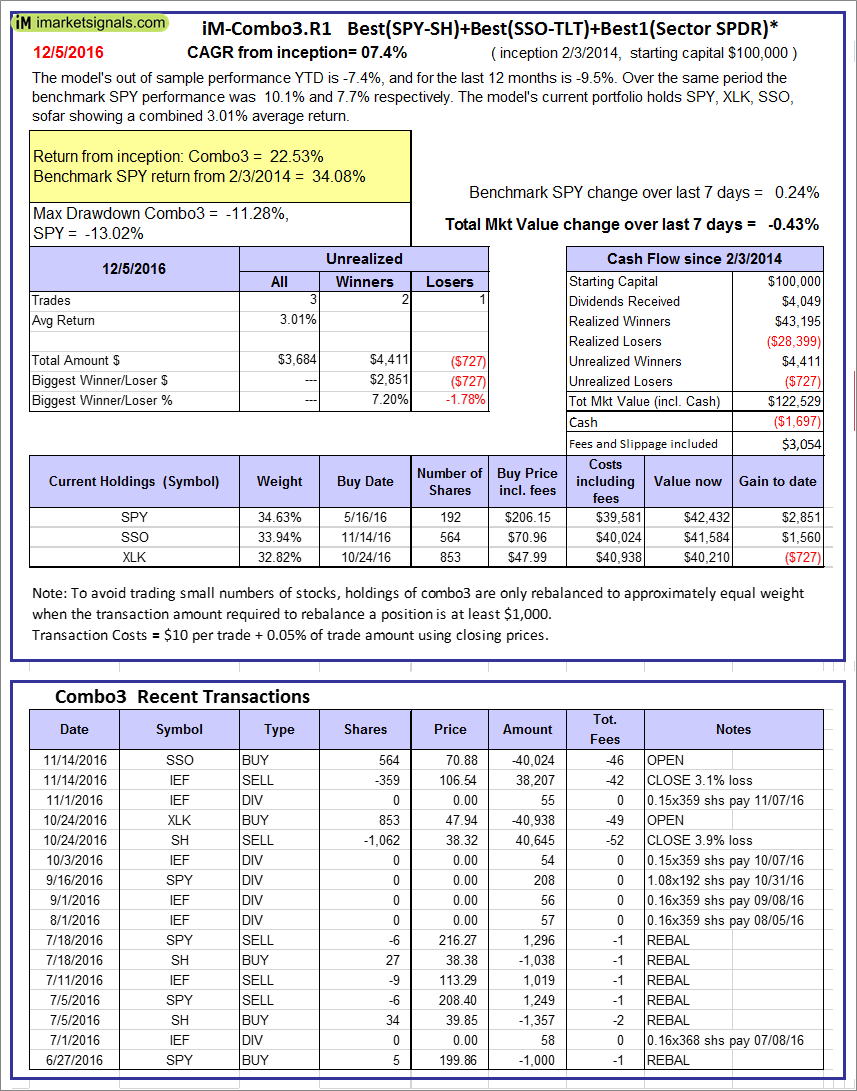 |
iM-Combo3.R1: The model’s out of sample performance YTD is -7.4%, and for the last 12 months is -9.5%. Over the same period the benchmark SPY performance was 10.1% and 7.7% respectively. Over the previous week the market value of iM-Combo3.R1 gained -0.43% at a time when SPY gained 0.24%. A starting capital of $100,000 at inception on 2/3/2014 would have grown to $122,529 which includes -$1,697 cash and excludes $3,054 spent on fees and slippage. |
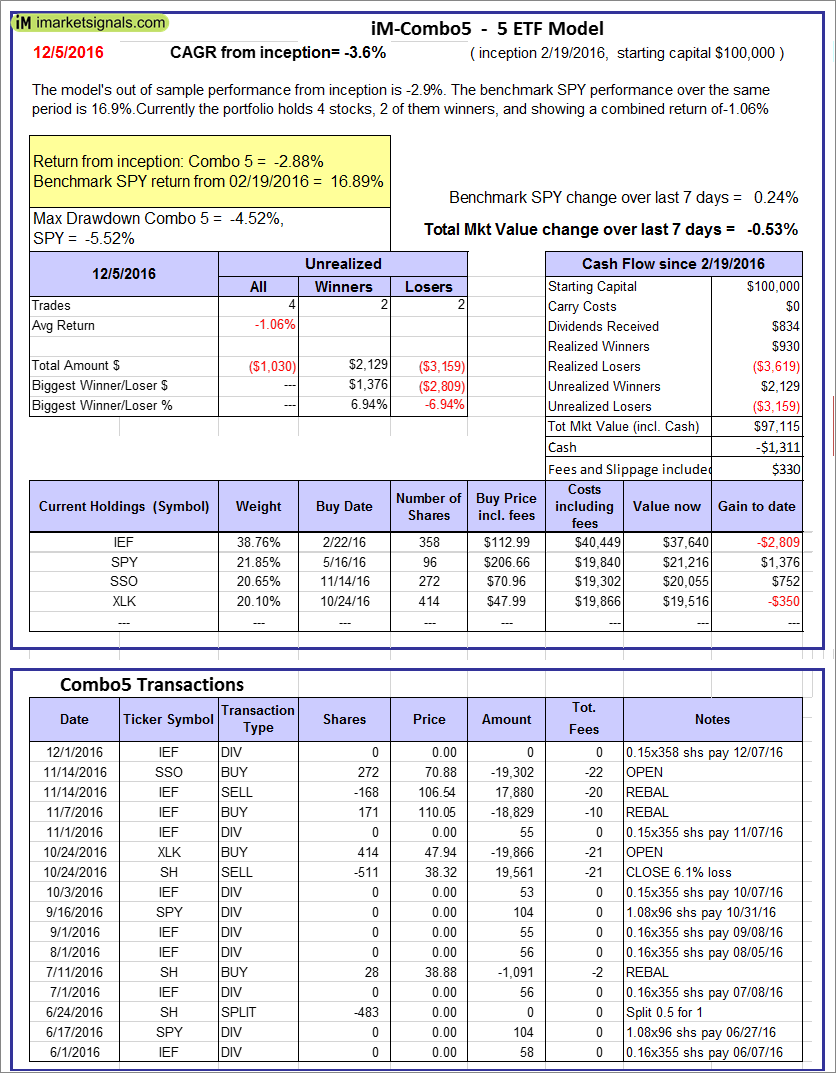 |
iM-Combo5: The model’s out of sample performance from inception is -2.9%. The benchmark SPY performance over the same period is 16.9%. Over the previous week the market value of iM-Combo5 gained -0.53% at a time when SPY gained 0.24%. A starting capital of $100,000 at inception on 2/22/2016 would have grown to $97,115 which includes -$1,311 cash and excludes $330 spent on fees and slippage. |
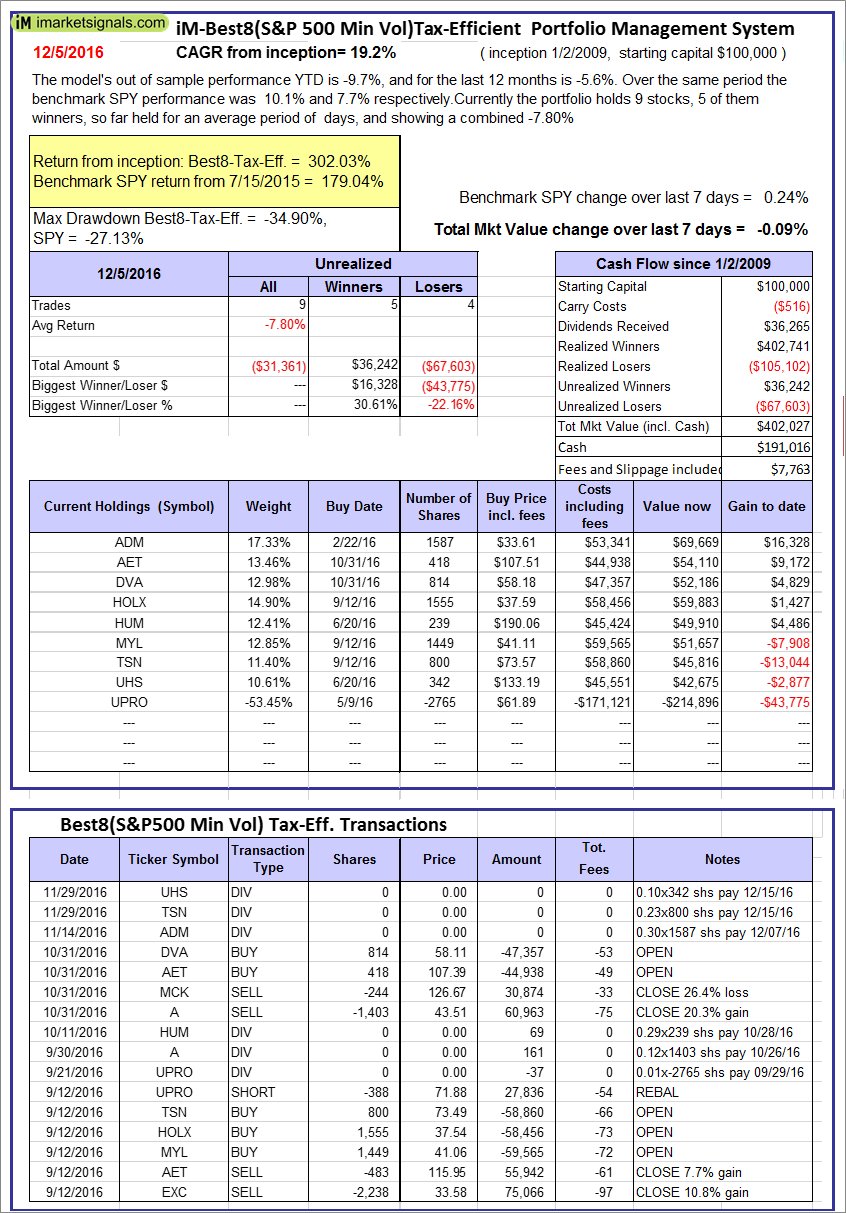 |
The iM-Best8(S&P500 Min Vol)Tax-Efficient The model’s out of sample performance YTD is -9.7%, and for the last 12 months is -5.6%. Over the same period the benchmark SPY performance was 10.1% and 7.7% respectively. Over the previous week the market value of iM-Best8(S&P 500)Tax-Eff. gained -0.09% at a time when SPY gained 0.24%. A starting capital of $100,000 at inception on 1/2/2009 would have grown to $402,027 which includes $191,016 cash and excludes $7,763 spent on fees and slippage. |
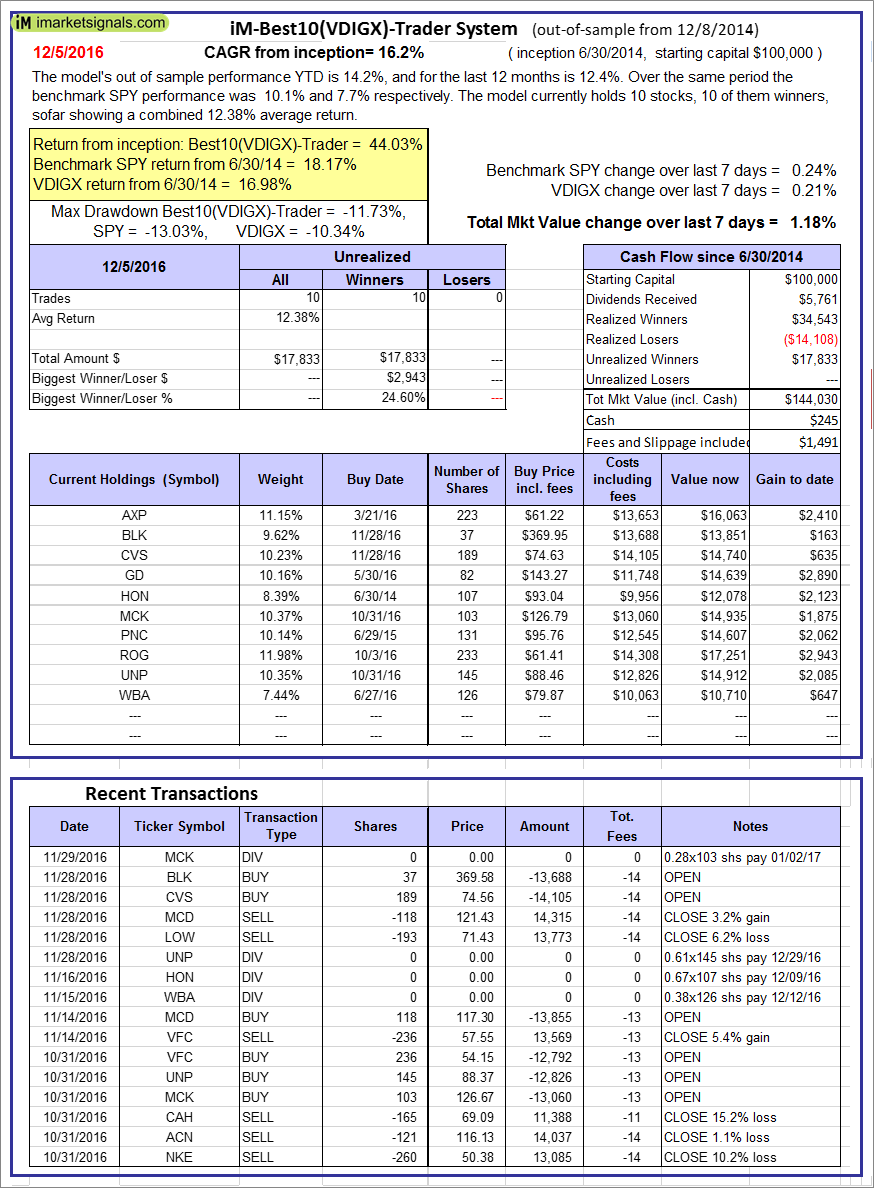 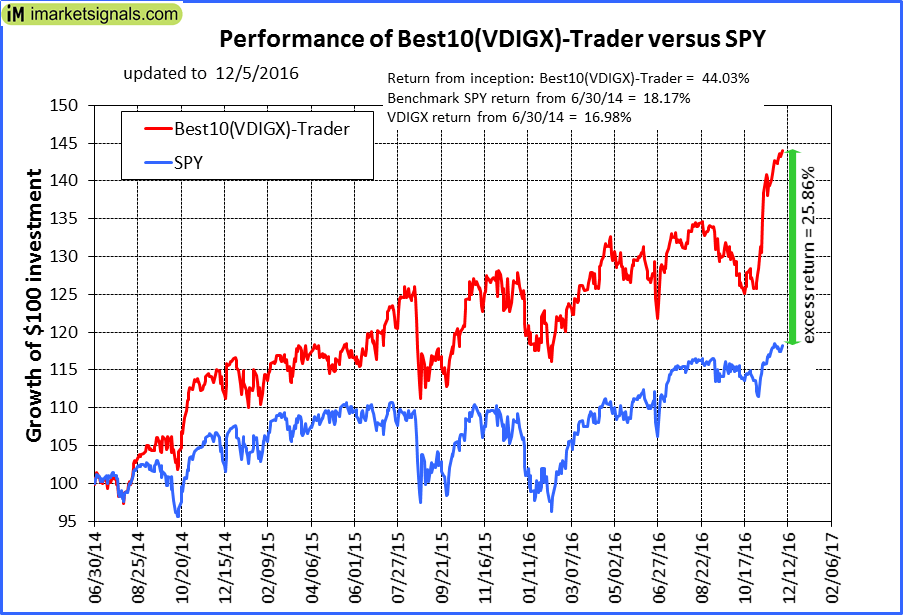 |
iM-Best10(VDIGX)-Trader: The model’s out of sample performance YTD is 14.2%, and for the last 12 months is 12.4%. Over the same period the benchmark SPY performance was 10.1% and 7.7% respectively. Since inception, on 7/1/2014, the model gained 44.03% while the benchmark SPY gained 18.17% and the ETF VDIGX gained 16.98% over the same period. Over the previous week the market value of iM-Best10(VDIGX) gained 1.18% at a time when SPY gained 0.24%. A starting capital of $100,000 at inception on 7/1/2014 would have grown to $144,030 which includes $245 cash and excludes $1,491 spent on fees and slippage. |
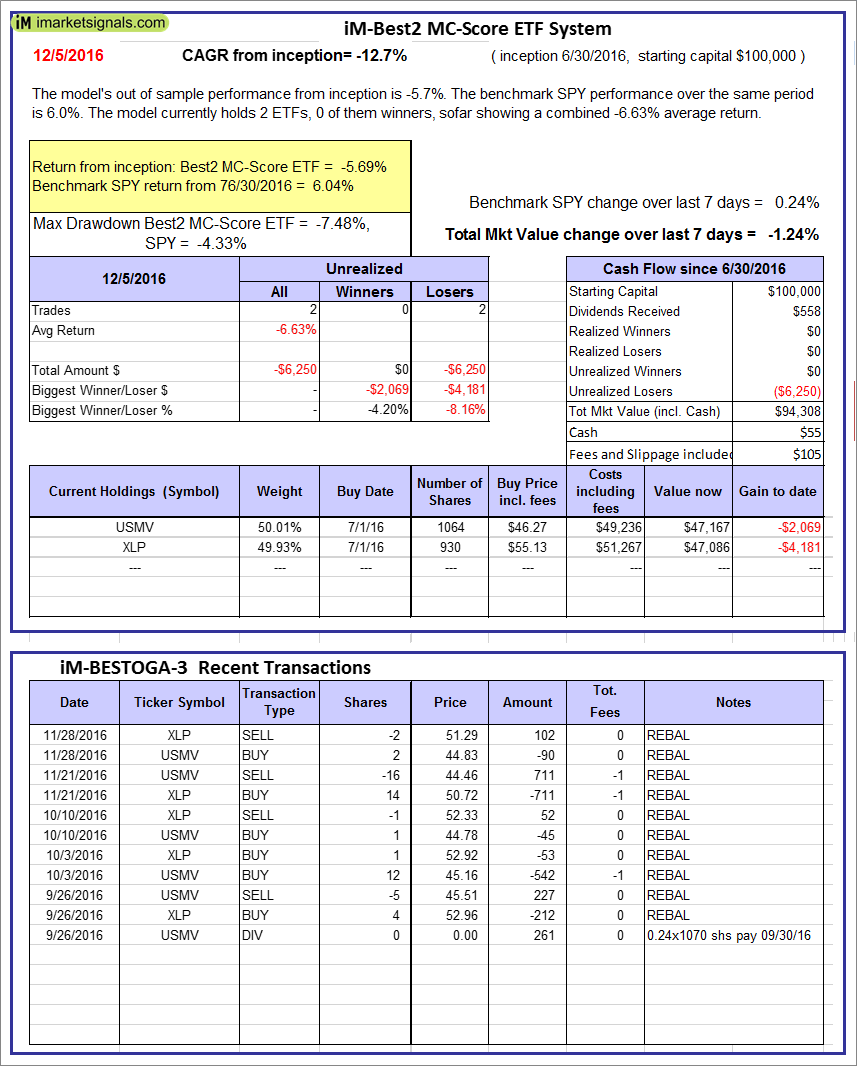 |
iM-Best2 MC-Score ETF System: The model’s out of sample performance from inception is -5.7%. The benchmark SPY performance over the same period is 6.0%. Over the previous week the market value of iM-BESTOGA-3 gained -1.24% at a time when SPY gained 0.24%. A starting capital of $100,000 at inception on 2/3/2014 would have grown to $55 which includes $105 cash and excludes Gain to date spent on fees and slippage. |
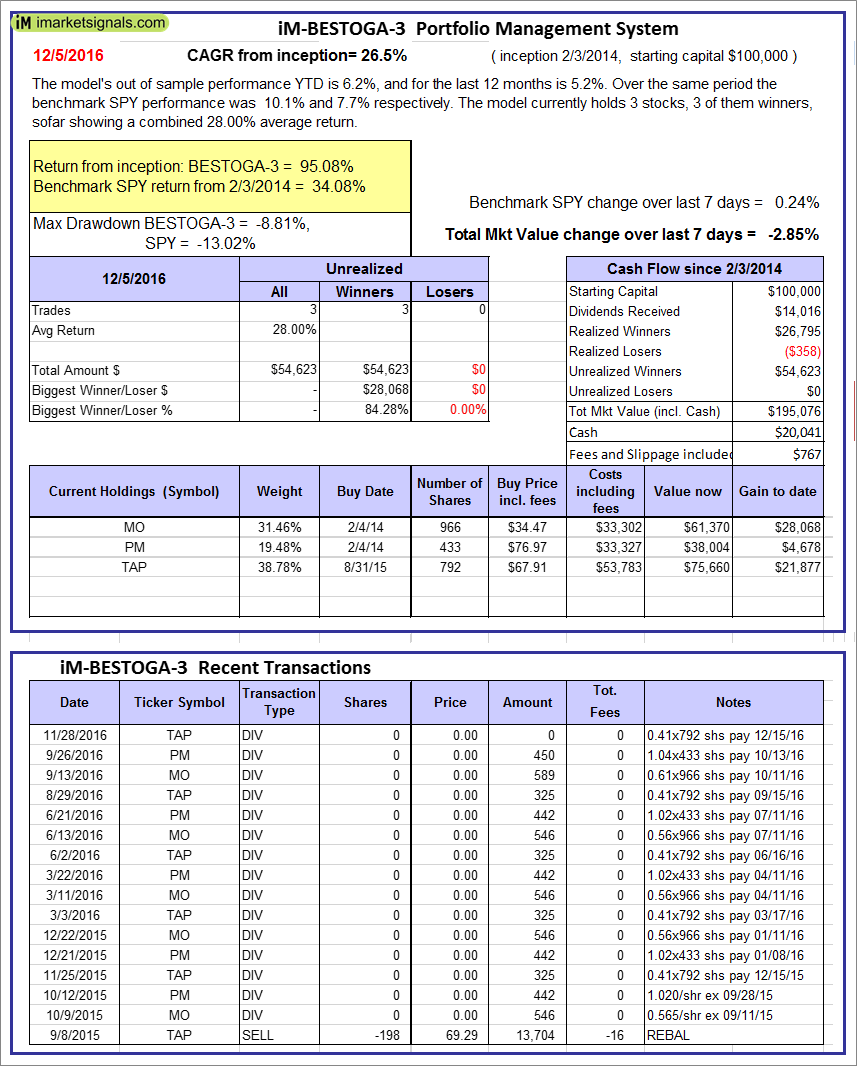 |
iM-BESTOGA-3: The model’s out of sample performance YTD is 6.2%, and for the last 12 months is 5.2%. Over the same period the benchmark SPY performance was 10.1% and 7.7% respectively. Over the previous week the market value of iM-BESTOGA-3 gained -2.85% at a time when SPY gained 0.24%. A starting capital of $100,000 at inception on 2/3/2014 would have grown to $195,076 which includes $20,041 cash and excludes $767 spent on fees and slippage. |
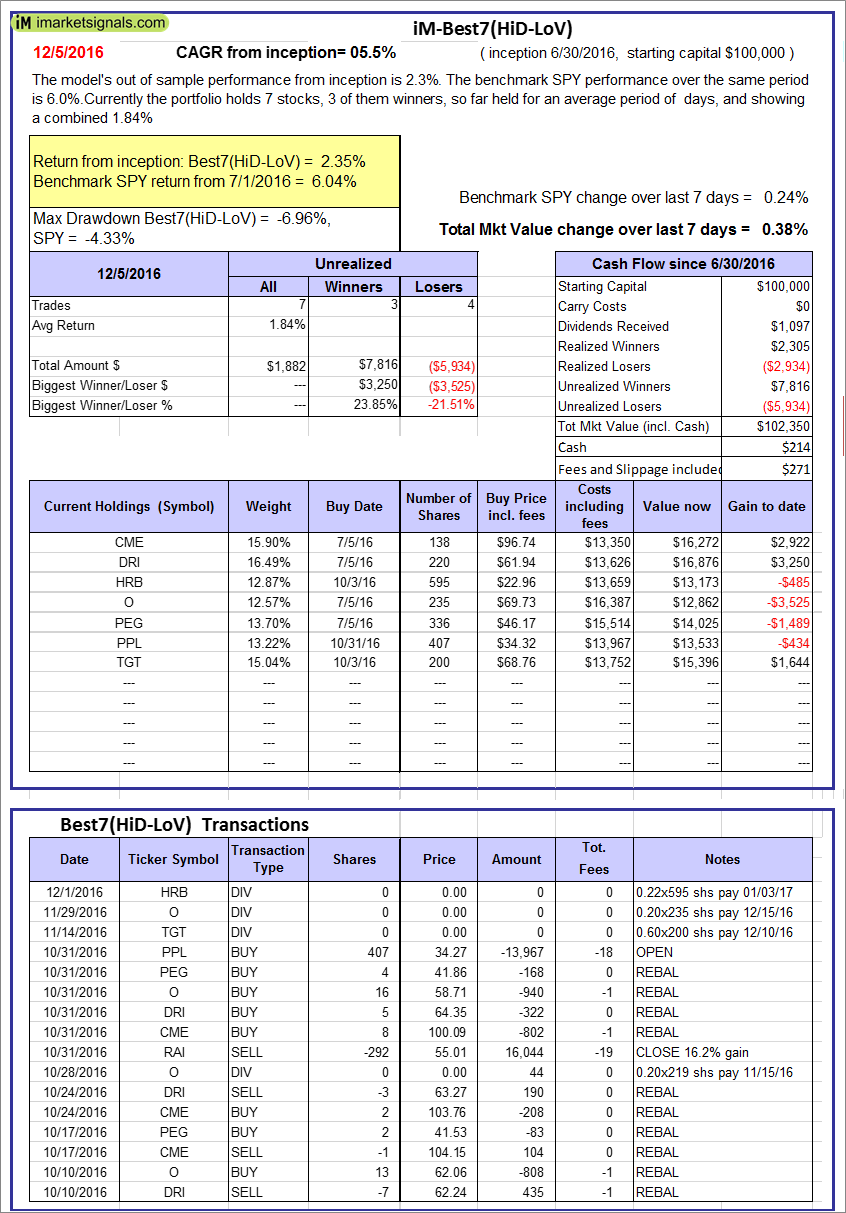 |
iM-Best7(HiD-LoV): The model’s out of sample performance from inception is 2.3%. The benchmark SPY performance over the same period is 6.0%. Over the previous week the market value of iM-BESTOGA-3 gained 0.38% at a time when SPY gained 0.24%. A starting capital of $100,000 at inception on 2/3/2014 would have grown to $102,350 which includes $214 cash and excludes $271 spent on fees and slippage. |
 |
iM-Best10(Short Russell3000): The model’s performance YTD is -37.5%, and for the last 12 months is -34.8%. Over the same period the benchmark SPY performance was 10.1% and 7.7% respectively. Over the previous week the market value of iM-Best10(Short Russell3000) gained -1.90% at a time when SPY gained 0.24%. Over the period 2/3/2014 to 12/5/2016 the starting capital of $100,000 would have grown to $8,875 which includes $14,143 cash and excludes $1,580 spent on fees and slippage. |
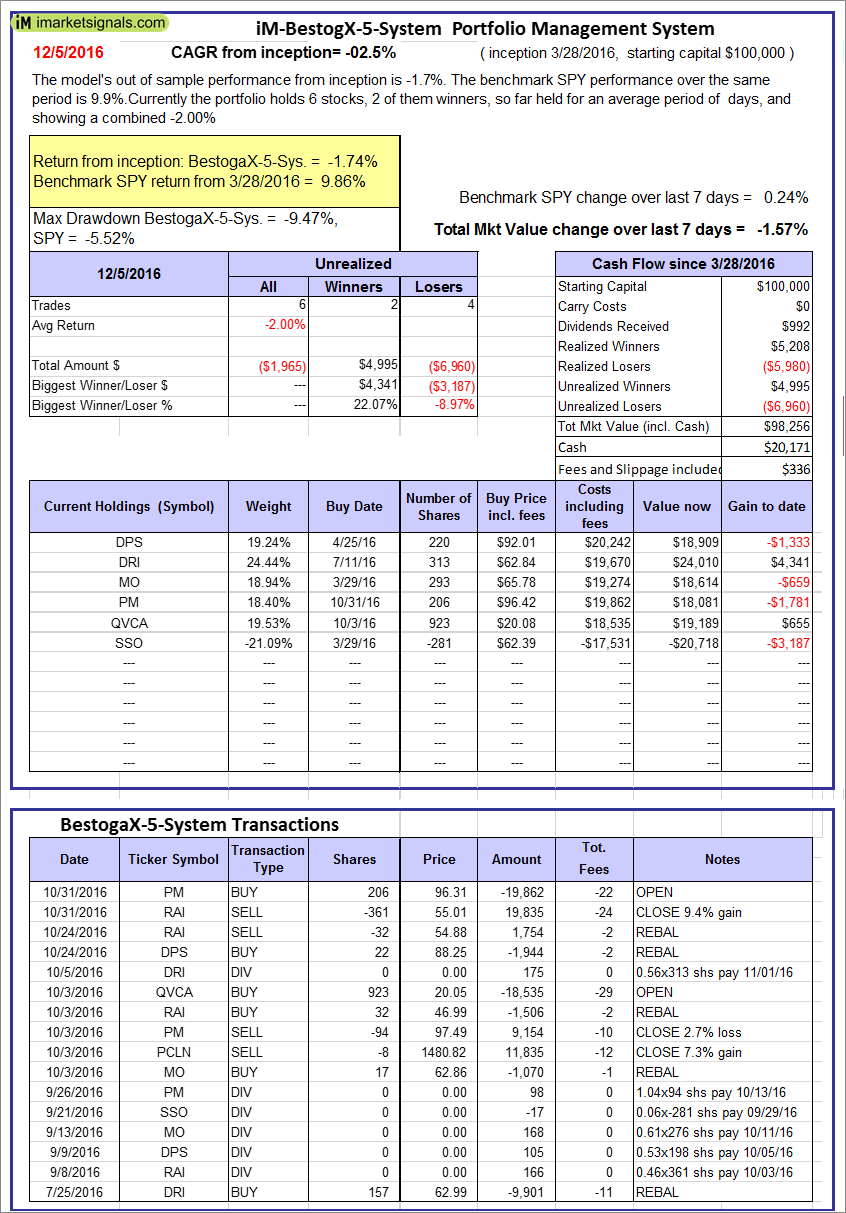 |
iM-BestogaX5-System: The model’s out of sample performance from inception is -1.7%. The benchmark SPY performance over the same period is 9.9%. Over the previous week the market value of iM-Best8(S&P 500)Tax-Eff. gained -1.57% at a time when SPY gained 0.24%. A starting capital of $100,000 at inception on 1/2/2009 would have grown to $98,256 which includes $20,171 cash and excludes $336 spent on fees and slippage. |
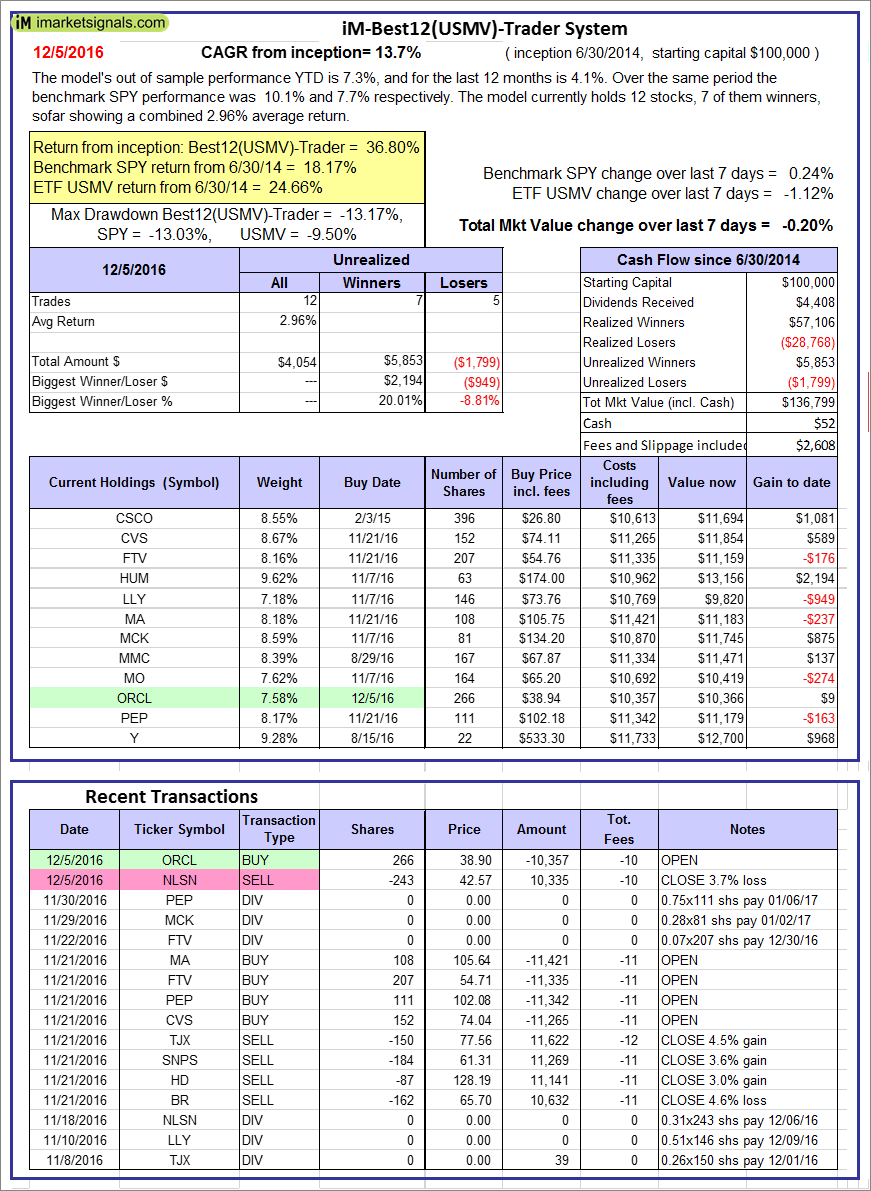 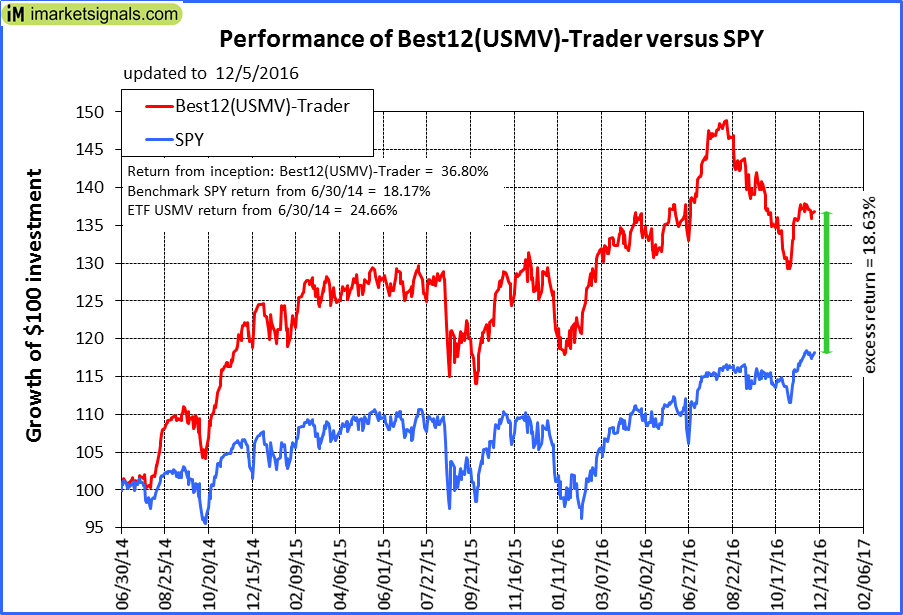 |
iM-Best12(USMV)-Trader: The model’s out of sample performance YTD is 7.3%, and for the last 12 months is 4.1%. Over the same period the benchmark SPY performance was 10.1% and 7.7% respectively. Since inception, on 7/1/2014, the model gained 36.80% while the benchmark SPY gained 18.17% and the ETF USMV gained 24.66% over the same period. Over the previous week the market value of iM-Best12(USMV)-Trader gained -0.20% at a time when SPY gained 0.24%. A starting capital of $100,000 at inception on 7/1/2014 would have grown to $136,799 which includes $52 cash and excludes $2,608 spent on fees and slippage. |
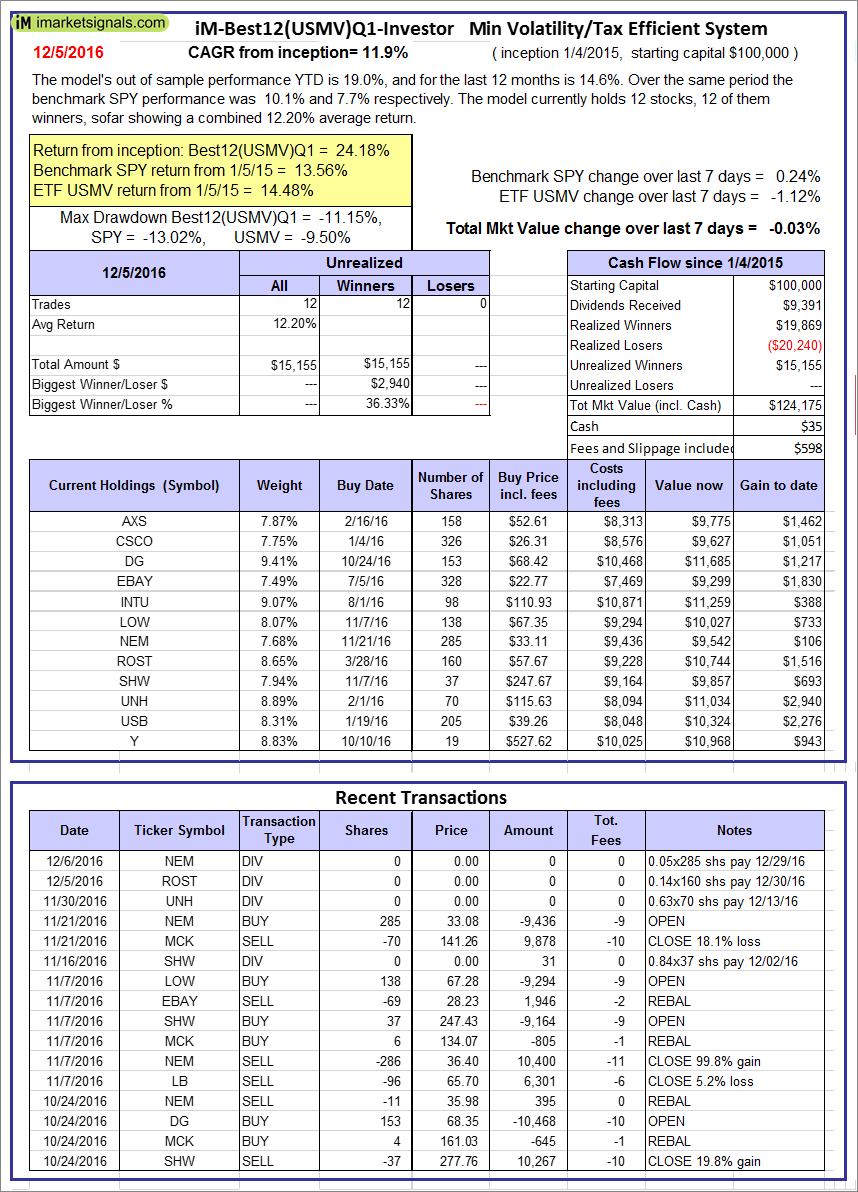  |
iM-Best12(USMV)Q1-Investor: The model’s out of sample performance YTD is 19.0%, and for the last 12 months is 14.6%. Over the same period the benchmark SPY performance was 10.1% and 7.7% respectively. Since inception, on 1/5/2015, the model gained 24.18% while the benchmark SPY gained 13.56% and the ETF USMV gained 14.48% over the same period. Over the previous week the market value of iM-Best12(USMV)Q1 gained -0.03% at a time when SPY gained 0.24%. A starting capital of $100,000 at inception on 1/5/2015 would have grown to $124,175 which includes $35 cash and excludes $598 spent on fees and slippage. |
 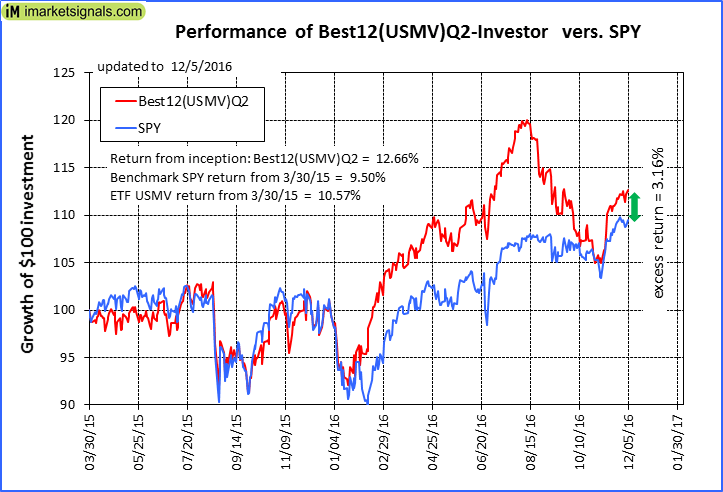 |
iM-Best12(USMV)Q2-Investor: The model’s out of sample performance YTD is 13.2%, and for the last 12 months is 10.4%. Over the same period the benchmark SPY performance was 10.1% and 7.7% respectively. Since inception, on 3/31/2015, the model gained 12.66% while the benchmark SPY gained 9.50% and the ETF USMV gained 10.57% over the same period. Over the previous week the market value of iM-Best12(USMV)Q2 gained 0.49% at a time when SPY gained 0.24%. A starting capital of $100,000 at inception on 3/31/2015 would have grown to $112,659 which includes $143 cash and excludes $515 spent on fees and slippage. |
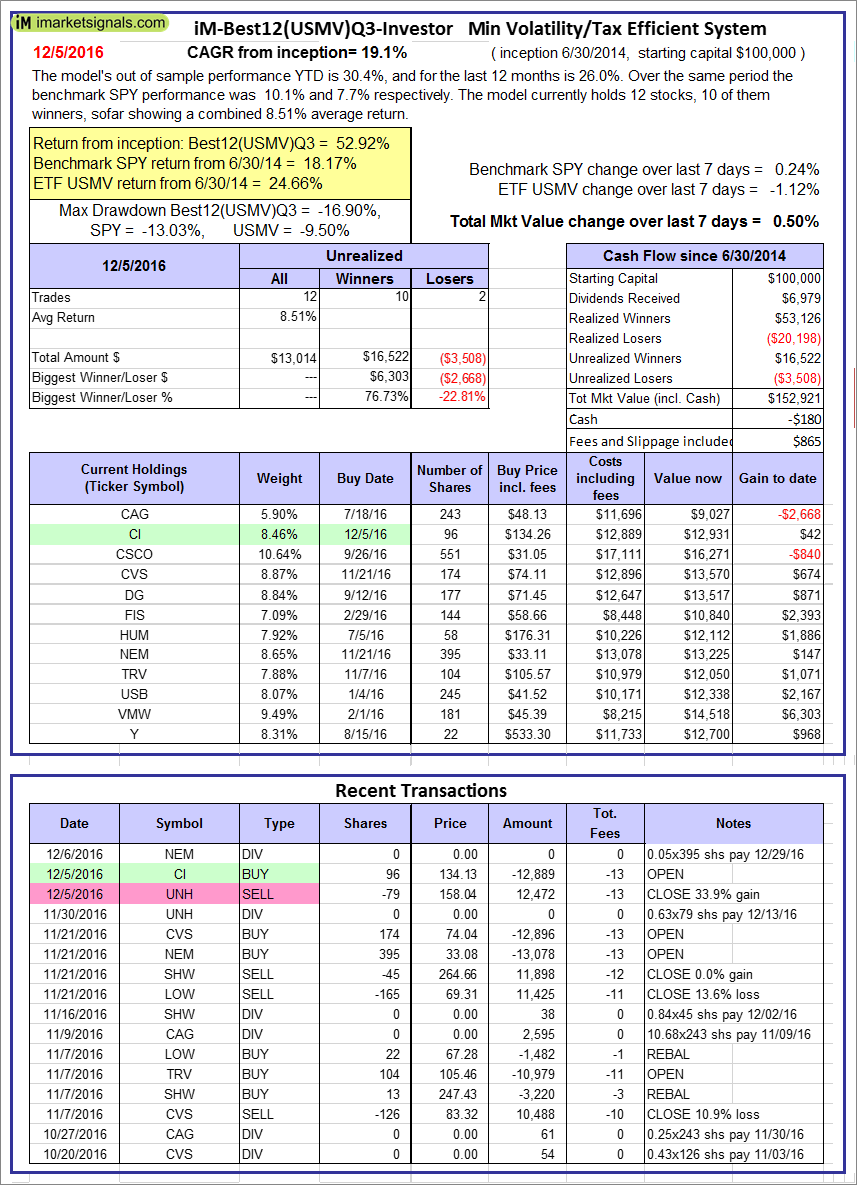  |
iM-Best12(USMV)Q3-Investor: The model’s out of sample performance YTD is 30.4%, and for the last 12 months is 26.0%. Over the same period the benchmark SPY performance was 10.1% and 7.7% respectively. Since inception, on 7/1/2014, the model gained 52.92% while the benchmark SPY gained 18.17% and the ETF USMV gained 24.66% over the same period. Over the previous week the market value of iM-Best12(USMV)Q3 gained 0.50% at a time when SPY gained 0.24%. A starting capital of $100,000 at inception on 7/1/2014 would have grown to $152,921 which includes -$180 cash and excludes $865 spent on fees and slippage. |
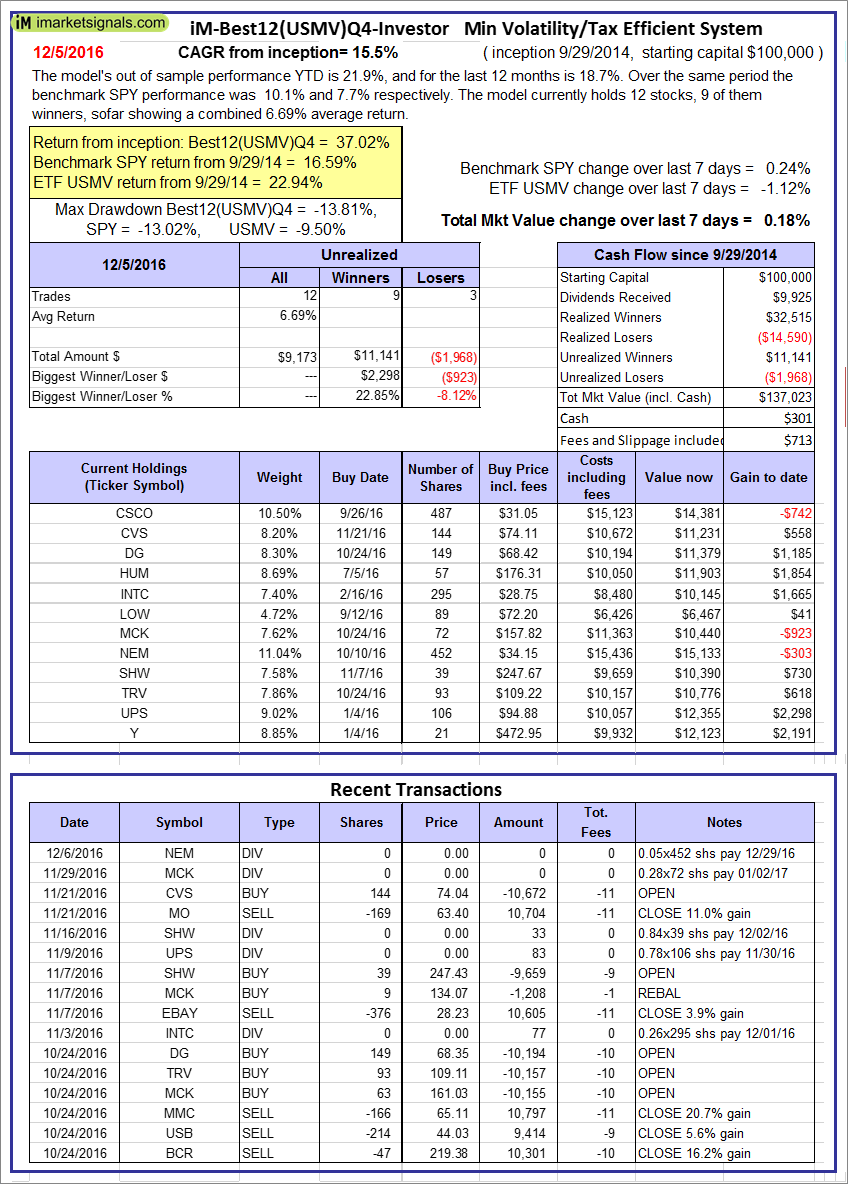 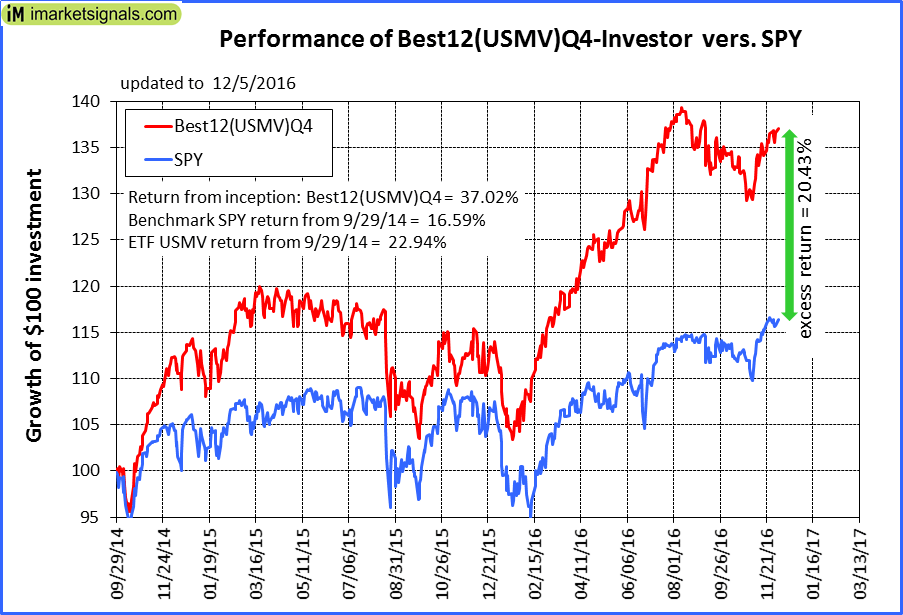 |
iM-Best12(USMV)Q4-Investor: Since inception, on 9/30/2014, the model gained 37.02% while the benchmark SPY gained 16.59% and the ETF USMV gained 22.94% over the same period. Over the previous week the market value of iM-Best12(USMV)Q4 gained 0.18% at a time when SPY gained 0.24%. A starting capital of $100,000 at inception on 9/30/2014 would have grown to $137,023 which includes $301 cash and excludes $713 spent on fees and slippage. |
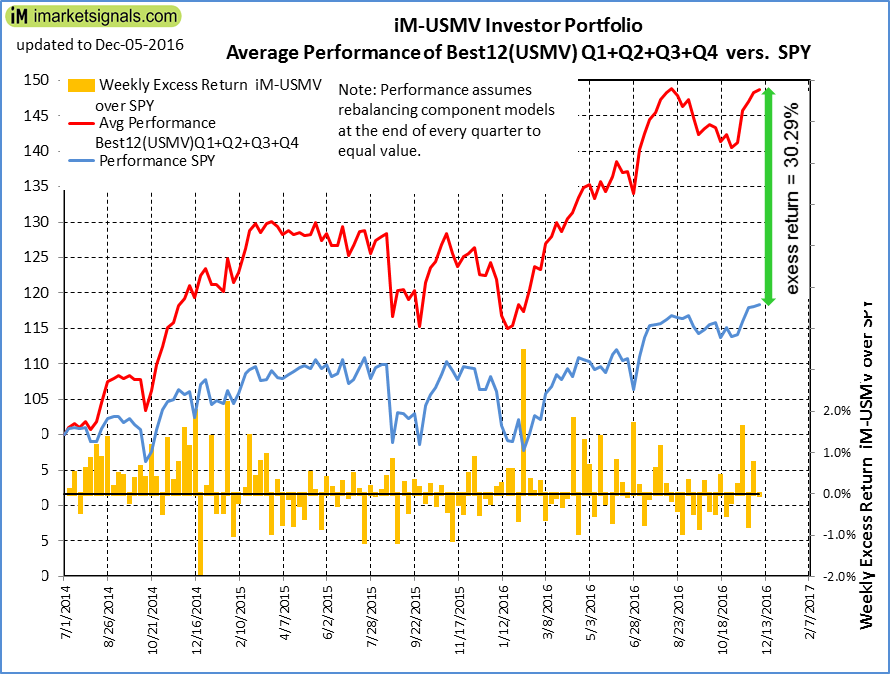 |
Average Performance of iM-Best12(USMV)Q1+Q2+Q3+Q4-Investor resulted in an excess return of 30.29% over SPY. (see iM-USMV Investor Portfolio) |
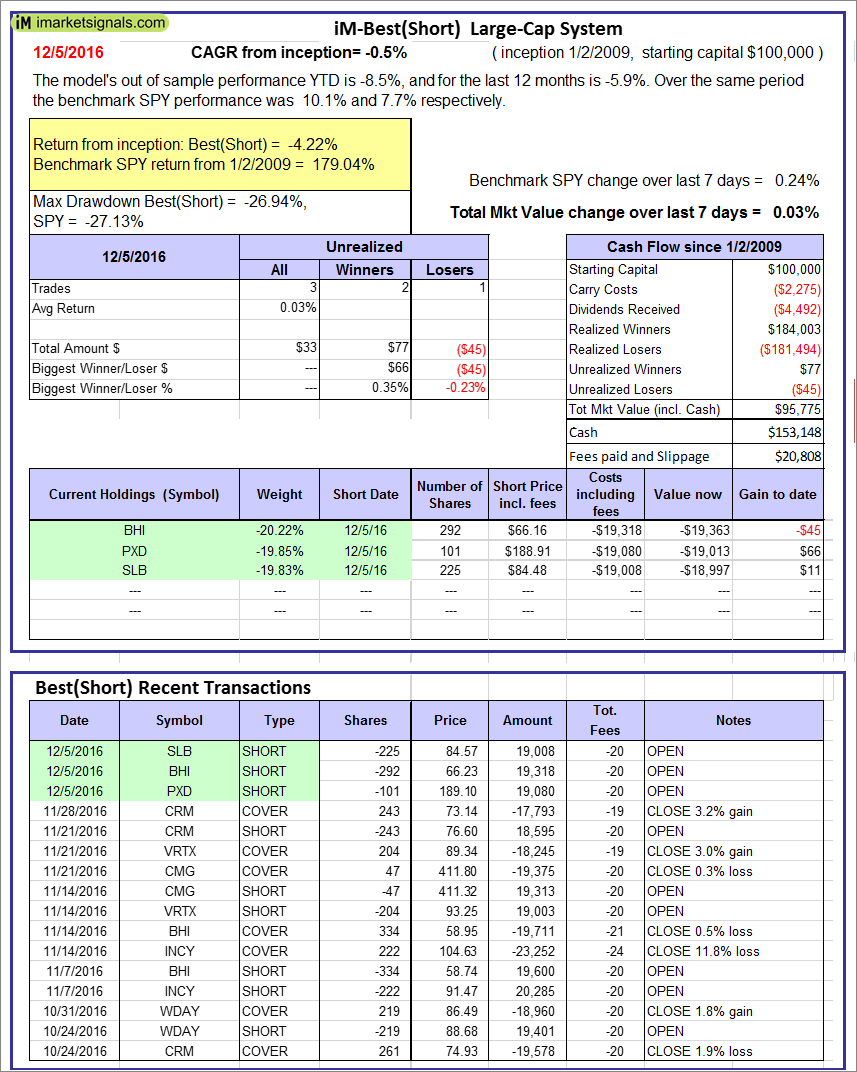 |
iM-Best(Short): The model’s out of sample performance YTD is -8.5%, and for the last 12 months is -5.9%. Over the same period the benchmark SPY performance was 10.1% and 7.7% respectively. Over the previous week the market value of iM-Best(Short) gained 0.03% at a time when SPY gained 0.24%. Over the period 1/2/2009 to 12/5/2016 the starting capital of $100,000 would have grown to $95,775 which includes $153,148 cash and excludes $20,808 spent on fees and slippage. |
iM-Best Reports – 12/5/2016
Posted in pmp SPY-SH
Leave a Reply
You must be logged in to post a comment.