
  |
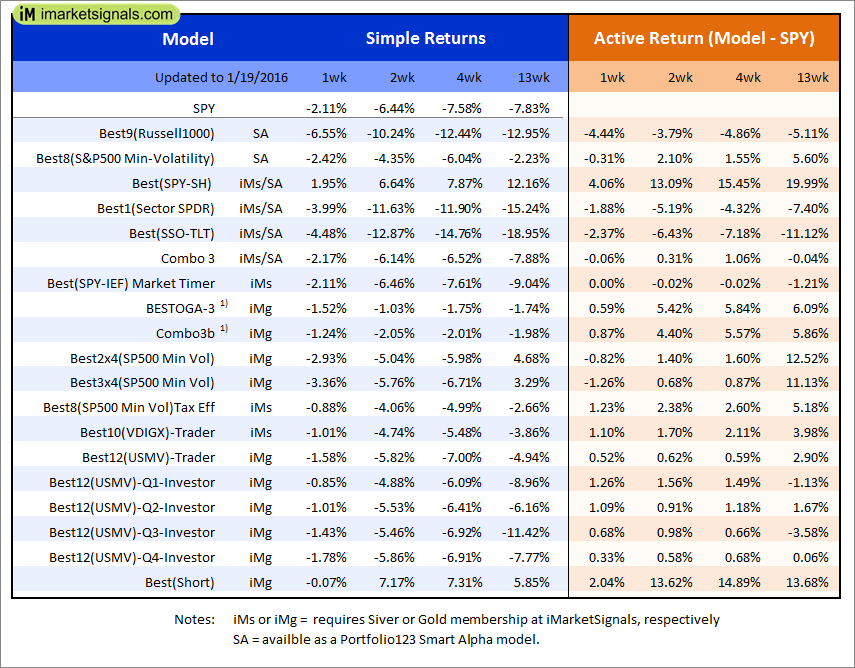
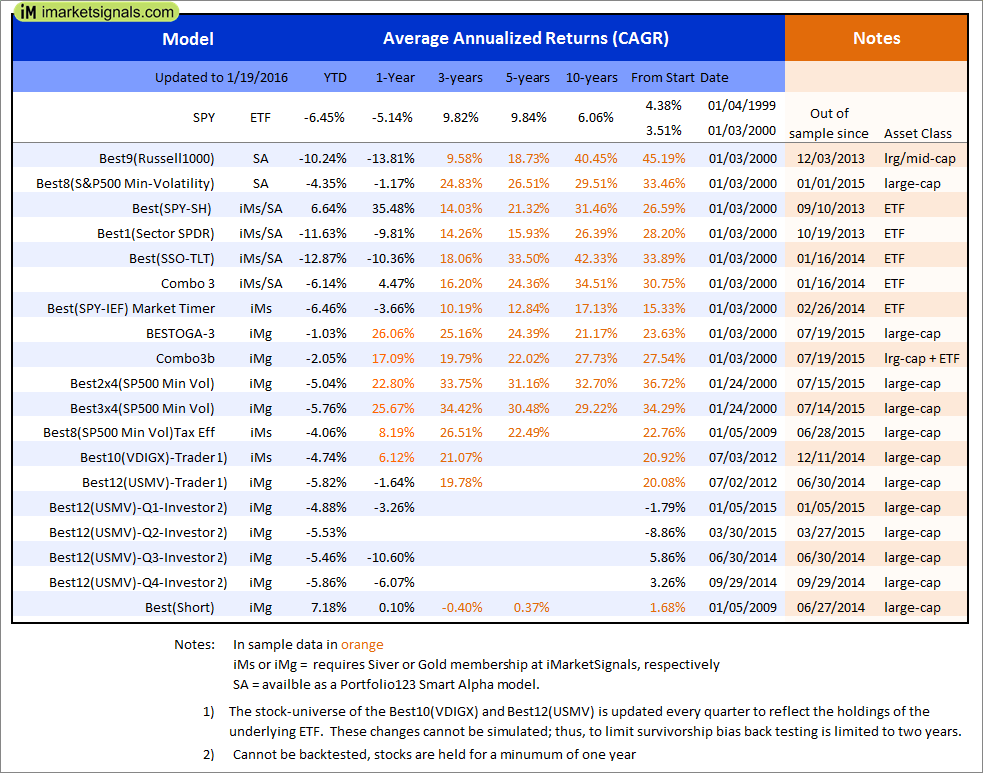
Out of sample performance summary of our models for the past 1, 2, 4 and 13 week periods. The active active return indicates how the models over- or underperformed the benchmark ETF SPY. Also the YTD, and the 1-, 3-, 5- and 10-year annualized returns are shown in the second table |
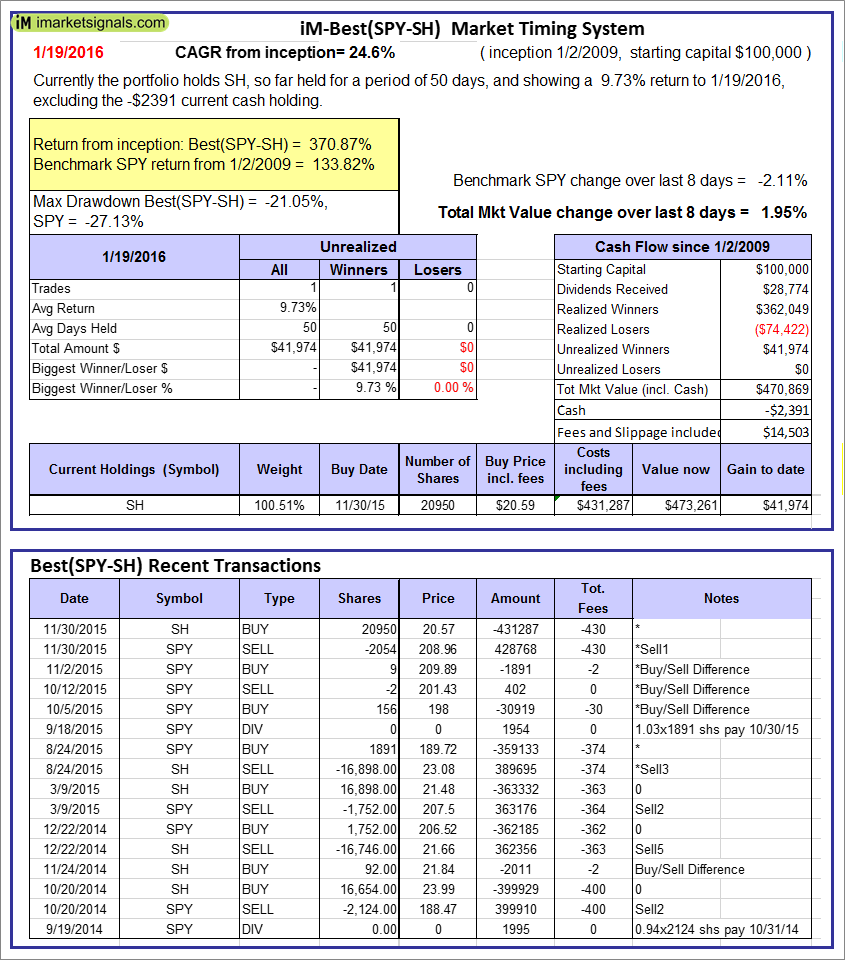 |
The iM-Best(SPY-SH) model currently holds SH, so far held for a period of 50 days, and showing a 9.73% return to 1/19/2016. Over the previous week the market value of Best(SPY-SH) gained 1.95% at a time when SPY gained -2.11%. A starting capital of $100,000 at inception on 1/2/2009 would have grown to $470,869 which includes -$2,391 cash and excludes $14,503 spent on fees and slippage. |
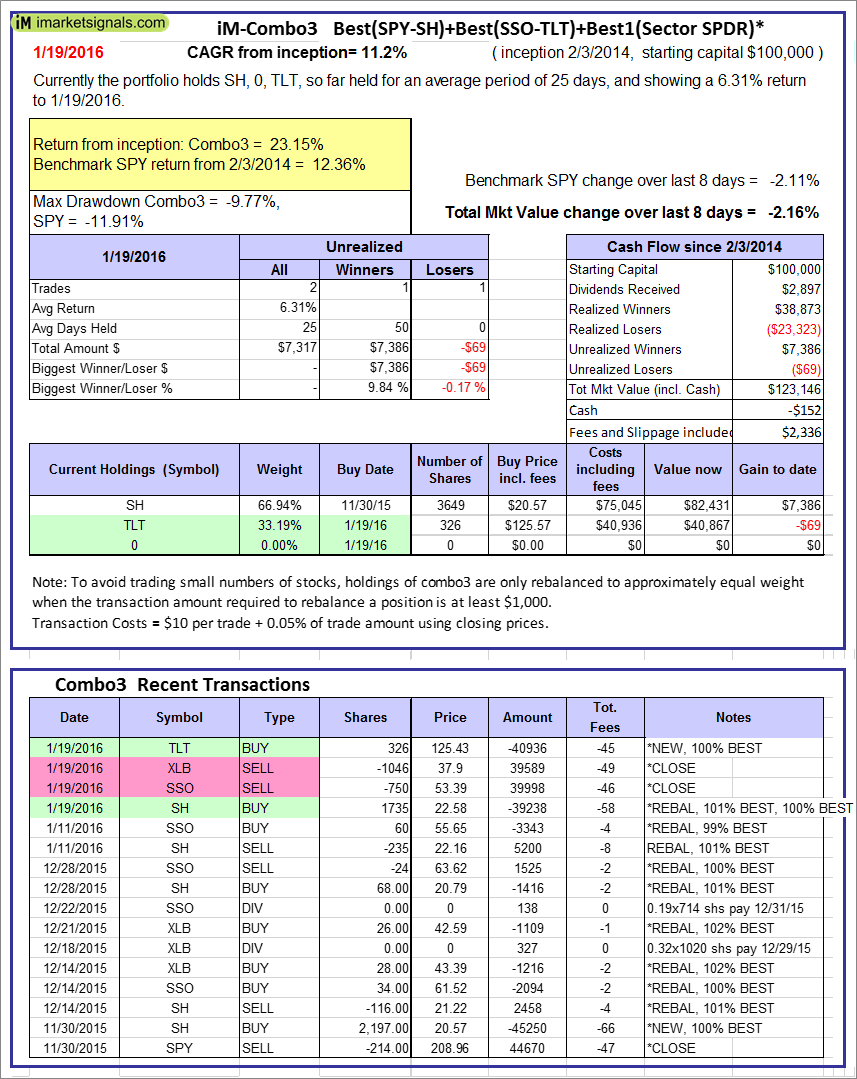 |
The iM-Combo3 model currently holds SH, TLT, and , so far held for an average period of 25 days, and showing a 6.31% return to 1/19/2016. Over the previous week the market value of iM-Combo3 gained -2.16% at a time when SPY gained -2.11%. A starting capital of $100,000 at inception on 2/3/2014 would have grown to $123,146 which includes -$152 cash and excludes $2,336 spent on fees and slippage. |
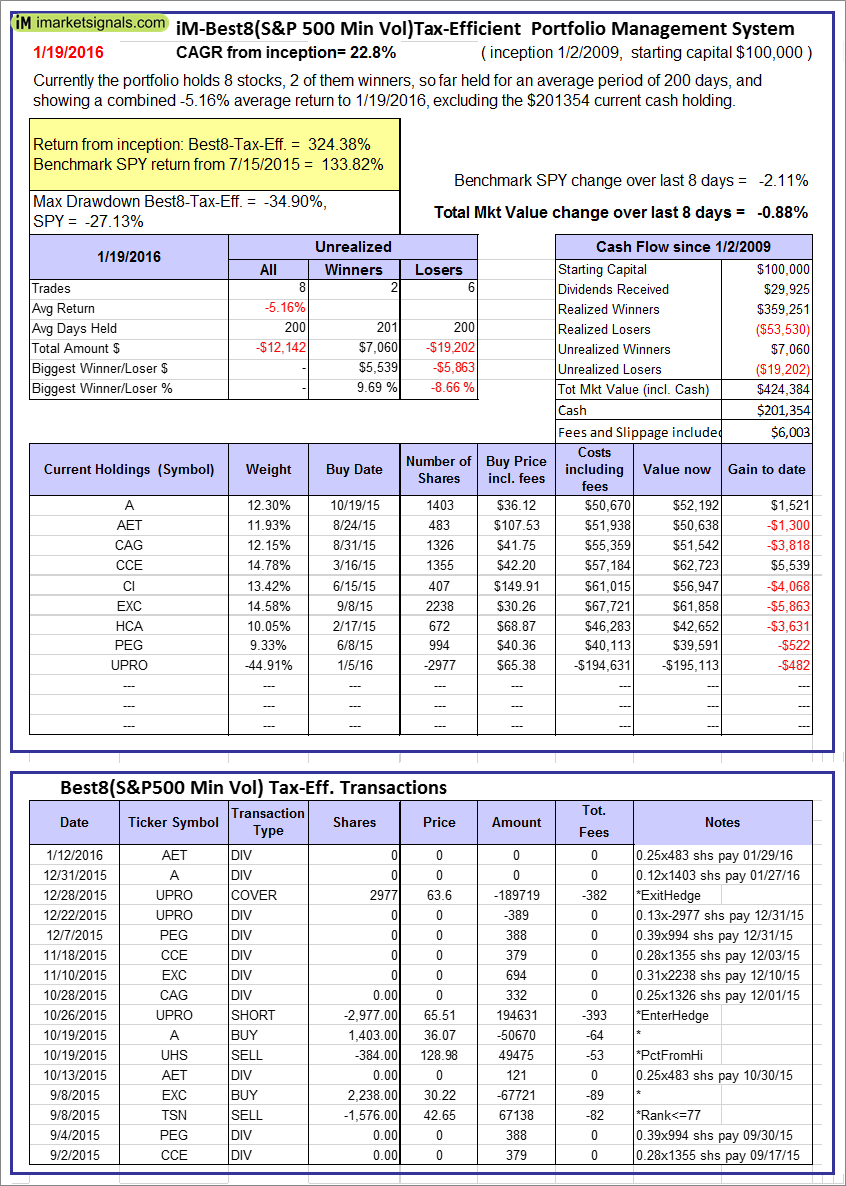 |
The iM-Best8(S&P500 Min Vol)Tax-Efficient model currently holds 8 stocks, 2 of them winners, so far held for an average period of 200 days, and showing a -5.16% return to 1/19/2016. Over the previous week the market value of iM-Best8(S&P 500)Tax-Eff. gained -0.88% at a time when SPY gained -2.11%. A starting capital of $100,000 at inception on 1/2/2009 would have grown to $424,384 which includes $201,354 cash and excludes $6,003 spent on fees and slippage. |
 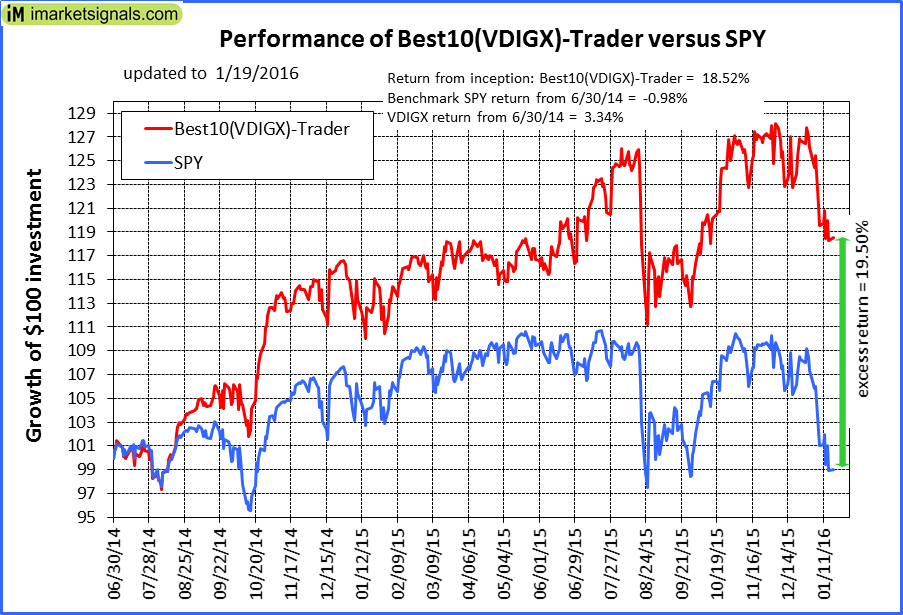 |
The iM-Best10(VDIGX)-Trader model currently holds 9 stocks, 3 of them winners, so far held for an average period of 193 days, and showing a -3.59% return to 1/19/2016. Since inception, on 7/1/2014, the model gained 18.52% while the benchmark SPY gained -0.98% and the ETF VDIGX gained 3.34% over the same period. Over the previous week the market value of iM-Best10(VDIGX) gained -1.01% at a time when SPY gained -2.11%. A starting capital of $100,000 at inception on 7/1/2014 would have grown to $118,517 which includes $13,158 cash and excludes $852 spent on fees and slippage. |
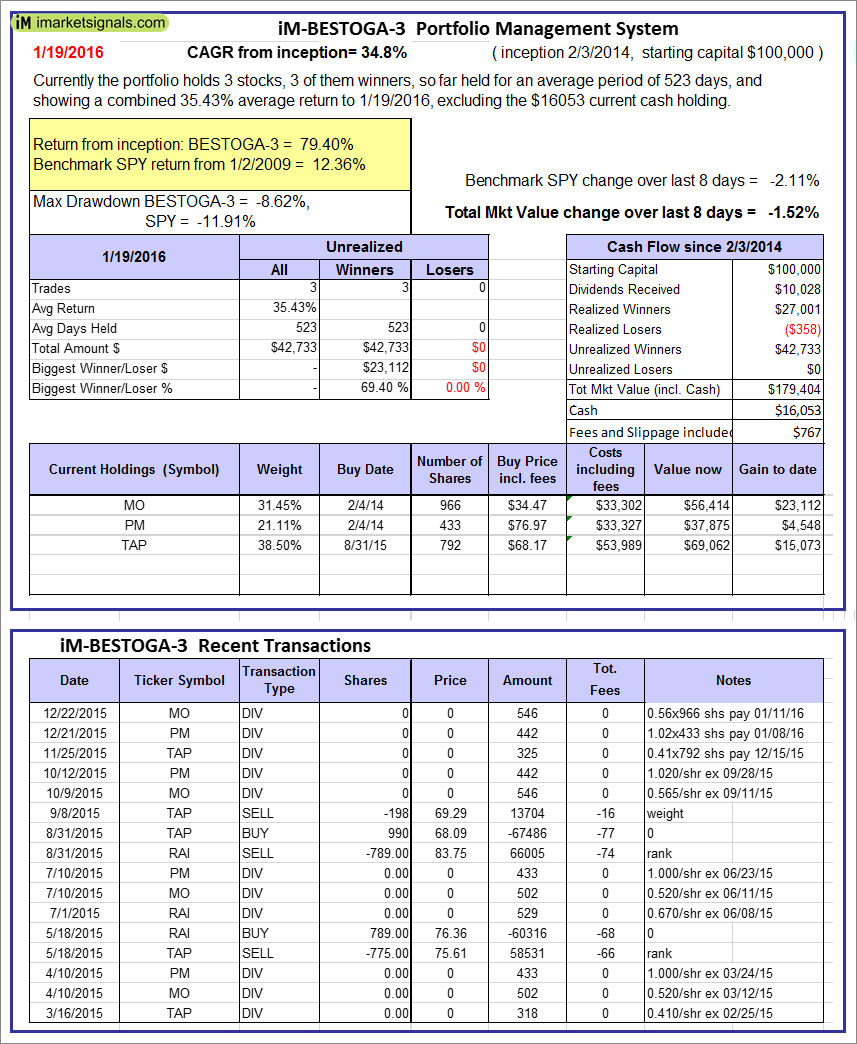 |
The iM-BESTOGA-3 model currently holds 3 stocks, 3 of them winners, so far held for an average period of 523 days, and showing a 35.43% return to 1/19/2016. Over the previous week the market value of iM-BESTOGA-3 gained -1.52% at a time when SPY gained -2.11%. A starting capital of $100,000 at inception on 2/3/2014 would have grown to $179,404 which includes $16,053 cash and excludes $767 spent on fees and slippage. |
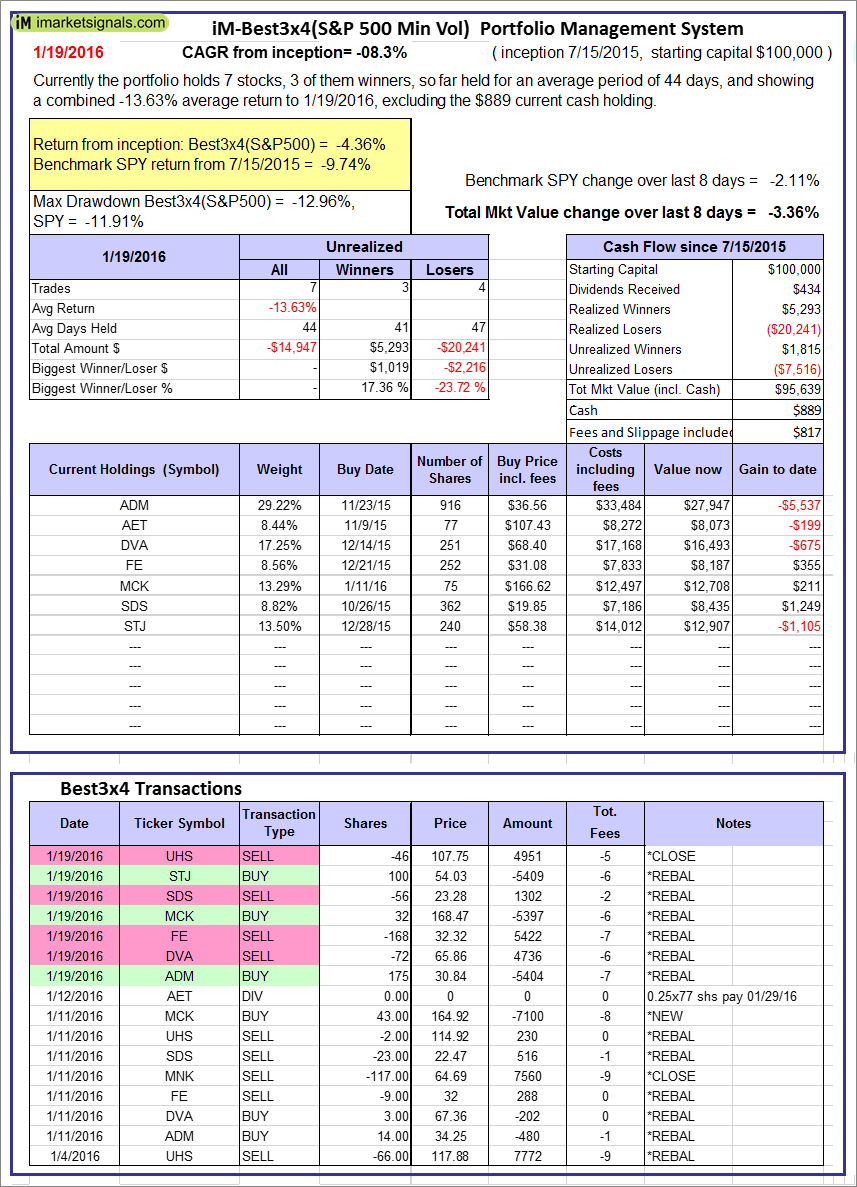 |
The iM-Best3x4(S&P 500 Min Vol) model currently holds 7 stocks, 3 of them winners, so far held for an average period of 44 days, and showing a -13.63% return to 1/19/2016. Over the previous week the market value of iM-Best3x4 gained -3.36% at a time when SPY gained -2.11%. A starting capital of $100,000 at inception on 7/15/2015 would have grown to $95,639 which includes $889 cash and excludes $817 spent on fees and slippage. |
 |
The iM-Best2x4(S&P 500 Min Vol) model currently holds 7 stocks, 3 of them winners, so far held for an average period of 58 days, and showing a -6.16% return to 1/19/2016. Over the previous week the market value of iM-Best2x4 gained -2.93% at a time when SPY gained -2.11%. A starting capital of $100,000 at inception on 7/16/2015 would have grown to $92,922 which includes -$674 cash and excludes $572 spent on fees and slippage. |
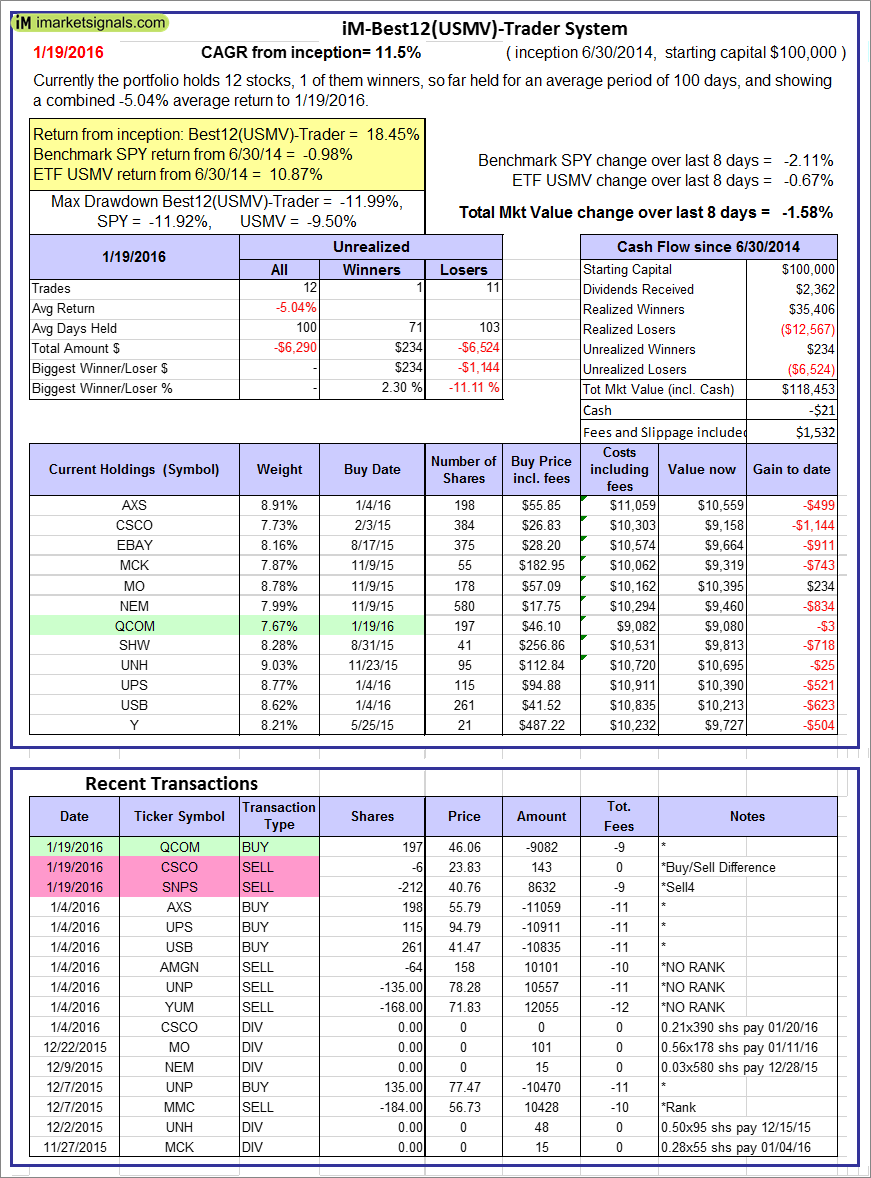 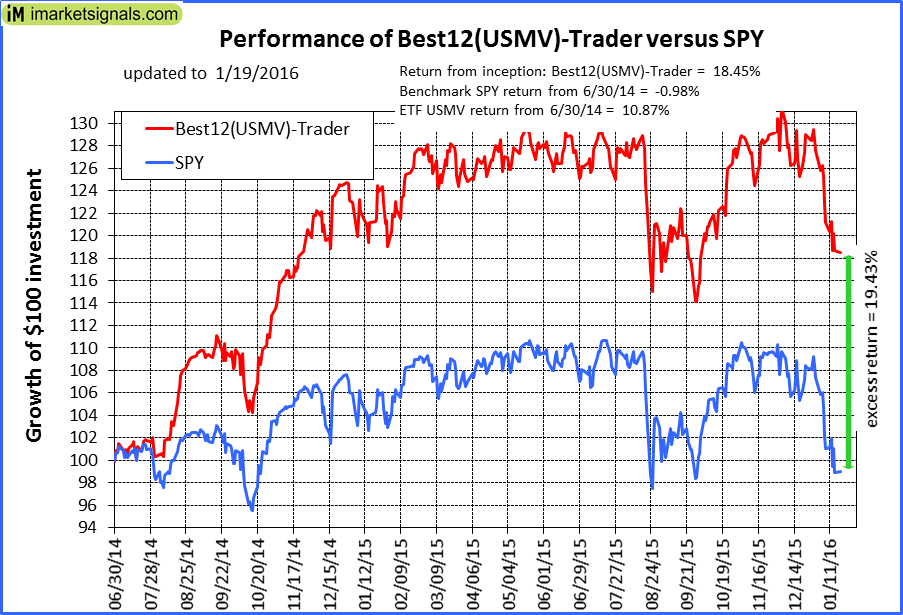 |
The iM-Best12(USMV)-Trader model currently holds 12 stocks, 1 of them winners, so far held for an average period of 100 days, and showing a -5.04% return to 1/19/2016. Since inception, on 7/1/2014, the model gained 18.45% while the benchmark SPY gained -0.98% and the ETF USMV gained 10.87% over the same period. Over the previous week the market value of iM-Best12(USMV)-Trader gained -1.58% at a time when SPY gained -2.11%. A starting capital of $100,000 at inception on 7/1/2014 would have grown to $118,453 which includes -$21 cash and excludes $1,532 spent on fees and slippage. |
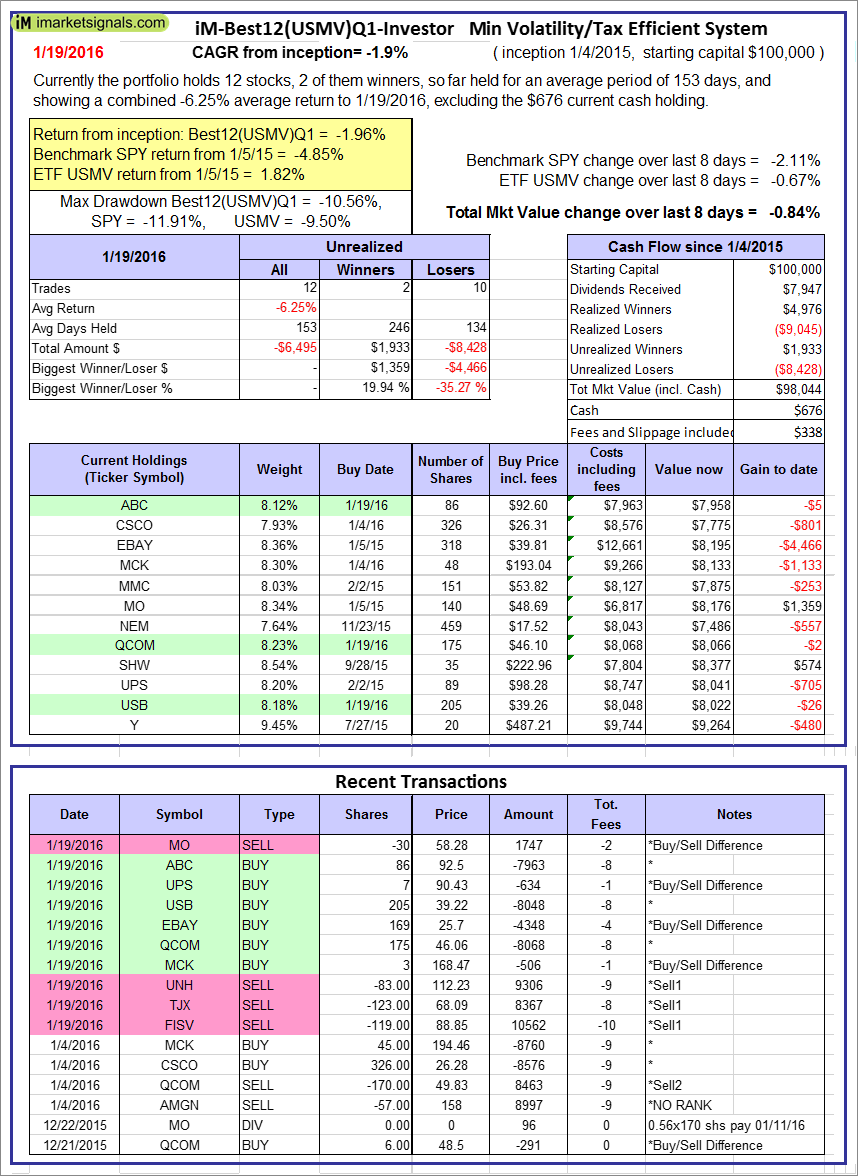 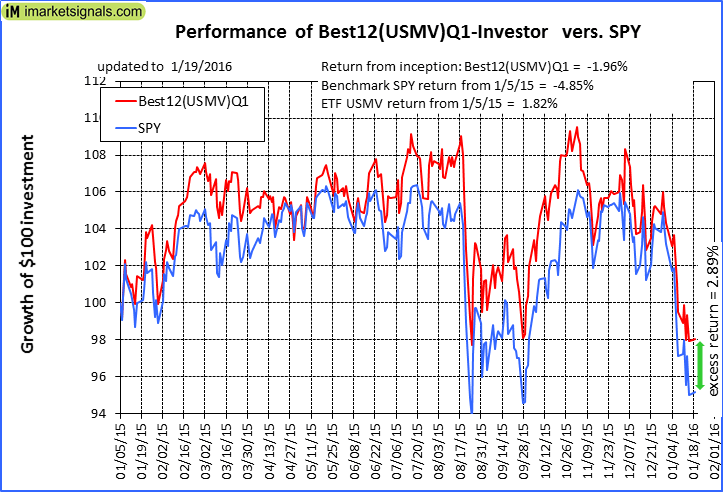 |
The iM-Best12(USMV)Q1-Investor model currently holds 12 stocks, 2 of them winners, so far held for an average period of 153 days, and showing a -6.25% return to 1/19/2016. Since inception, on 1/5/2015, the model gained -1.96% while the benchmark SPY gained -4.85% and the ETF USMV gained 1.82% over the same period. Over the previous week the market value of iM-Best12(USMV)Q1 gained -0.84% at a time when SPY gained -2.11%. A starting capital of $100,000 at inception on 1/5/2015 would have grown to $98,044 which includes $676 cash and excludes $338 spent on fees and slippage. |
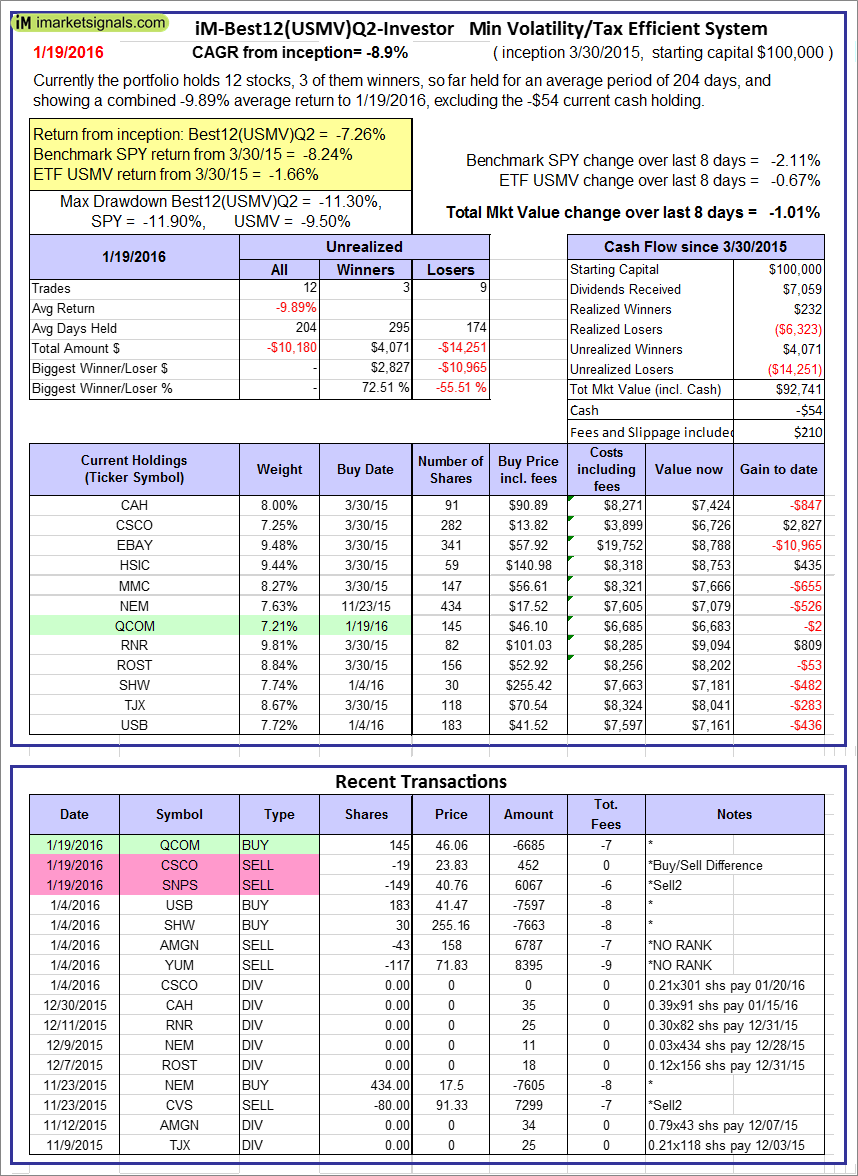  |
The iM-Best12(USMV)Q2-Investor model currently holds 12 stocks, 3 of them winners, so far held for an average period of 204 days, and showing a -9.89% return to 1/19/2016. Since inception, on 3/31/2015, the model gained -7.26% while the benchmark SPY gained -8.24% and the ETF USMV gained -1.66% over the same period. Over the previous week the market value of iM-Best12(USMV)Q2 gained -1.01% at a time when SPY gained -2.11%. A starting capital of $100,000 at inception on 3/31/2015 would have grown to $92,741 which includes -$54 cash and excludes $210 spent on fees and slippage. |
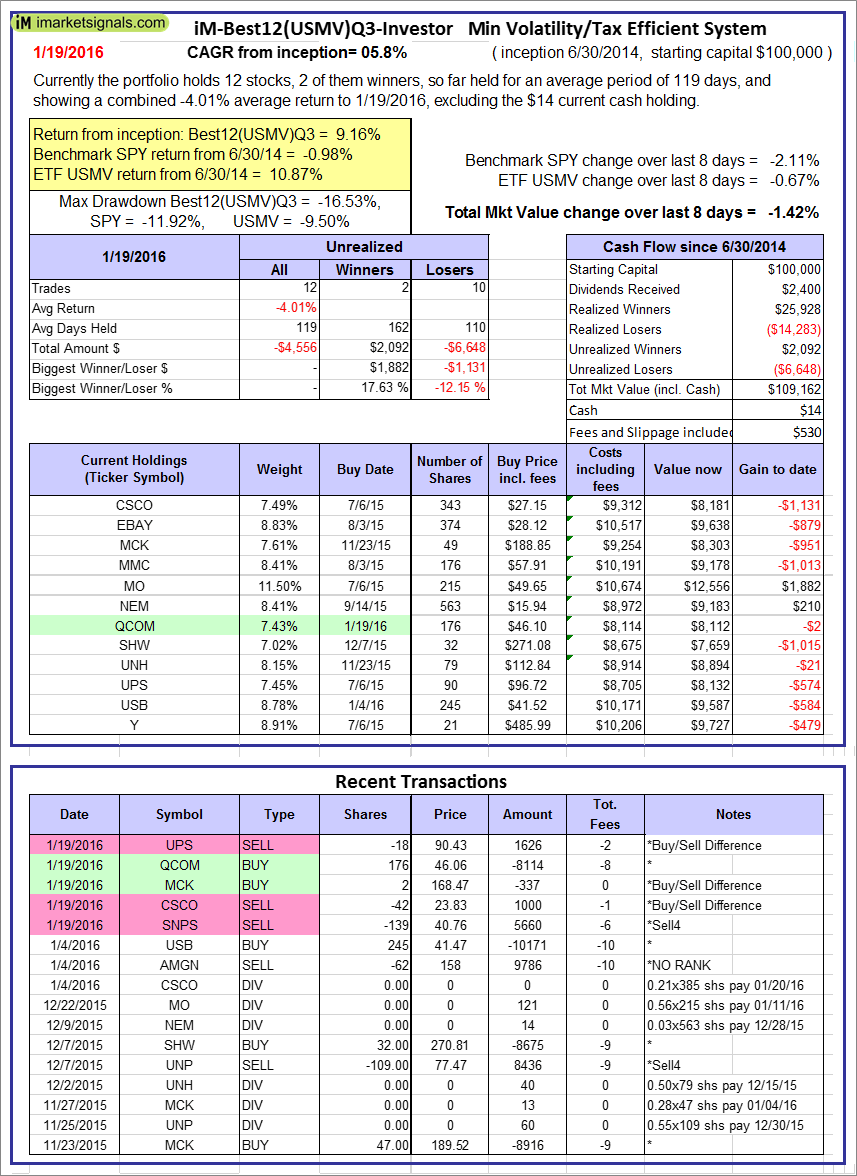  |
The iM-Best12(USMV)Q3-Investor model currently holds 12 stocks, 2 of them winners, so far held for an average period of 119 days, and showing a -4.01% return to 1/19/2016. Since inception, on 7/1/2014, the model gained 9.16% while the benchmark SPY gained -0.98% and the ETF USMV gained 10.87% over the same period. Over the previous week the market value of iM-Best12(USMV)Q3 gained -1.42% at a time when SPY gained -2.11%. A starting capital of $100,000 at inception on 7/1/2014 would have grown to $109,162 which includes $14 cash and excludes $530 spent on fees and slippage. |
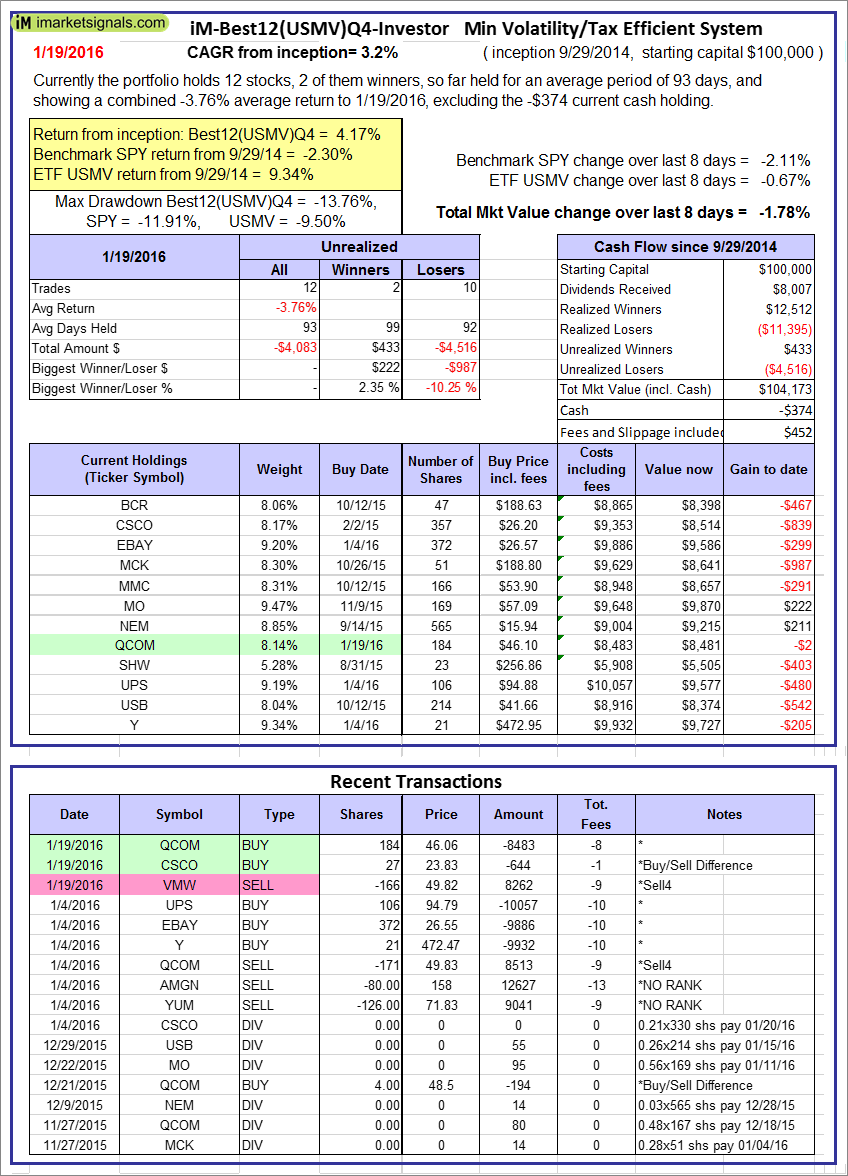 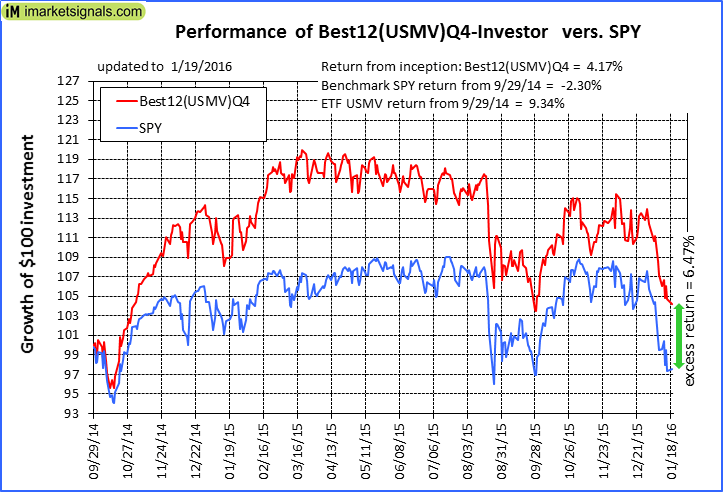 |
The iM-Best12(USMV)Q4-Investor model currently holds 12 stocks, 2 of them winners, so far held for an average period of 93 days, and showing a -3.76% return to 1/19/2016. Since inception, on 9/30/2014, the model gained 4.17% while the benchmark SPY gained -2.30% and the ETF USMV gained 9.34% over the same period. Over the previous week the market value of iM-Best12(USMV)Q4 gained -1.78% at a time when SPY gained -2.11%. A starting capital of $100,000 at inception on 9/30/2014 would have grown to $104,173 which includes -$374 cash and excludes $452 spent on fees and slippage. |
 |
Average Performance of iM-Best12(USMV)Q1+Q2+Q3+Q4-Investor resulted in an excess return of 15.78% over SPY. (see iM-USMV Investor Portfolio) |
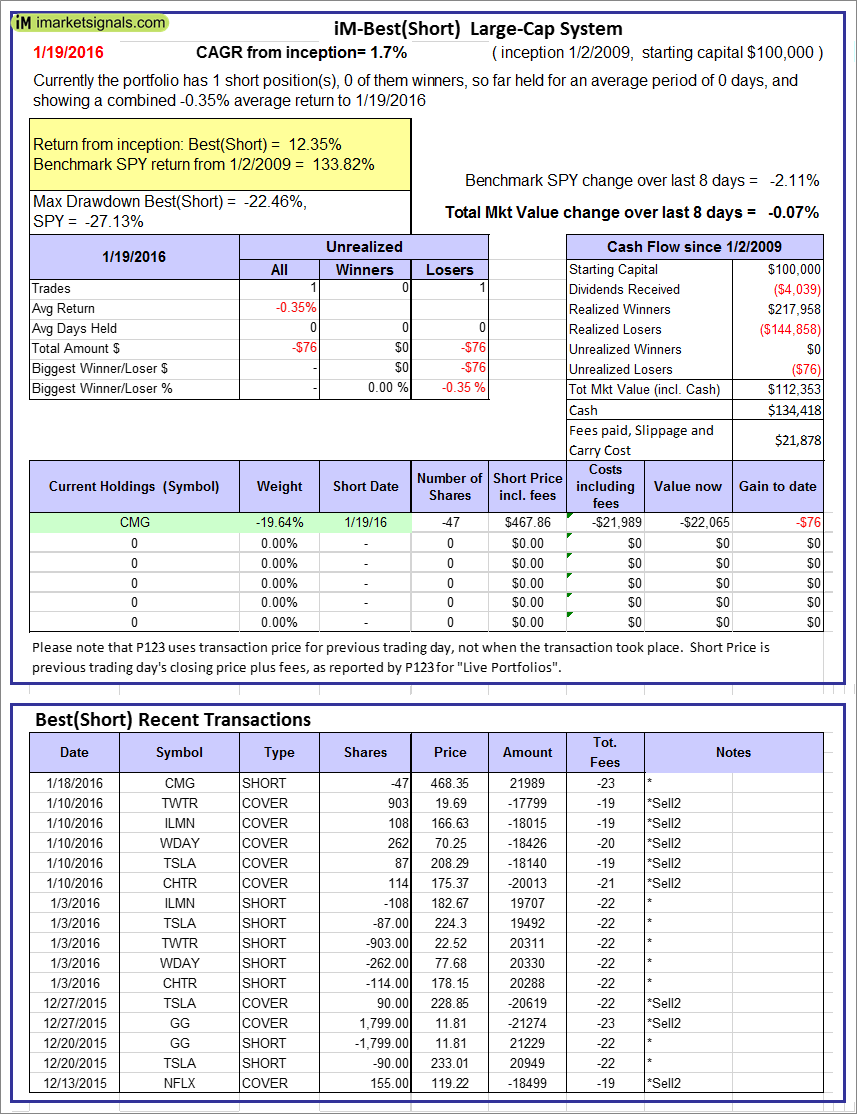 |
The iM-Best(Short) model currently holds 1position(s), valued ($21,989). Over the previous week the market value of iM-Best(Short) gained -0.07% at a time when SPY gained -2.11%. Over the period 1/2/2009 to 1/19/2016 the starting capital of $100,000 would have grown to $112,353 which includes $134,418 cash and excludes $21,878 spent on fees and slippage. |
iM-Best Reports – 1/19/2016
Posted in pmp SPY-SH
Leave a Reply
You must be logged in to post a comment.