
 |
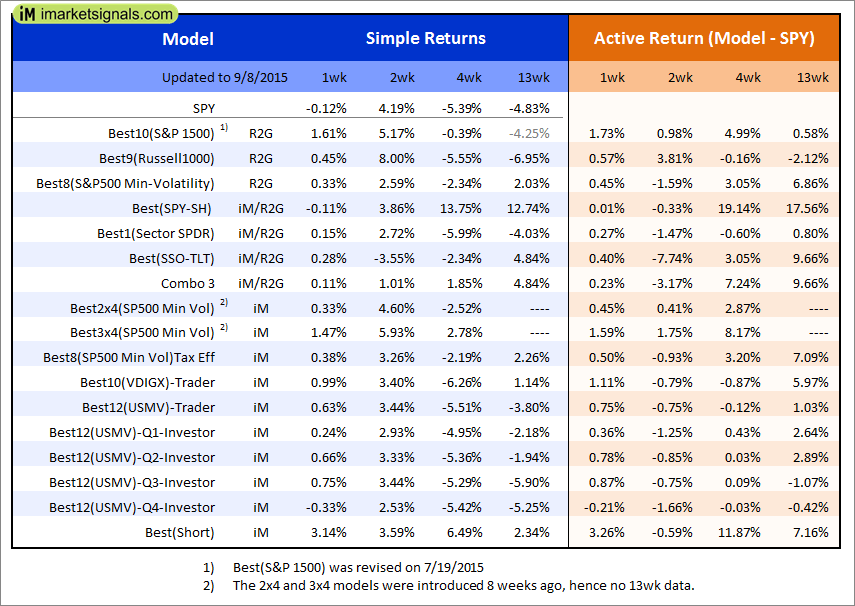
Out of sample performance summary of our models for the past 1, 2, 4 and 13 week periods. The active active return indicates how the models over- or underperformed the benchmark ETF SPY. |
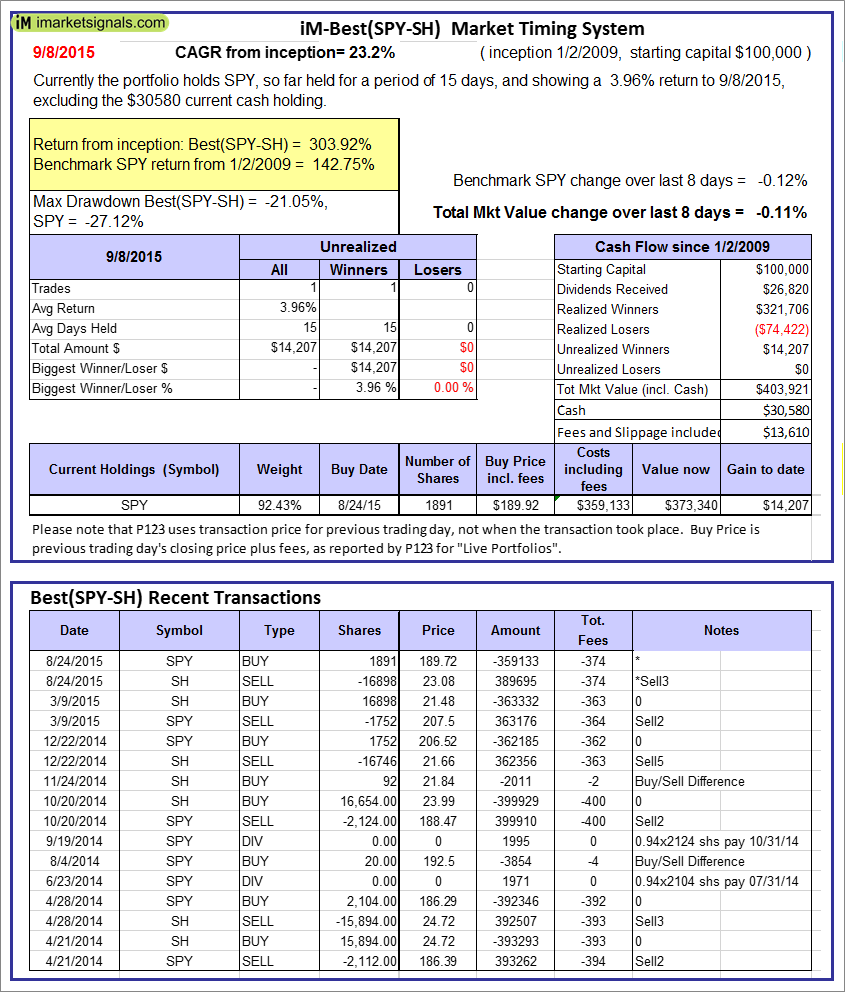 |
The iM-Best(SPY-SH) model currently holds SPY, so far held for a period of 15 days, and showing a 3.96% return to 9/8/2015. Over the previous week the market value of Best(SPY-SH) gained -0.11% at a time when SPY gained -0.12%. A starting capital of $100,000 at inception on 1/2/2009 would have grown to $403,921 which includes $30,580 cash and excludes $13,610 spent on fees and slippage. |
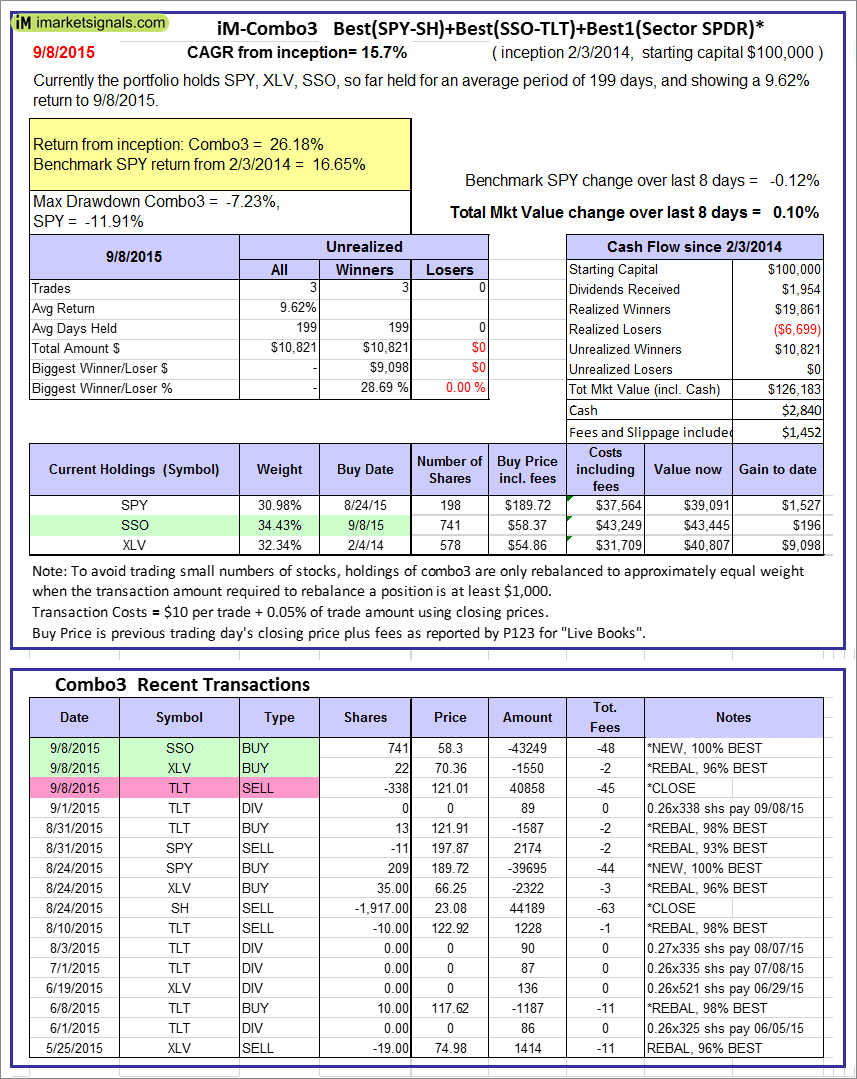 |
The iM-Combo3 model currently holds SPY, SSO, and XLV, so far held for an average period of 199 days, and showing a 9.62% return to 9/8/2015. Over the previous week the market value of iM-Combo3 gained 0.10% at a time when SPY gained -0.12%. A starting capital of $100,000 at inception on 2/3/2014 would have grown to $126,183 which includes $2,840 cash and excludes $1,452 spent on fees and slippage. |
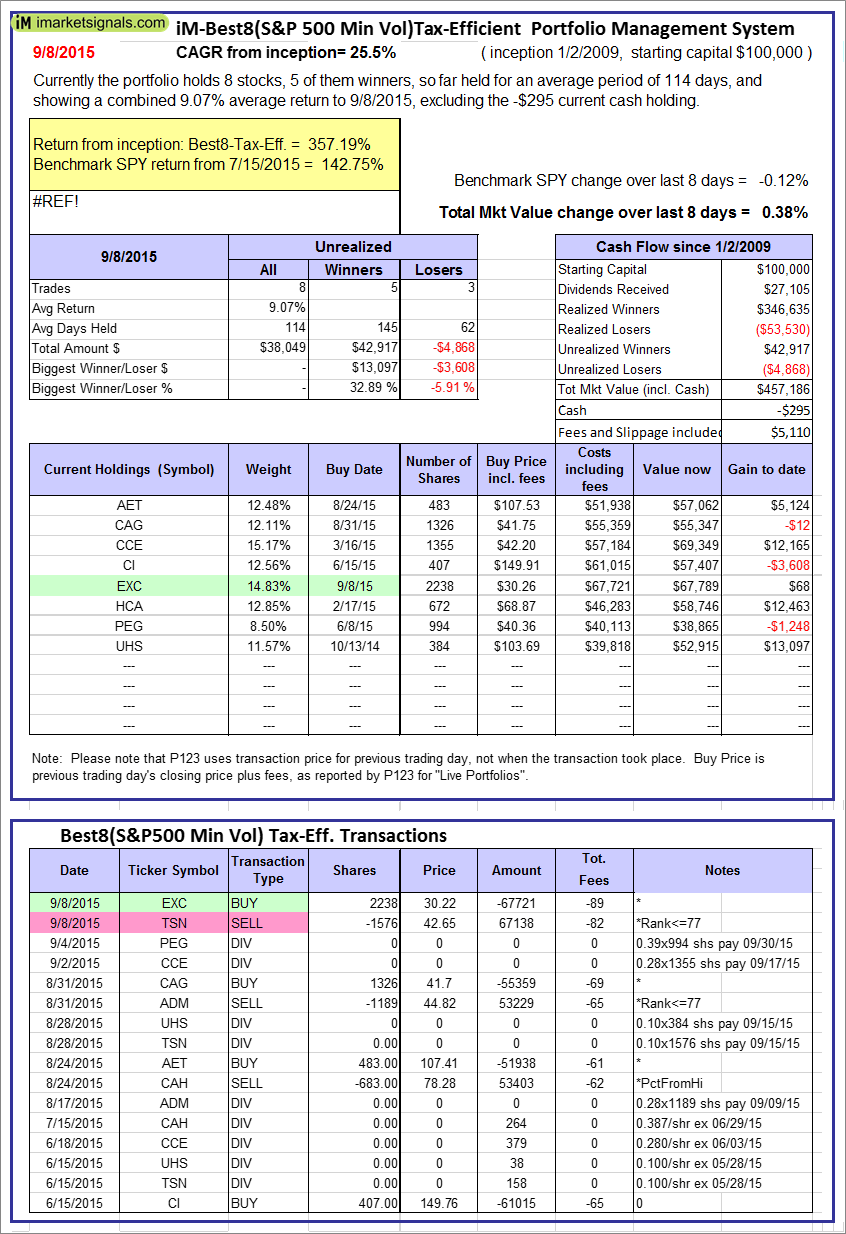 |
The iM-Best8(S&P500 Min Vol)Tax-Efficient model currently holds 8 stocks, 5 of them winners, so far held for an average period of 114 days, and showing a 9.07% return to 9/8/2015. Over the previous week the market value of iM-Best8(S&P 500)Tax-Eff. gained 0.38% at a time when SPY gained -0.12%. A starting capital of $100,000 at inception on 1/2/2009 would have grown to $457,186 which includes -$295 cash and excludes $5,110 spent on fees and slippage. |
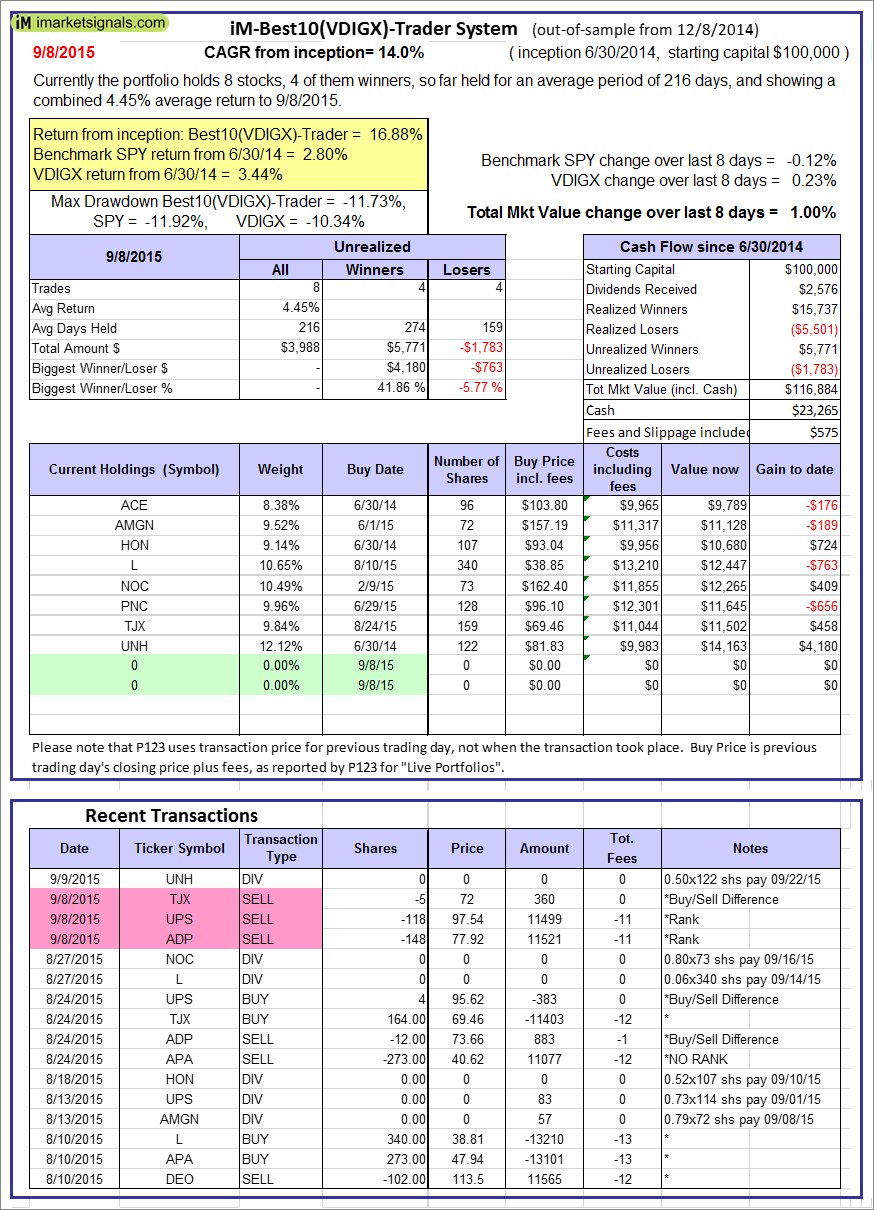 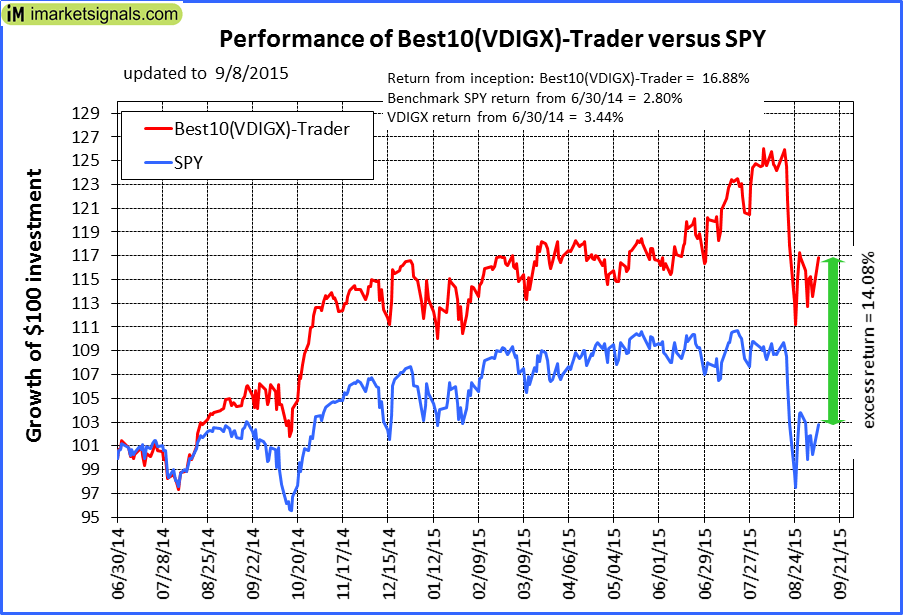 |
The iM-Best10(VDIGX)-Trader model currently holds 8 stocks, 4 of them winners, so far held for an average period of 216 days, and showing a 4.45% return to 9/8/2015. Since inception, on 7/1/2014, the model gained 16.88% while the benchmark SPY gained 2.80% and the ETF VDIGX gained 3.44% over the same period. Over the previous week the market value of iM-Best10(VDIGX) gained 1.00% at a time when SPY gained -0.12%. A starting capital of $100,000 at inception on 7/1/2014 would have grown to $116,884 which includes $23,265 cash and excludes $575 spent on fees and slippage. |
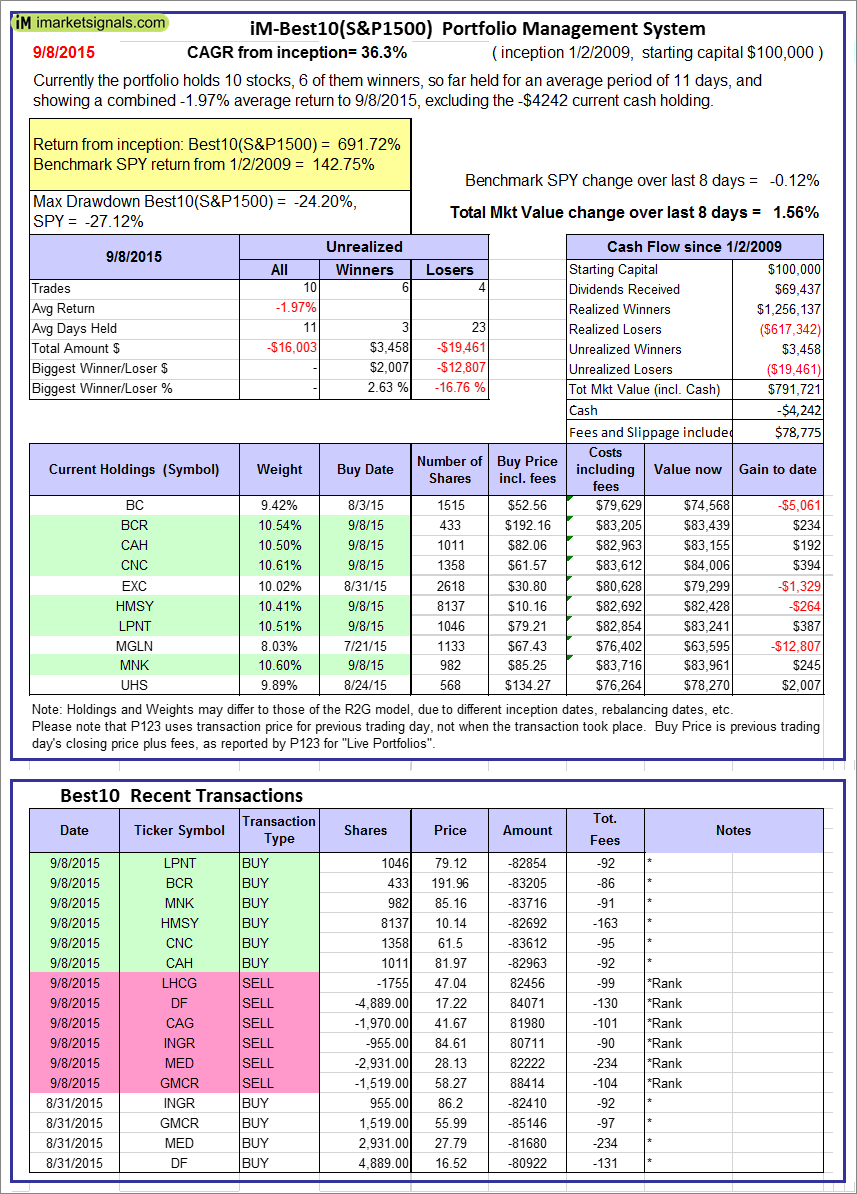 |
The iM-Best10(S&P 1500) model currently holds 10 stocks, 6 of them winners, so far held for an average period of 11 days, and showing a -1.97% return to 9/8/2015. Over the previous week the market value of iM-Best10 gained 1.56% at a time when SPY gained -0.12%. A starting capital of $100,000 at inception on 1/2/2009 would have grown to $791,721 which includes -$4,242 cash and excludes $78,775 spent on fees and slippage. |
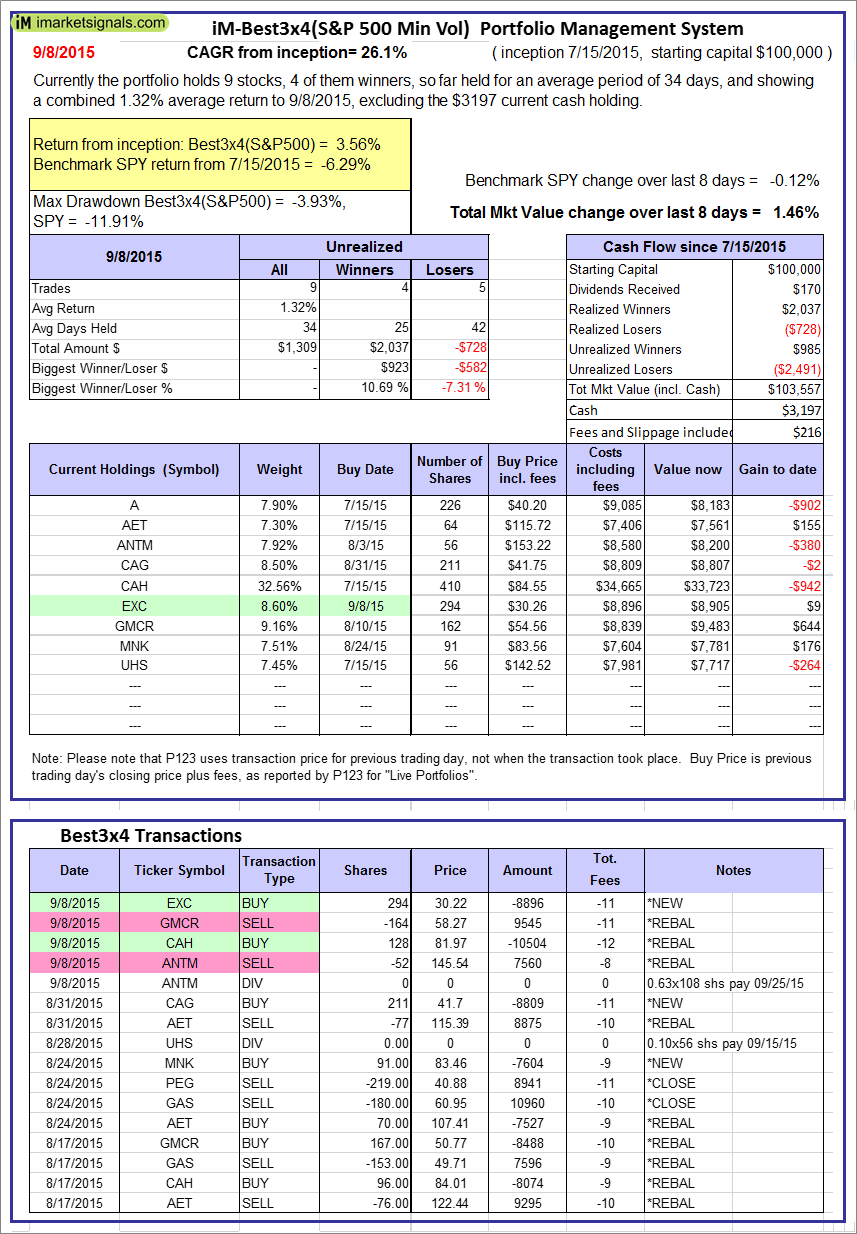 |
The iM-Best3x4(S&P 500 Min Vol) model currently holds 9 stocks, 4 of them winners, so far held for an average period of 34 days, and showing a 1.32% return to 9/8/2015. Over the previous week the market value of iM-Best3x4 gained 1.46% at a time when SPY gained -0.12%. A starting capital of $100,000 at inception on 7/15/2015 would have grown to $103,557 which includes $3,197 cash and excludes $216 spent on fees and slippage. |
 |
The iM-Best2x4(S&P 500 Min Vol) model currently holds 5 stocks, 2 of them winners, so far held for an average period of 20 days, and showing a 1.23% return to 9/8/2015. Over the previous week the market value of iM-Best2x4 gained 0.33% at a time when SPY gained -0.12%. A starting capital of $100,000 at inception on 7/16/2015 would have grown to $98,745 which includes $975 cash and excludes $178 spent on fees and slippage. |
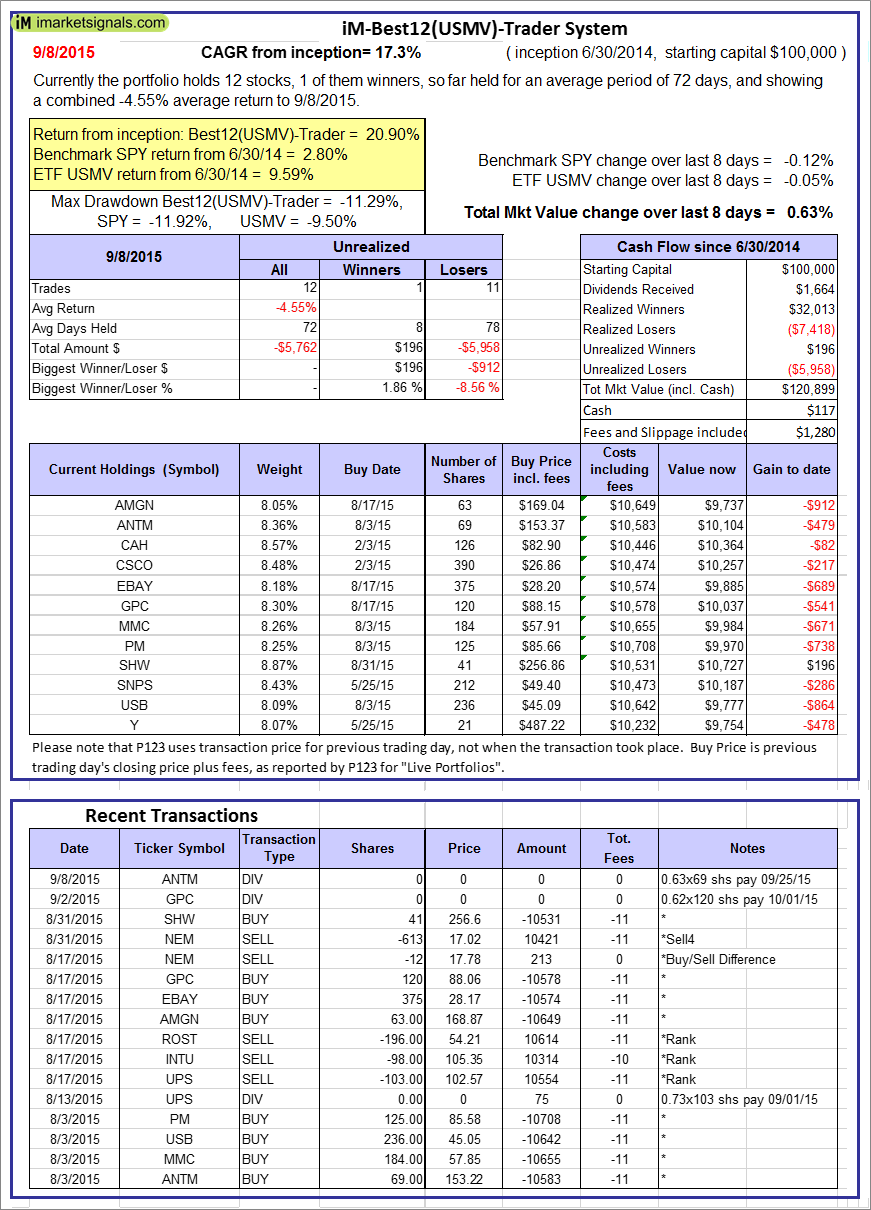 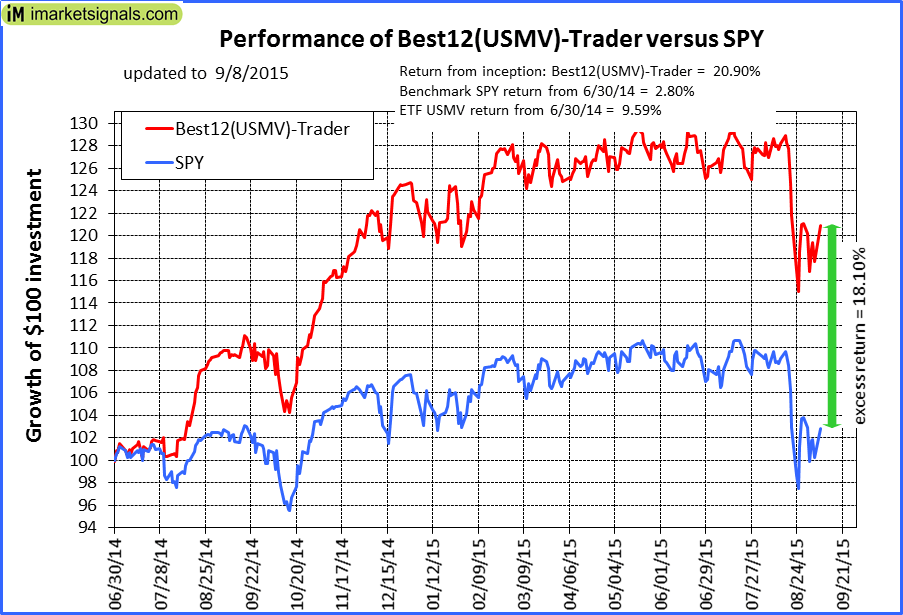 |
The iM-Best12(USMV)-Trader model currently holds 12 stocks, 1 of them winners, so far held for an average period of 72 days, and showing a -4.55% return to 9/8/2015. Since inception, on 7/1/2014, the model gained 20.90% while the benchmark SPY gained 2.80% and the ETF USMV gained 9.59% over the same period. Over the previous week the market value of iM-Best12(USMV)-Trader gained 0.63% at a time when SPY gained -0.12%. A starting capital of $100,000 at inception on 7/1/2014 would have grown to $120,899 which includes $117 cash and excludes $1,280 spent on fees and slippage. |
  |
The iM-Best12(USMV)Q1-Investor model currently holds 12 stocks, 6 of them winners, so far held for an average period of 189 days, and showing a -1.85% return to 9/8/2015. Since inception, on 1/5/2015, the model gained 2.07% while the benchmark SPY gained -1.21% and the ETF USMV gained 0.64% over the same period. Over the previous week the market value of iM-Best12(USMV)Q1 gained 0.23% at a time when SPY gained -0.12%. A starting capital of $100,000 at inception on 1/5/2015 would have grown to $102,072 which includes $389 cash and excludes $210 spent on fees and slippage. |
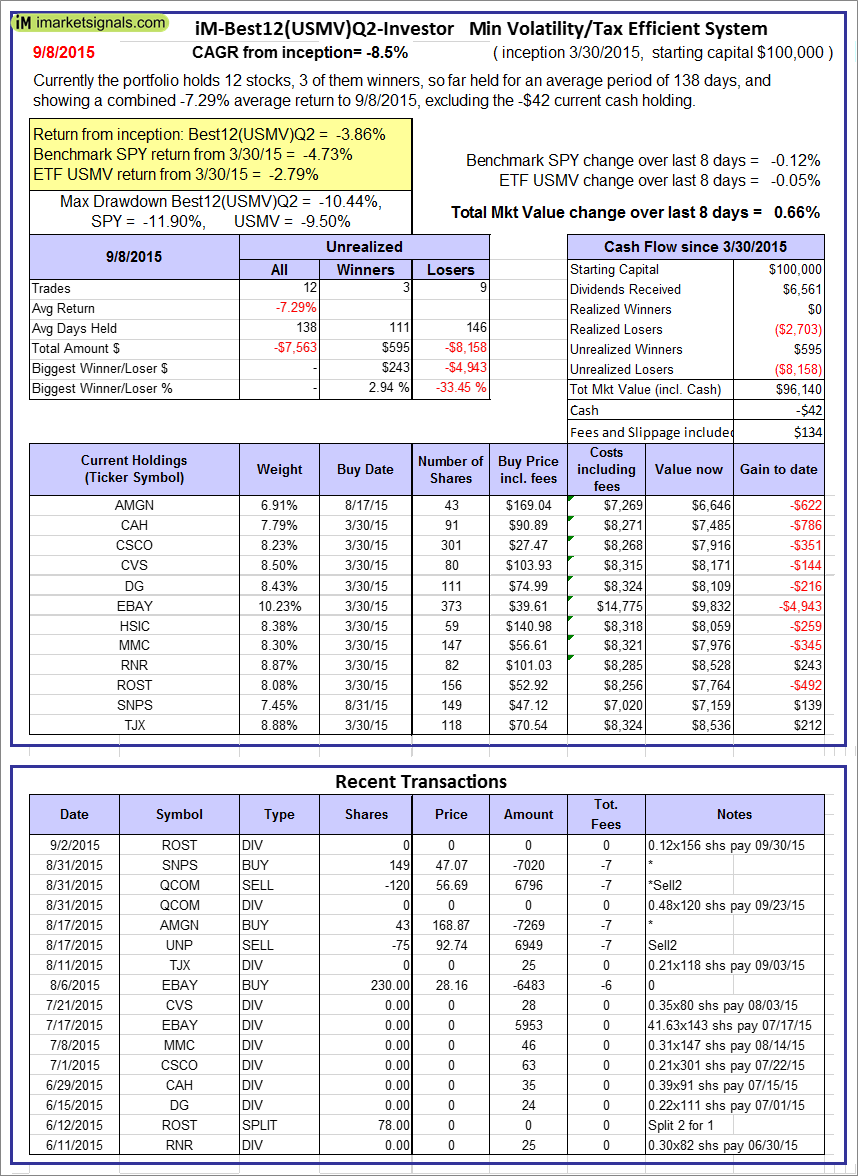 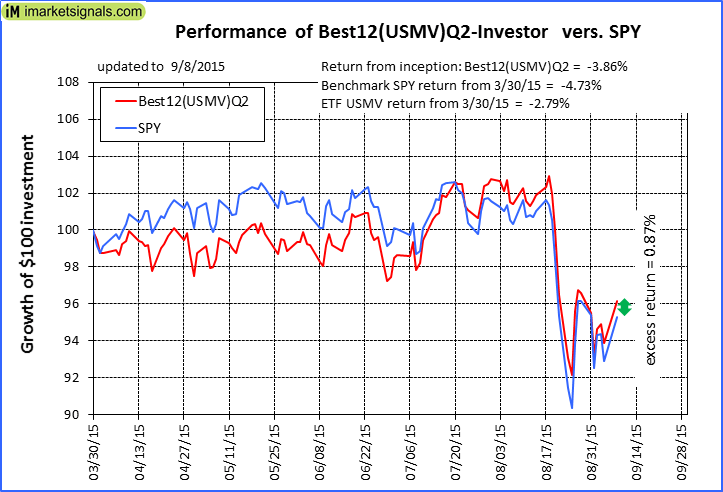 |
The iM-Best12(USMV)Q2-Investor model currently holds 12 stocks, 3 of them winners, so far held for an average period of 138 days, and showing a -7.29% return to 9/8/2015. Since inception, on 3/31/2015, the model gained -3.86% while the benchmark SPY gained -4.73% and the ETF USMV gained -2.79% over the same period. Over the previous week the market value of iM-Best12(USMV)Q2 gained 0.66% at a time when SPY gained -0.12%. A starting capital of $100,000 at inception on 3/31/2015 would have grown to $96,140 which includes -$42 cash and excludes $134 spent on fees and slippage. |
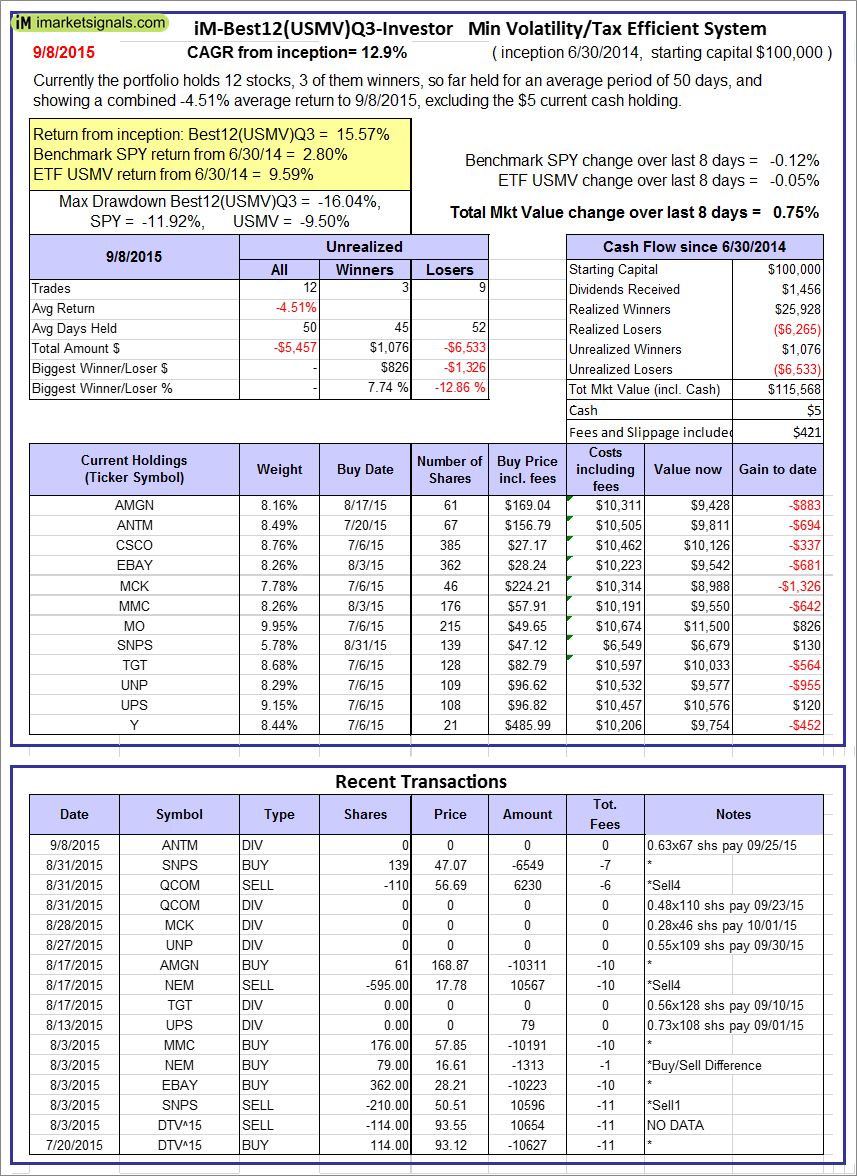 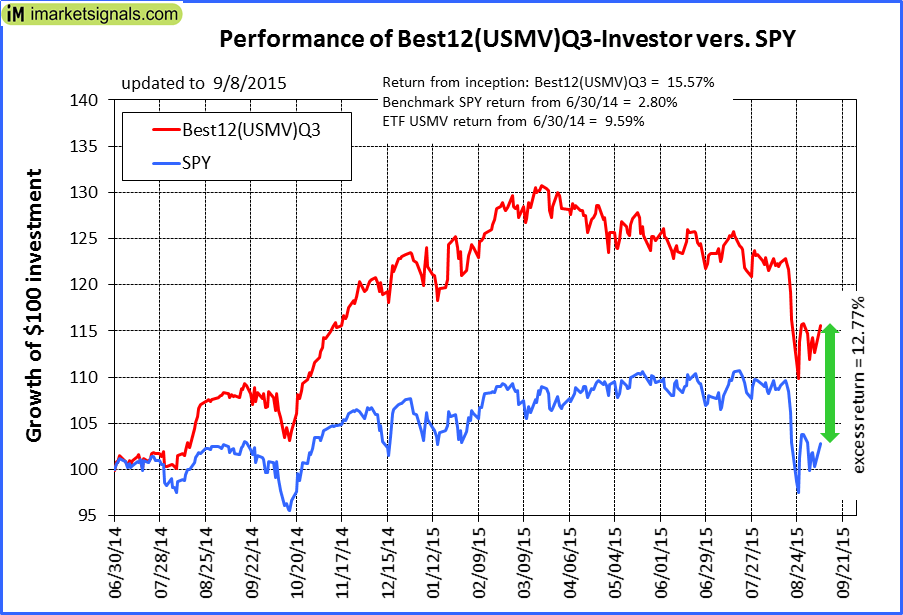 |
The iM-Best12(USMV)Q3-Investor model currently holds 12 stocks, 3 of them winners, so far held for an average period of 50 days, and showing a -4.51% return to 9/8/2015. Since inception, on 7/1/2014, the model gained 15.57% while the benchmark SPY gained 2.80% and the ETF USMV gained 9.59% over the same period. Over the previous week the market value of iM-Best12(USMV)Q3 gained 0.75% at a time when SPY gained -0.12%. A starting capital of $100,000 at inception on 7/1/2014 would have grown to $115,568 which includes $5 cash and excludes $421 spent on fees and slippage. |
  |
The iM-Best12(USMV)Q4-Investor model currently holds 12 stocks, 9 of them winners, so far held for an average period of 279 days, and showing a 6.47% return to 9/8/2015. Since inception, on 9/30/2014, the model gained 9.61% while the benchmark SPY gained 1.43% and the ETF USMV gained 8.08% over the same period. Over the previous week the market value of iM-Best12(USMV)Q4 gained -0.33% at a time when SPY gained -0.12%. A starting capital of $100,000 at inception on 9/30/2014 would have grown to $109,610 which includes $110 cash and excludes $196 spent on fees and slippage. |
 |
Average Performance of iM-Best12(USMV)Q1+Q2+Q3+Q4-Investor resulted in an excess return of 17.15% over SPY. (see iM-USMV Investor Portfolio) |
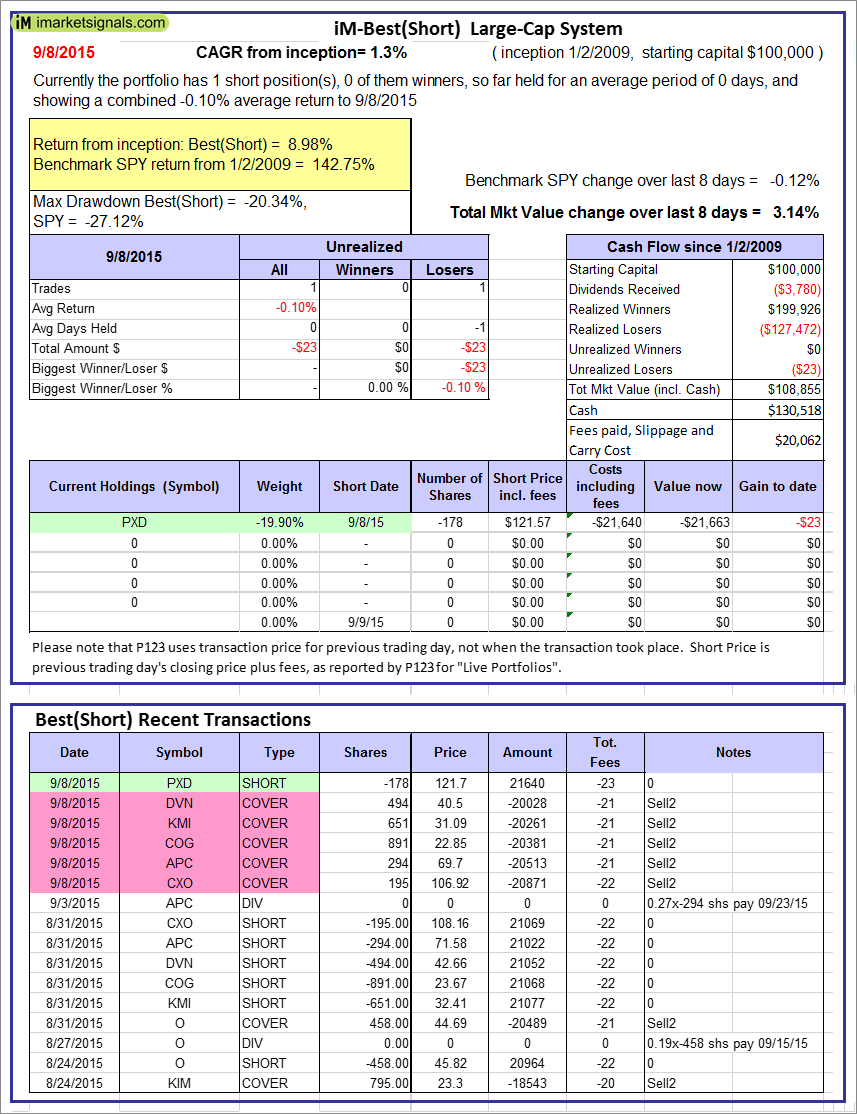 |
The iM-Best(Short) model currently holds 1 position(s). Over the previous week the market value of iM-Best(Short) gained 3.14% at a time when SPY gained -0.12%. Over the period 1/2/2009 to 9/8/2015 the starting capital of $100,000 would have grown to $108,855 which includes $130,518 cash and excludes $20,062 spent on fees and slippage. |
iM-Best Reports – 9/8/2015
Posted in pmp SPY-SH
Leave a Reply
You must be logged in to post a comment.