Bond-market:
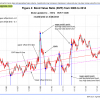
 The BVR-model avoids high beta bonds (long-bonds) and also intermediate duration bonds. The Bond Value Ratio is shown in Fig 4. The BVR is near last week’s level. According to the model, only when BVR turns upward after having been lower than the lower offset-line should one consider long bonds again.
The Yield Curve:
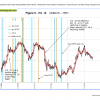
 The yield curve model shows the generally steepening trend of the 10-year and 2-year Treasuries yield spread. Figure 5 charts (i10 – i2). The general trend is up, as one can see, although the yield curve has flattened recently. FLAT and STPP are ETNs. STPP profits from a steepening yield curve and FLAT increases in value when the yield curve flattens. This model confirms the direction of the BVR.
Gold:
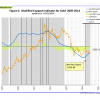
 The modified Coppock Gold indicator shown in Fig 6. and is now invested.
This indicator is described in Is it Time to Buy Gold Again? – Wait for the buy signal …….
Silver:
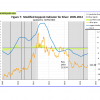
 The modified Coppock Silver indicator shown in Fig 7 and is currently invested.
This indicator is described in Silver – Better Than Gold: A Modified Coppock Indicator for Silver.

Georg, quick question. The more I look the more I really like the FLAT/STPP model and am thinking about adding it to my mix. Have you been able to model this in P123? I would be interested in what your max drawdown has been over the last decade, and what the correlation looks like when you put it in a Book with your other imBest timing systems. Thanks.
–Tom C
Tom,
You can’t run the yield curve model FLAT/STPP in P123. This runs in an excel spreadsheet which tries to find significant turning points in the differential of the 10-yr and 2-yr treasury yields. FLAT and STPP are thinly traded and signals don’t occur very often. We don’t have a drawdown figure because there are no daily performance values, only differences between buy and sell values from which one can calculate the overall performance.
No problem, I can take your in and out dates, and do a quick and dirty analysis using the charts. Thanks Georg.