Market Signals Summary:
The IBH stock market model is out of the market. The MAC stock market model is invested, the bond market model avoids high beta (long) bonds, the yield curve may resume its steepening trend, the gold model is not invested, but the silver model is invested. The recession indicator COMP is little changed from last week’s level. Please also scroll down to the bottom of the updates where we have added two charts, the unemployment rate and the Coppock indicator for the S&P, which will be updated monthly after the new unemployment figures are announced.
Stock-market:
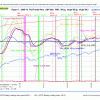 The IBH-USA model is out of the market as shown in Fig. 1. A sell signal was generated seven weeks ago when the WLIg_shortEMA moved below the WLIg_longEMA. A confirming sell-B signal was generated on 5-8-13 with the S&P at 1632. So if the model had not sold earlier it would have sold this week. Requirements for a sell-B signal are here.
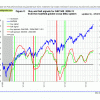 The MAC-USA model stays invested. MAC Fig 2 shows the spreads of the moving averages, both levels higher than last week; they may be in the process of forming a top (rolling over). The sell spread (red graph) has to move below the zero line for a sell signal.
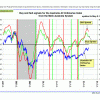 The MAC-Australia model stays invested. The spreads of the moving averages, have recently made a top (rolled over). This may forecast market declines. The sell spread (red graph) has to move below the zero line for a sell signal. This model is described fully here
Bond-market:
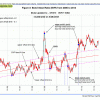 The BVR-model avoids high beta bonds (long-bonds) and also intermediate duration bonds.
The Bond Value Ratio is shown in Fig 3. The BVR is considerably lower than last week’s level, with the overall trend downwards. Bond yields are reacting now to the declining unemployment rate. More employment means more demand, which means more inflation, which means higher interest rates. In the longer term BVR will reach the long-term trendline and long-bond investors will have suffered considerable losses by then.
The Yield Curve:
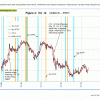 The yield curve model shows the steepening trend, and seems to be steepening again after the recent an interim mini-top. Figure 4 charts (i10 – i2). The trend is still up as one can see. FLAT and STPP are ETNs. STPP profits from a steepening yield curve and FLAT increases in value when the yield curve flattens. This model confirms the direction of the BVR.
Recession:
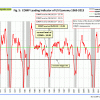 In Fig 5 one can see that COMP is unchanged from last week’s level. It is far away from signaling recession. COMP can be used for stock market exit timing as discussed in this article The Use of Recession Indicators in Stock Market Timing.
Gold:
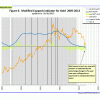 There is no buy-signal from the modified Coppock Gold indicator shown in Fig 6. This model has been out of Gold since Nov-26-2012. Gold would have to make a sustained move to $1700 and higher over the next few weeks for a buy signal according to my projections. This seems highly unlikely in view of the recent price decline. This indicator is described inIs it Time to Buy Gold Again? – Wait for the buy signal …….
Silver:
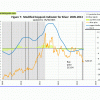 There was a buy-signal recently from the modified Coppock Silver indicator shown in Fig 7. The current price is close to the buy price. This indicator is described inSilver – Better Than Gold: A Modified Coppock Indicator for Silver
