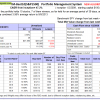
 Currently the portfolio holds 10 stocks, 7 of them winners, so far held for an average period of 39 days, and showing combined 3% average return to 9/9/2013
A starting capital of $100,000 at inception of 1/2/2009 would have grown to $612,992 which includes $324 cash and excludes $37,568 spent on fees and slippage.
| Best10(S&P 1500) | Weekly Change | ||
| Date | Mkt. Value | Best10 | SPY |
| 08/25/14 | $839,128 | 1.85% | 1.44% |
| 08/18/14 | $823,895 | 3.28% | 1.84% |
| 08/11/14 | $797,730 | -0.34% | -0.05% |
| 08/04/14 | $800,486 | 0.05% | -1.97% |
| 07/28/14 | $800,060 | 1.91% | 0.23% |
| 07/21/14 | $785,076 | -0.43 | -0.13 |
| 07/14/14 | $788,459 | -1.78% | 0.05% |
| 07/07/14 | $802,720 | 1.77% | 0.91% |
| 06/30/14 | $788,788 | 0.68% | -0.08% |
| 06/23/14 | $783,482 | 1.41% | 1.30% |
| 06/16/14 | $772,592 | -0.61% | -0.66% |
| 06/10/14 | $777,303 | 2.26% | 1.39% |
| 06/02/14 | $760,145 | -0.23% | 0.72% |
| 05/27/14 | $761,893 | 2.71% | 1.47% |
| 05/19/14 | $741,812 | -0.77% | -0.55% |
| 05/12/14 | $747,572 | -0.09% | 0.73% |
| 05/05/14 | $748,216 | 0.41% | 0.82% |
| 04/28/14 | $745,146 | -0.53% | -0.08% |
| 04/21/14 | $749,109 | 2.93% | 2.24% |
| 04/14/14 | $727,790 | -1.33% | -0.76% |
| 04/07/14 | $737,610 | -2.32% | -1.43% |
| 03/31/14 | $755,107 | 1.40% | 0.85% |
| 03/24/14 | $744,712 | -0.15% | -0.04 |
| 03/17/14 | $745,830 | -0.92% | -0.97% |
| 03/10/14 | $752,747 | 1.42% | 1.72% |
| 03/03/14 | $742,164 | 0.68% | 0.04% |
| 02/24/14 | $737,186 | 0.14% | 0.36% |
| 02/18/14 | $736,126 | 2.99% | 2.35% |
| 02/10/14 | $714,757 | 2.31% | 3.35% |
| 02/03/14 | $698,639 | -2.60% | -2.16% |
| 01/27/14 | $717,288 | -3.83% | -3.35% |
| 01/21/14 | $745,878 | 1.10% | 1.37% |
| 01/13/14 | $737,765 | 0.86% | -0.37% |
| 01/06/14 | $731,483 | -0.49% | -0.79% |
| 12/30/13 | $735,108 | 3.12% | 0.71% |
| 12/23/13 | $712,843 | 2.75% | 2.40% |
| 12/16/13 | $693,781 | -0.46% | -1.21% |
| 12/09/13 | $697,019 | 0.08% | 0.48% |
| 12/02/13 | $696,480 | 0.43% | -0.06% |
| 11/25/13 | $693,493 | 0.38% | 0.67% |
| 11/18/13 | $690,839 | 2.54% | 1.19% |
| 11/11/13 | $673,755 | 3.13% | 0.28% |
| 11/04/13 | $653,289 | 3.84% | 0.34% |
| 10/28/13 | $629,132 | -0.31% | 1.05% |
| 10/21/13 | $631,108 | 1.50% | 2.02% |
| 10/14/13 | $621,752 | 2.60% | 2.10% |
| 10/07/13 | $606,001 | -0.29% | -0.35% |
| 09/30/13 | $607,761 | -0.72% | -1.13% |
| 09/23/17 | $612,195 | -0.58% | -0.18% |
| 09/17/13 | $615,742 | 0.45% | 2.05% |
| 09/09/13 | $612,992 | 3.09% | 1.97% |
| 09/03/13 | $583,574 | -2.53% | -0.97% |
| 08/26/13 | $598,698 | 1.20% | 0.74% |
| 08/19/13 | $591,625 | -3.59% | -2.57% |
| 08/12/13 | $613,680 | -0.16% | -0.93% |
| 08/05/13 | $614,653 | 3.39% | 1.25% |
| 07/29/13 | $594,511 | -0.22% | -0.54% |
| New Algorithm at P123 (see note on 7-29-13) | |||
| 07/22/13 | $618,264 | -0.63% | 0.80% |
| 07/15/13 | $622,406 | 4.47% | 2.57% |
| 07/08/13 | $595,782 | Start of Live Trading | |
| 01/02/09 | $100,000 | Best10 Inception | |

Are you no longer showing transactions in the weekly Best 10 update?
Ted
No, not anymore. Nothing useful is conveyed by having the transaction listed. We provide holdings only, and one can figure out from historic data, what was bought and what was sold.
OK, You’re right