
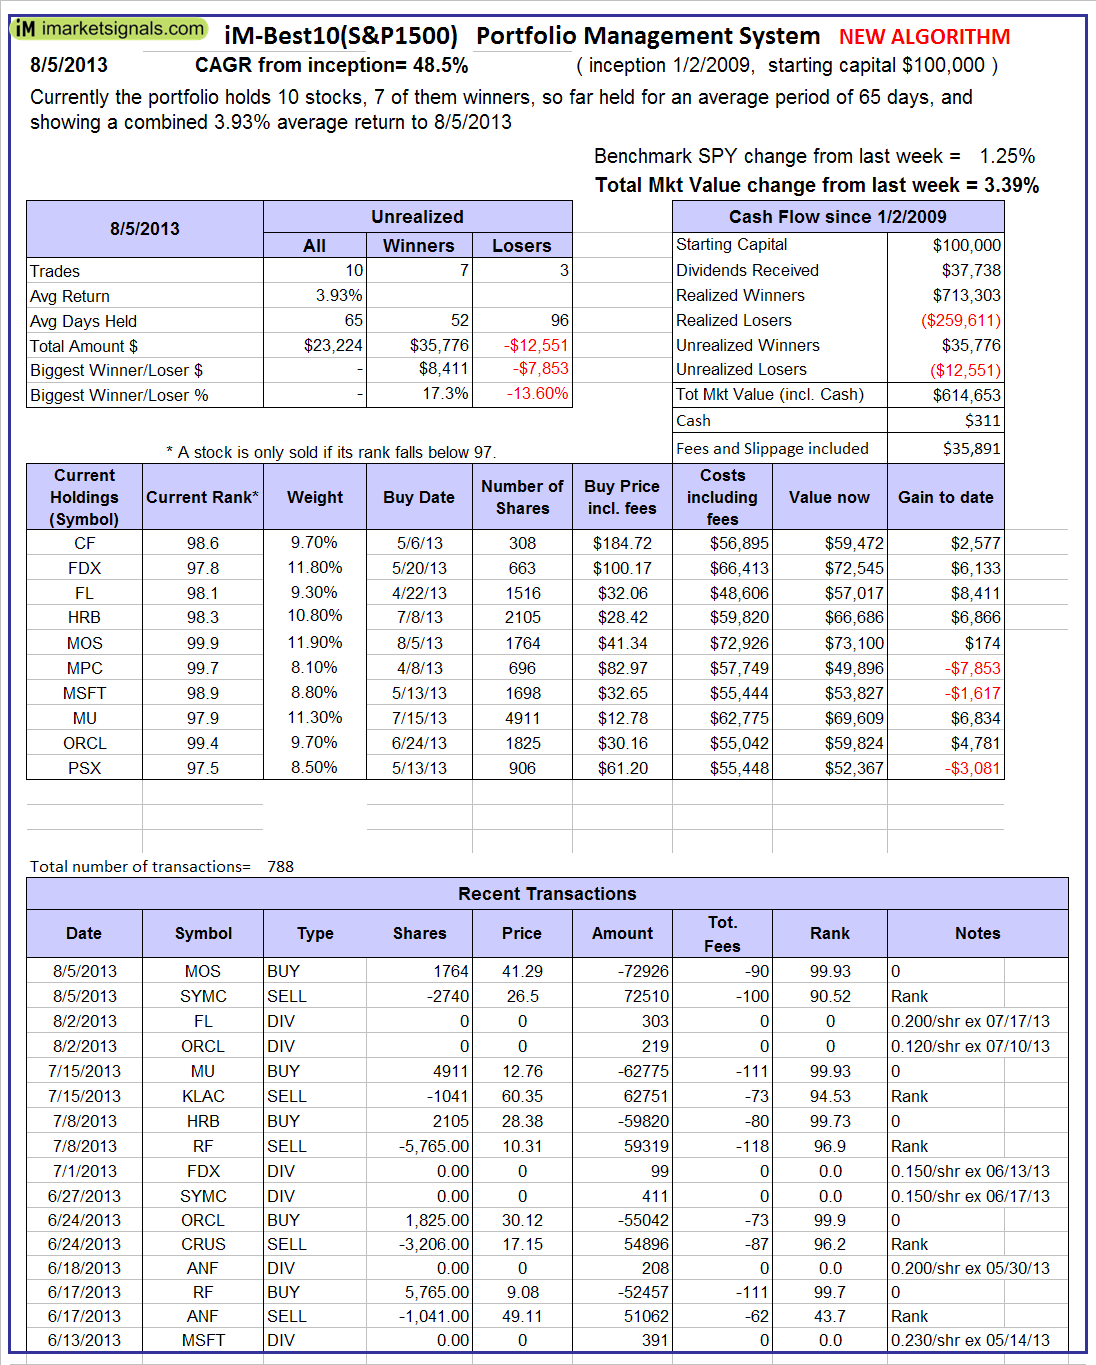
 Currently the portfolio holds 10 stocks, 7 of them winners, so far held for an average period of 65 days, and showing combined 3.93% average return to 8/5/2013
A starting capital of $100,000 at inception of 1/2/2009 would have grown to $614,653 which includes $311 cash and excludes $35,891spent on fees and slippage.
The Best10(S&P 1500) model’s number of seats at R2G were limited to 20 to avoid affecting the actual stock prices when the trading signal are issued, all seats are subscribed.
| Best10(S&P 1500) | Weekly Change | ||
| Date | Mkt. Value | Best10 | SPY |
| 08/25/14 | $839,128 | 1.85% | 1.44% |
| 08/18/14 | $823,895 | 3.28% | 1.84% |
| 08/11/14 | $797,730 | -0.34% | -0.05% |
| 08/04/14 | $800,486 | 0.05% | -1.97% |
| 07/28/14 | $800,060 | 1.91% | 0.23% |
| 07/21/14 | $785,076 | -0.43 | -0.13 |
| 07/14/14 | $788,459 | -1.78% | 0.05% |
| 07/07/14 | $802,720 | 1.77% | 0.91% |
| 06/30/14 | $788,788 | 0.68% | -0.08% |
| 06/23/14 | $783,482 | 1.41% | 1.30% |
| 06/16/14 | $772,592 | -0.61% | -0.66% |
| 06/10/14 | $777,303 | 2.26% | 1.39% |
| 06/02/14 | $760,145 | -0.23% | 0.72% |
| 05/27/14 | $761,893 | 2.71% | 1.47% |
| 05/19/14 | $741,812 | -0.77% | -0.55% |
| 05/12/14 | $747,572 | -0.09% | 0.73% |
| 05/05/14 | $748,216 | 0.41% | 0.82% |
| 04/28/14 | $745,146 | -0.53% | -0.08% |
| 04/21/14 | $749,109 | 2.93% | 2.24% |
| 04/14/14 | $727,790 | -1.33% | -0.76% |
| 04/07/14 | $737,610 | -2.32% | -1.43% |
| 03/31/14 | $755,107 | 1.40% | 0.85% |
| 03/24/14 | $744,712 | -0.15% | -0.04 |
| 03/17/14 | $745,830 | -0.92% | -0.97% |
| 03/10/14 | $752,747 | 1.42% | 1.72% |
| 03/03/14 | $742,164 | 0.68% | 0.04% |
| 02/24/14 | $737,186 | 0.14% | 0.36% |
| 02/18/14 | $736,126 | 2.99% | 2.35% |
| 02/10/14 | $714,757 | 2.31% | 3.35% |
| 02/03/14 | $698,639 | -2.60% | -2.16% |
| 01/27/14 | $717,288 | -3.83% | -3.35% |
| 01/21/14 | $745,878 | 1.10% | 1.37% |
| 01/13/14 | $737,765 | 0.86% | -0.37% |
| 01/06/14 | $731,483 | -0.49% | -0.79% |
| 12/30/13 | $735,108 | 3.12% | 0.71% |
| 12/23/13 | $712,843 | 2.75% | 2.40% |
| 12/16/13 | $693,781 | -0.46% | -1.21% |
| 12/09/13 | $697,019 | 0.08% | 0.48% |
| 12/02/13 | $696,480 | 0.43% | -0.06% |
| 11/25/13 | $693,493 | 0.38% | 0.67% |
| 11/18/13 | $690,839 | 2.54% | 1.19% |
| 11/11/13 | $673,755 | 3.13% | 0.28% |
| 11/04/13 | $653,289 | 3.84% | 0.34% |
| 10/28/13 | $629,132 | -0.31% | 1.05% |
| 10/21/13 | $631,108 | 1.50% | 2.02% |
| 10/14/13 | $621,752 | 2.60% | 2.10% |
| 10/07/13 | $606,001 | -0.29% | -0.35% |
| 09/30/13 | $607,761 | -0.72% | -1.13% |
| 09/23/17 | $612,195 | -0.58% | -0.18% |
| 09/17/13 | $615,742 | 0.45% | 2.05% |
| 09/09/13 | $612,992 | 3.09% | 1.97% |
| 09/03/13 | $583,574 | -2.53% | -0.97% |
| 08/26/13 | $598,698 | 1.20% | 0.74% |
| 08/19/13 | $591,625 | -3.59% | -2.57% |
| 08/12/13 | $613,680 | -0.16% | -0.93% |
| 08/05/13 | $614,653 | 3.39% | 1.25% |
| 07/29/13 | $594,511 | -0.22% | -0.54% |
| New Algorithm at P123 (see note on 7-29-13) | |||
| 07/22/13 | $618,264 | -0.63% | 0.80% |
| 07/15/13 | $622,406 | 4.47% | 2.57% |
| 07/08/13 | $595,782 | Start of Live Trading | |
| 01/02/09 | $100,000 | Best10 Inception | |
Any chance you could post the CAGR and annual performance from 1999 when this portfolio is lagged a week. In other words is the performance difference significantly worse when buying and selling one week later?
I don’t have this information. I suggest you watch the updates for a while and compare the performance over time to answer this question.
For example, on Monday, Aug-5, the recommendation was to sell SYMC @ $26.50 and buy MOS @ $41.29. On Friday when the update was published SYMC closed at $26.82 and MOS @ 42.51, both higher by 1.2% and 3.0%, respectively – the trade providing a 1.8% positive return for the week.
Are you sure the symbol MOS is the correct one added to the model
It appears so out of the norm of what the chart for all of the others look like. The ranking on it must have cratered at the end of July. How can it be 99
I have no control over what the model selects. The ranking system looks for undervalued stocks in relation to the others. One should always make up one’s own mind whether to buy a stock or not.