Stock-market:
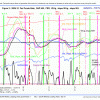 ECRI reported the WLI at a level of 122.2 and the six months smoothed annualized growth WLIg at +4.6%, as shown in Fig 2. almost identical to our shadow WLI. Five weeks ago the IBH model generated a sell-basic signal and 2 days later a sell A signal, indicating that the model had exited the S&P500. For those who are new to the IBH model, sell-basic is a warning signal to get ready to sell, it is not a sell signal, and it can be voided when a subsequent buy signal appears, before a sell A signal. Sell C does not need a sell-basic signal. It is so far not obvious that this was a good sell signal with the various indicator graphs now appearing to be heading higher. So far the S&P has gained since the sell signal.
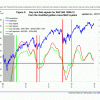 MAC Fig 3 shows the spreads of the moving averages. The sell spread (red graph) has declined a bit more from last week, but may be in the early stage of forming a trough. No sell signal has so far been generated from this model. The model stays invested.
Bond-market:
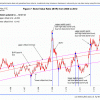 The Bond Value Ratio is shown in Fig 7. The BVR has declined from last week, indicating losses for long bonds over this period. In the longer term BVR will reach the long-term trendline and long-bond investors will have suffered considerable losses by then. The model stays invested in low beta bonds.
The Yield Curve:
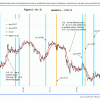 Figure 5 charts (i10 – i2). The trend seems to be up – the model expects the yield curve to steepen. FLAT and STPP are ETNs. STPP profits from a steepening yield curve and FLAT increases in value when the yield curve flattens.
The Elusive Recession of 2012:
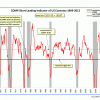 It is now becoming quite obvious that the recession forecasters have been consistently wrong since 2010. In particular ECRI still wants us to believe that we are in a recession, which according to them started in July 2012. There are no economic indicators which support this position. Attached is the updated COMP which gained 4 points since last week and the trajectory is upwards
