Article first published on Advisor Perspectives August 14, 2012
In my article Get Ready for the Next Great Bull Market I showed that when the spread between the 50- and 200-month moving average of the S&P forms a trough, it identifies beginnings of major bull markets. Accordingly a new bull market should start at the end of this year. My further analysis, using an adjusted normalized price to earnings ratio, indicates that a major bull market has already started in 2009.
Most of us are familiar with the Shiller cyclically adjusted price to earnings ratio of the S&P. It is the real price of the S&P divided by the average of the real earnings over the preceding 10 years and is identified as P/E10 in Shiller’s S&P data series. The 10 year period seems to have been arbitrarily chosen so as to minimize the effects of business cycles. I am using P/E5 for my analysis, which is the real price of the S&P divided by the average of the real earnings over the preceding 5 years.
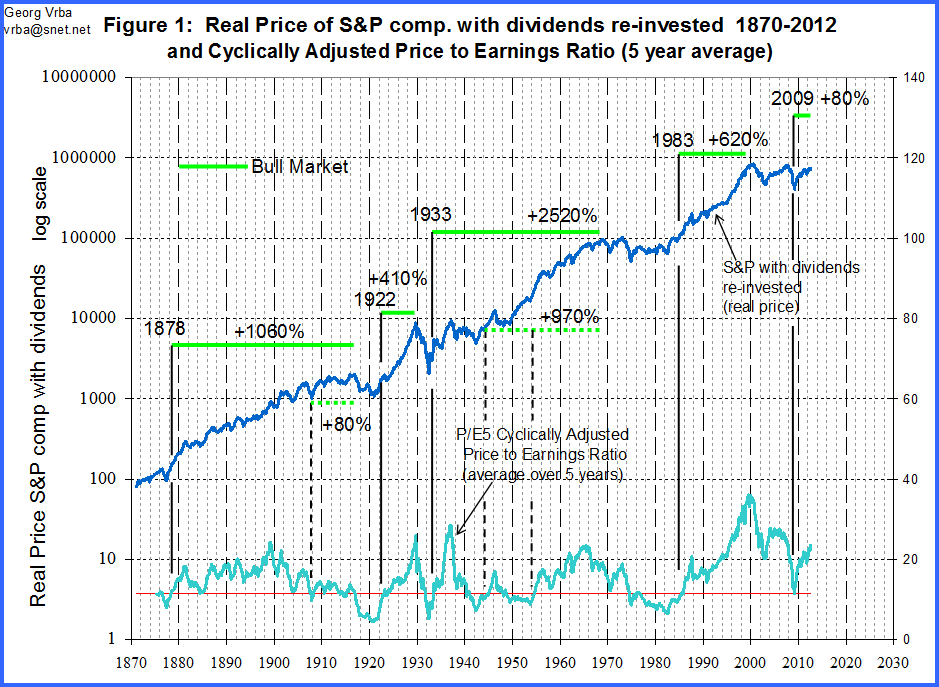
From the Shiller data I have calculated the real values of the S&P composite with dividends reinvested (S&P-real), which is shown together with P/E5 in figure 1 below. I did this in order to have all the data in real values, not only P/E5, and since I wanted to compare recent market action with that of the past. One can see that $100 invested in 1873 would have grown over 139 years to about $740,000 by 2012 for a real average annual return of 6.62%.
But the object of my exercise was to identify previous market direction after P/E5 levels equal to the low level of 11.38 which occurred in March 2009. One can see on figure 1 that there were four major bull markets which started when P/E5 moved from below to above the criterion level of 13.40, and there were three sub-bull markets as well which coincided with the major ones.
There is no reason to believe that this time its different. There is no indication on this historical chart that there was ever a major bear market following a P/E5 move from below to above 13.40. Contrary to this evidence there are plenty of perma-bears (who do well for themselves collecting fund managing fees) who warn us with weekly missives of the imminent demise of the stock market.
However, the historic data based on P/E5 suggests that we are experiencing a new bull market which may continue for quite a few years, which is the same conclusion arrived from the trough formation of the 50- and 200-month moving average of the S&P, an entirely unrelated indicator.

