
  |
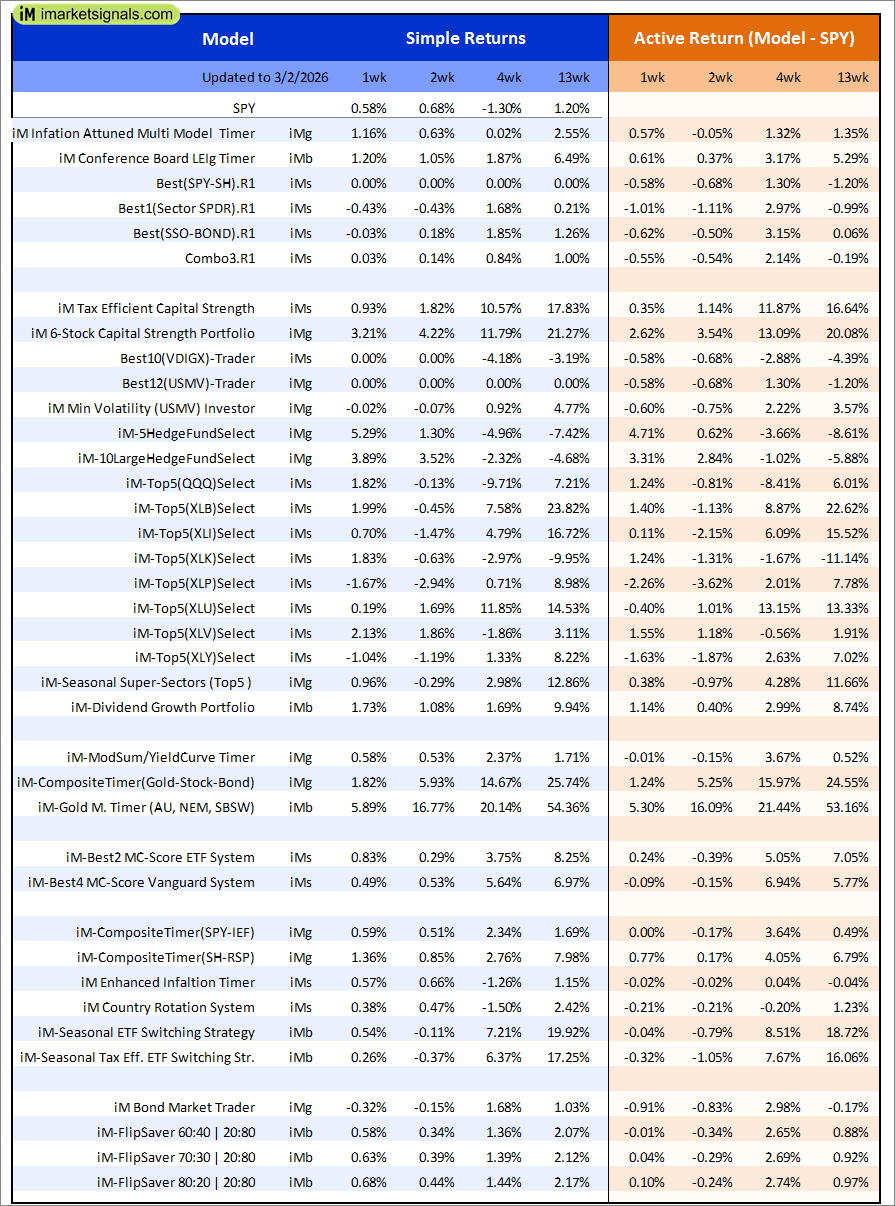
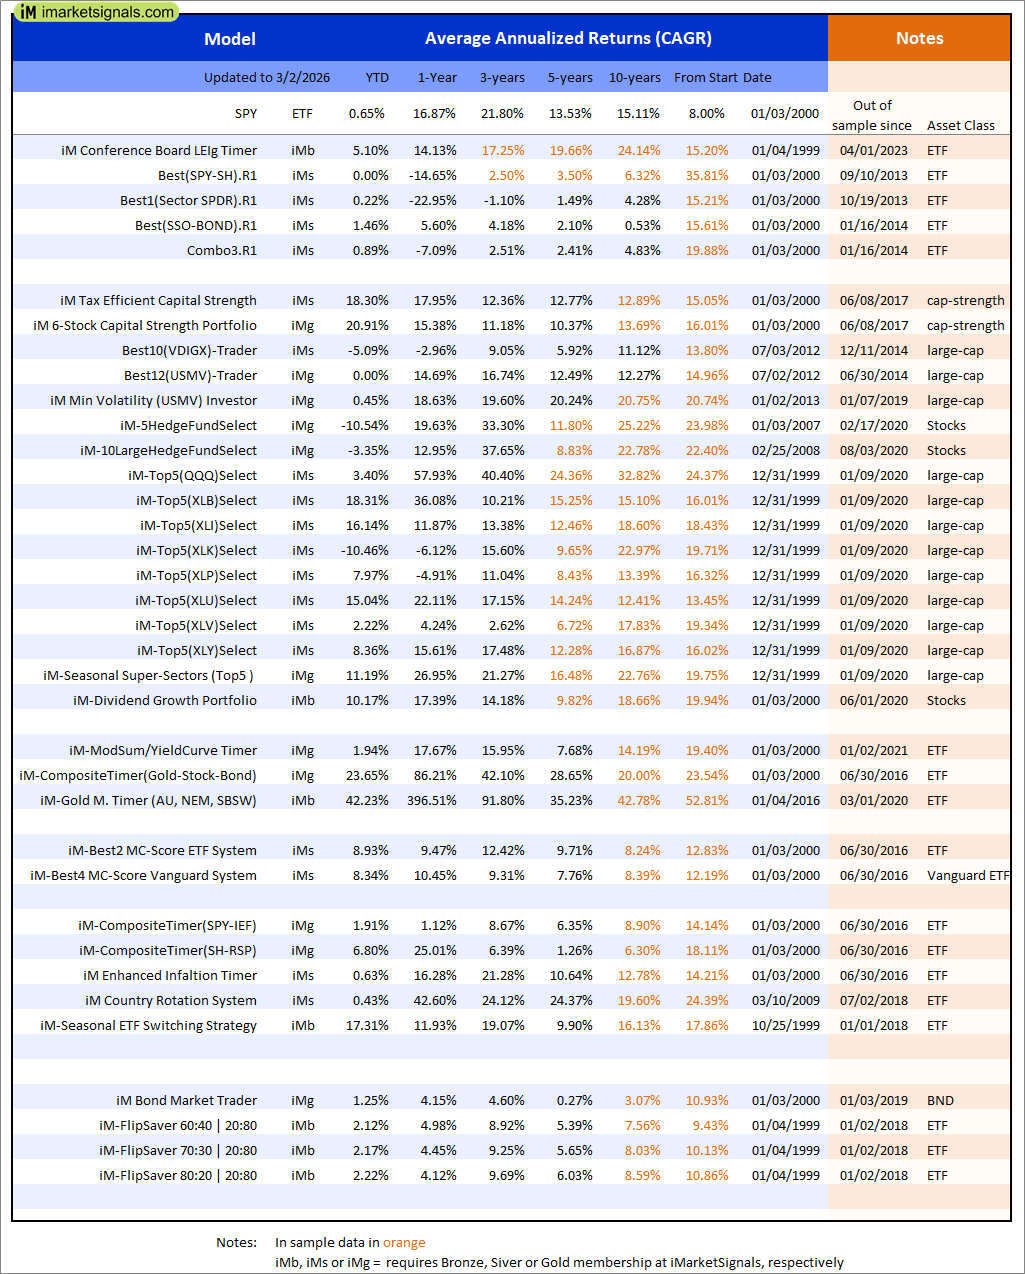
Out of sample performance summary of our models for the past 1, 2, 4 and 13 week periods. The active active return indicates how the models over- or underperformed the benchmark ETF SPY. Also the YTD, and the 1-, 3-, 5- and 10-year annualized returns are shown in the second table |
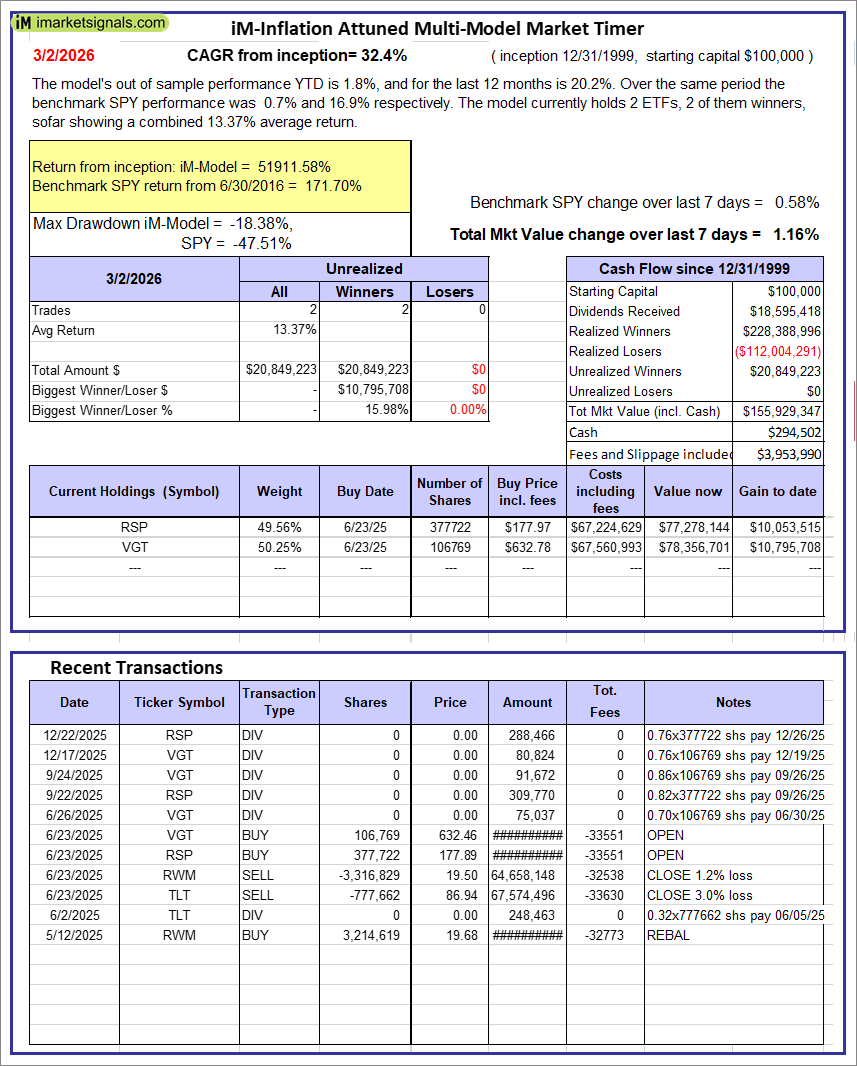 |
iM-Inflation Attuned Multi-Model Market Timer: The model’s out of sample performance YTD is 1.8%, and for the last 12 months is 20.2%. Over the same period the benchmark SPY performance was 0.7% and 16.9% respectively. Over the previous week the market value of the iM-Inflation Attuned Multi-Model Market Timer gained 1.16% at a time when SPY gained 0.58%. A starting capital of $100,000 at inception on 3/24/2017 would have grown to $155,929,347 which includes $294,502 cash and excludes $3,953,990 spent on fees and slippage. |
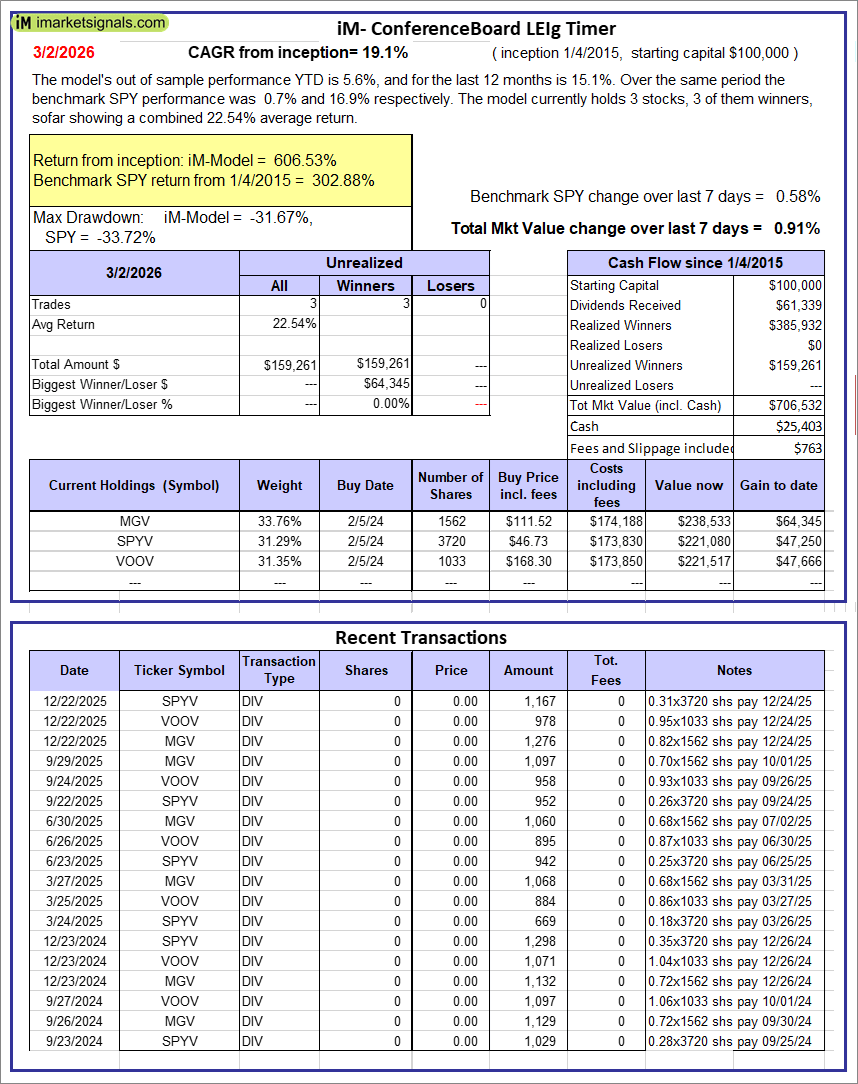 |
iM-Conference Board LEIg Timer: The model’s performance YTD is 14.3%, and for the last 12 months is 7.3%. Over the same period the benchmark SPY performance was 20.1% and 9.4% respectively. Over the previous week the market value of the iM-Conference Board LEIg Timer gained 0.91% at a time when SPY gained 0.58%. A starting capital of $100,000 at inception on 4/5/2017 would have grown to $706,532 which includes $25,403 cash and excludes $763 spent on fees and slippage. |
 |
iM-FlipSaver 60:40 | 20:80 – 2017: The model’s out of sample performance YTD is 2.1%, and for the last 12 months is 4.8%. Over the same period the benchmark E60B40 performance was 1.0% and 12.8% respectively. Over the previous week the market value of iM-FlipSaver 80:20 | 20:80 gained 0.58% at a time when SPY gained 0.30%. A starting capital of $100,000 at inception on 7/16/2015 would have grown to $183,170 which includes -$11 cash and excludes $5,611 spent on fees and slippage. |
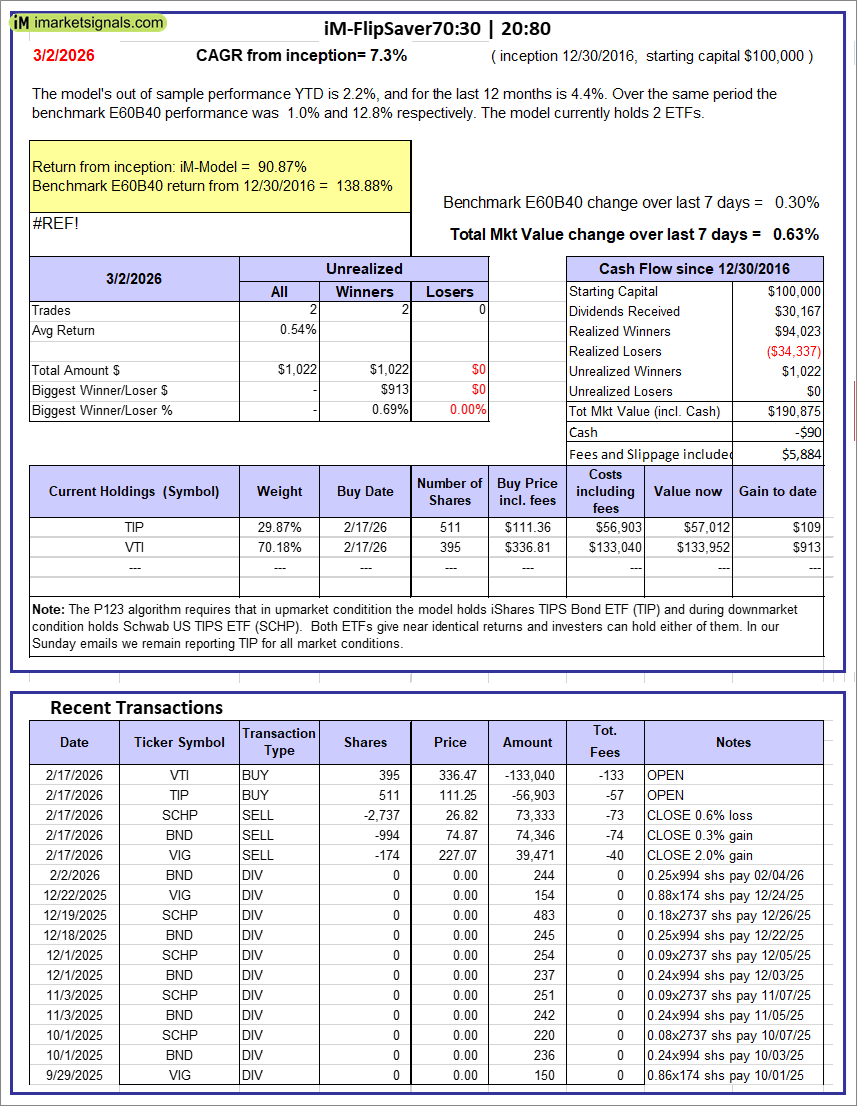 |
iM-FlipSaver 70:30 | 20:80 – 2017: The model’s out of sample performance YTD is 2.2%, and for the last 12 months is 4.4%. Over the same period the benchmark E60B40 performance was 1.0% and 12.8% respectively. Over the previous week the market value of iM-FlipSaver 70:30 | 20:80 gained 0.63% at a time when SPY gained 0.30%. A starting capital of $100,000 at inception on 7/15/2015 would have grown to $190,875 which includes -$90 cash and excludes $5,884 spent on fees and slippage. |
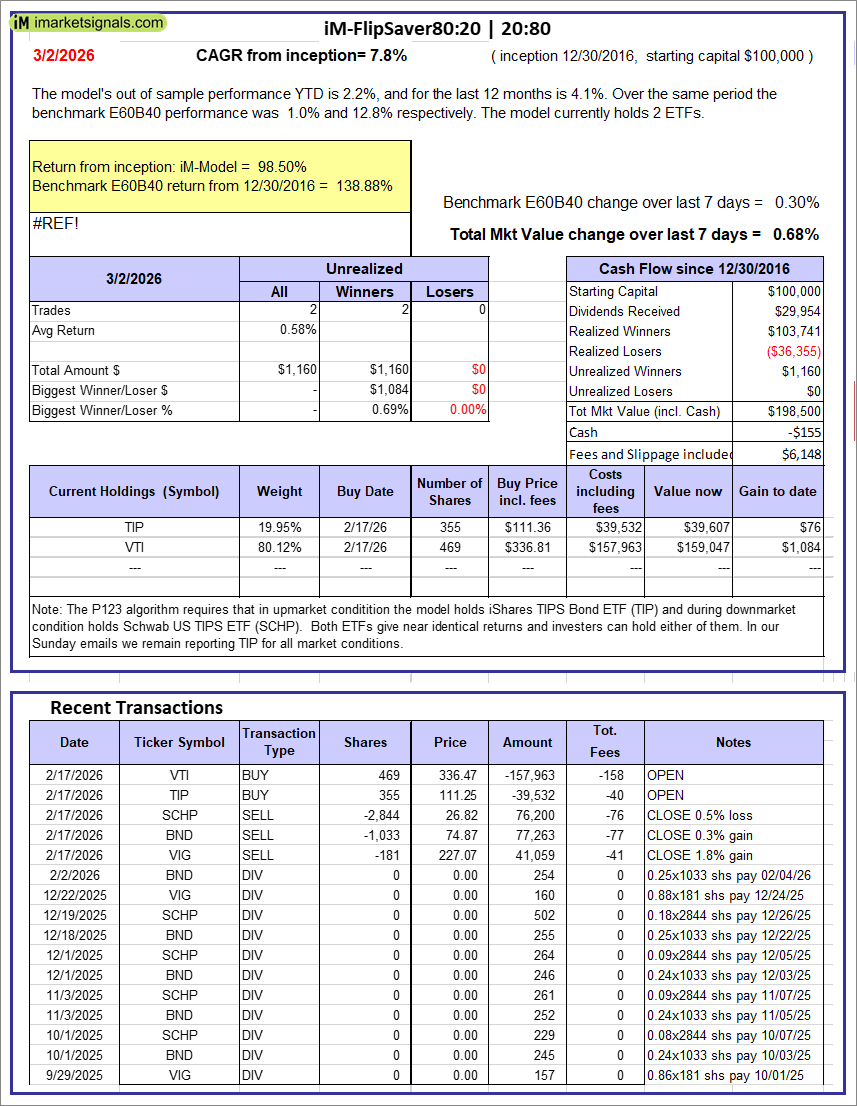 |
iM-FlipSaver 80:20 | 20:80 – 2017: The model’s out of sample performance YTD is 2.2%, and for the last 12 months is 4.1%. Over the same period the benchmark E60B40 performance was 1.0% and 12.8% respectively. Over the previous week the market value of iM-FlipSaver 80:20 | 20:80 gained 0.68% at a time when SPY gained 0.30%. A starting capital of $100,000 at inception on 1/2/2017 would have grown to $198,500 which includes -$155 cash and excludes $6,148 spent on fees and slippage. |
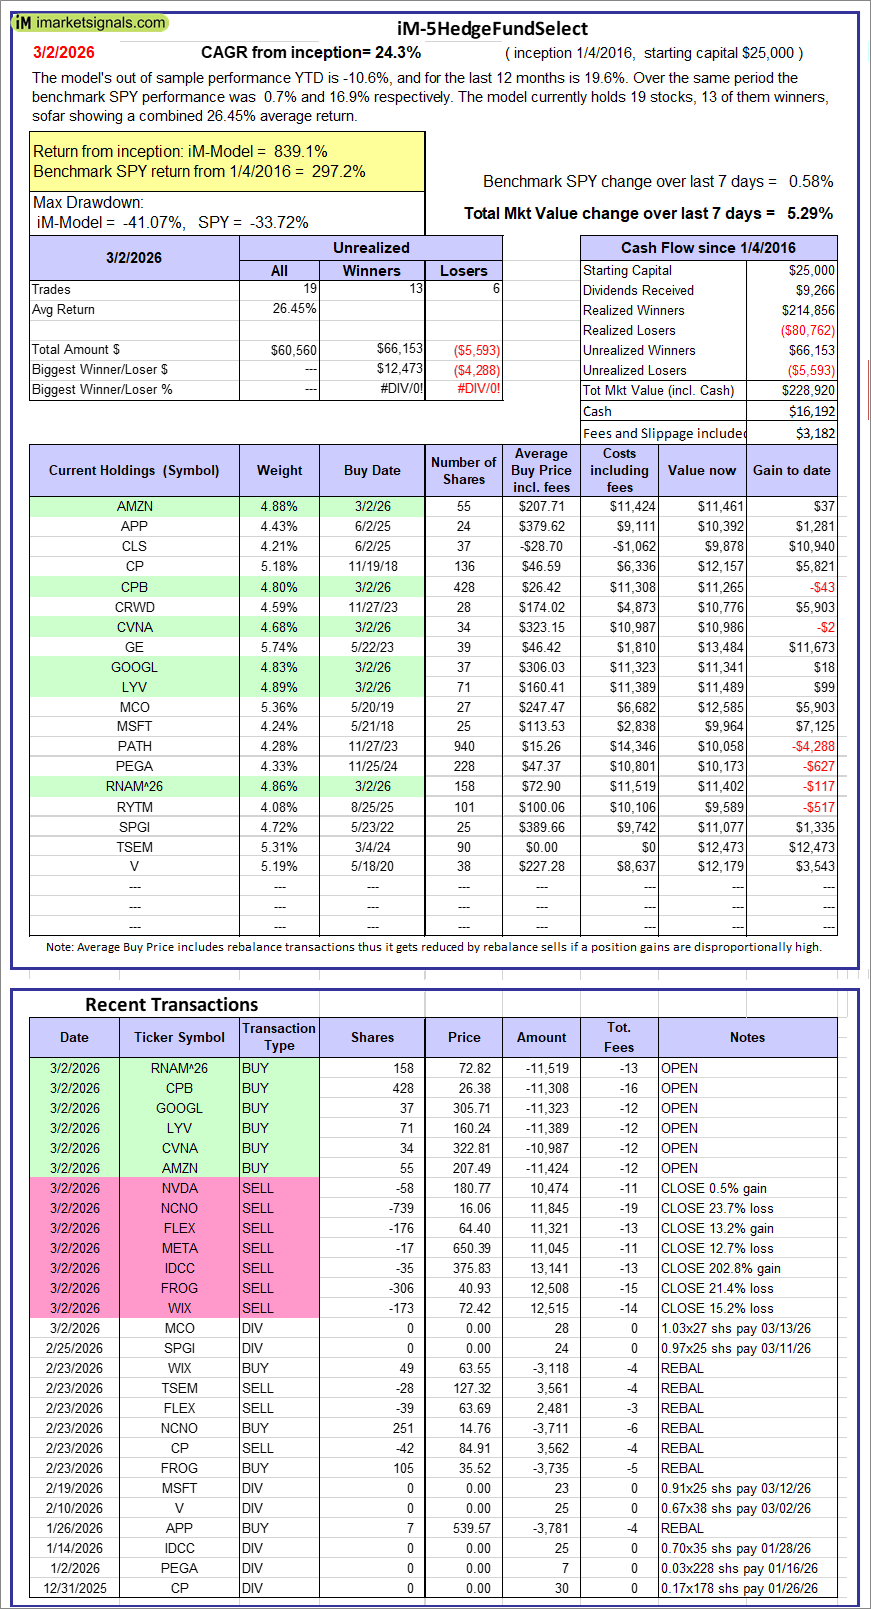 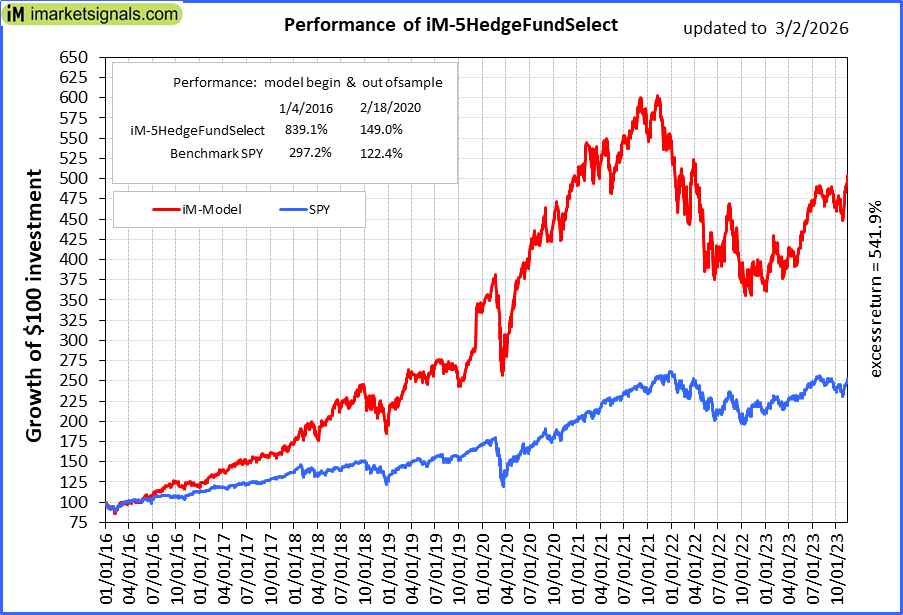 |
iM-5HedgeFundSelect: Since inception, on 1/5/2016, the model gained 839.13% while the benchmark SPY gained 297.24% over the same period. Over the previous week the market value of iM-5HedgeFundSelect gained 5.29% at a time when SPY gained 0.58%. A starting capital of $25,000 at inception on 1/5/2016 would have grown to $228,920 which includes $16,192 cash and excludes $3,182 spent on fees and slippage. |
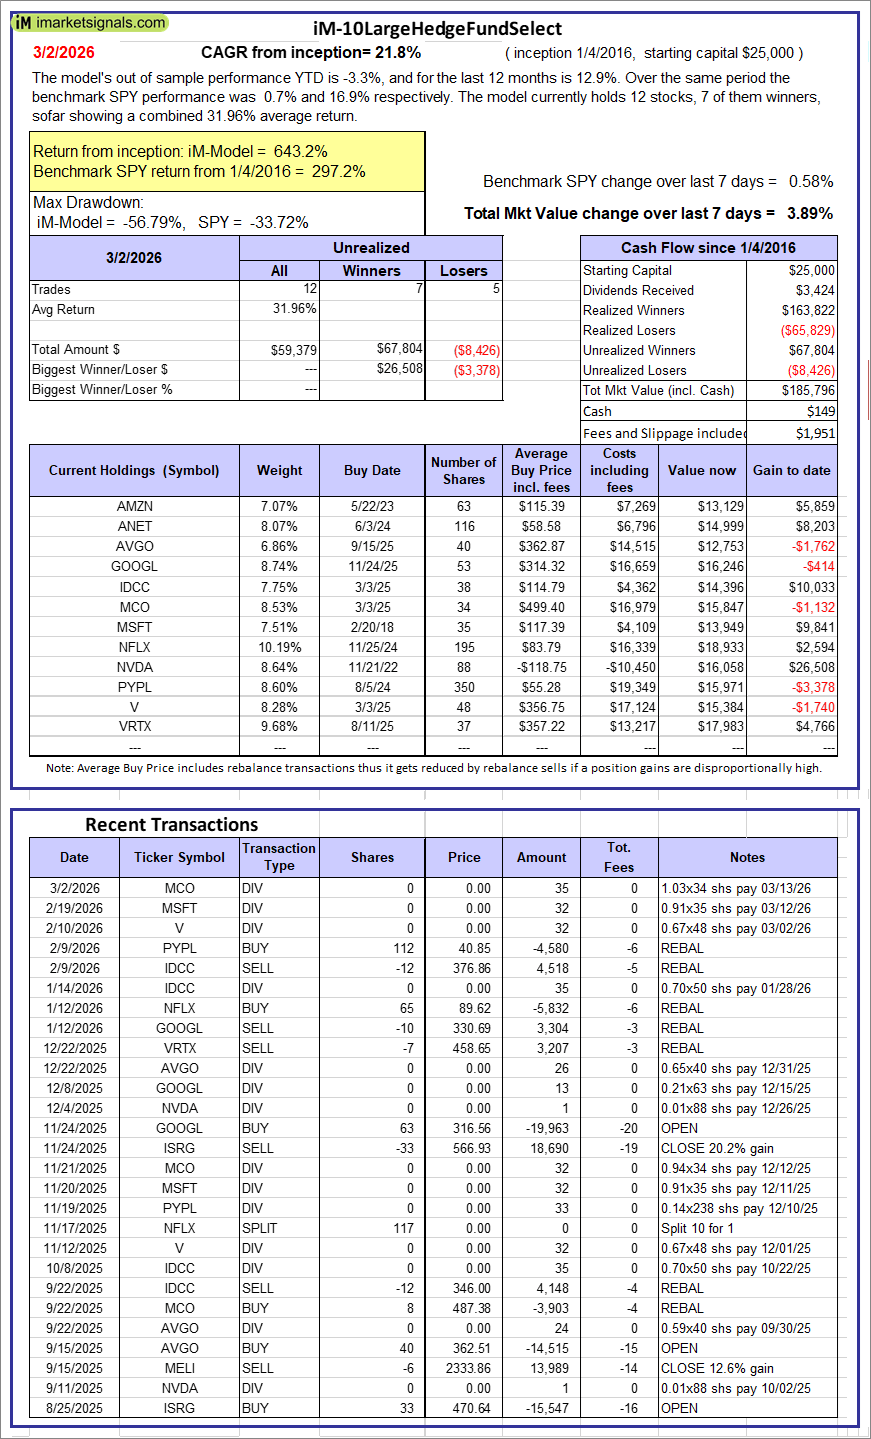 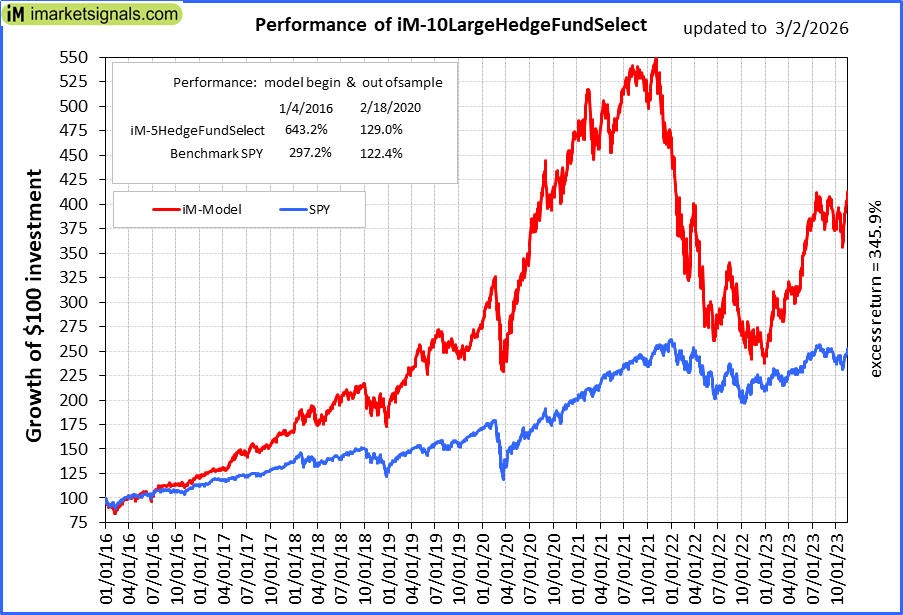 |
iM-10LargeHedgeFundSelect: Since inception, on 1/5/2016, the model gained 643.18% while the benchmark SPY gained 297.24% over the same period. Over the previous week the market value of iM-10LargeHedgeFundSelect gained 3.89% at a time when SPY gained 0.58%. A starting capital of $25,000 at inception on 1/5/2016 would have grown to $185,796 which includes $149 cash and excludes $1,951 spent on fees and slippage. |
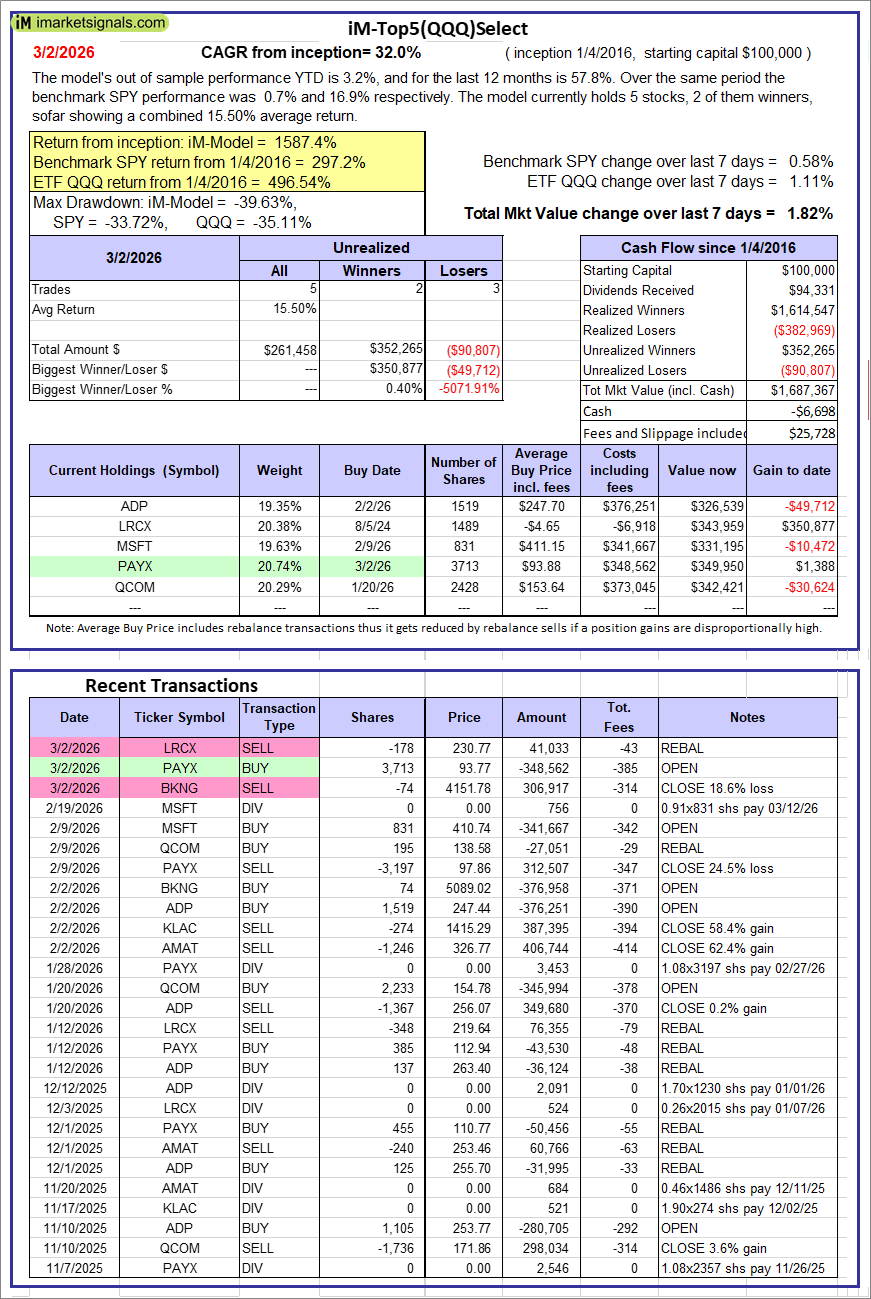 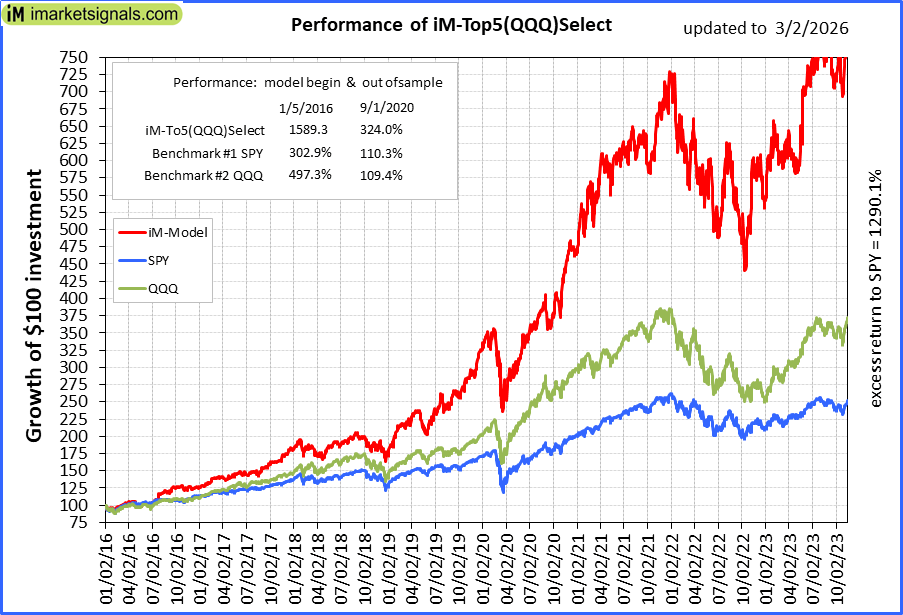 |
iM-Top5(QQQ)Select: Since inception, on 1/5/2016, the model gained 1587.37% while the benchmark SPY gained 297.24% over the same period. Over the previous week the market value of iM-Top5(QQQ)Select gained 1.82% at a time when SPY gained 0.58%. A starting capital of $100,000 at inception on 1/5/2016 would have grown to $1,687,367 which includes -$6,698 cash and excludes $25,728 spent on fees and slippage. |
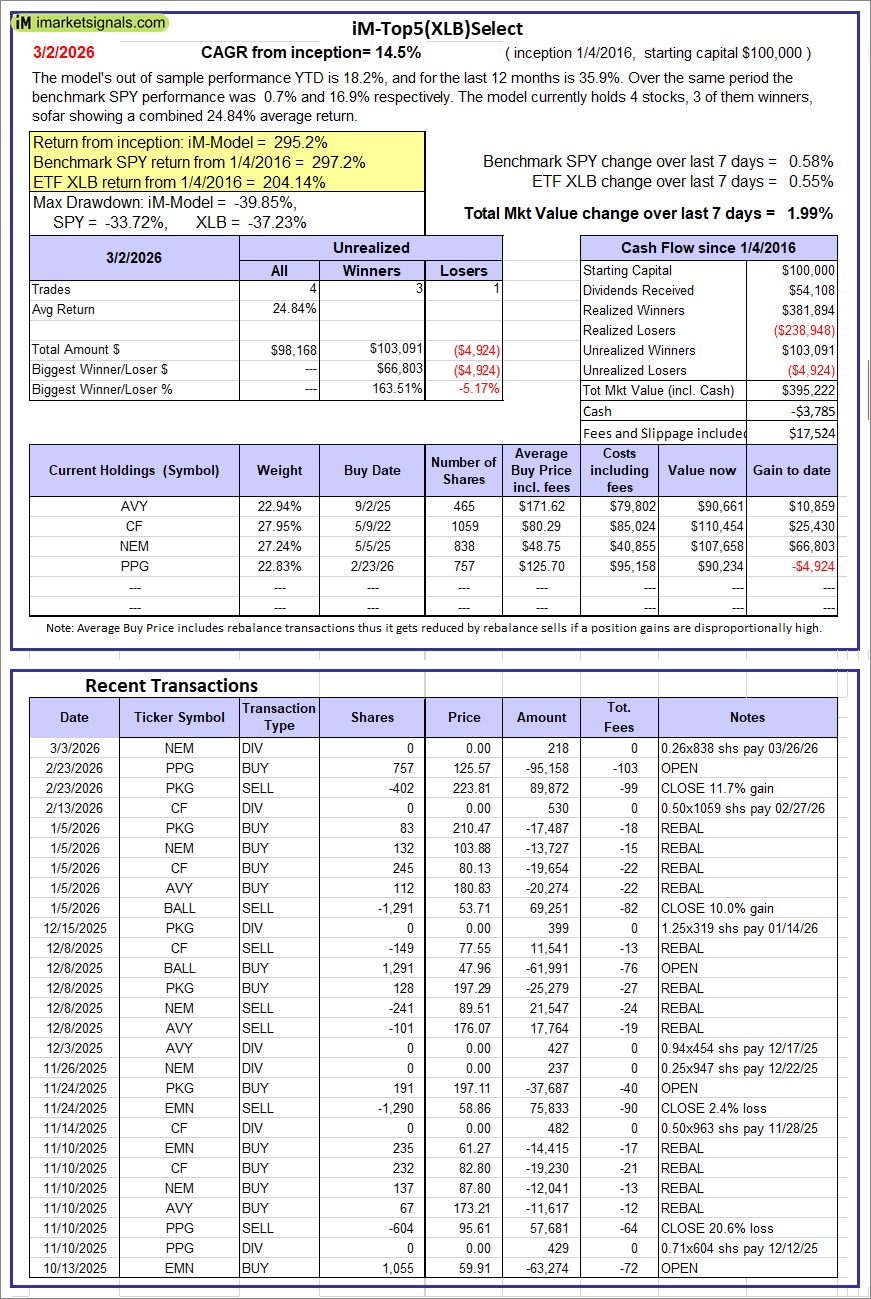 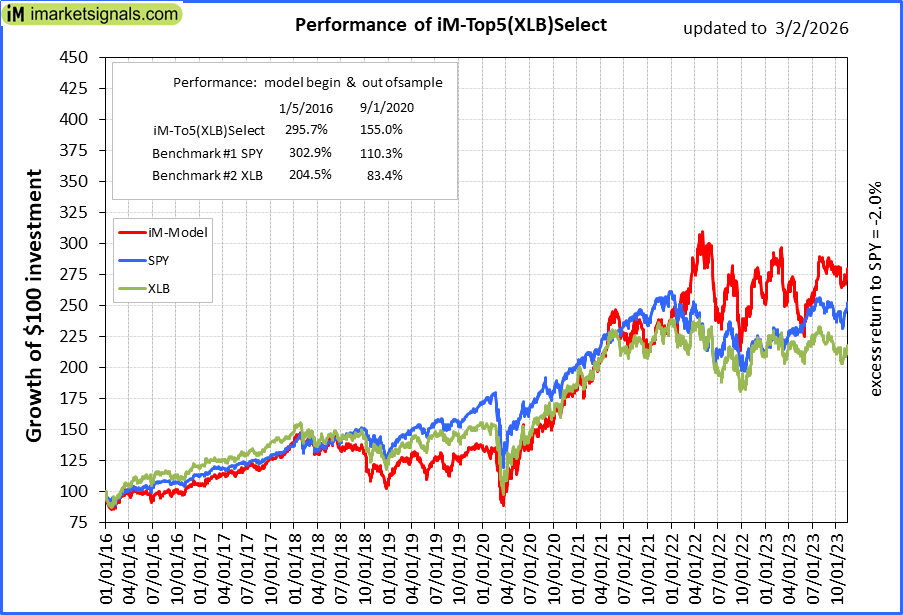 |
iM-Top5(XLB)Select: Since inception, on 1/5/2016, the model gained 295.22% while the benchmark SPY gained 297.24% over the same period. Over the previous week the market value of iM-Top5(XLB)Select gained 1.99% at a time when SPY gained 0.58%. A starting capital of $100,000 at inception on 1/5/2016 would have grown to $395,222 which includes -$3,785 cash and excludes $17,524 spent on fees and slippage. |
 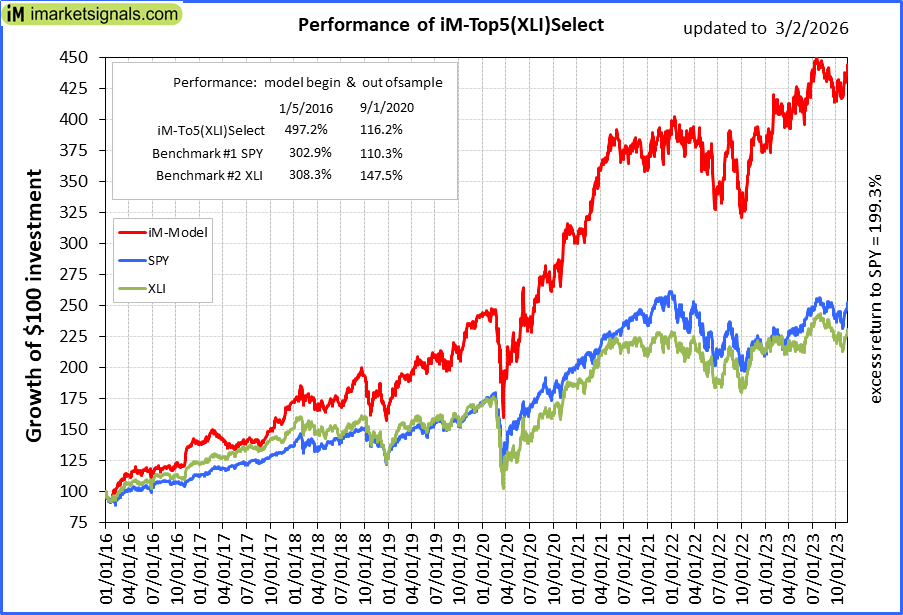 |
iM-Top5(XLI)Select: Since inception, on 1/5/2016, the model gained 496.51% while the benchmark SPY gained 297.24% over the same period. Over the previous week the market value of iM-Top5(XLI)Select gained 0.70% at a time when SPY gained 0.58%. A starting capital of $100,000 at inception on 1/5/2016 would have grown to $596,513 which includes $1,540 cash and excludes $8,921 spent on fees and slippage. |
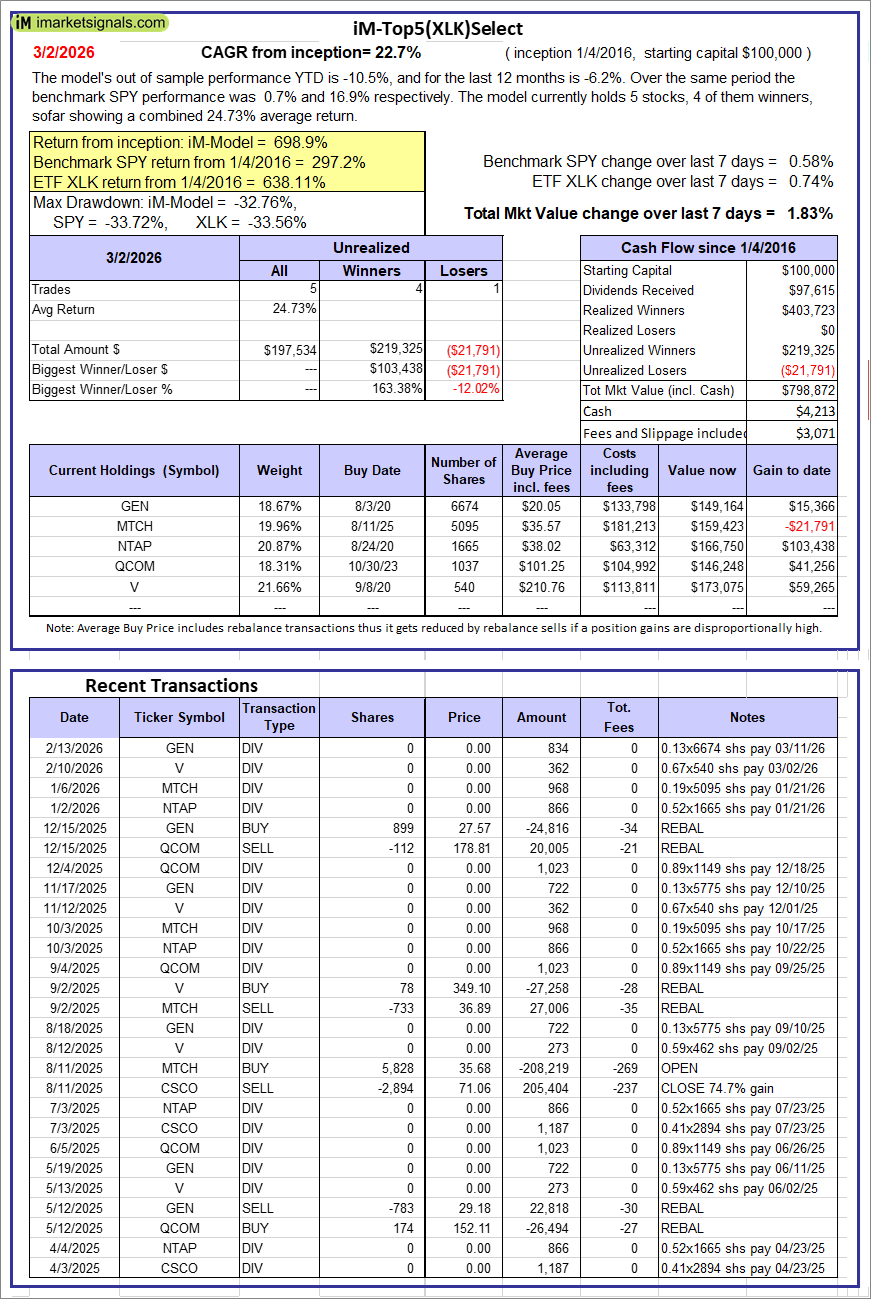 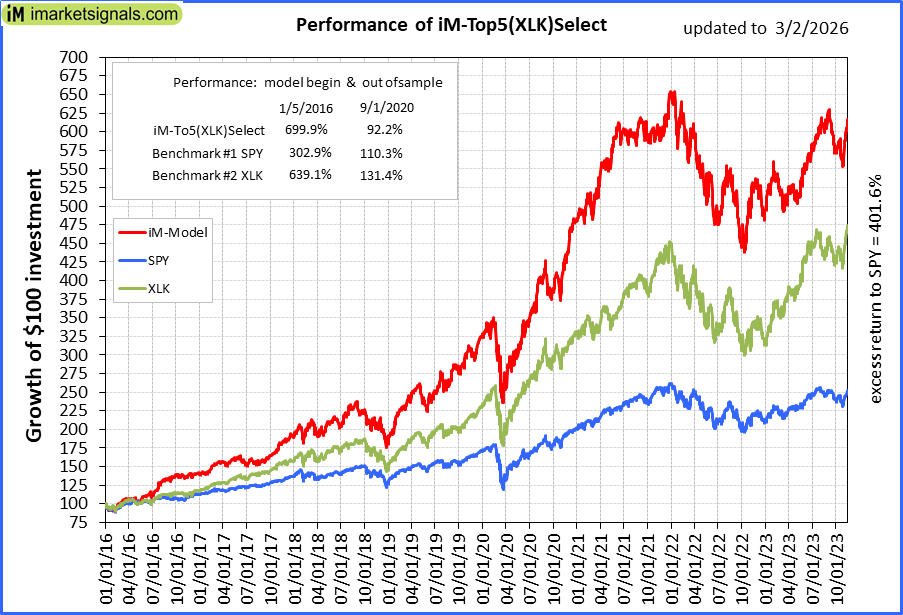 |
iM-Top5(XLK)Select: Since inception, on 1/5/2016, the model gained 698.87% while the benchmark SPY gained 297.24% over the same period. Over the previous week the market value of iM-Top5(XLK)Select gained 1.83% at a time when SPY gained 0.58%. A starting capital of $100,000 at inception on 1/5/2016 would have grown to $798,872 which includes $4,213 cash and excludes $3,071 spent on fees and slippage. |
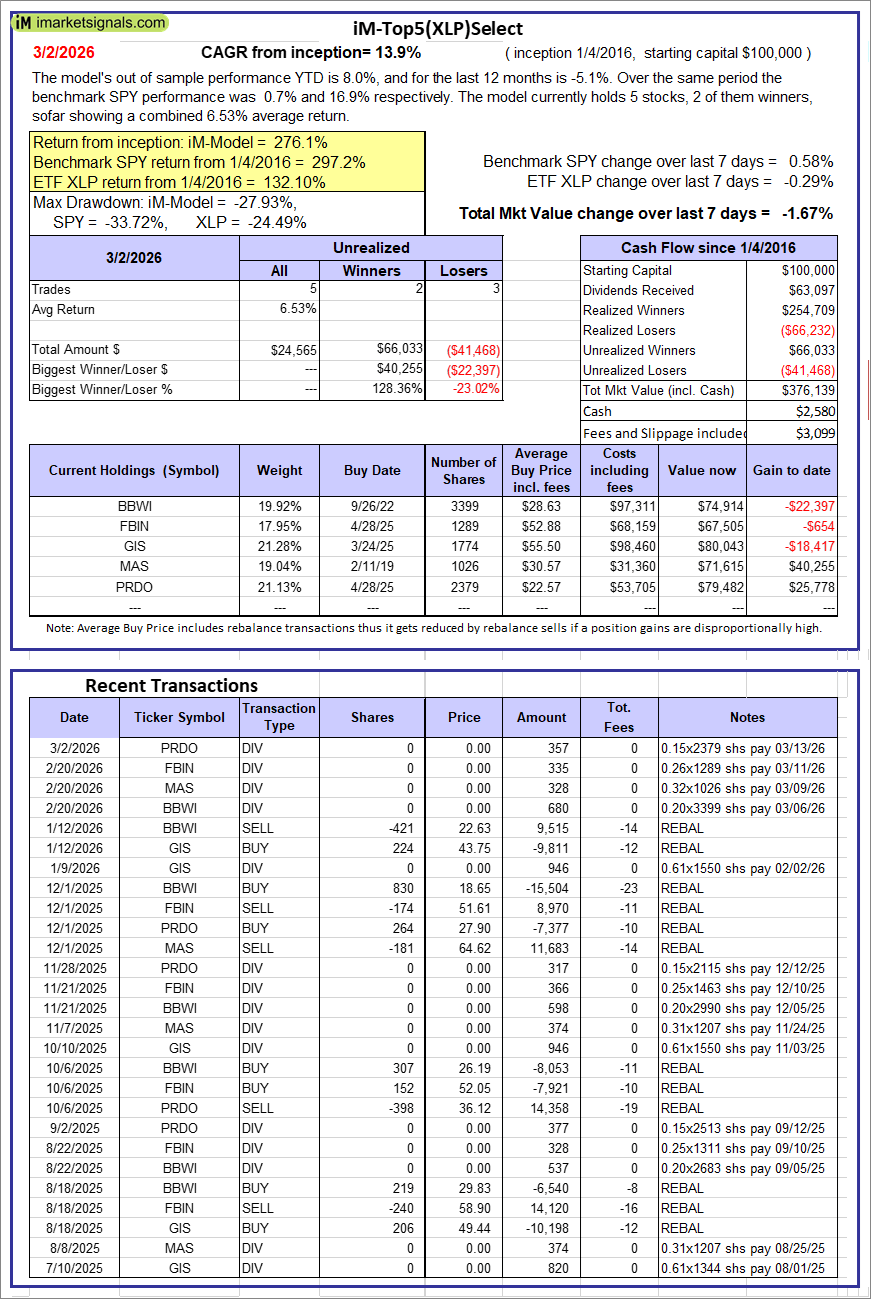 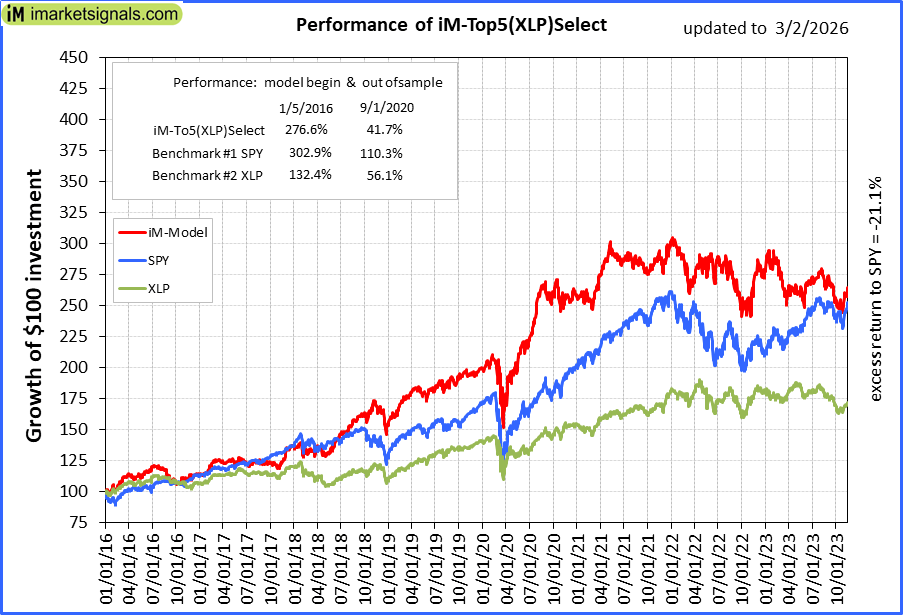 |
iM-Top5(XLP)Select: Since inception, on 1/5/2016, the model gained 276.14% while the benchmark SPY gained 297.24% over the same period. Over the previous week the market value of iM-Top5(XLP)Select gained -1.67% at a time when SPY gained 0.58%. A starting capital of $100,000 at inception on 1/5/2016 would have grown to $376,139 which includes $2,580 cash and excludes $3,099 spent on fees and slippage. |
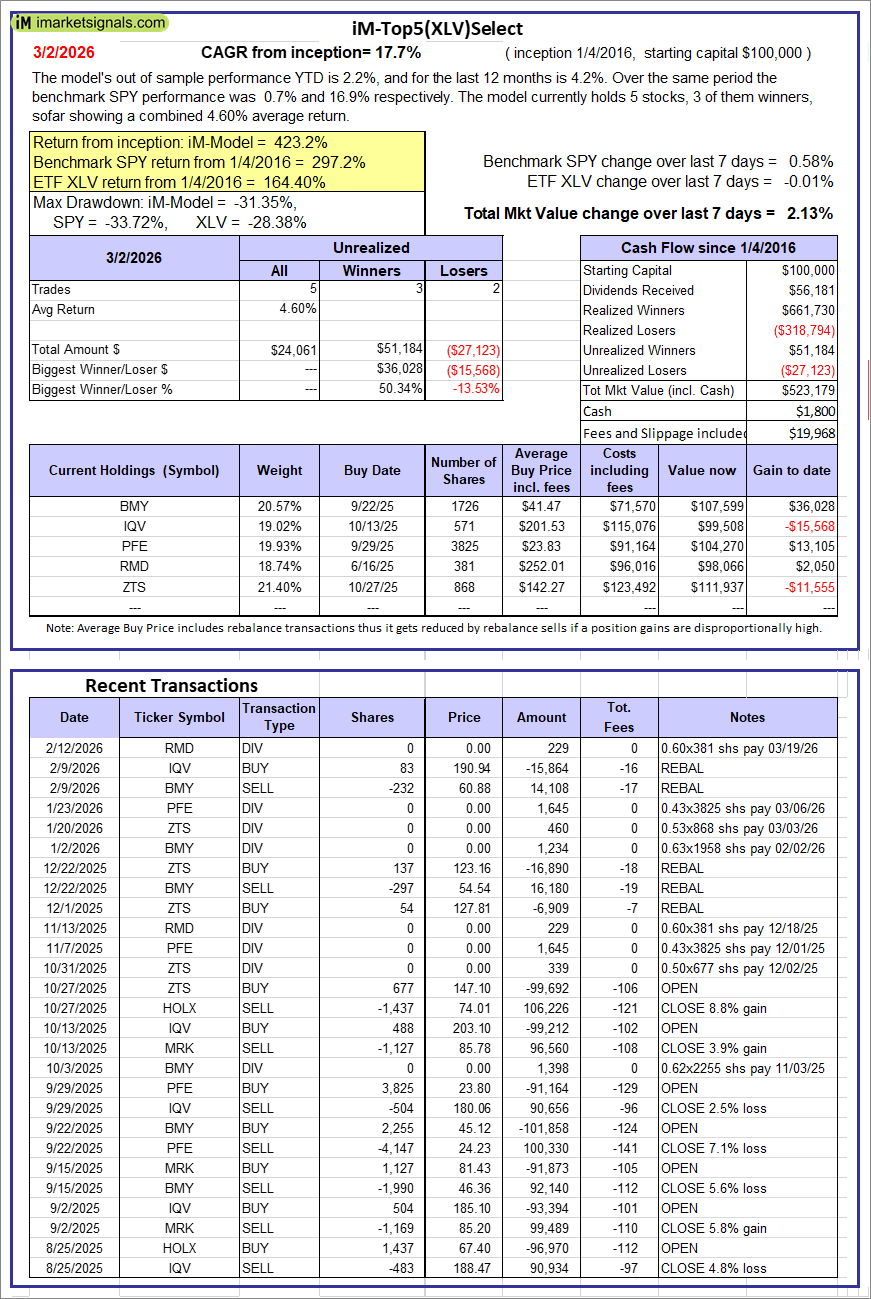 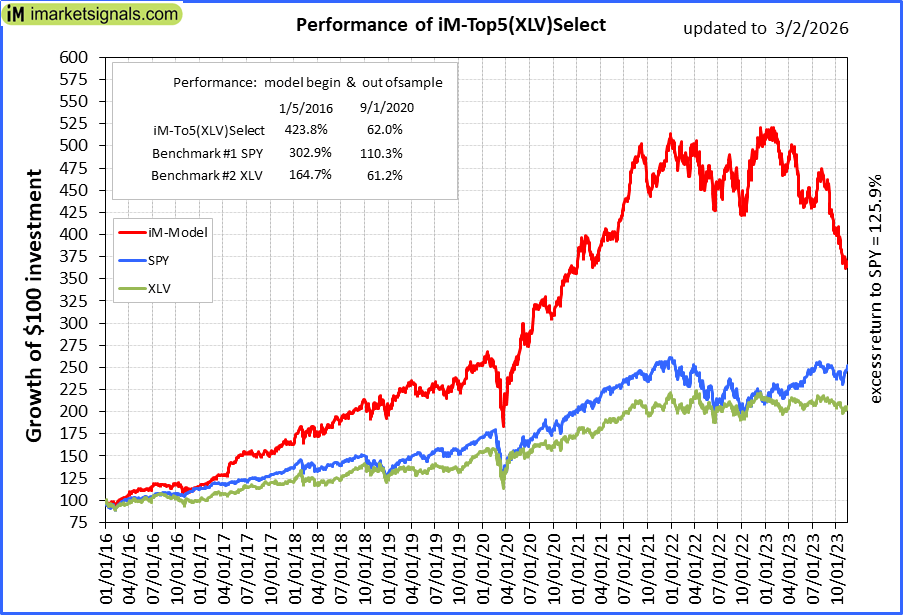 |
iM-Top5(XLV)Select: Since inception, on 1/5/2016, the model gained 423.18% while the benchmark SPY gained 297.24% over the same period. Over the previous week the market value of iM-Top5(XLV)Select gained 2.13% at a time when SPY gained 0.58%. A starting capital of $100,000 at inception on 1/5/2016 would have grown to $523,179 which includes $1,800 cash and excludes $19,968 spent on fees and slippage. |
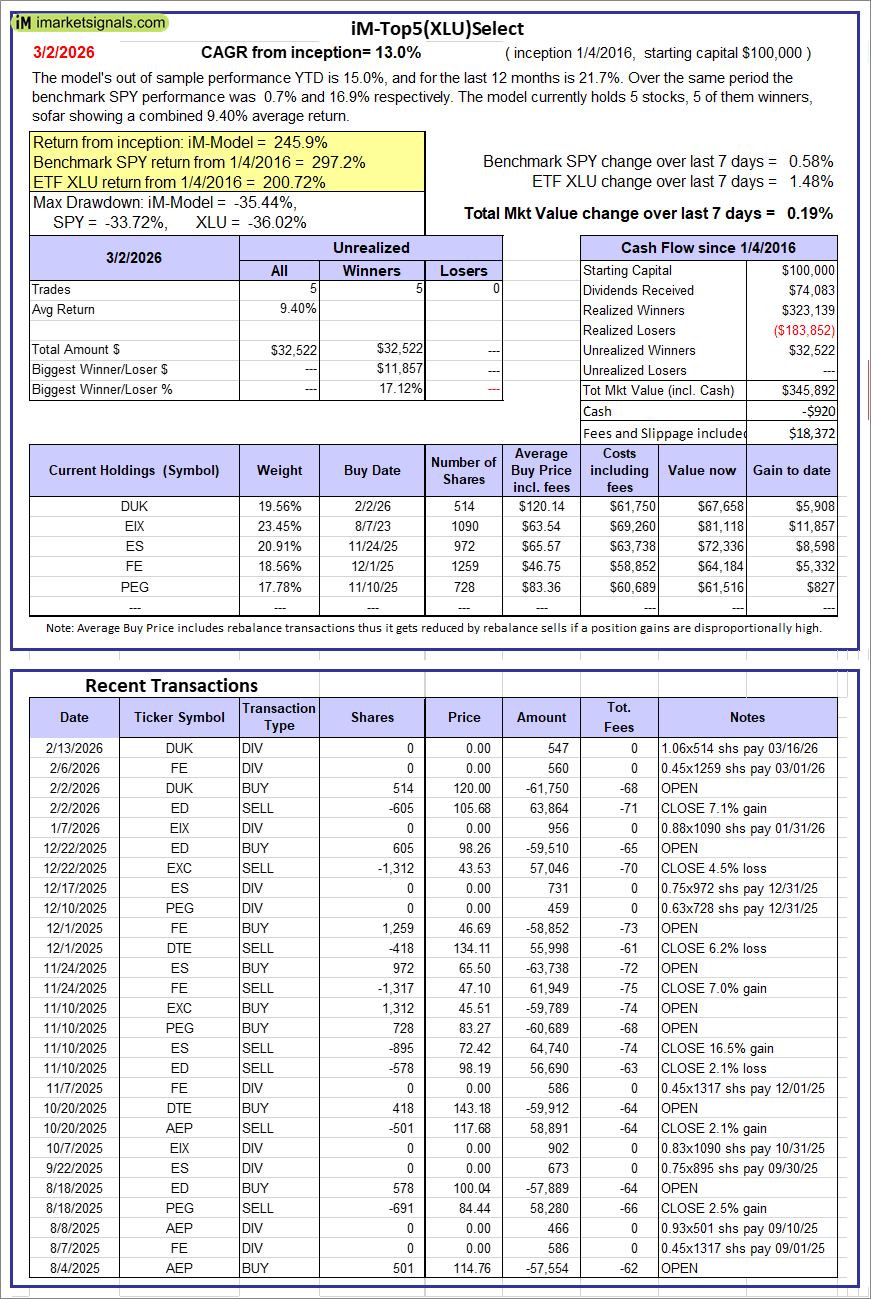 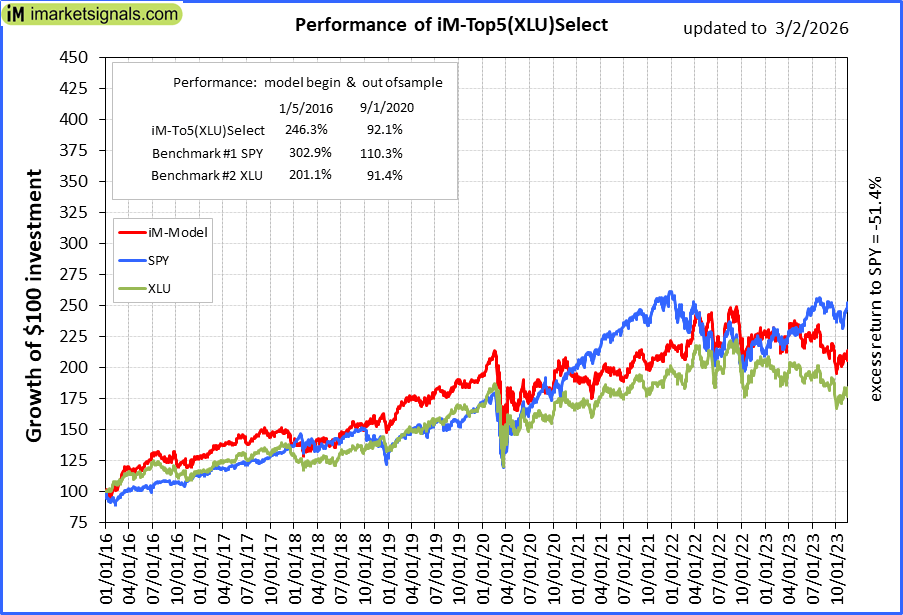 |
iM-Top5(XLU)Select: Since inception, on 1/5/2016, the model gained 245.89% while the benchmark SPY gained 297.24% over the same period. Over the previous week the market value of iM-Top5(XLU)Select gained 0.19% at a time when SPY gained 0.58%. A starting capital of $100,000 at inception on 1/5/2016 would have grown to $345,892 which includes -$920 cash and excludes $18,372 spent on fees and slippage. |
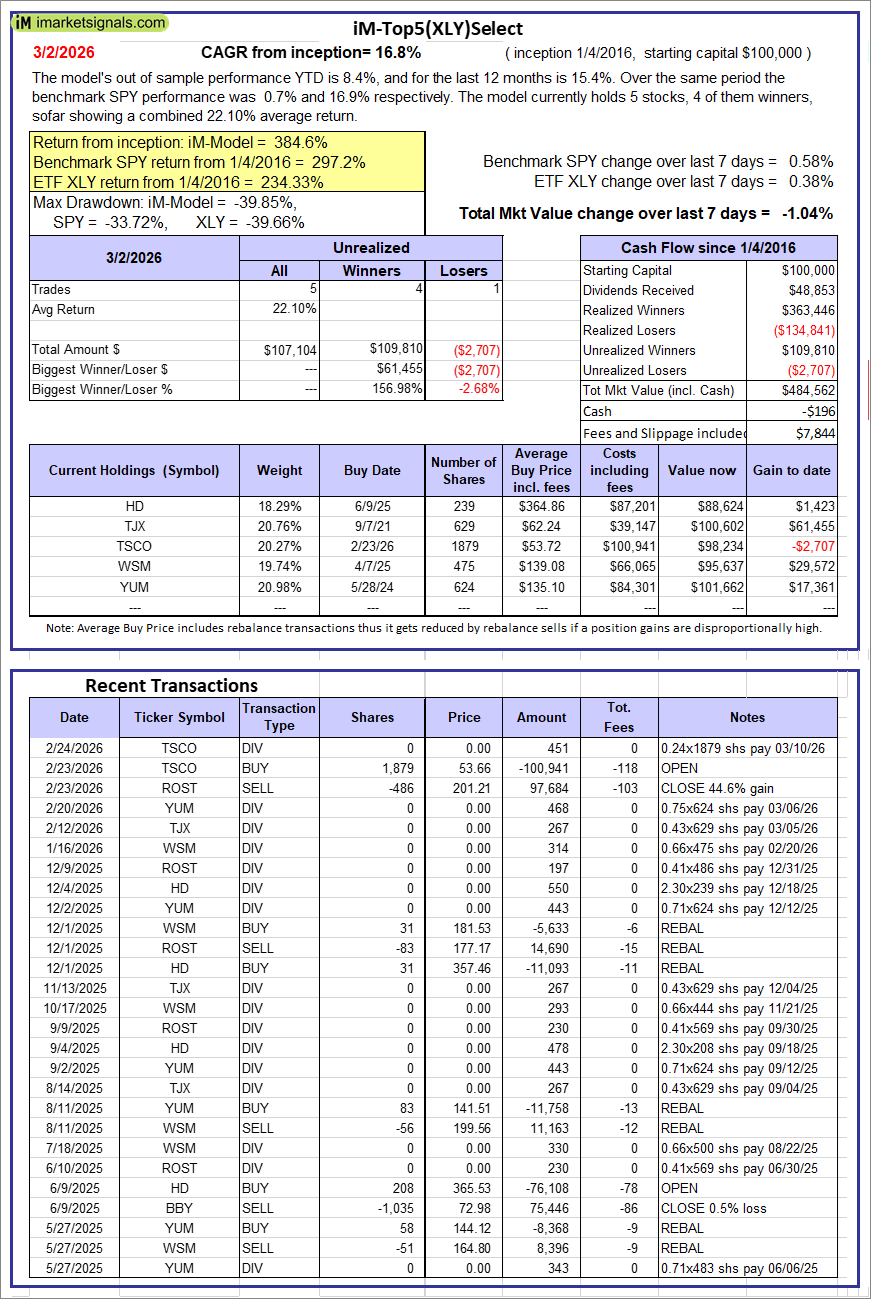 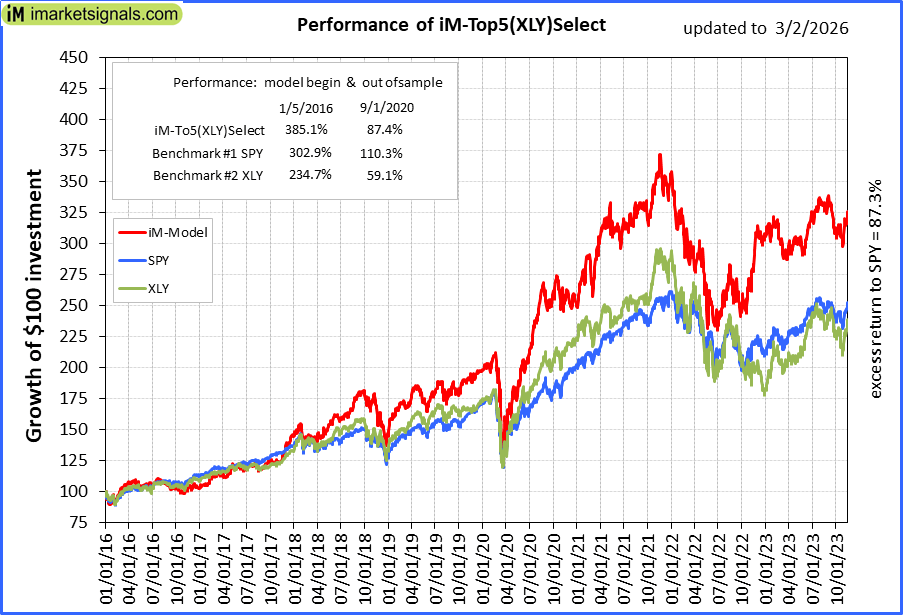 |
iM-Top5(XLY)Select: Since inception, on 1/5/2016, the model gained 384.56% while the benchmark SPY gained 297.24% over the same period. Over the previous week the market value of iM-Top5(XLY)Select gained -1.04% at a time when SPY gained 0.58%. A starting capital of $100,000 at inception on 1/5/2016 would have grown to $484,562 which includes -$196 cash and excludes $7,844 spent on fees and slippage. |
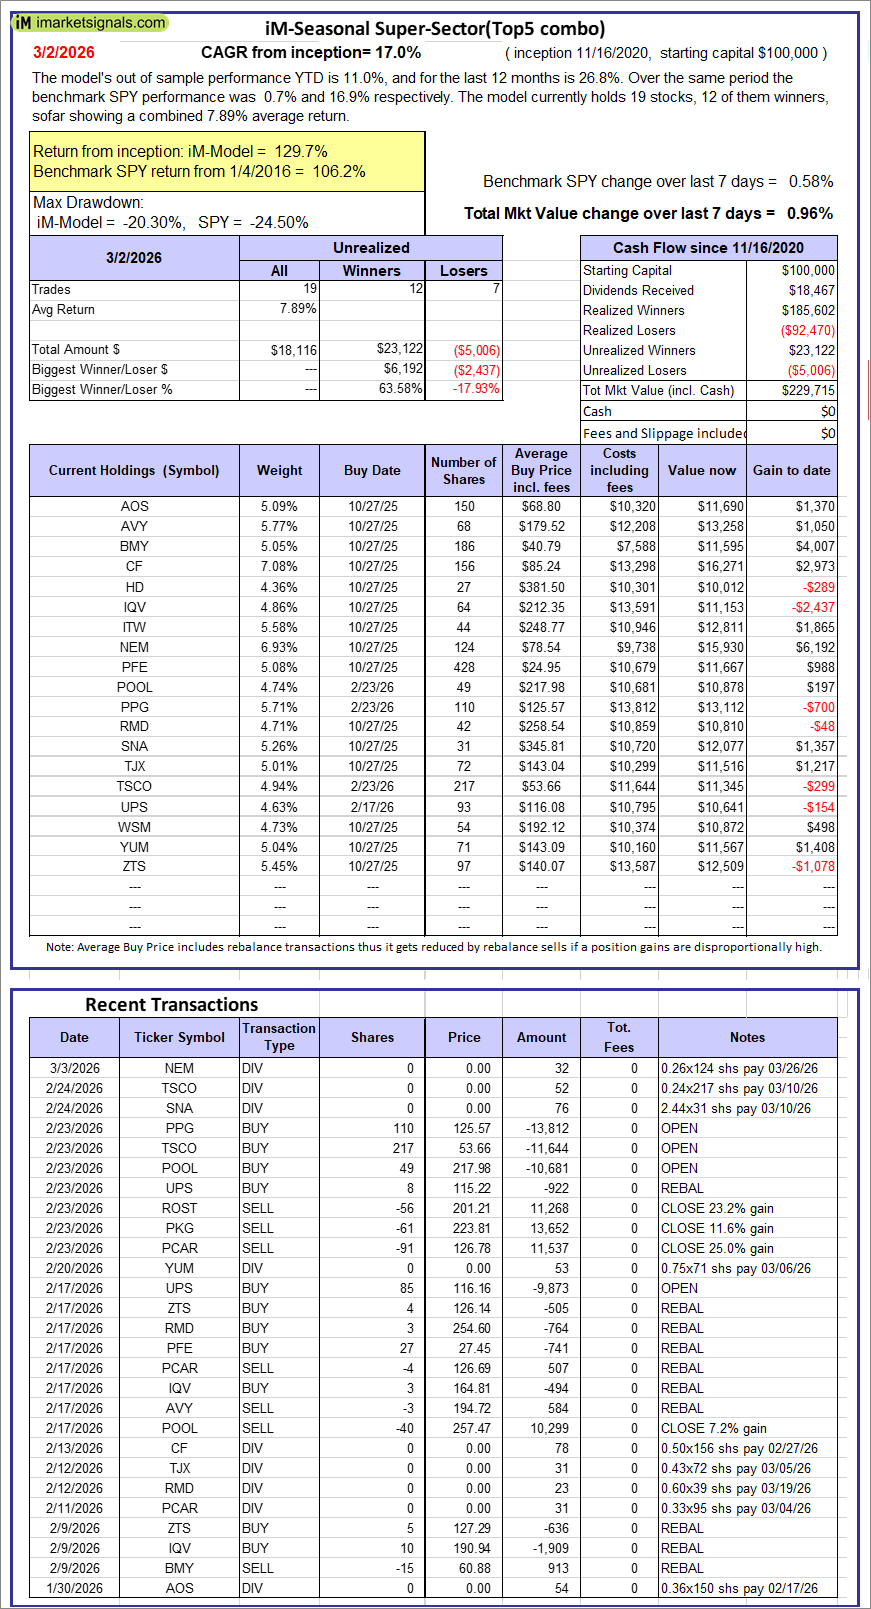 |
iM-Seasonal Super-Sectors (Top5 combo) : Since inception, on 11/17/2020, the model gained 129.72% while the benchmark SPY gained 106.21% over the same period. Over the previous week the market value of iM-Seasonal Super-Sectors (Top5 combo) gained 0.96% at a time when SPY gained 0.58%. A starting capital of $100,000 at inception on 11/17/2020 would have grown to $229,715 which includes $0 cash and excludes $00 spent on fees and slippage. |
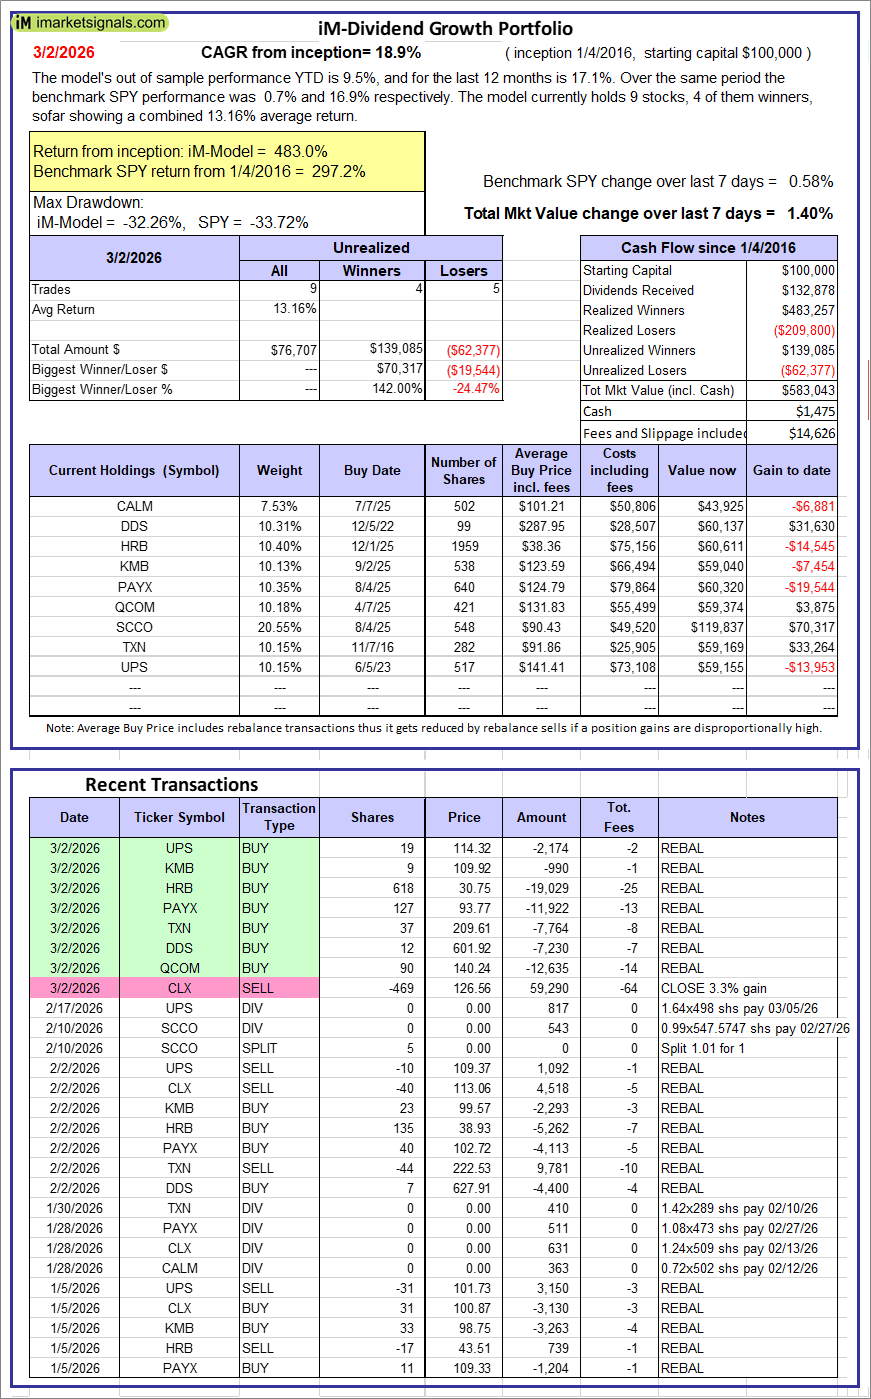 |
iM-Dividend Growth Portfolio: The model’s out of sample performance YTD is 9.5%, and for the last 12 months is 17.1%. Over the same period the benchmark SPY performance was 0.7% and 16.9% respectively. Over the previous week the market value of the iM-Dividend Growth Portfolio gained 1.40% at a time when SPY gained 0.58%. A starting capital of $100,000 at inception on 6/30/2016 would have grown to $583,043 which includes $1,475 cash and excludes $14,626 spent on fees and slippage. |
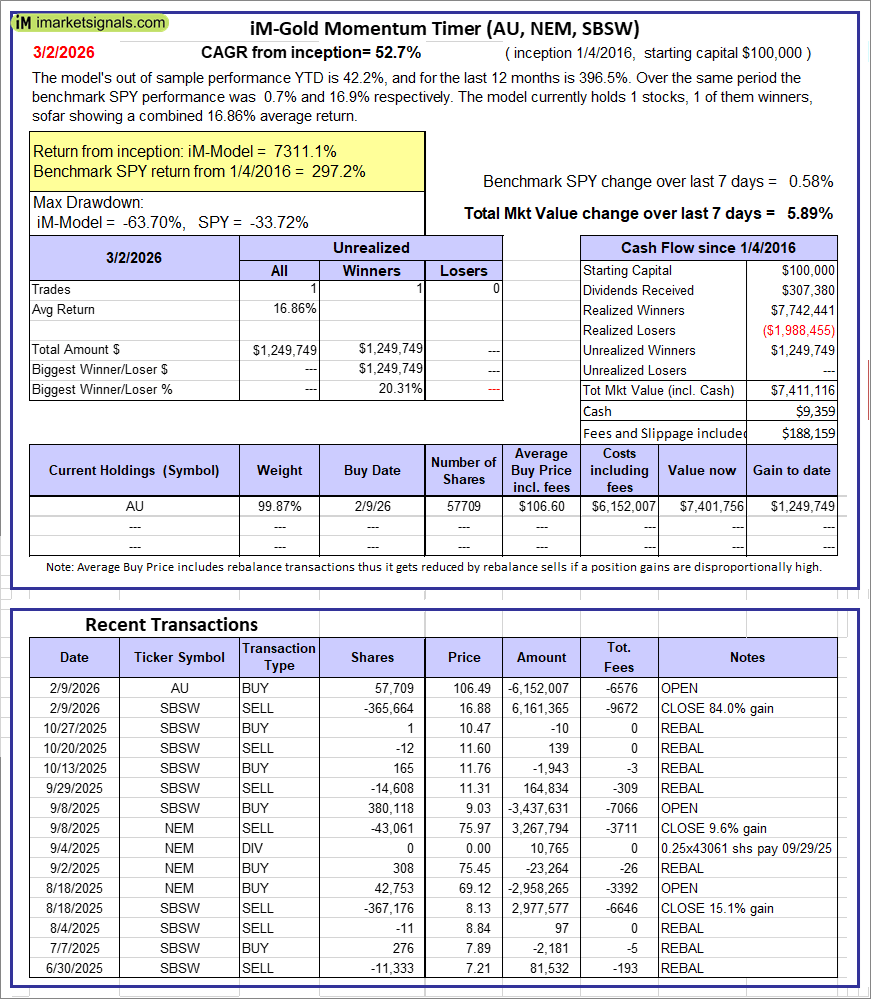 |
iM-Gold Momentum Timer (AU, NEM, SBSW): The model’s out of sample performance YTD is 42.2%, and for the last 12 months is 396.5%. Over the same period the benchmark SPY performance was 0.7% and 16.9% respectively. Over the previous week the market value of iM-Gold Momentum Timer (AU, NEM, SBSW) gained 5.89% at a time when SPY gained 0.58%. A starting capital of $100,000 at inception on 6/30/2016 would have grown to $9,359 which includes $188,159 cash and excludes Gain to date spent on fees and slippage. |
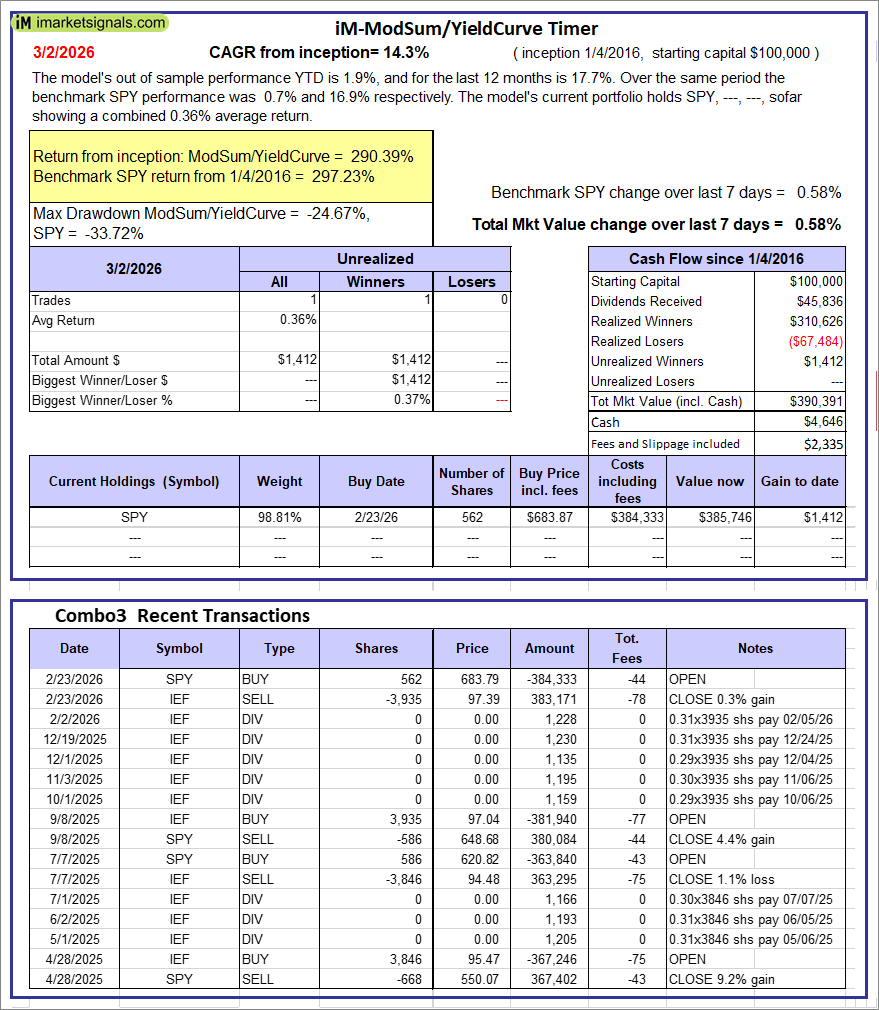 |
iM-ModSum/YieldCurve Timer: The model’s out of sample performance YTD is 1.9%, and for the last 12 months is 17.7%. Over the same period the benchmark SPY performance was 0.7% and 16.9% respectively. Over the previous week the market value of iM-PortSum/YieldCurve Timer gained 0.58% at a time when SPY gained 0.58%. A starting capital of $100,000 at inception on 1/1/2016 would have grown to $390,391 which includes $4,646 cash and excludes $2,335 spent on fees and slippage. |
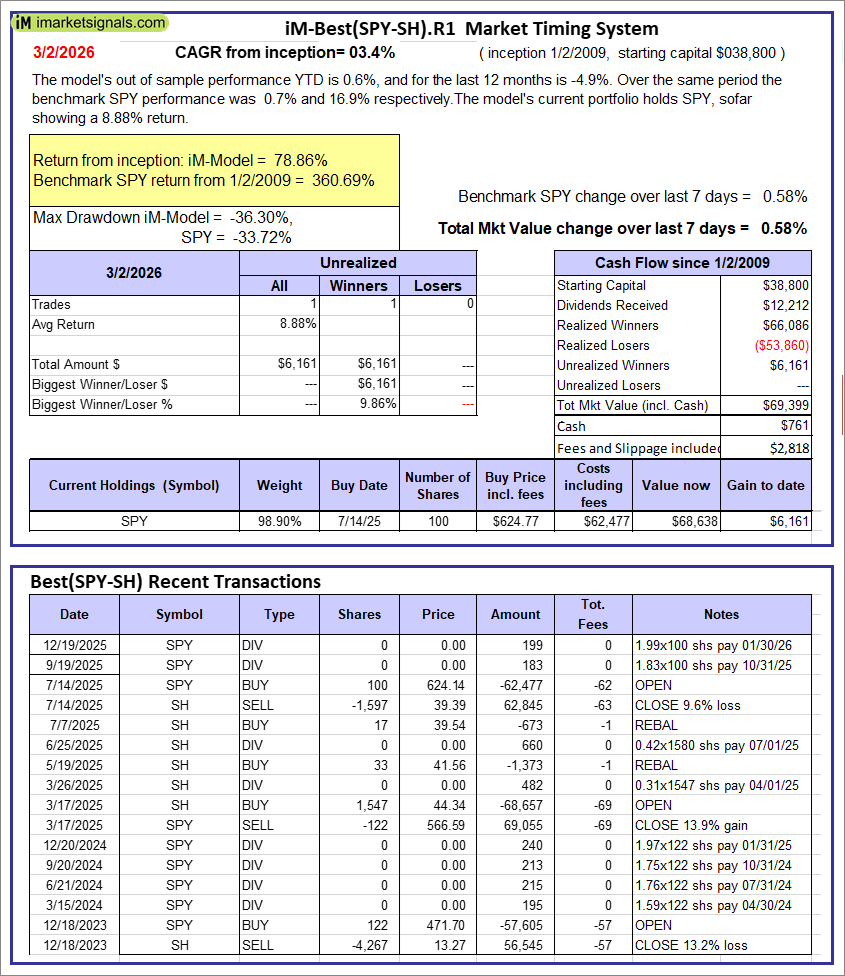 |
iM-Best(SPY-SH).R1: The model’s out of sample performance YTD is 0.6%, and for the last 12 months is -4.9%. Over the same period the benchmark SPY performance was 0.7% and 16.9% respectively. Over the previous week the market value of Best(SPY-SH) gained 0.58% at a time when SPY gained 0.58%. A starting capital of $100,000 at inception on 1/2/2009 would have grown to $69,399 which includes $761 cash and excludes $2,818 spent on fees and slippage. |
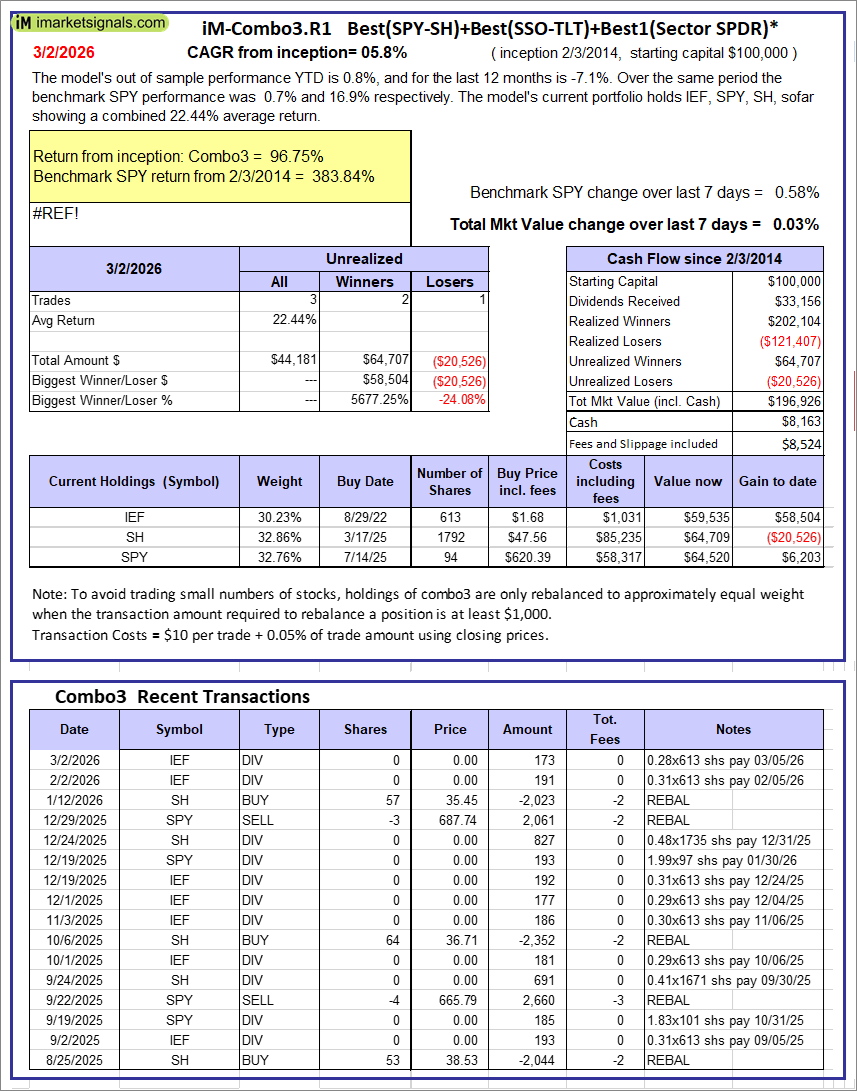 |
iM-Combo3.R1: The model’s out of sample performance YTD is 0.8%, and for the last 12 months is -7.1%. Over the same period the benchmark SPY performance was 0.7% and 16.9% respectively. Over the previous week the market value of iM-Combo3.R1 gained 0.03% at a time when SPY gained 0.58%. A starting capital of $100,000 at inception on 2/3/2014 would have grown to $196,926 which includes $8,163 cash and excludes $8,524 spent on fees and slippage. |
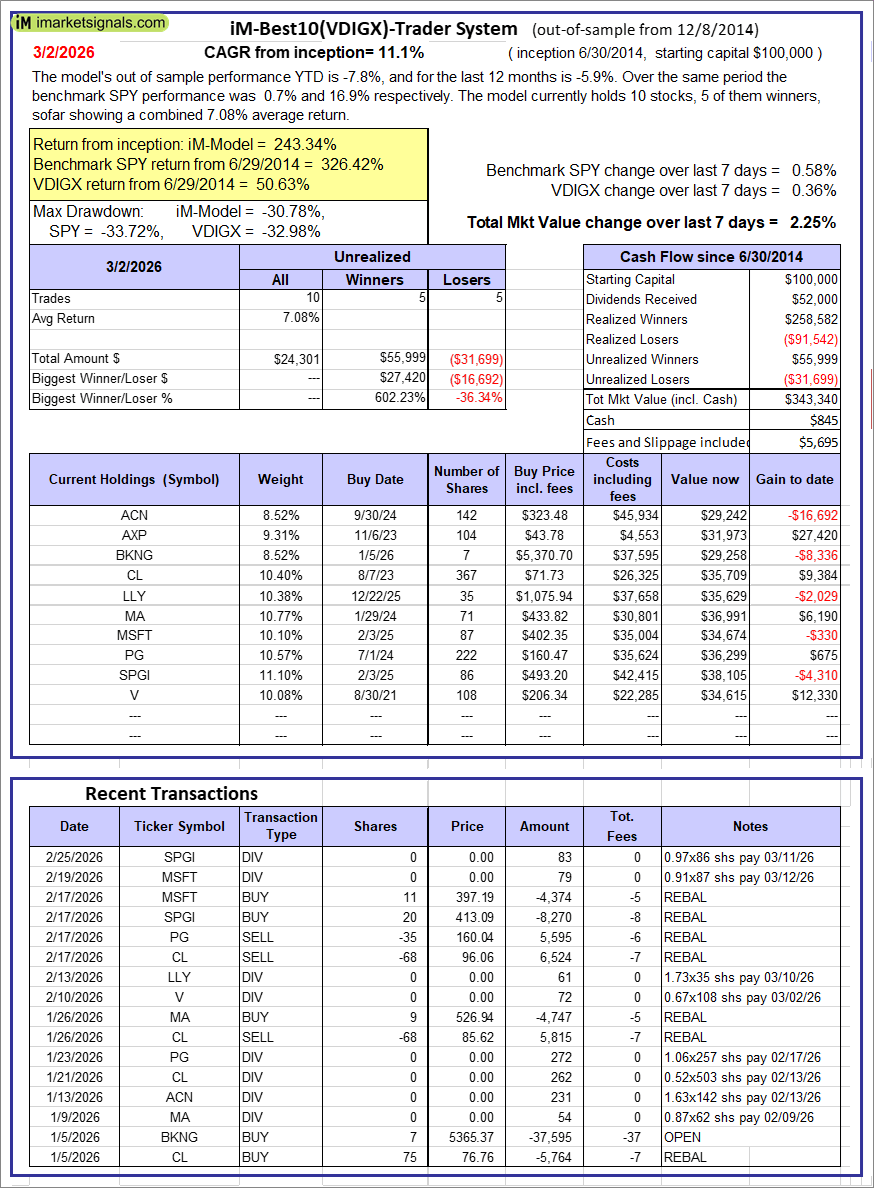 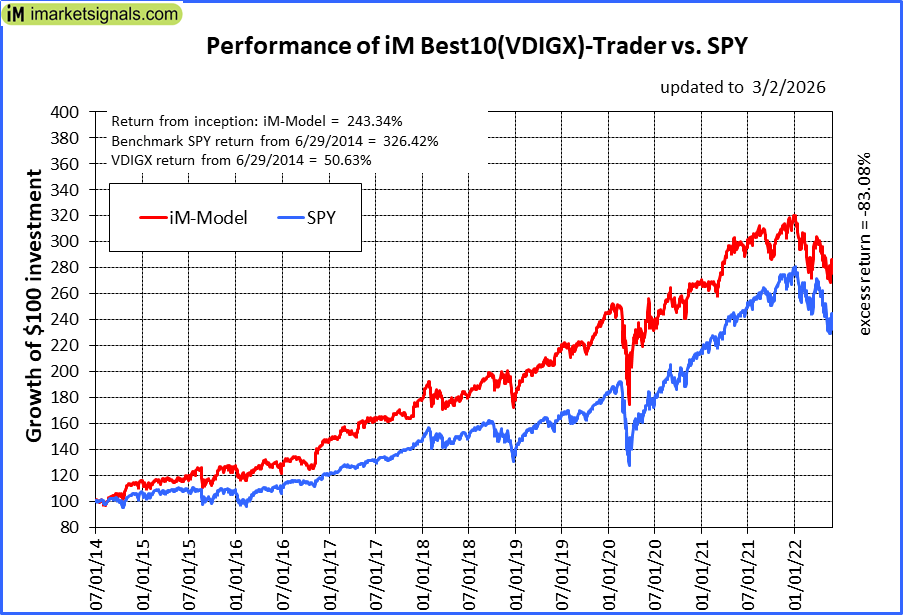 |
iM-Best10(VDIGX)-Trader: The model’s out of sample performance YTD is -7.8%, and for the last 12 months is -5.9%. Over the same period the benchmark SPY performance was 0.7% and 16.9% respectively. Since inception, on 7/1/2014, the model gained 243.34% while the benchmark SPY gained 326.42% and VDIGX gained 50.63% over the same period. Over the previous week the market value of iM-Best10(VDIGX) gained 2.25% at a time when SPY gained 0.58%. A starting capital of $100,000 at inception on 7/1/2014 would have grown to $343,340 which includes $845 cash and excludes $5,695 spent on fees and slippage. |
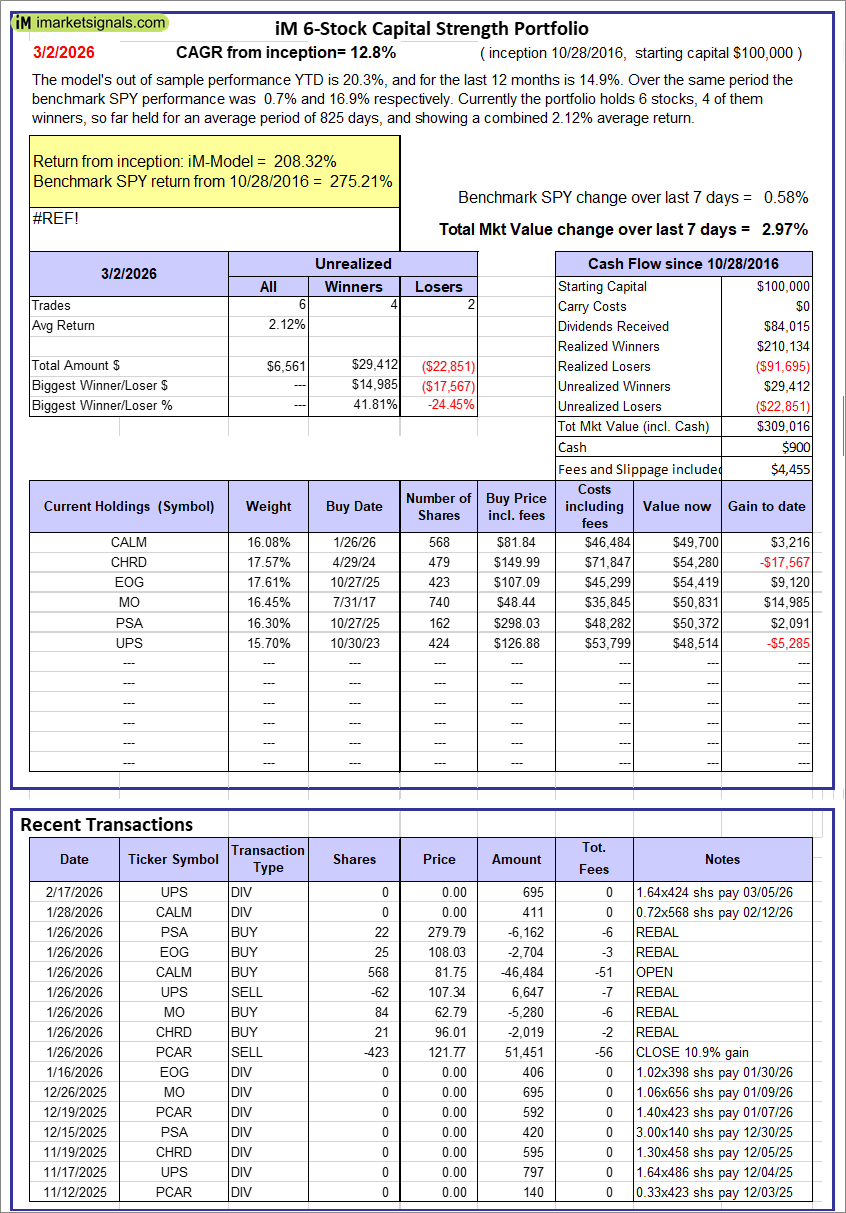 |
iM 6-Stock Capital Strength Portfolio: The model’s out of sample performance YTD is 20.3%, and for the last 12 months is 14.9%. Over the same period the benchmark SPY performance was 0.7% and 16.9% respectively. Over the previous week the market value of the iM 6-Stock Capital Strength Portfolio gained 2.97% at a time when SPY gained 0.58%. A starting capital of $100,000 at inception on 10/28/2016 would have grown to $309,016 which includes $900 cash and excludes $4,455 spent on fees and slippage. |
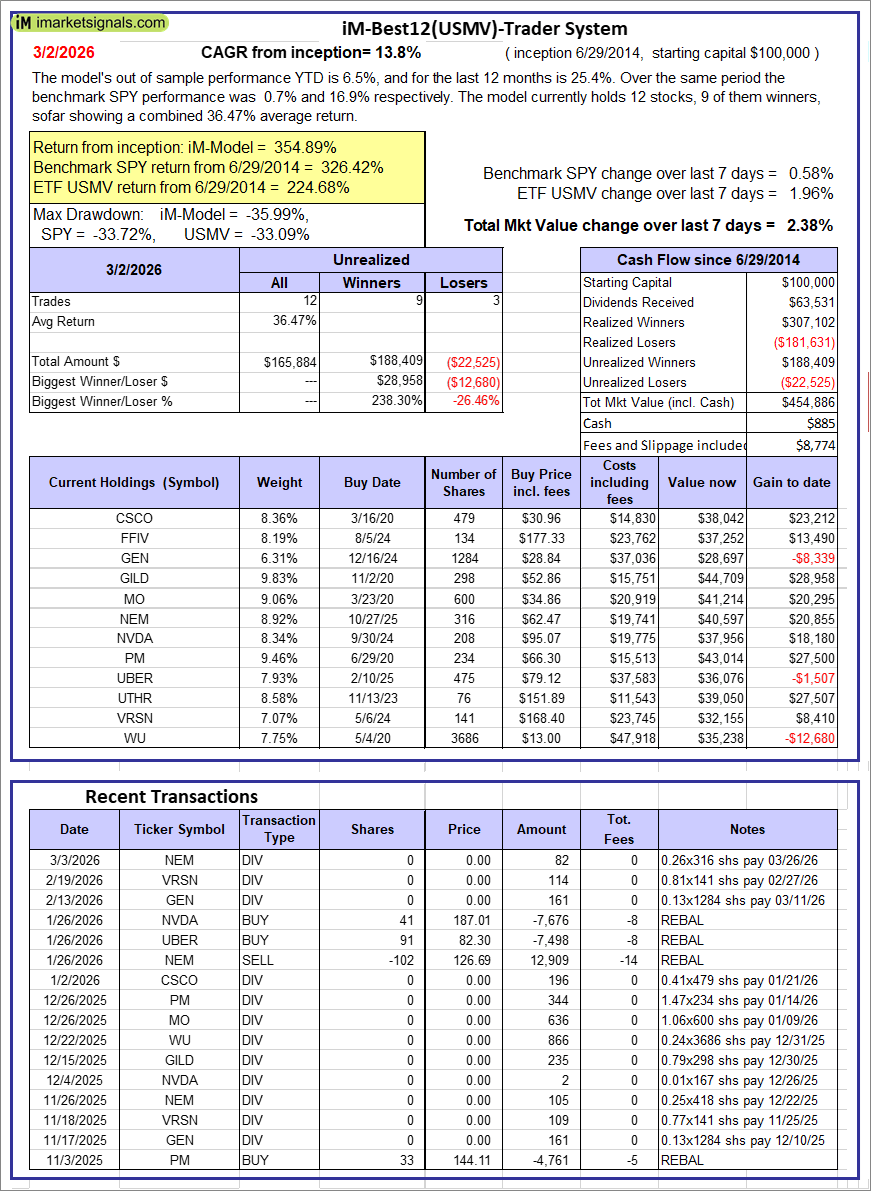 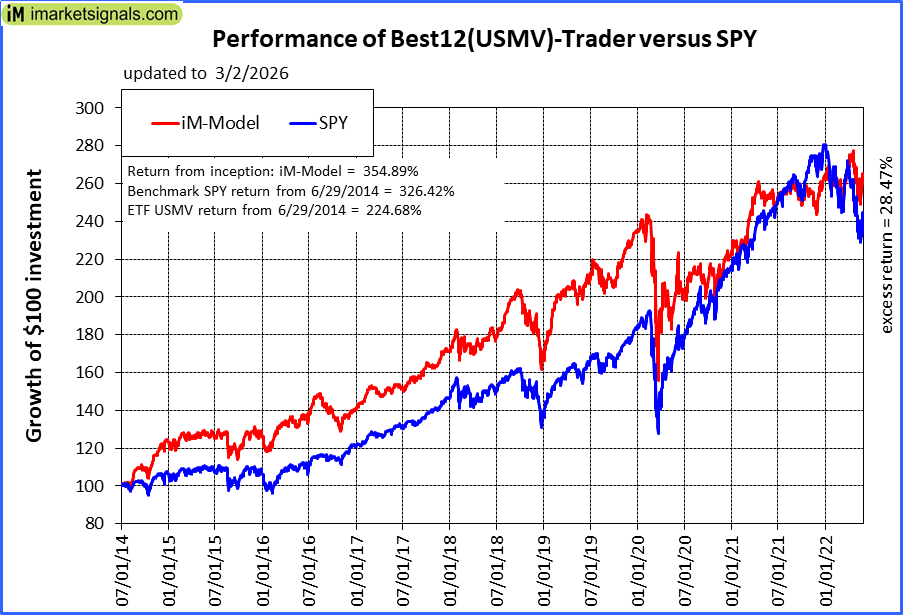 |
iM-Best12(USMV)-Trader: The model’s out of sample performance YTD is 6.5%, and for the last 12 months is 25.4%. Over the same period the benchmark SPY performance was 0.7% and 16.9% respectively. Since inception, on 6/30/2014, the model gained 354.89% while the benchmark SPY gained 326.42% and the ETF USMV gained 224.68% over the same period. Over the previous week the market value of iM-Best12(USMV)-Trader gained 2.38% at a time when SPY gained 0.58%. A starting capital of $100,000 at inception on 6/30/2014 would have grown to $454,886 which includes $885 cash and excludes $8,774 spent on fees and slippage. |
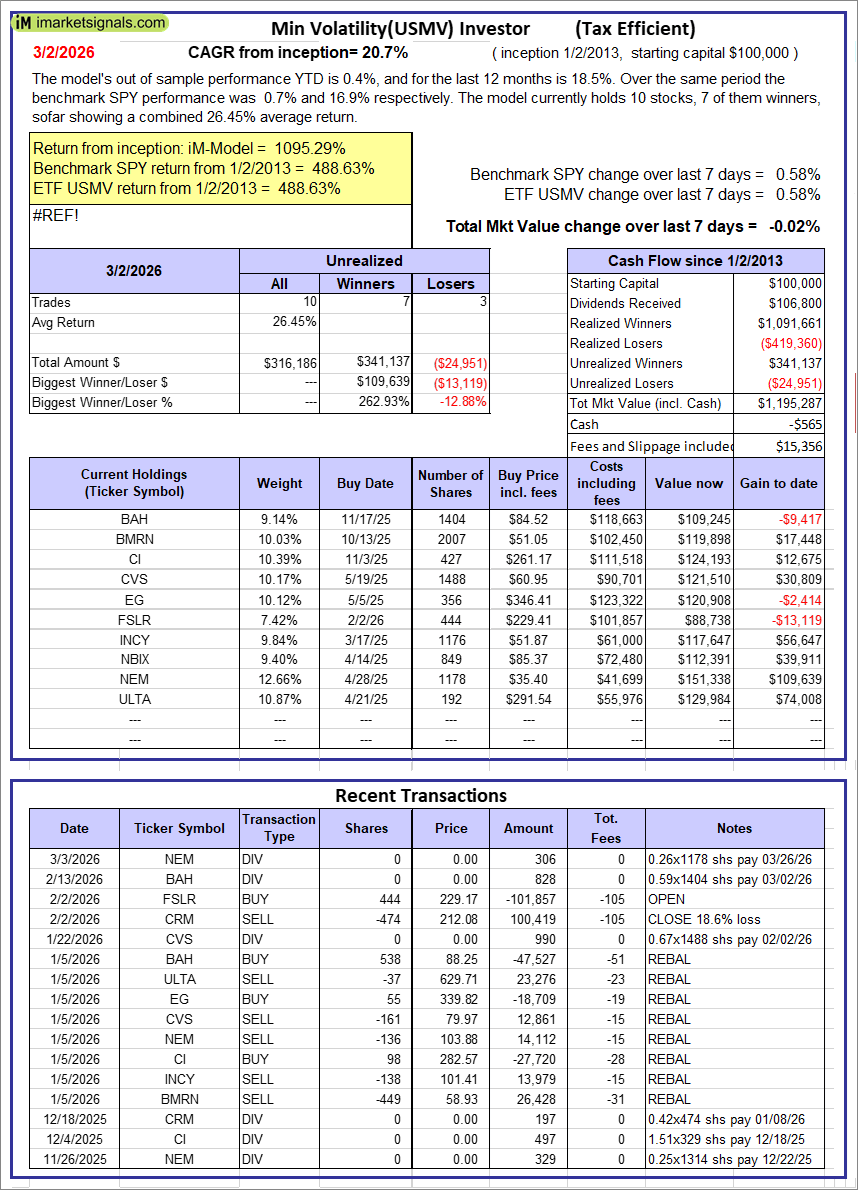 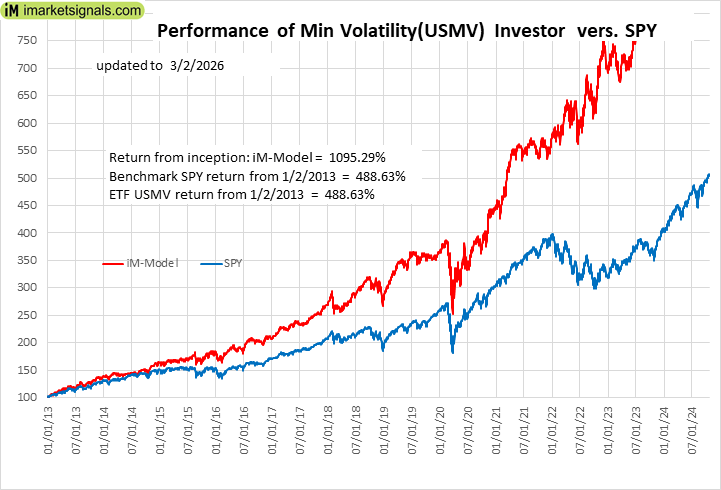 |
iM-Min Volatility(USMV) Investor (Tax Efficient): The model’s out of sample performance YTD is 0.4%, and for the last 12 months is 18.5%. Over the same period the benchmark SPY performance was 0.7% and 16.9% respectively. Since inception, on 1/3/2013, the model gained 1095.29% while the benchmark SPY gained 488.63% and the ETF USMV gained 488.63% over the same period. Over the previous week the market value of iM-Best12(USMV)Q1 gained -0.02% at a time when SPY gained 0.58%. A starting capital of $100,000 at inception on 1/3/2013 would have grown to $1,195,287 which includes -$565 cash and excludes $15,356 spent on fees and slippage. |
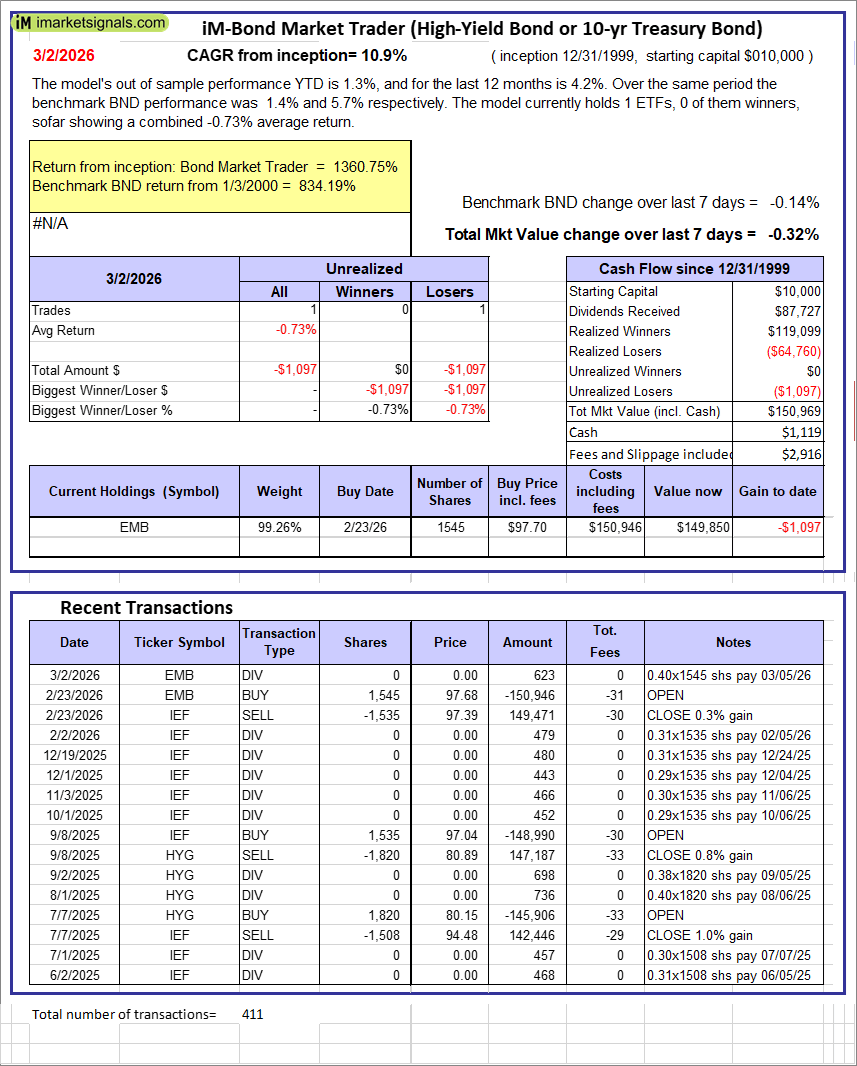 |
iM-Bond Market Trader (High-Yield Bond or 10-yr Treasury Bond): The model’s out of sample performance YTD is 1.3%, and for the last 12 months is 4.2%. Over the same period the benchmark BND performance was 1.4% and 5.7% respectively. Over the previous week the market value of the iM-Bond Market Trader (High-Yield Bond or 10-yr Treasury Bond) gained -0.32% at a time when BND gained -0.14%. A starting capital of $10,000 at inception on 1/3/2000 would have grown to $150,969 which includes $1,119 cash and excludes $2,916 spent on fees and slippage. |
|
|
iM-ModSum/YieldCurve Timer: The model’s out of sample performance YTD is 1.9%, and for the last 12 months is 17.7%. Over the same period the benchmark SPY performance was 0.7% and 16.9% respectively. Over the previous week the market value of iM-PortSum/YieldCurve Timer gained 0.58% at a time when SPY gained 0.58%. A starting capital of $100,000 at inception on 1/1/2016 would have grown to $390,391 which includes $4,646 cash and excludes $2,335 spent on fees and slippage. |
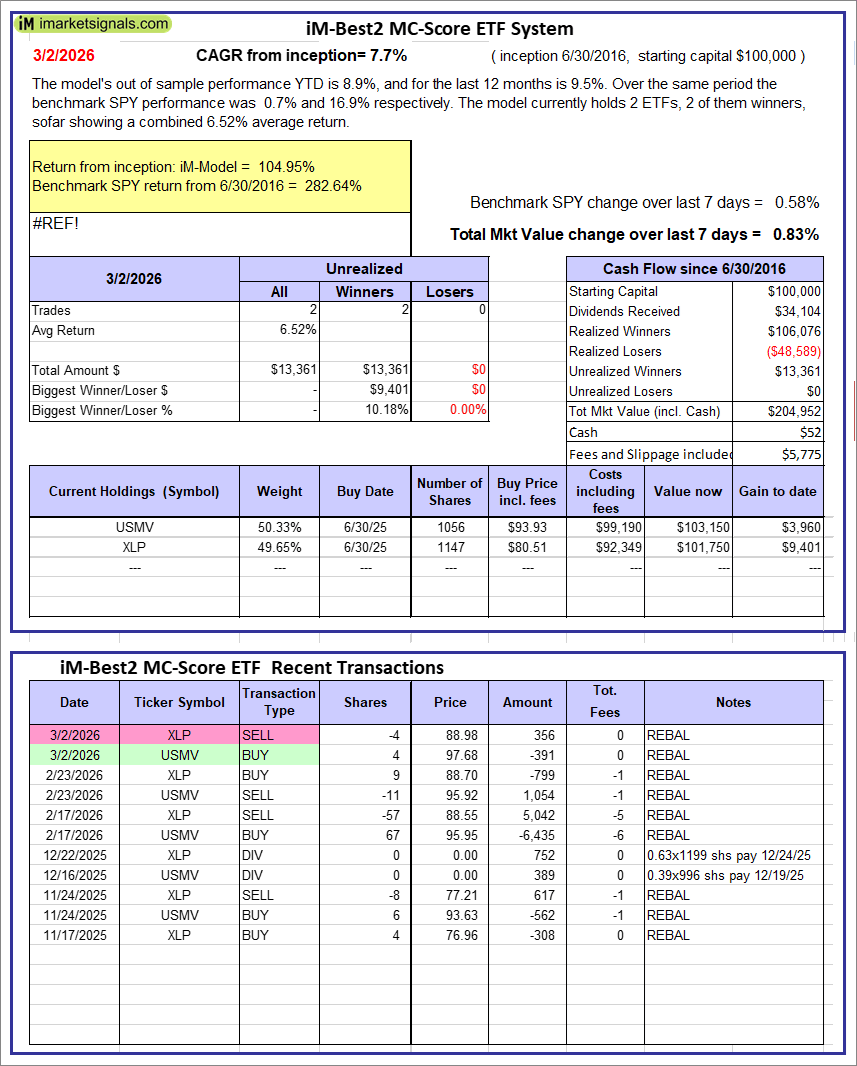 |
iM-Best2 MC-Score ETF System: The model’s out of sample performance YTD is 8.9%, and for the last 12 months is 9.5%. Over the same period the benchmark SPY performance was 0.7% and 16.9% respectively. Over the previous week the market value of the iM-Best2 MC-Score ETF System gained 0.83% at a time when SPY gained 0.58%. A starting capital of $100,000 at inception on 6/30/2016 would have grown to $204,952 which includes $52 cash and excludes $5,775 spent on fees and slippage. |
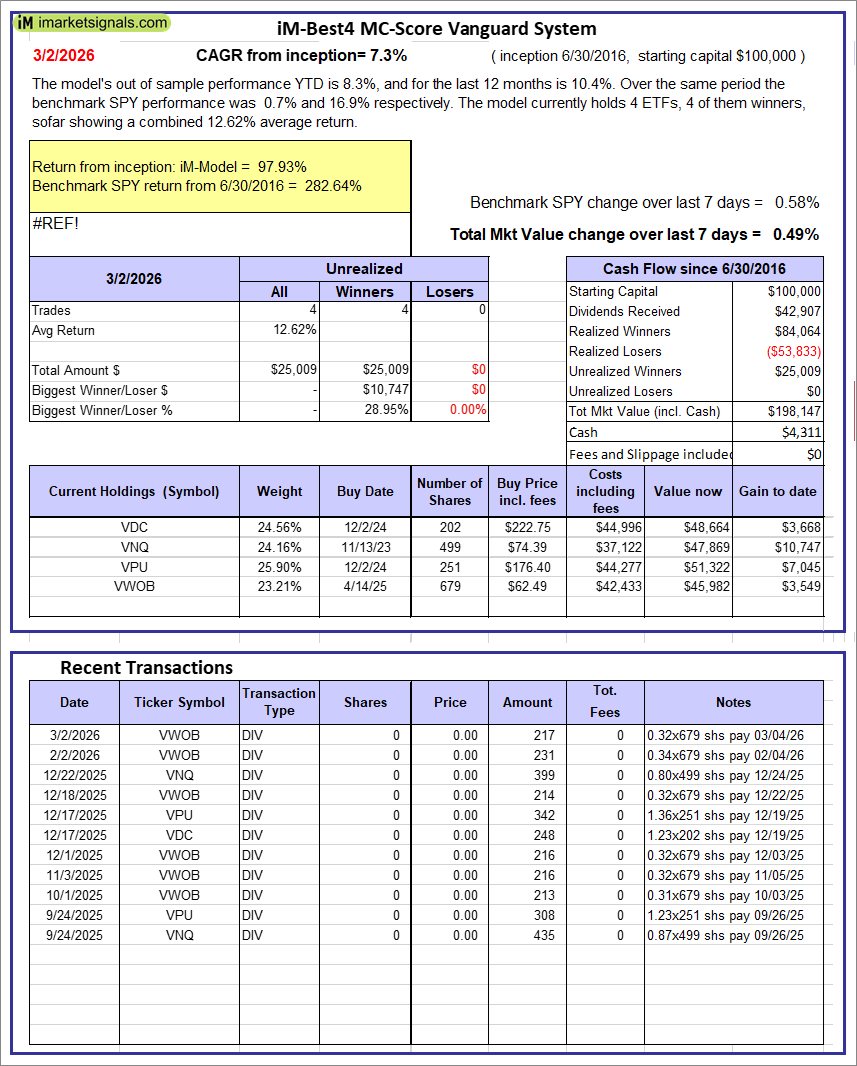 |
iM-Best4 MC-Score Vanguard System: The model’s out of sample performance YTD is 8.3%, and for the last 12 months is 10.4%. Over the same period the benchmark SPY performance was 0.7% and 16.9% respectively. Over the previous week the market value of the iM-Best4 MC-Score Vanguard System gained 0.49% at a time when SPY gained 0.58%. A starting capital of $100,000 at inception on 6/30/2016 would have grown to $198,147 which includes $4,311 cash and excludes $00 spent on fees and slippage. |
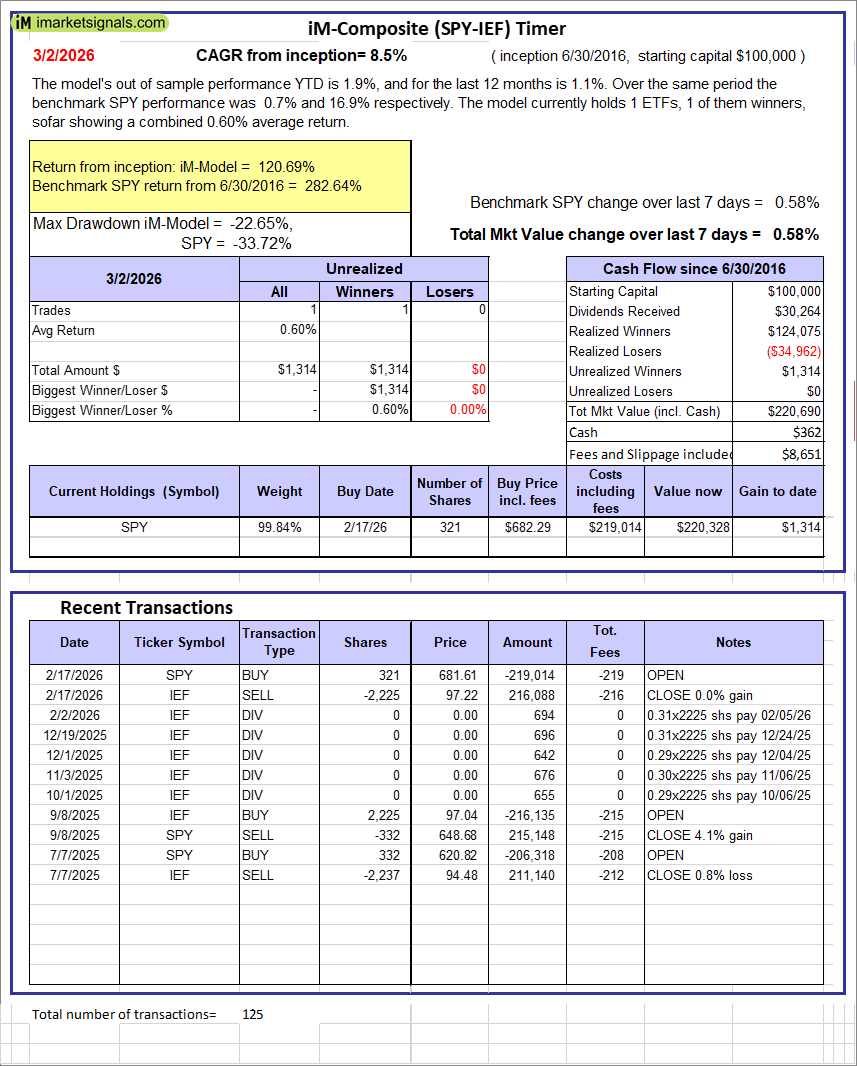 |
iM-Composite (SPY-IEF) Timer: The model’s out of sample performance YTD is 1.9%, and for the last 12 months is 1.1%. Over the same period the benchmark SPY performance was 0.7% and 16.9% respectively. Over the previous week the market value of the iM-Composite (SPY-IEF) Timer gained 0.58% at a time when SPY gained 0.58%. A starting capital of $100,000 at inception on 6/30/2016 would have grown to $220,690 which includes $362 cash and excludes $8,651 spent on fees and slippage. |
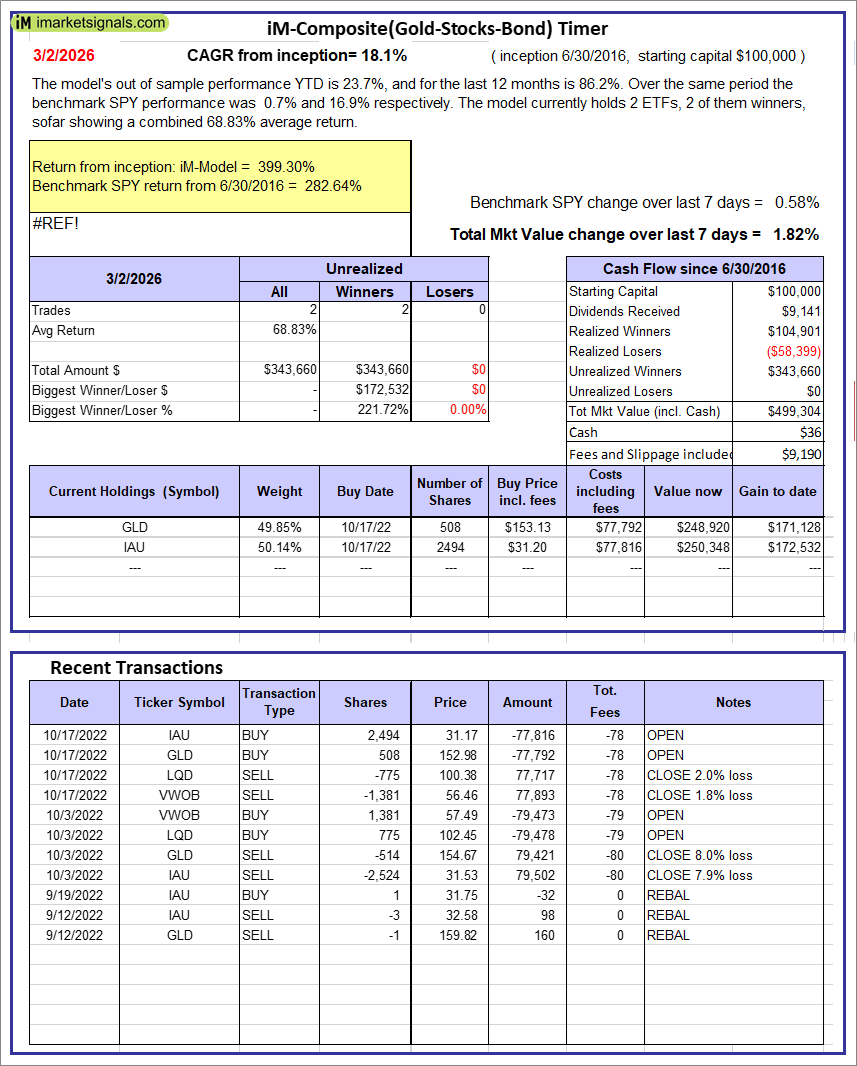 |
iM-Composite(Gold-Stocks-Bond) Timer: The model’s out of sample performance YTD is 23.7%, and for the last 12 months is 86.2%. Over the same period the benchmark SPY performance was 0.7% and 16.9% respectively. Over the previous week the market value of the iM-Composite(Gold-Stocks-Bond) Timer gained 1.82% at a time when SPY gained 0.58%. A starting capital of $100,000 at inception on 6/30/2016 would have grown to $499,304 which includes $36 cash and excludes $9,190 spent on fees and slippage. |
iM-Best Reports – 3/3/2026
Posted in pmp SPY-SH