
  |
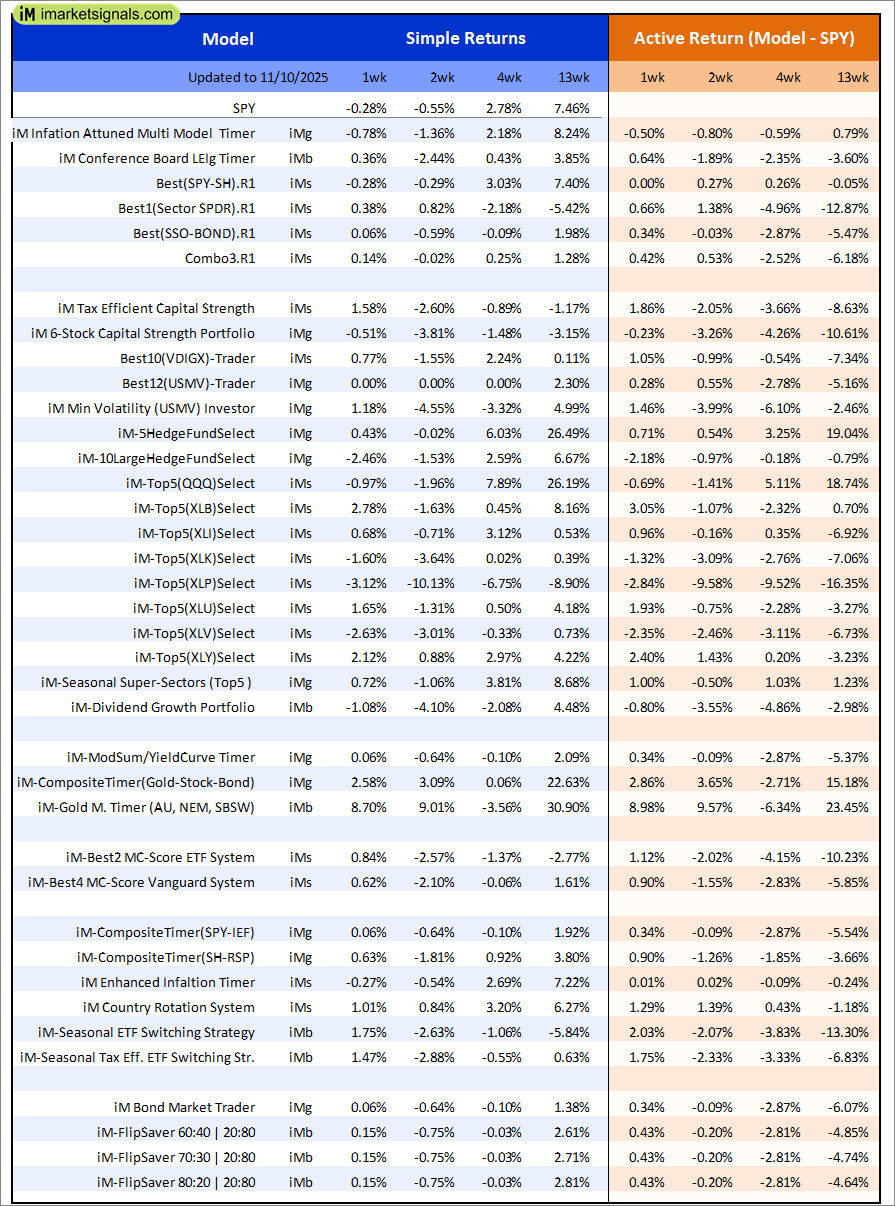
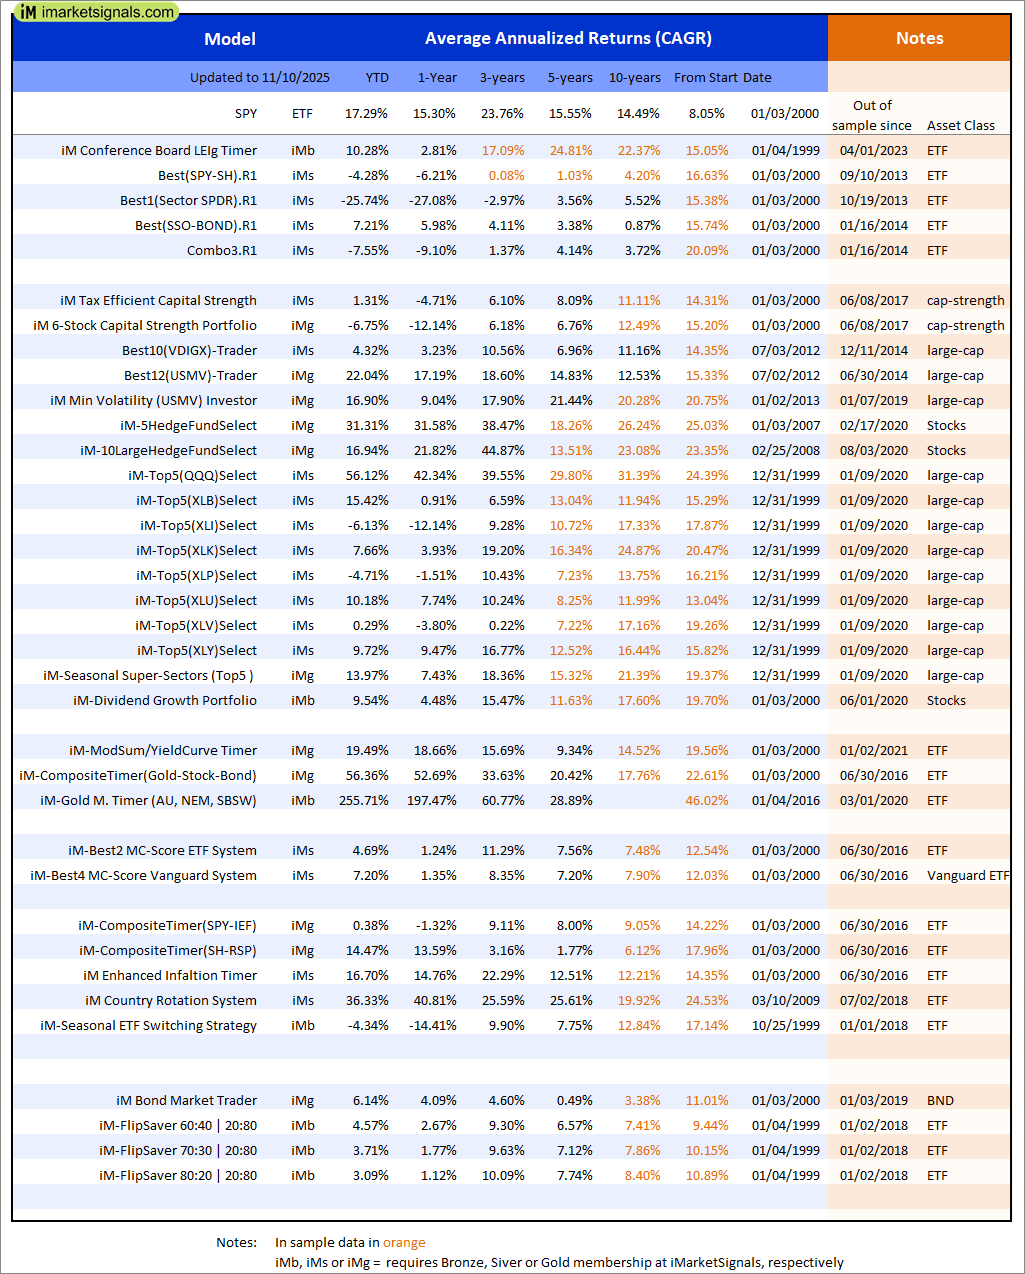
Out of sample performance summary of our models for the past 1, 2, 4 and 13 week periods. The active active return indicates how the models over- or underperformed the benchmark ETF SPY. Also the YTD, and the 1-, 3-, 5- and 10-year annualized returns are shown in the second table |
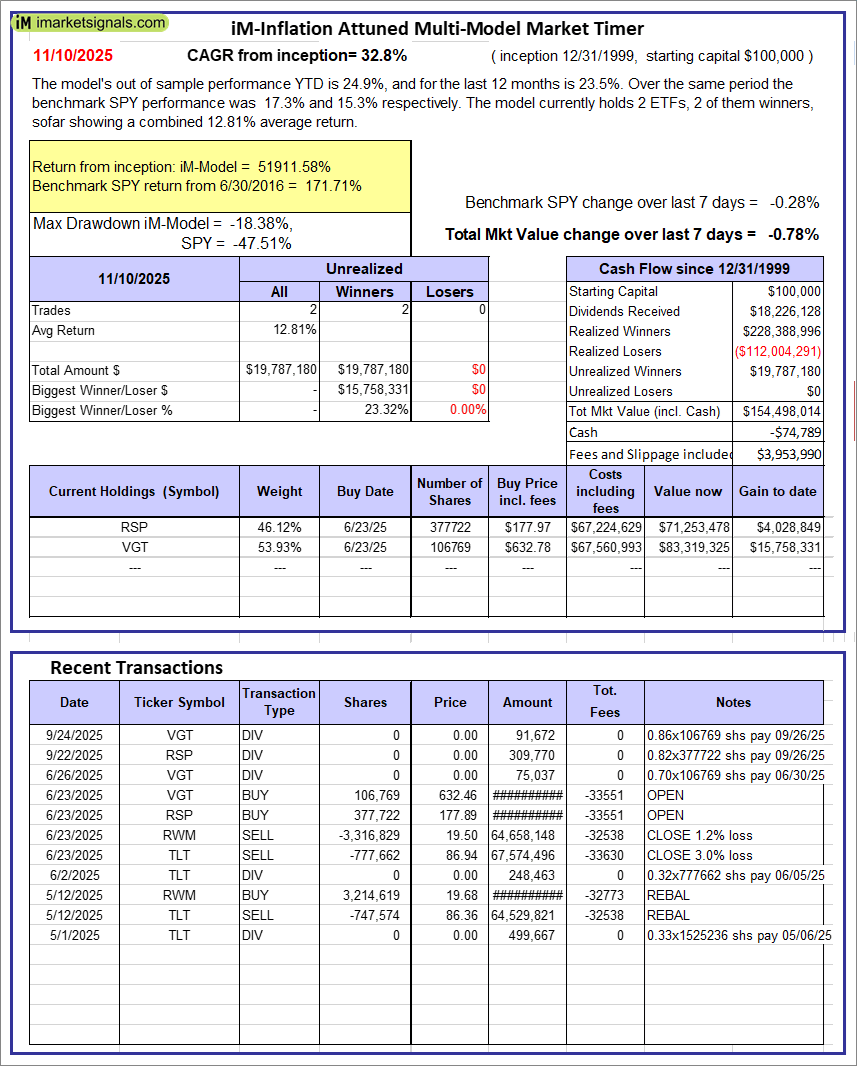 |
iM-Inflation Attuned Multi-Model Market Timer: The model’s out of sample performance YTD is 24.9%, and for the last 12 months is 23.5%. Over the same period the benchmark SPY performance was 17.3% and 15.3% respectively. Over the previous week the market value of the iM-Inflation Attuned Multi-Model Market Timer gained -0.78% at a time when SPY gained -0.28%. A starting capital of $100,000 at inception on 3/24/2017 would have grown to $154,498,014 which includes -$74,789 cash and excludes $3,953,990 spent on fees and slippage. |
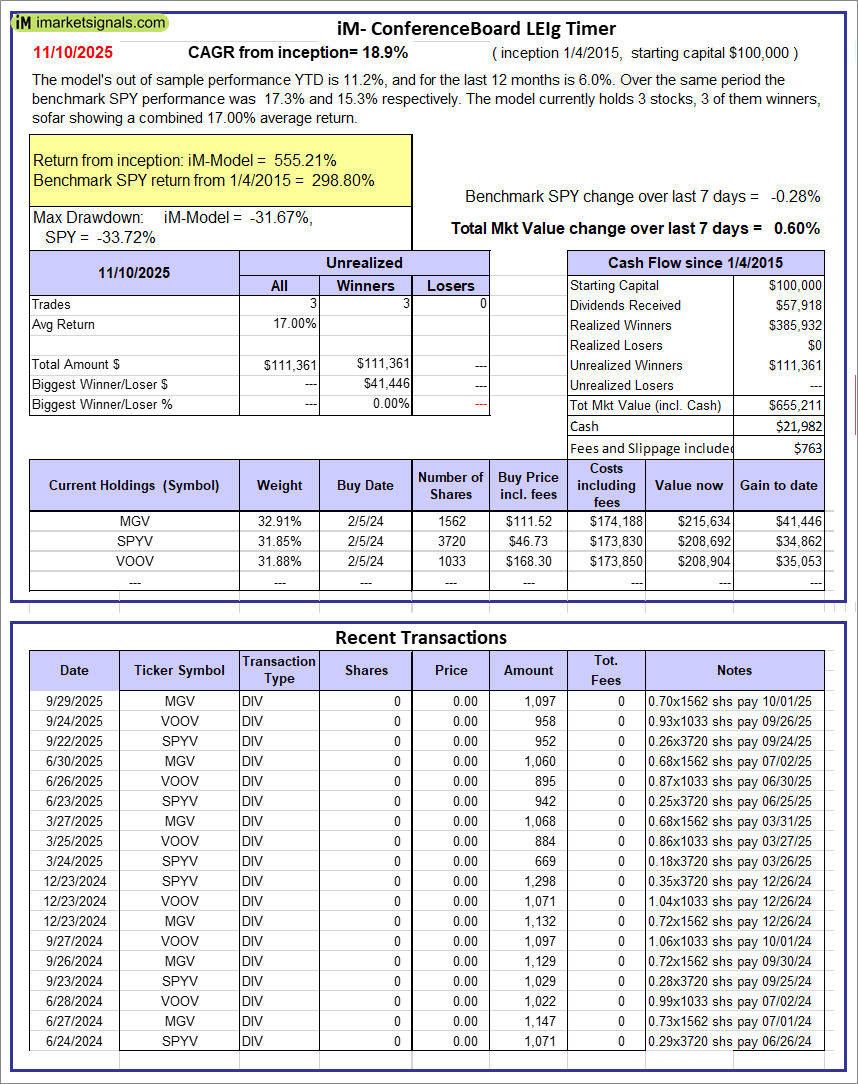 |
iM-Conference Board LEIg Timer: The model’s performance YTD is 14.3%, and for the last 12 months is 7.3%. Over the same period the benchmark SPY performance was 20.1% and 9.4% respectively. Over the previous week the market value of the iM-Conference Board LEIg Timer gained 0.60% at a time when SPY gained -0.28%. A starting capital of $100,000 at inception on 4/5/2017 would have grown to $655,211 which includes $21,982 cash and excludes $763 spent on fees and slippage. |
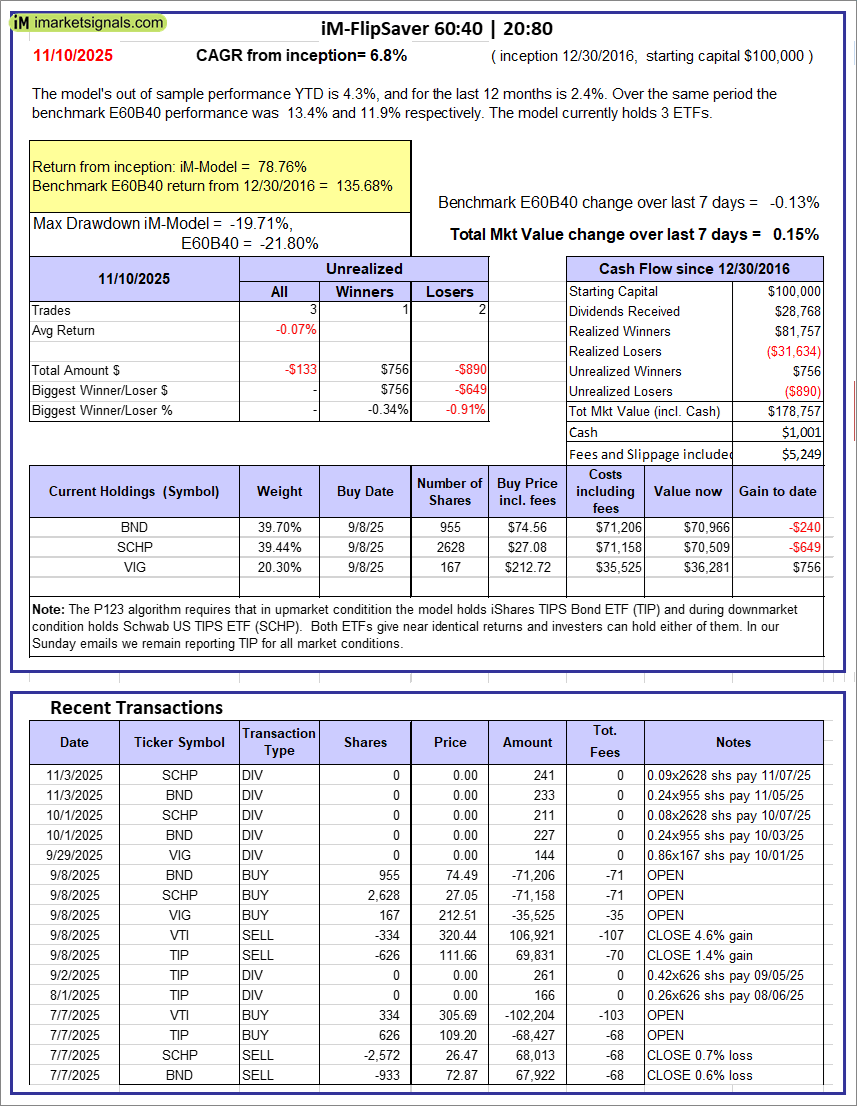 |
iM-FlipSaver 60:40 | 20:80 – 2017: The model’s out of sample performance YTD is 4.3%, and for the last 12 months is 2.4%. Over the same period the benchmark E60B40 performance was 13.4% and 11.9% respectively. Over the previous week the market value of iM-FlipSaver 80:20 | 20:80 gained 0.15% at a time when SPY gained -0.13%. A starting capital of $100,000 at inception on 7/16/2015 would have grown to $178,757 which includes $1,001 cash and excludes $5,249 spent on fees and slippage. |
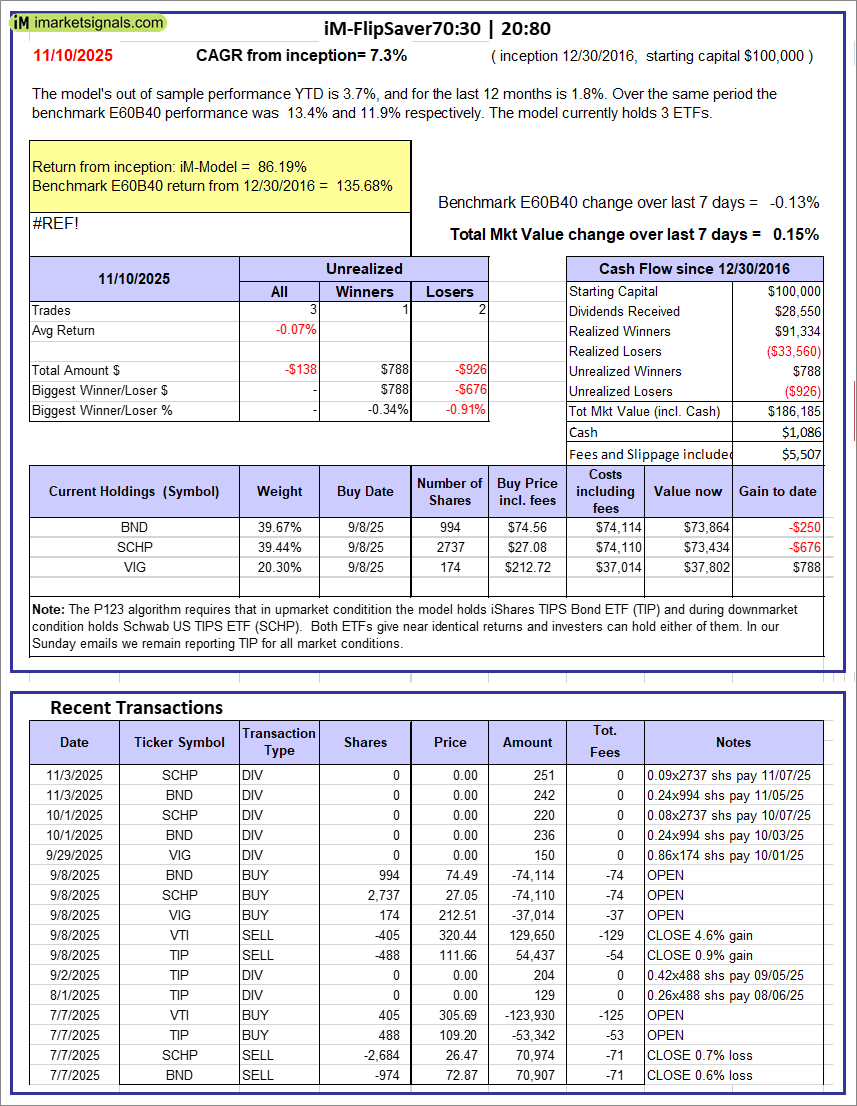 |
iM-FlipSaver 70:30 | 20:80 – 2017: The model’s out of sample performance YTD is 3.7%, and for the last 12 months is 1.8%. Over the same period the benchmark E60B40 performance was 13.4% and 11.9% respectively. Over the previous week the market value of iM-FlipSaver 70:30 | 20:80 gained 0.15% at a time when SPY gained -0.13%. A starting capital of $100,000 at inception on 7/15/2015 would have grown to $186,185 which includes $1,086 cash and excludes $5,507 spent on fees and slippage. |
 |
iM-FlipSaver 80:20 | 20:80 – 2017: The model’s out of sample performance YTD is 3.1%, and for the last 12 months is 1.1%. Over the same period the benchmark E60B40 performance was 13.4% and 11.9% respectively. Over the previous week the market value of iM-FlipSaver 80:20 | 20:80 gained 0.15% at a time when SPY gained -0.13%. A starting capital of $100,000 at inception on 1/2/2017 would have grown to $193,527 which includes $1,138 cash and excludes $5,756 spent on fees and slippage. |
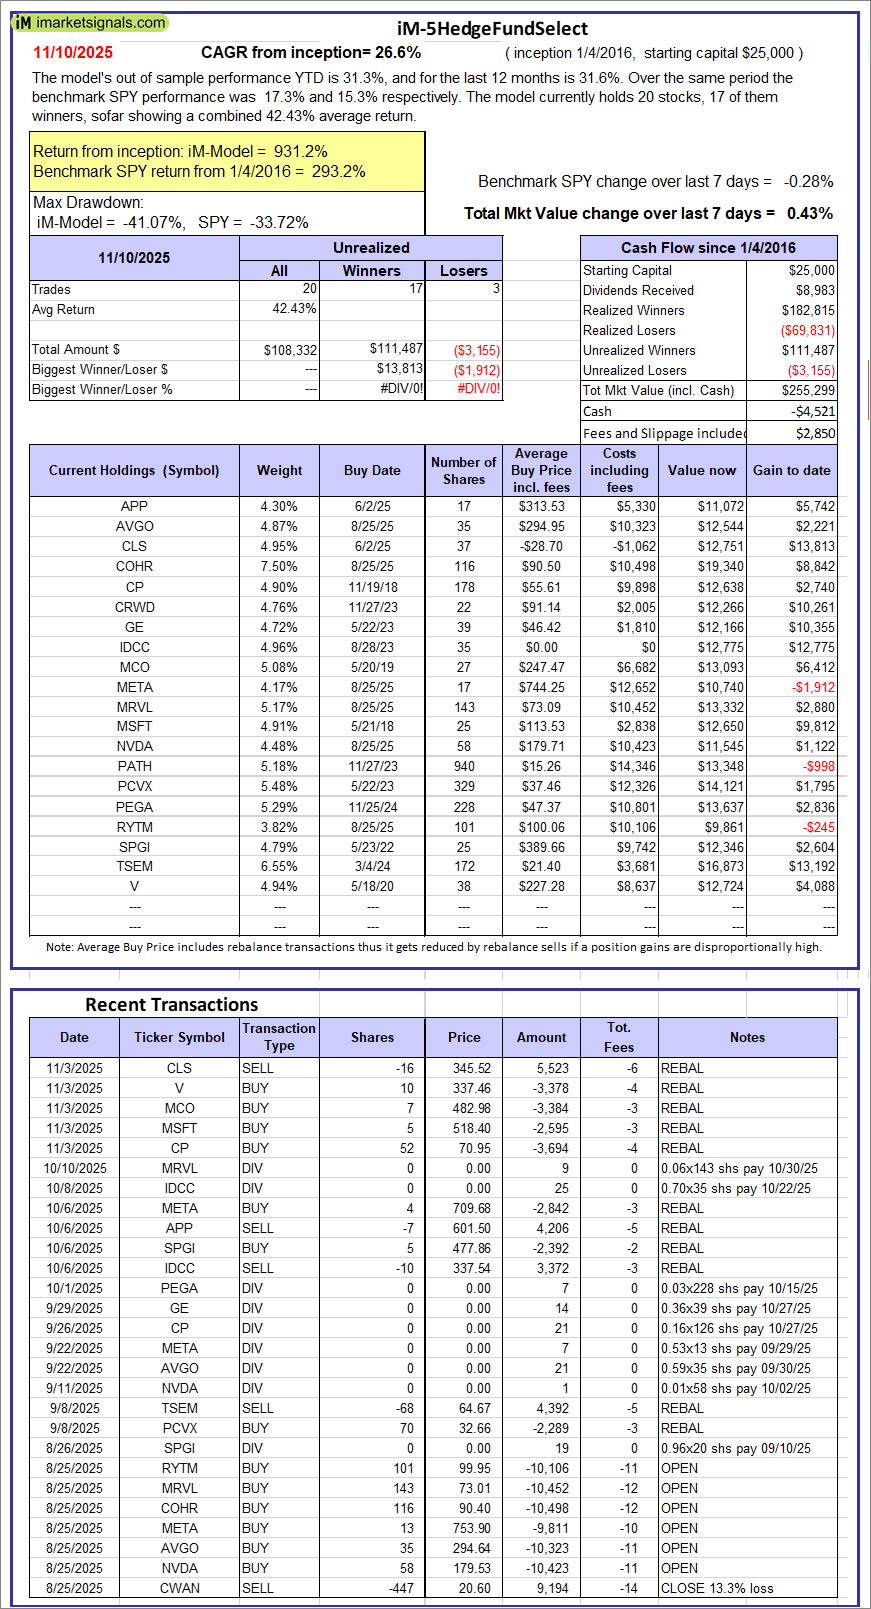 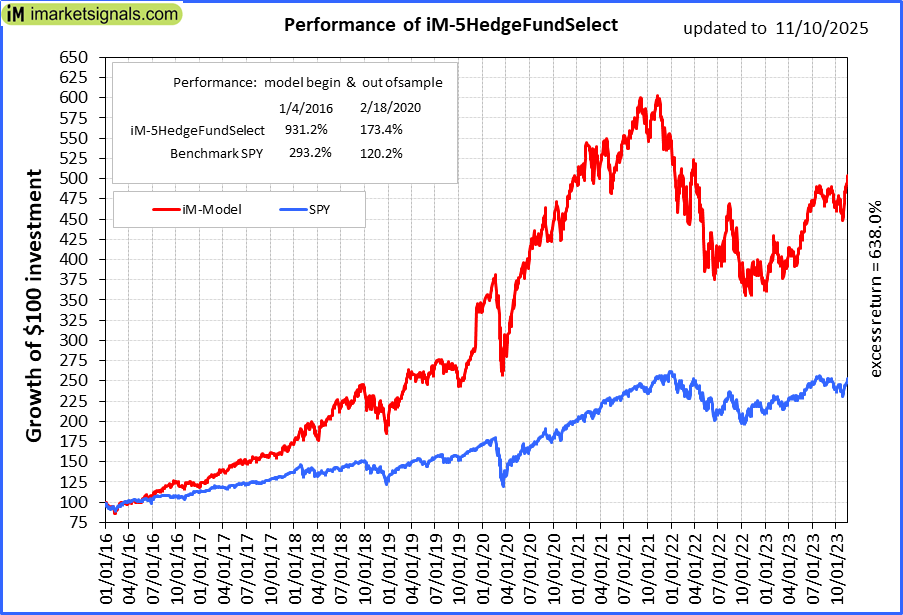 |
iM-5HedgeFundSelect: Since inception, on 1/5/2016, the model gained 931.18% while the benchmark SPY gained 293.22% over the same period. Over the previous week the market value of iM-5HedgeFundSelect gained 0.43% at a time when SPY gained -0.28%. A starting capital of $25,000 at inception on 1/5/2016 would have grown to $255,299 which includes -$4,521 cash and excludes $2,850 spent on fees and slippage. |
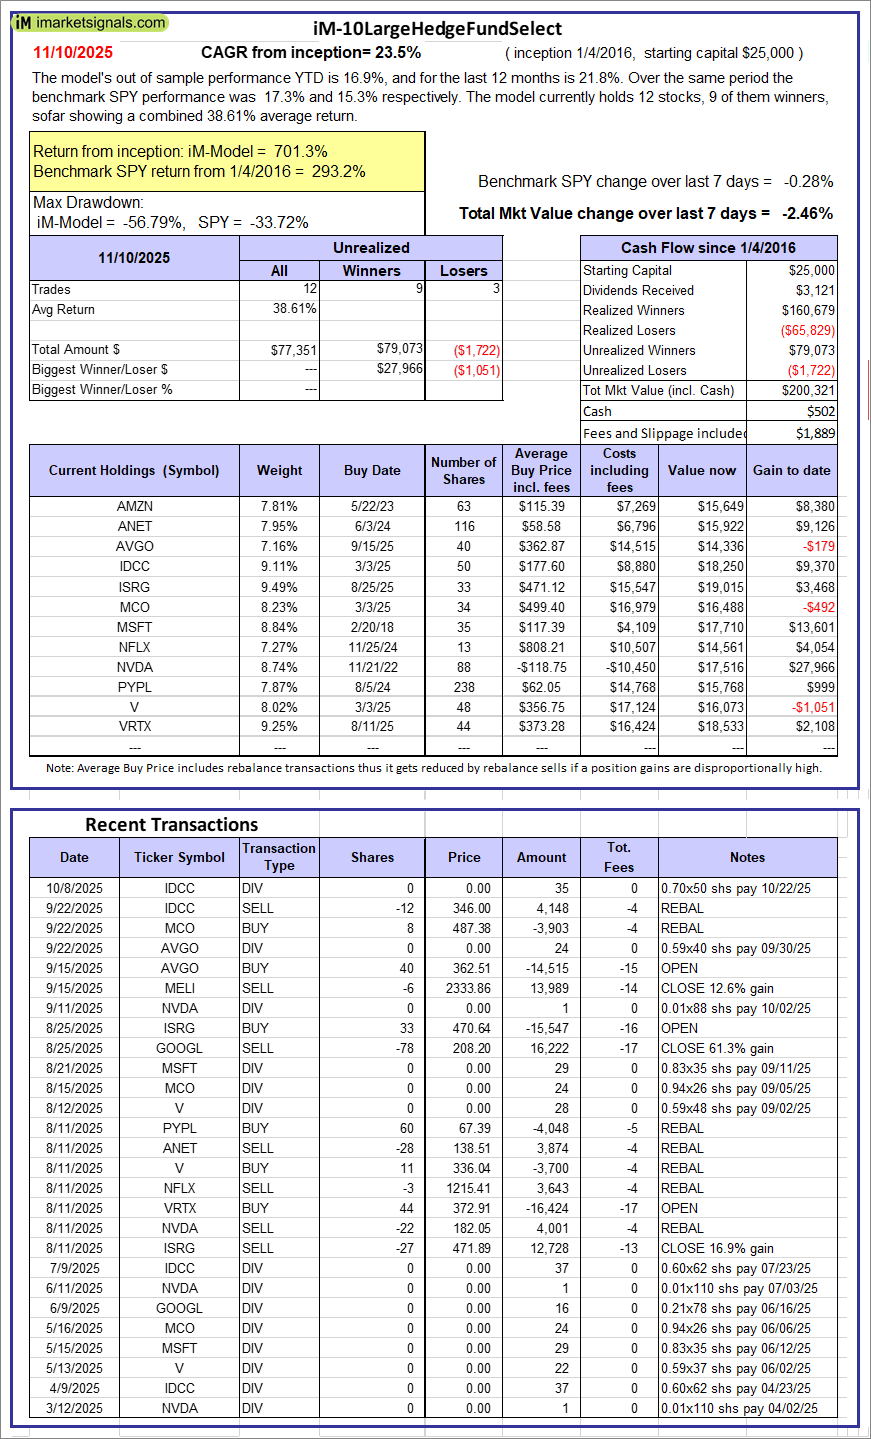 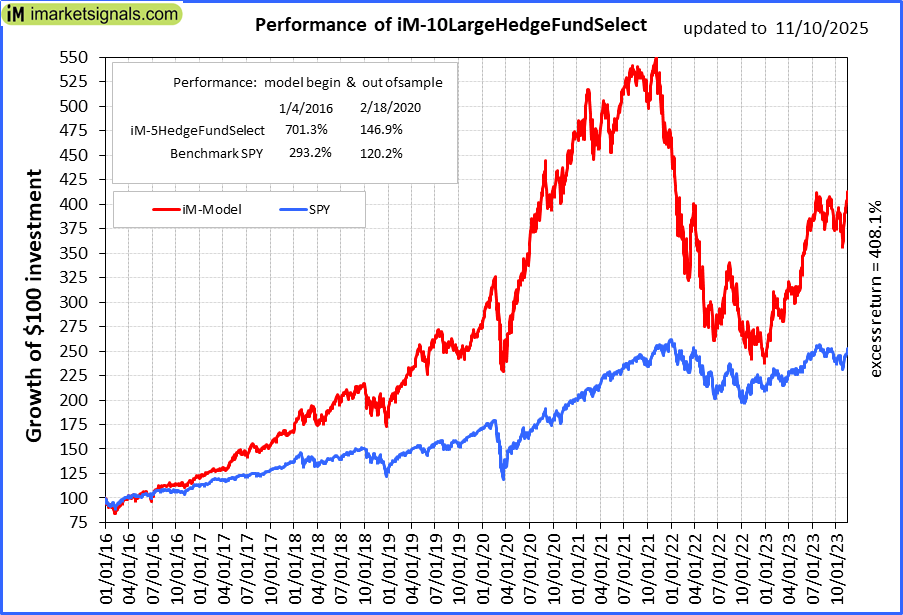 |
iM-10LargeHedgeFundSelect: Since inception, on 1/5/2016, the model gained 701.29% while the benchmark SPY gained 293.22% over the same period. Over the previous week the market value of iM-10LargeHedgeFundSelect gained -2.46% at a time when SPY gained -0.28%. A starting capital of $25,000 at inception on 1/5/2016 would have grown to $200,321 which includes $502 cash and excludes $1,889 spent on fees and slippage. |
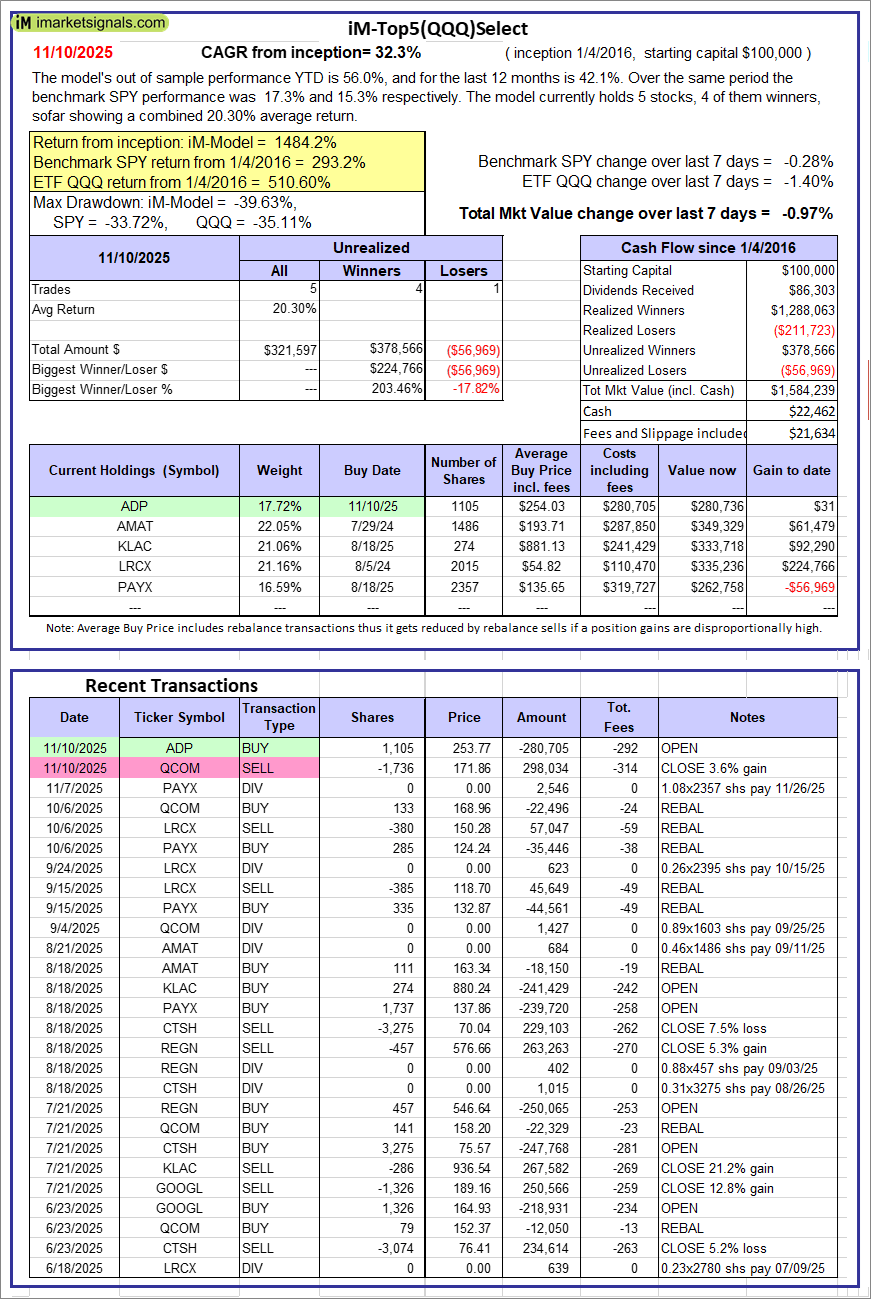 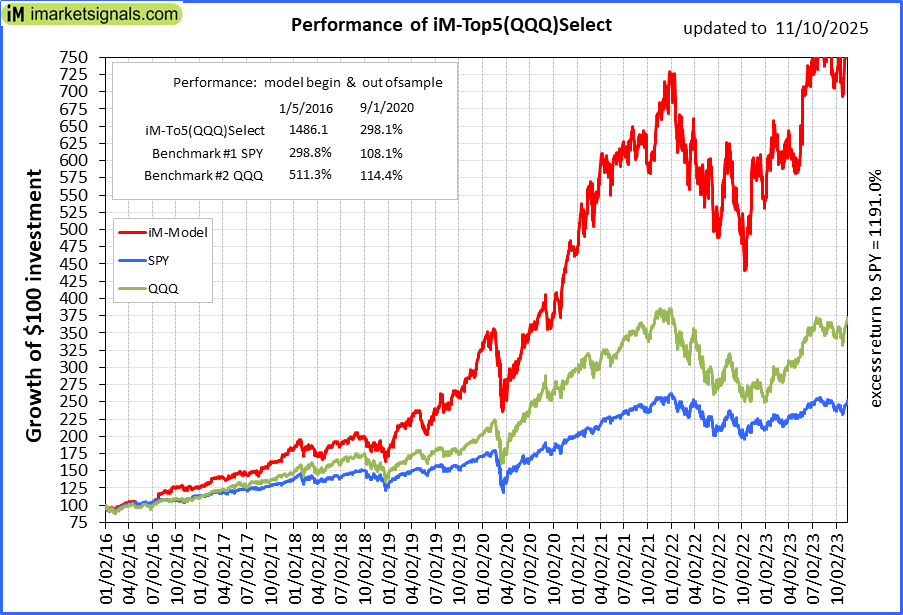 |
iM-Top5(QQQ)Select: Since inception, on 1/5/2016, the model gained 1484.24% while the benchmark SPY gained 293.22% over the same period. Over the previous week the market value of iM-Top5(QQQ)Select gained -0.97% at a time when SPY gained -0.28%. A starting capital of $100,000 at inception on 1/5/2016 would have grown to $1,584,239 which includes $22,462 cash and excludes $21,634 spent on fees and slippage. |
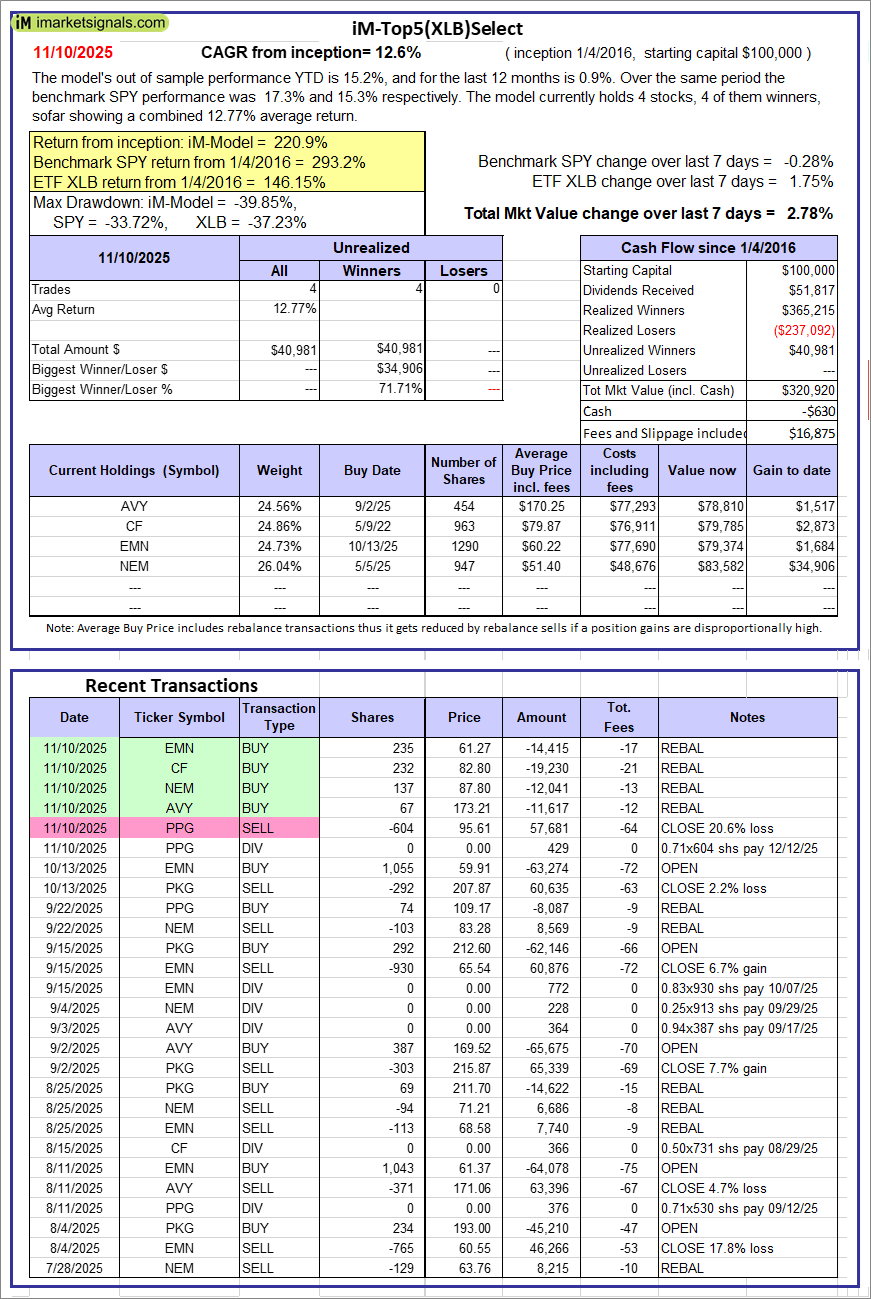 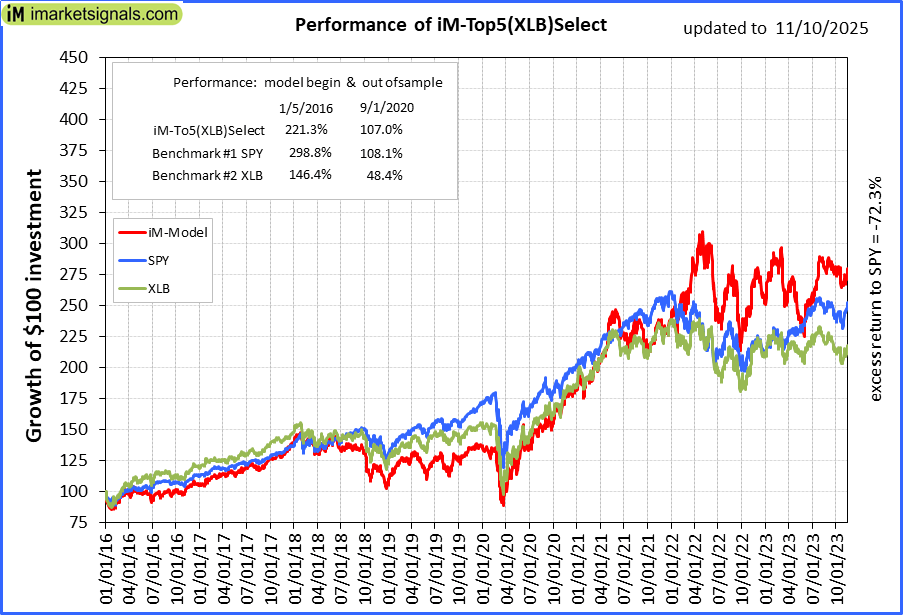 |
iM-Top5(XLB)Select: Since inception, on 1/5/2016, the model gained 220.92% while the benchmark SPY gained 293.22% over the same period. Over the previous week the market value of iM-Top5(XLB)Select gained 2.78% at a time when SPY gained -0.28%. A starting capital of $100,000 at inception on 1/5/2016 would have grown to $320,920 which includes -$630 cash and excludes $16,875 spent on fees and slippage. |
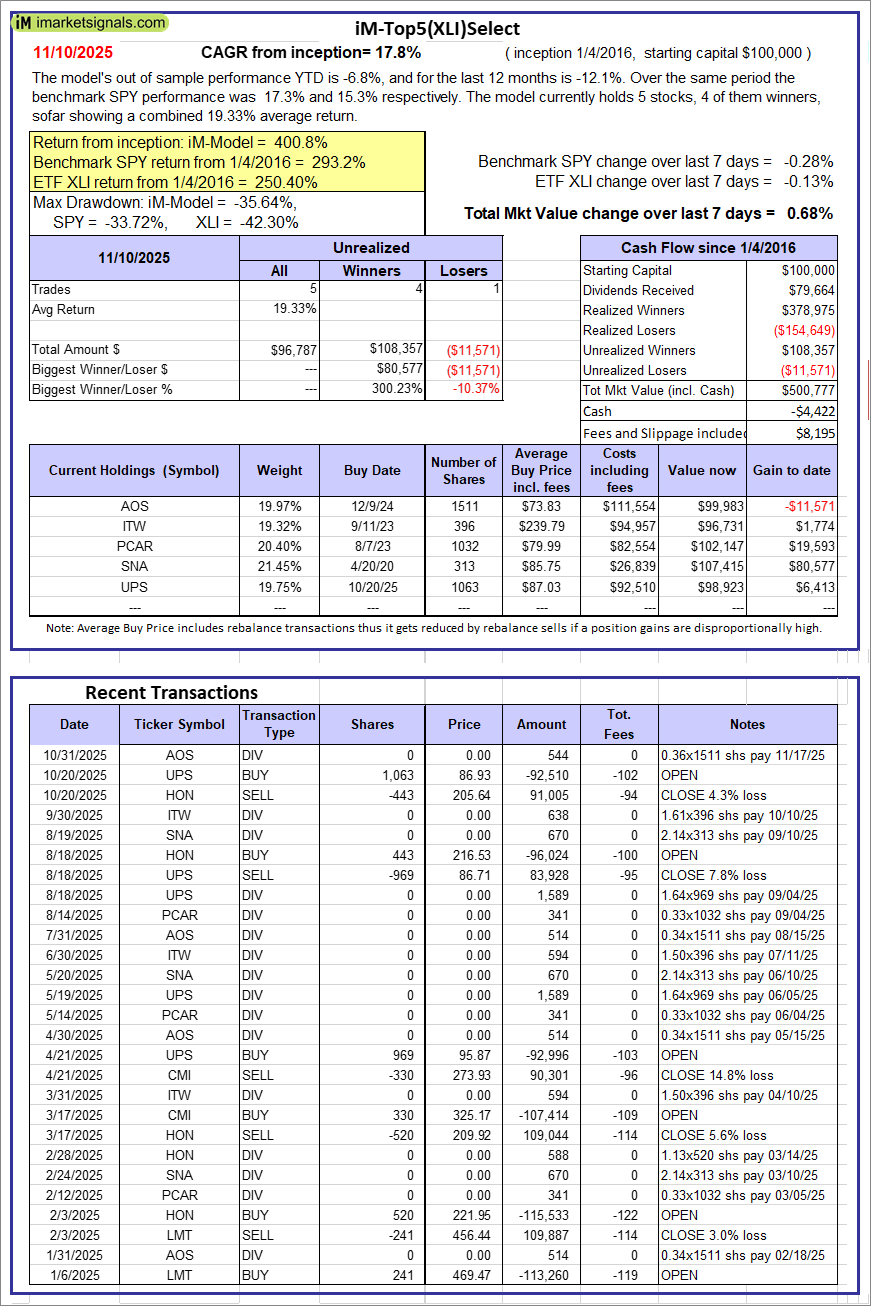 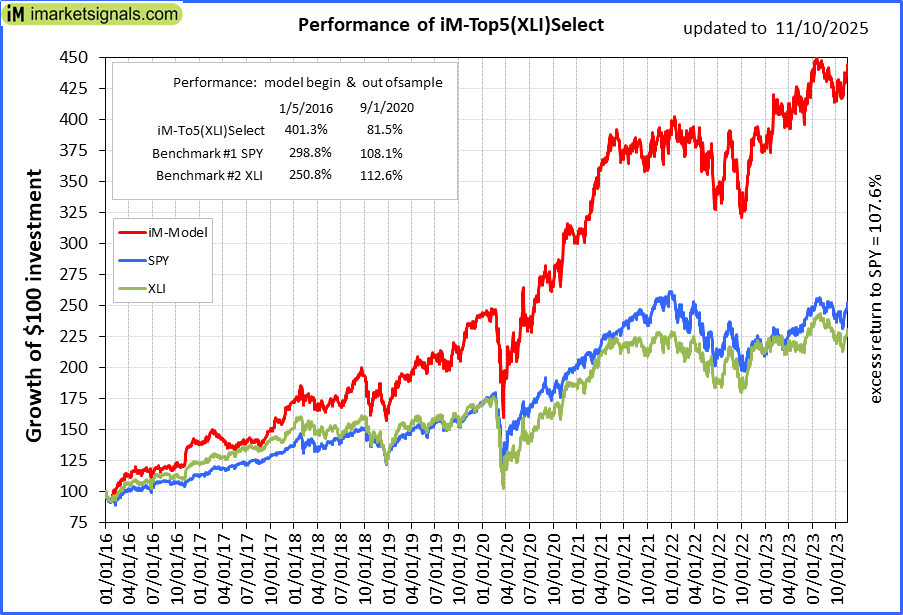 |
iM-Top5(XLI)Select: Since inception, on 1/5/2016, the model gained 400.78% while the benchmark SPY gained 293.22% over the same period. Over the previous week the market value of iM-Top5(XLI)Select gained 0.68% at a time when SPY gained -0.28%. A starting capital of $100,000 at inception on 1/5/2016 would have grown to $500,777 which includes -$4,422 cash and excludes $8,195 spent on fees and slippage. |
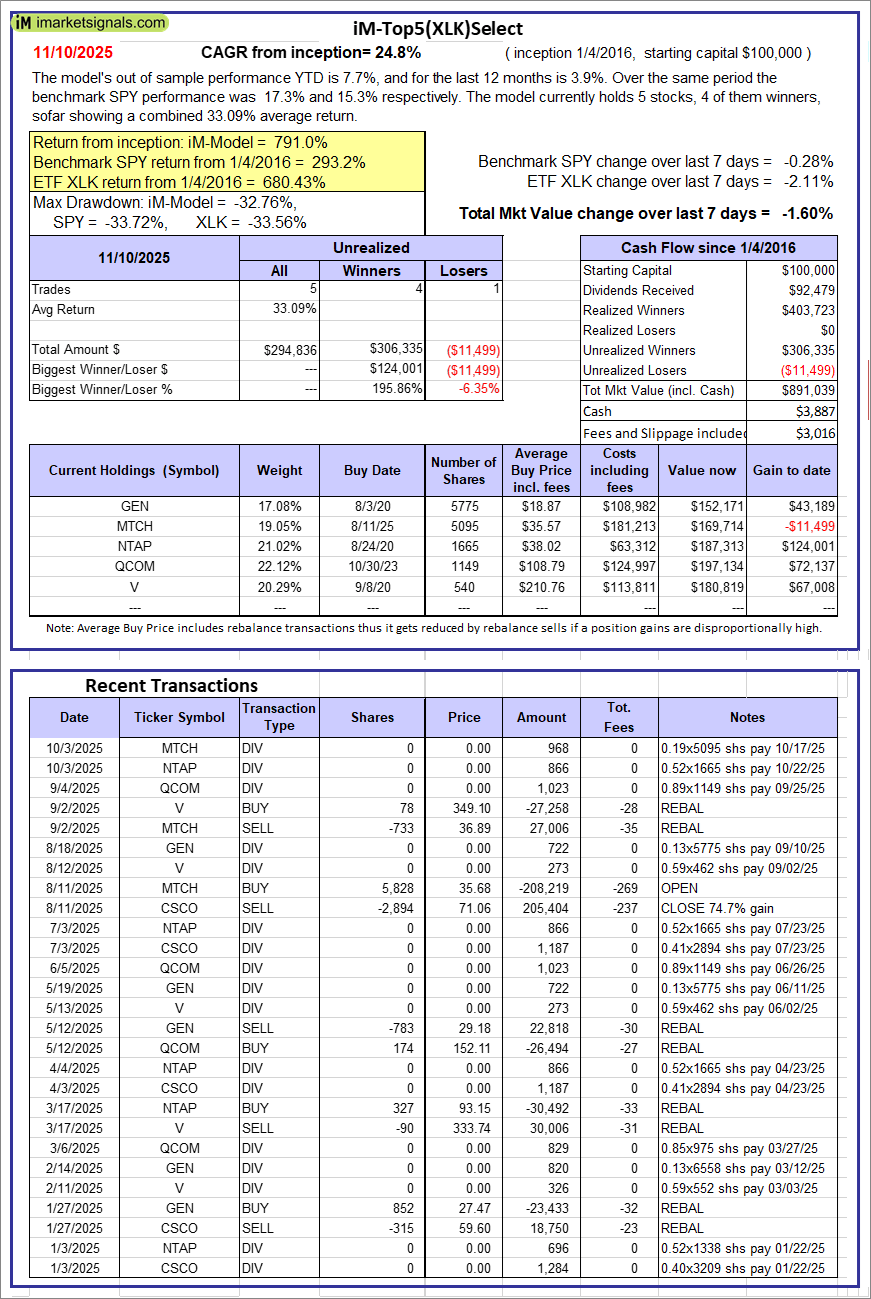 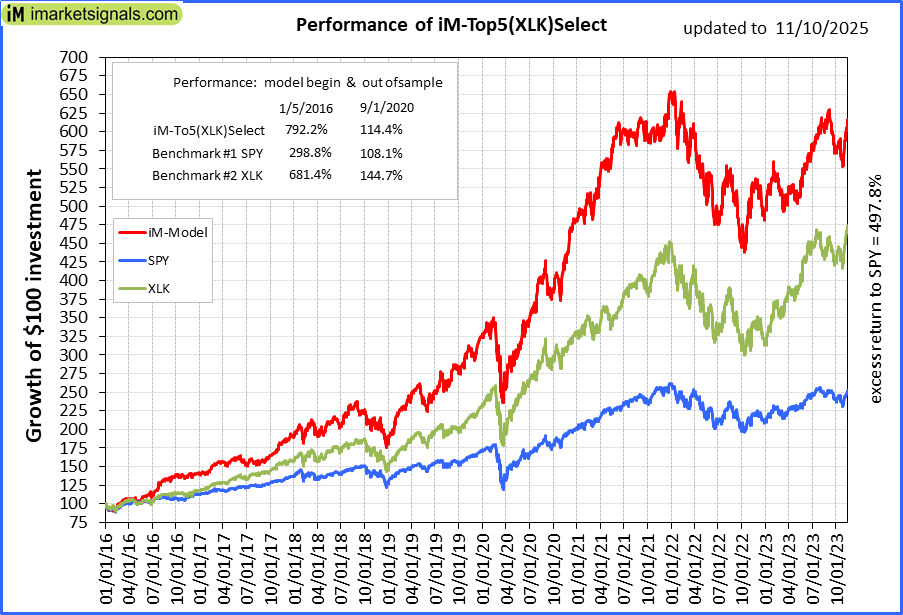 |
iM-Top5(XLK)Select: Since inception, on 1/5/2016, the model gained 791.04% while the benchmark SPY gained 293.22% over the same period. Over the previous week the market value of iM-Top5(XLK)Select gained -1.60% at a time when SPY gained -0.28%. A starting capital of $100,000 at inception on 1/5/2016 would have grown to $891,039 which includes $3,887 cash and excludes $3,016 spent on fees and slippage. |
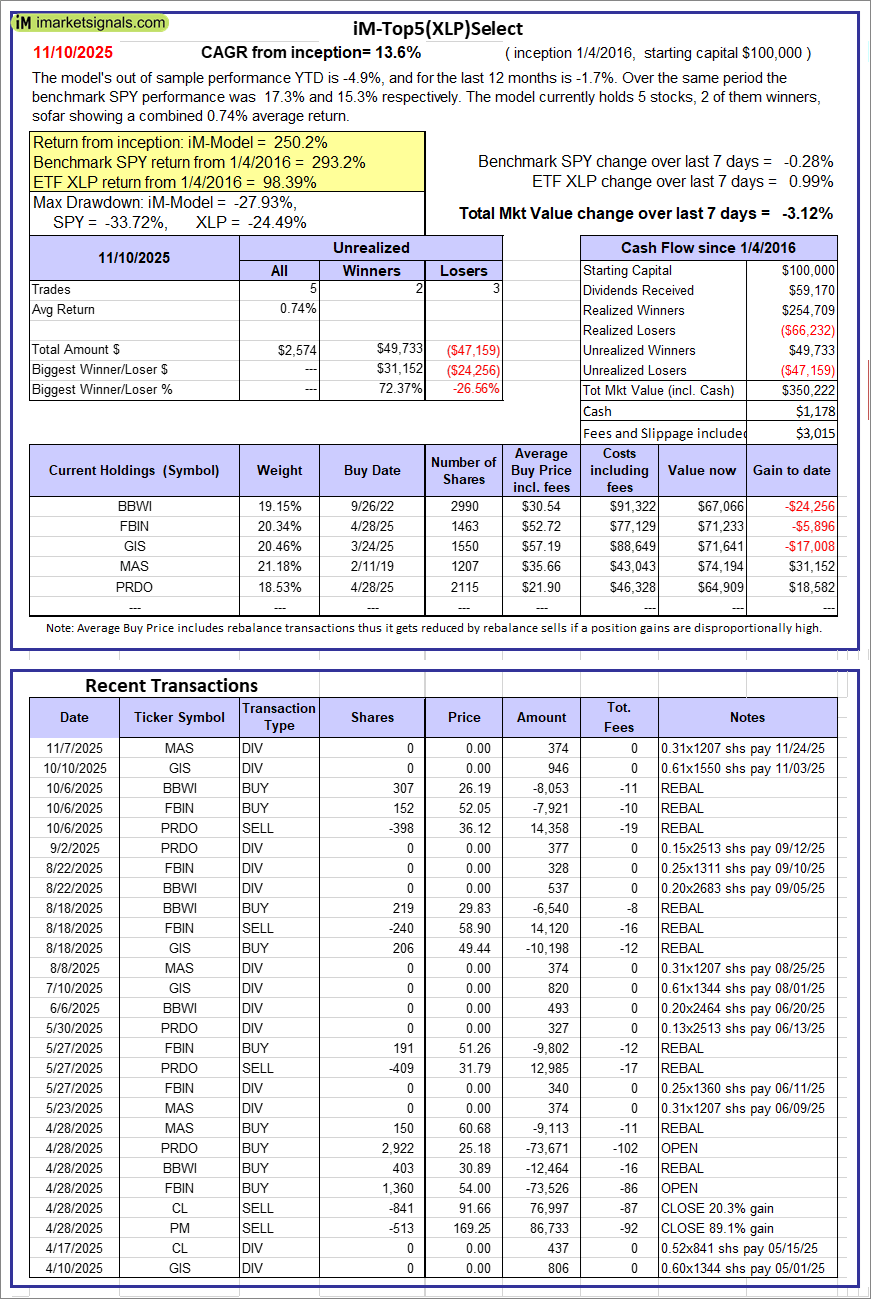 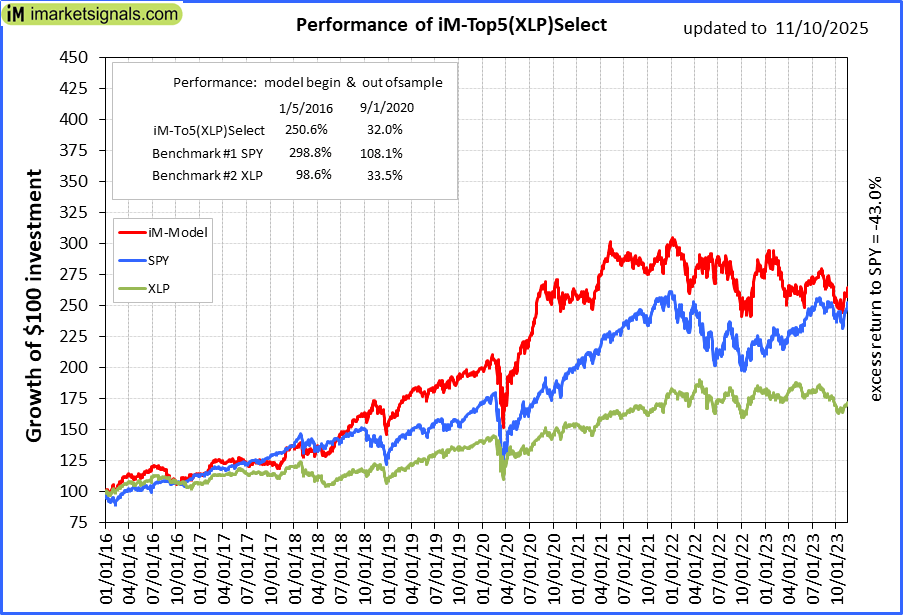 |
iM-Top5(XLP)Select: Since inception, on 1/5/2016, the model gained 250.22% while the benchmark SPY gained 293.22% over the same period. Over the previous week the market value of iM-Top5(XLP)Select gained -3.12% at a time when SPY gained -0.28%. A starting capital of $100,000 at inception on 1/5/2016 would have grown to $350,222 which includes $1,178 cash and excludes $3,015 spent on fees and slippage. |
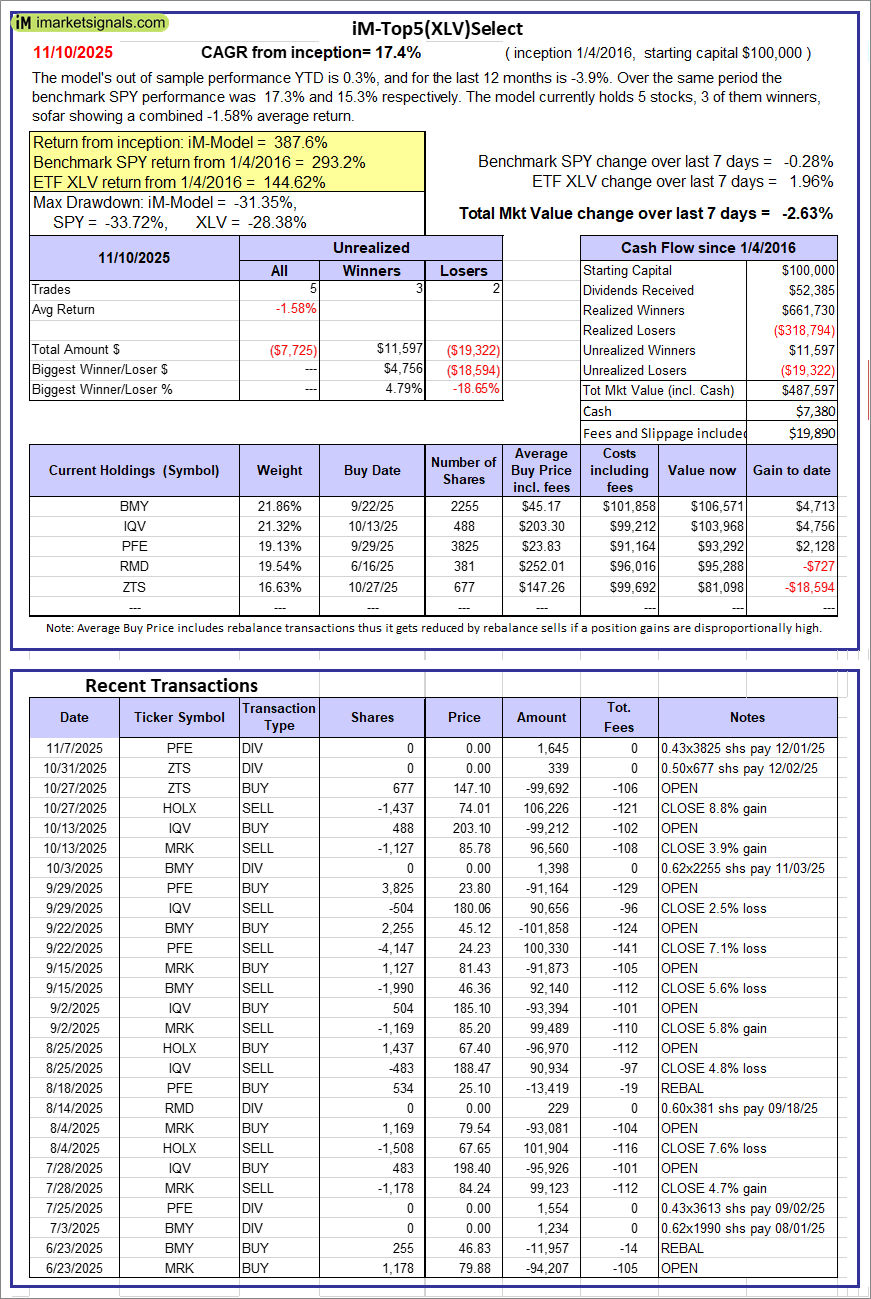 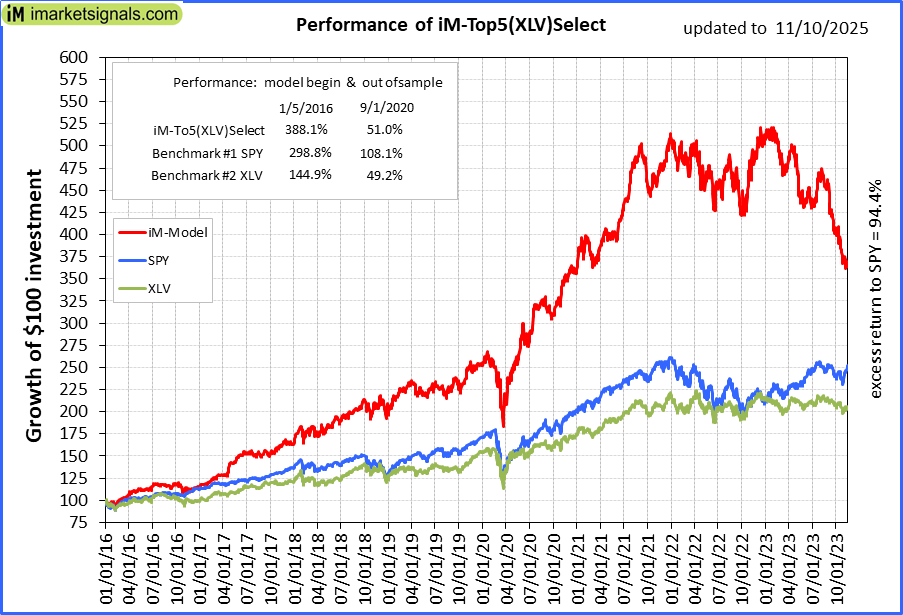 |
iM-Top5(XLV)Select: Since inception, on 1/5/2016, the model gained 387.60% while the benchmark SPY gained 293.22% over the same period. Over the previous week the market value of iM-Top5(XLV)Select gained -2.63% at a time when SPY gained -0.28%. A starting capital of $100,000 at inception on 1/5/2016 would have grown to $487,597 which includes $7,380 cash and excludes $19,890 spent on fees and slippage. |
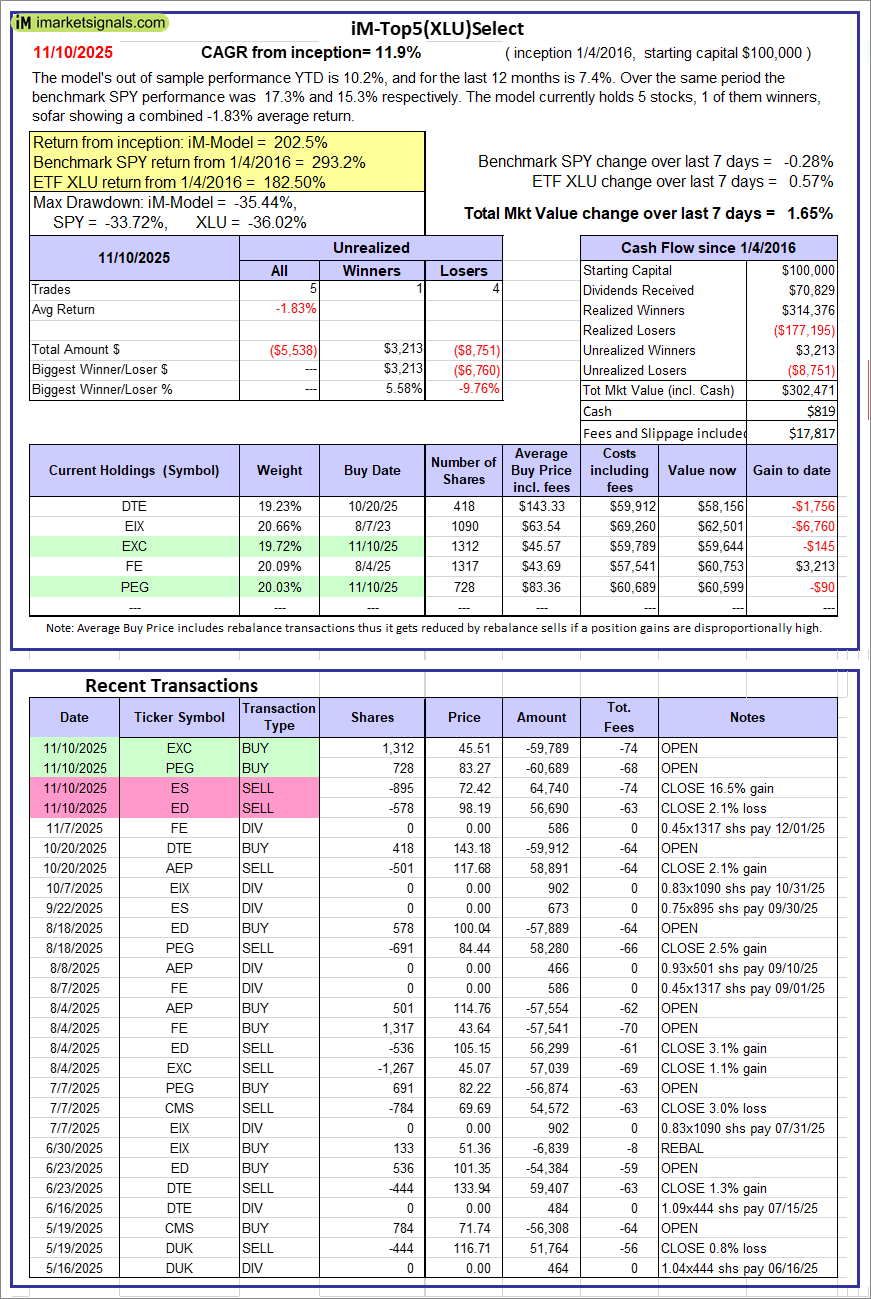 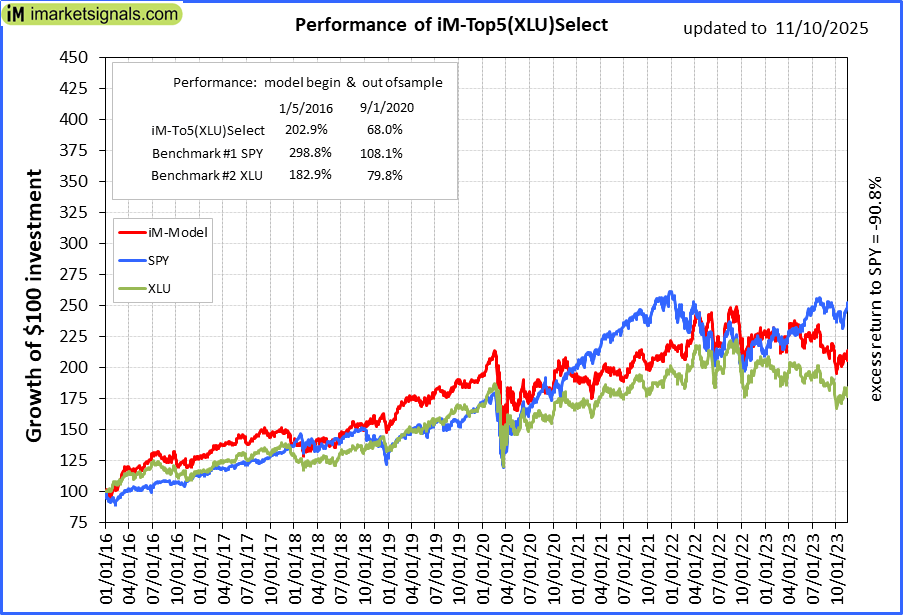 |
iM-Top5(XLU)Select: Since inception, on 1/5/2016, the model gained 202.47% while the benchmark SPY gained 293.22% over the same period. Over the previous week the market value of iM-Top5(XLU)Select gained 1.65% at a time when SPY gained -0.28%. A starting capital of $100,000 at inception on 1/5/2016 would have grown to $302,471 which includes $819 cash and excludes $17,817 spent on fees and slippage. |
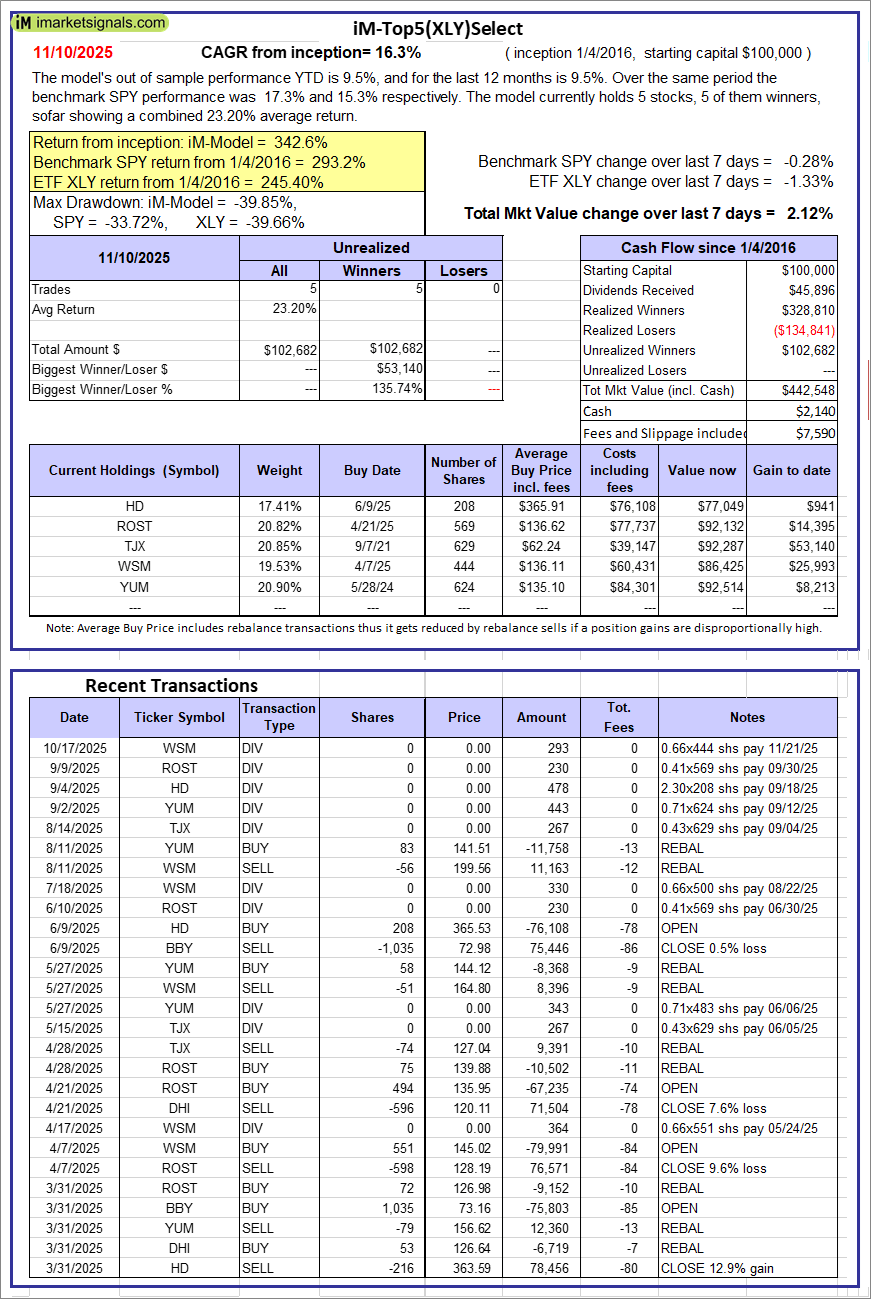 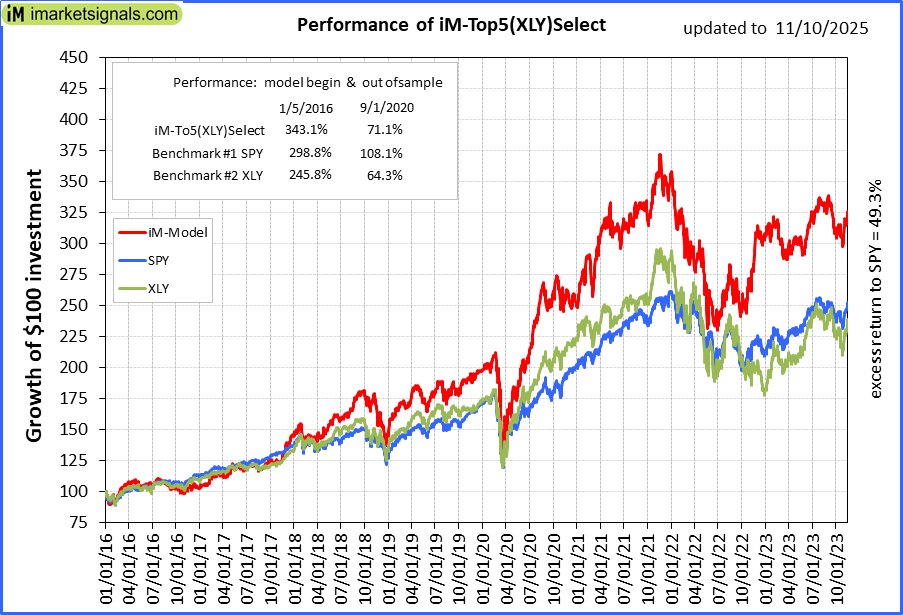 |
iM-Top5(XLY)Select: Since inception, on 1/5/2016, the model gained 342.55% while the benchmark SPY gained 293.22% over the same period. Over the previous week the market value of iM-Top5(XLY)Select gained 2.12% at a time when SPY gained -0.28%. A starting capital of $100,000 at inception on 1/5/2016 would have grown to $442,548 which includes $2,140 cash and excludes $7,590 spent on fees and slippage. |
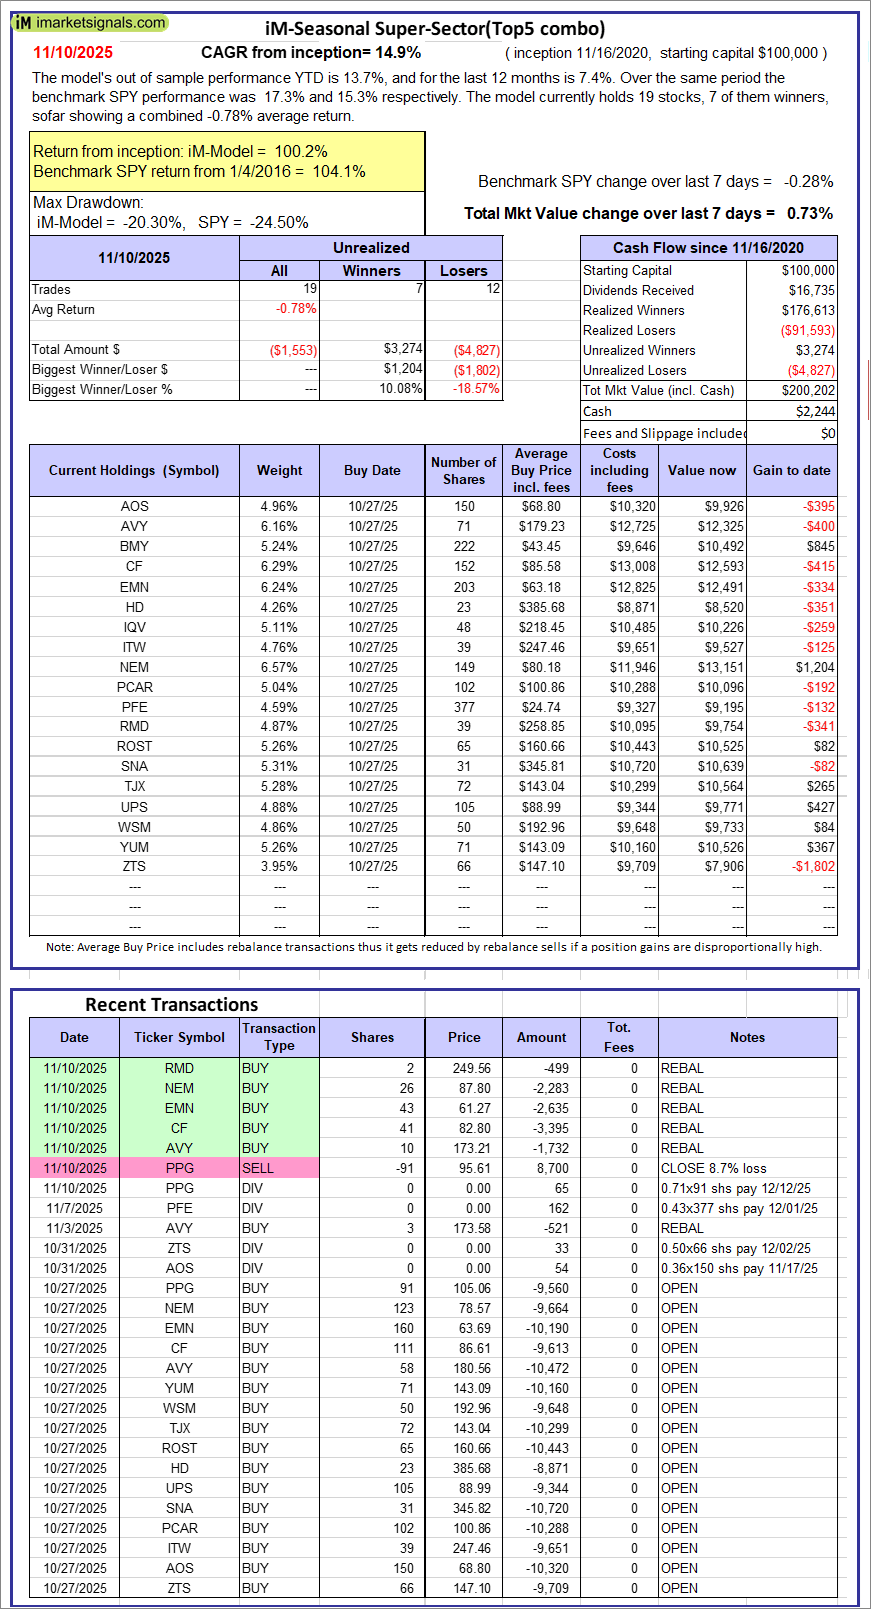 |
iM-Seasonal Super-Sectors (Top5 combo) : Since inception, on 11/17/2020, the model gained 100.20% while the benchmark SPY gained 104.12% over the same period. Over the previous week the market value of iM-Seasonal Super-Sectors (Top5 combo) gained 0.73% at a time when SPY gained -0.28%. A starting capital of $100,000 at inception on 11/17/2020 would have grown to $200,202 which includes $2,244 cash and excludes $00 spent on fees and slippage. |
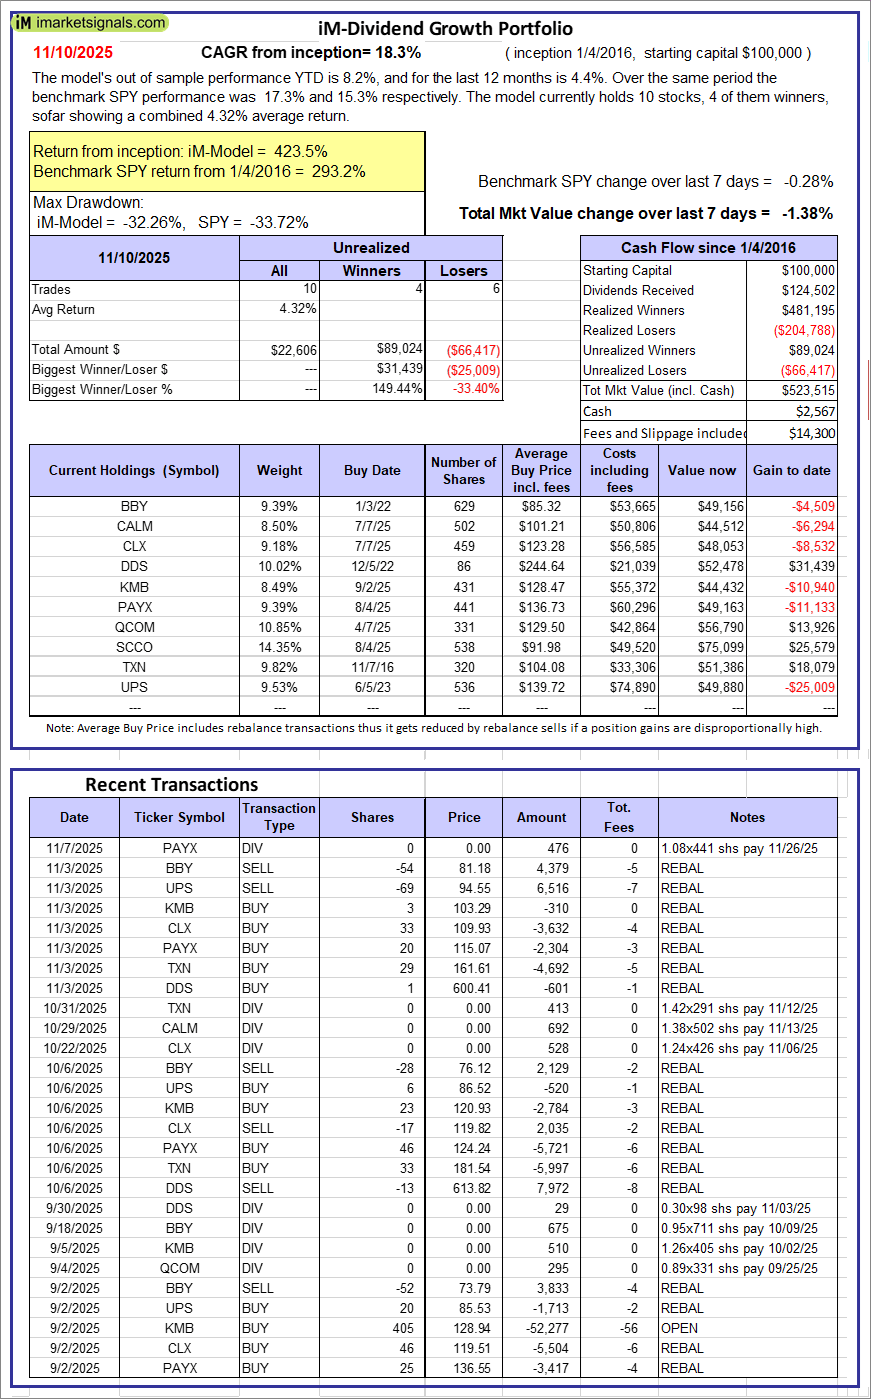 |
iM-Dividend Growth Portfolio: The model’s out of sample performance YTD is 8.2%, and for the last 12 months is 4.4%. Over the same period the benchmark SPY performance was 17.3% and 15.3% respectively. Over the previous week the market value of the iM-Dividend Growth Portfolio gained -1.38% at a time when SPY gained -0.28%. A starting capital of $100,000 at inception on 6/30/2016 would have grown to $523,515 which includes $2,567 cash and excludes $14,300 spent on fees and slippage. |
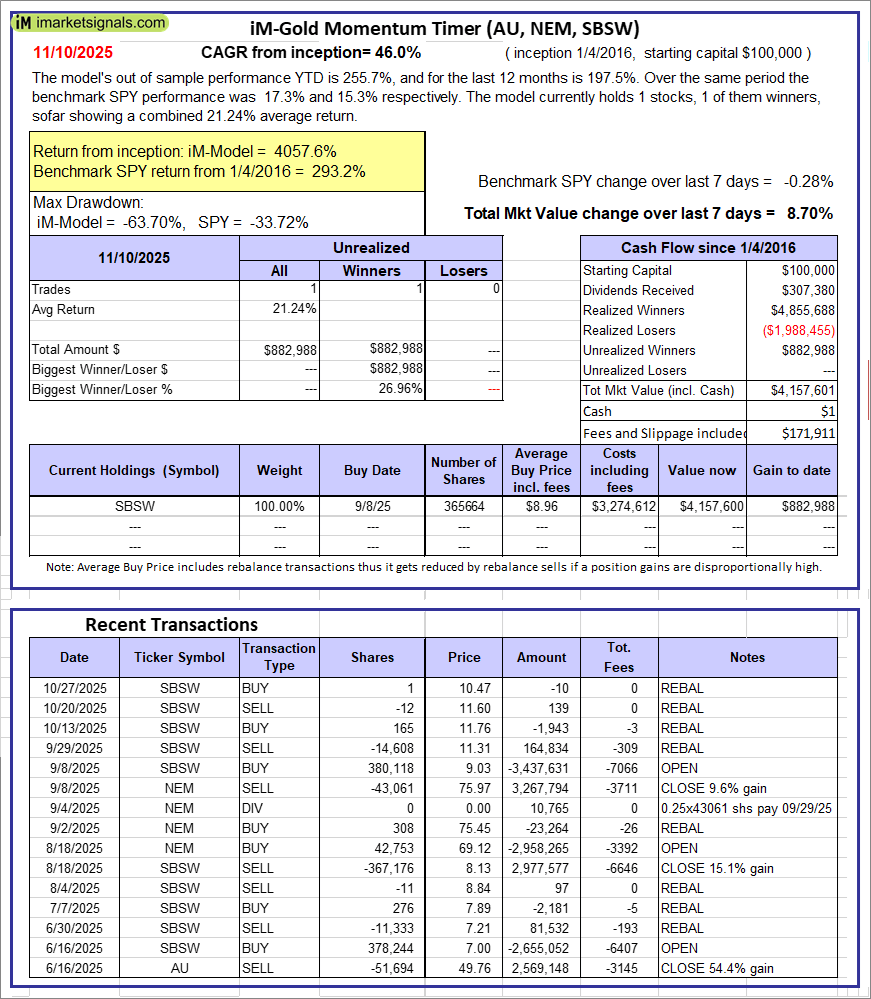 |
iM-Gold Momentum Timer (AU, NEM, SBSW): The model’s out of sample performance YTD is 255.7%, and for the last 12 months is 197.5%. Over the same period the benchmark SPY performance was 17.3% and 15.3% respectively. Over the previous week the market value of iM-Gold Momentum Timer (AU, NEM, SBSW) gained 8.70% at a time when SPY gained -0.28%. A starting capital of $100,000 at inception on 6/30/2016 would have grown to $01 which includes $171,911 cash and excludes Gain to date spent on fees and slippage. |
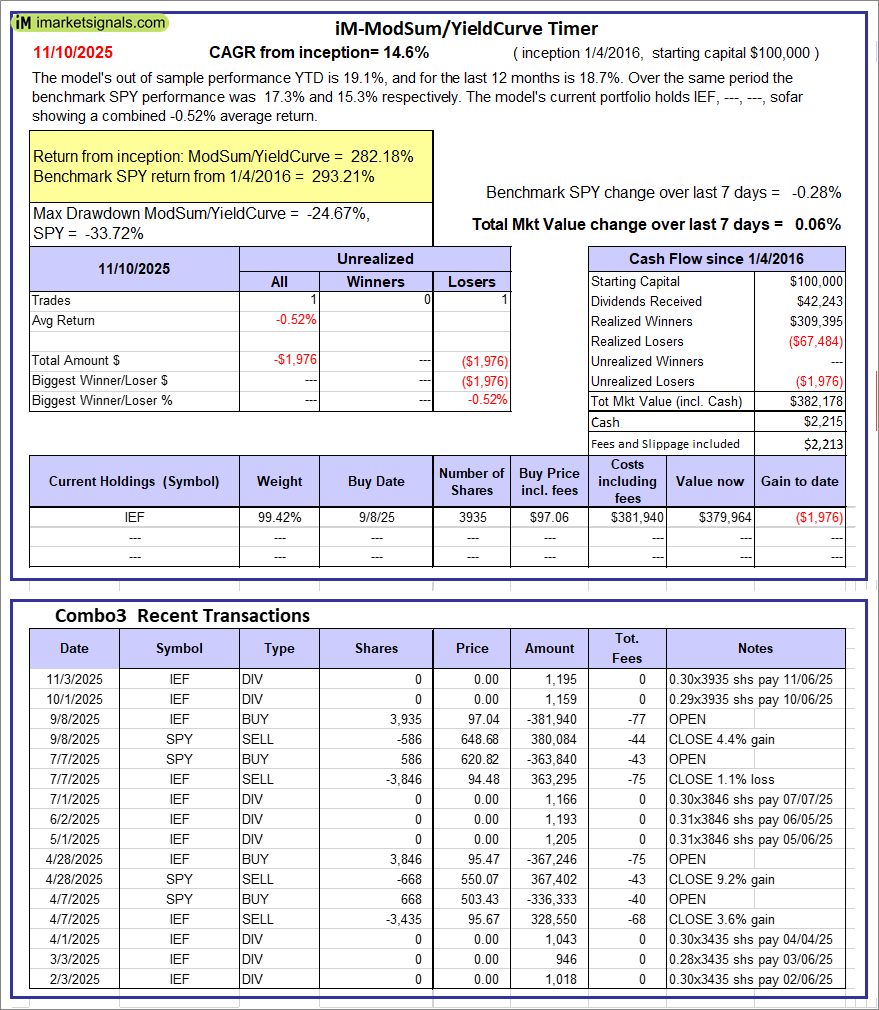 |
iM-ModSum/YieldCurve Timer: The model’s out of sample performance YTD is 19.1%, and for the last 12 months is 18.7%. Over the same period the benchmark SPY performance was 17.3% and 15.3% respectively. Over the previous week the market value of iM-PortSum/YieldCurve Timer gained 0.06% at a time when SPY gained -0.28%. A starting capital of $100,000 at inception on 1/1/2016 would have grown to $382,178 which includes $2,215 cash and excludes $2,213 spent on fees and slippage. |
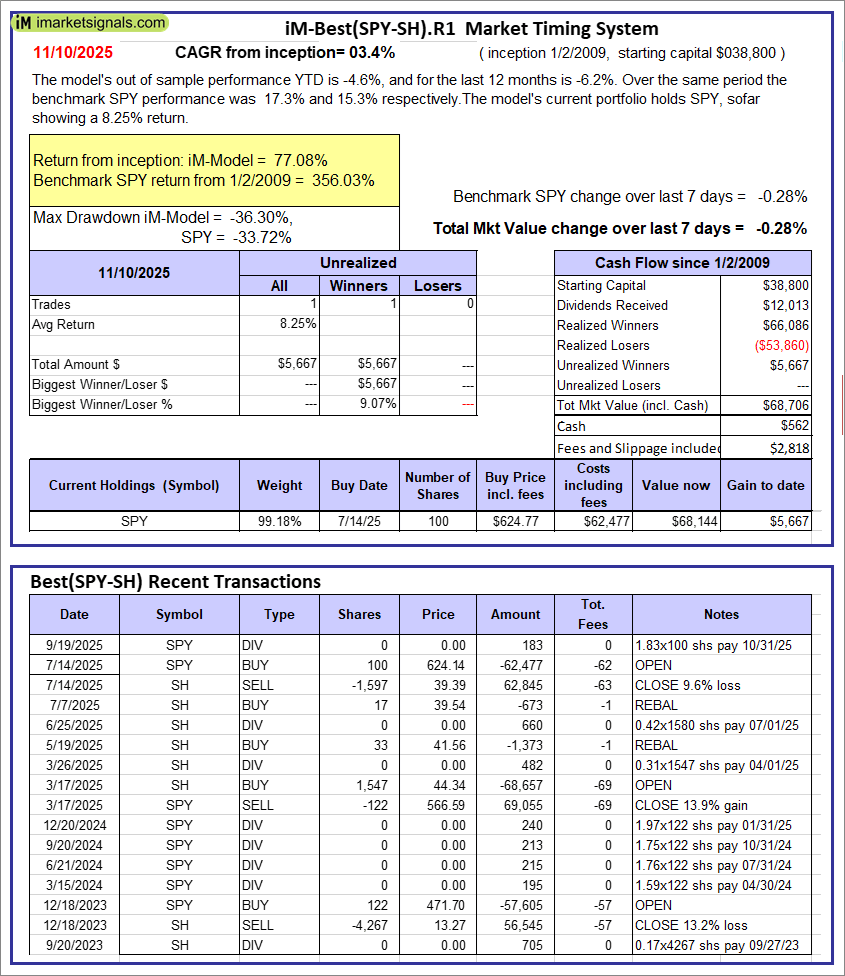 |
iM-Best(SPY-SH).R1: The model’s out of sample performance YTD is -4.6%, and for the last 12 months is -6.2%. Over the same period the benchmark SPY performance was 17.3% and 15.3% respectively. Over the previous week the market value of Best(SPY-SH) gained -0.28% at a time when SPY gained -0.28%. A starting capital of $100,000 at inception on 1/2/2009 would have grown to $68,706 which includes $562 cash and excludes $2,818 spent on fees and slippage. |
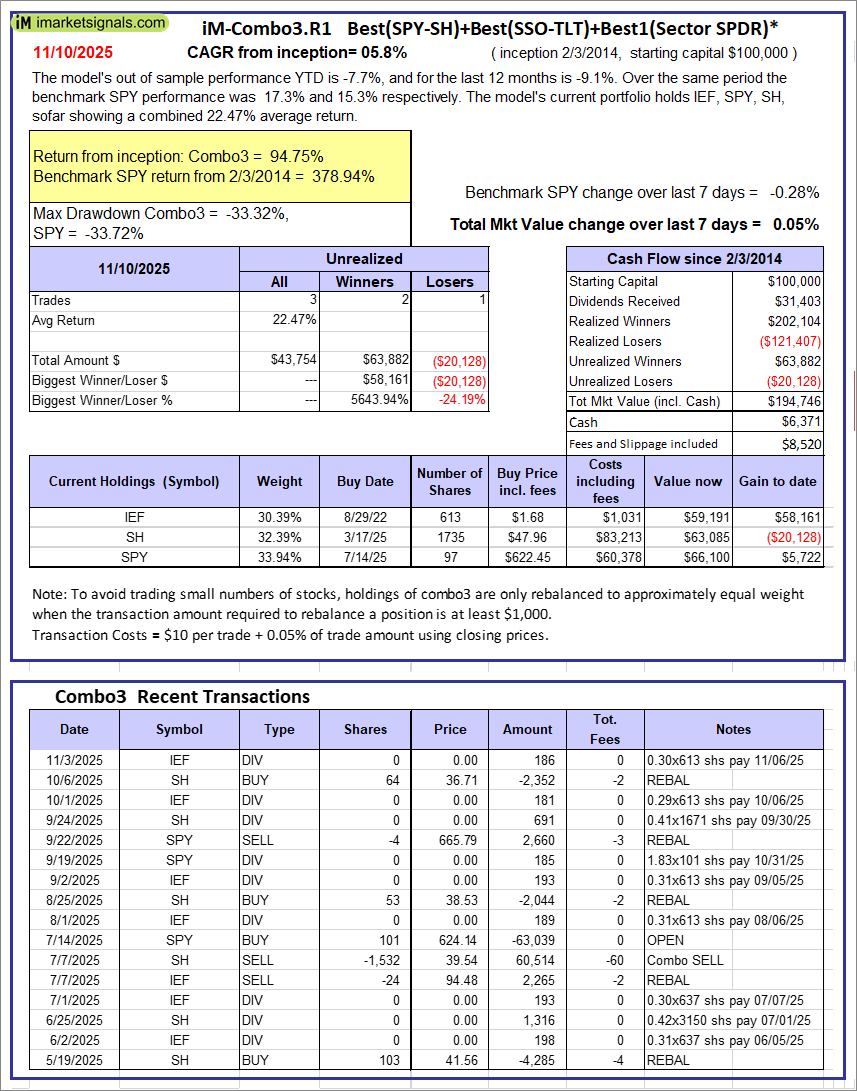 |
iM-Combo3.R1: The model’s out of sample performance YTD is -7.7%, and for the last 12 months is -9.1%. Over the same period the benchmark SPY performance was 17.3% and 15.3% respectively. Over the previous week the market value of iM-Combo3.R1 gained 0.05% at a time when SPY gained -0.28%. A starting capital of $100,000 at inception on 2/3/2014 would have grown to $194,746 which includes $6,371 cash and excludes $8,520 spent on fees and slippage. |
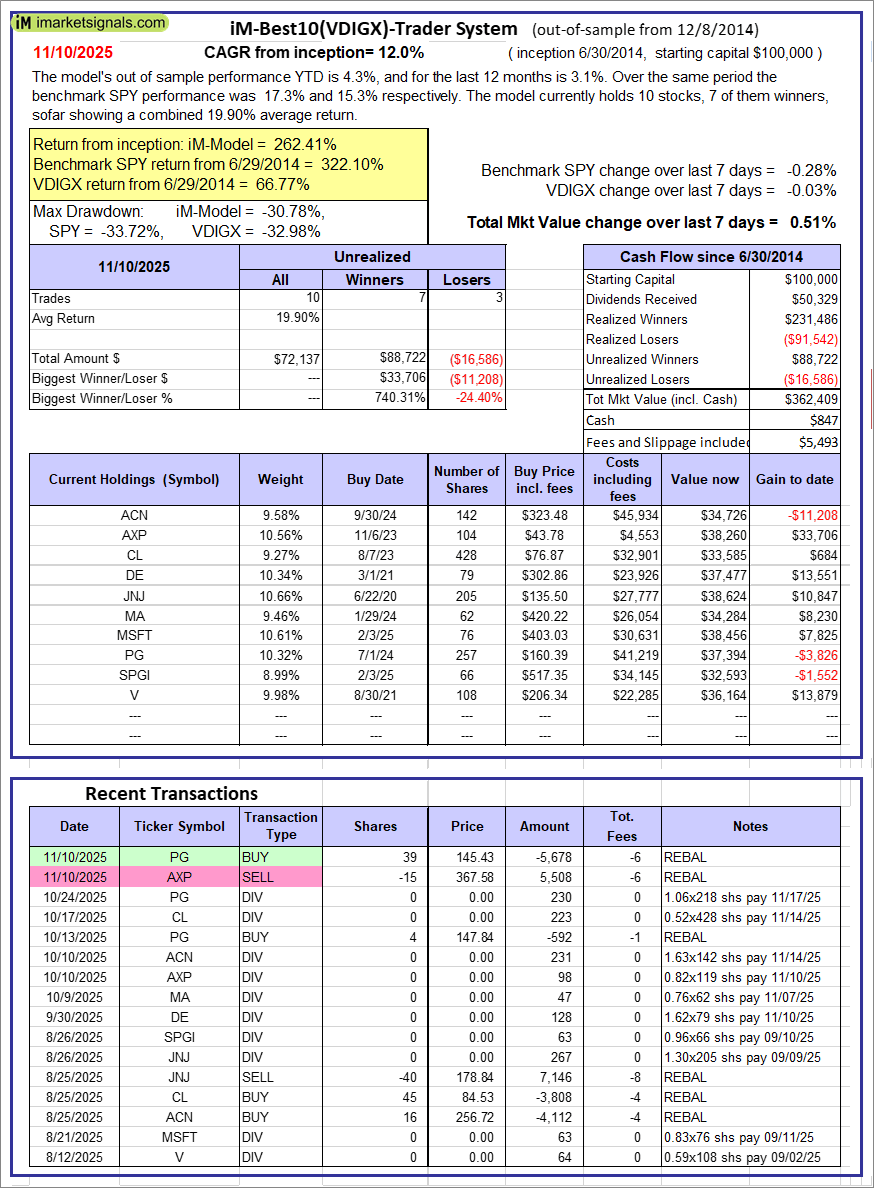 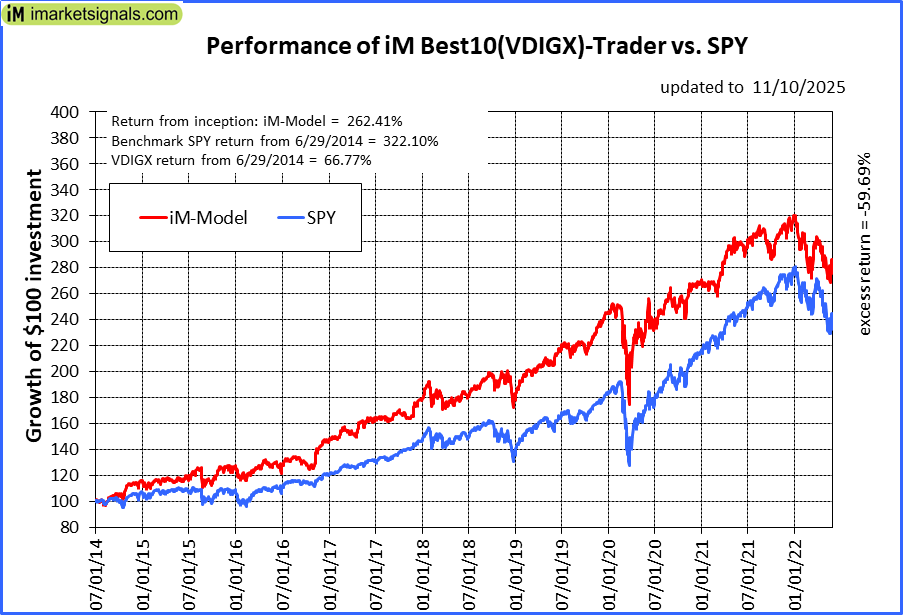 |
iM-Best10(VDIGX)-Trader: The model’s out of sample performance YTD is 4.3%, and for the last 12 months is 3.1%. Over the same period the benchmark SPY performance was 17.3% and 15.3% respectively. Since inception, on 7/1/2014, the model gained 262.41% while the benchmark SPY gained 322.10% and VDIGX gained 66.77% over the same period. Over the previous week the market value of iM-Best10(VDIGX) gained 0.51% at a time when SPY gained -0.28%. A starting capital of $100,000 at inception on 7/1/2014 would have grown to $362,409 which includes $847 cash and excludes $5,493 spent on fees and slippage. |
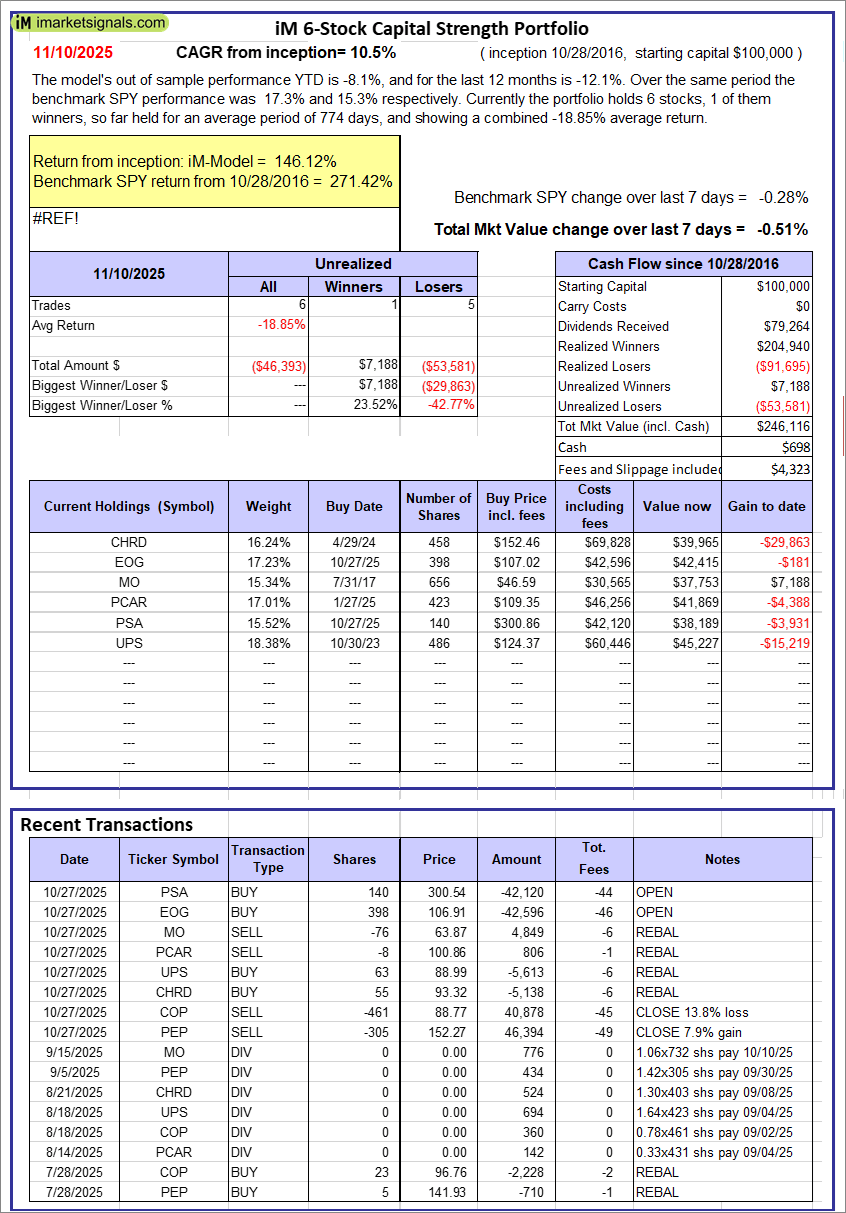 |
iM 6-Stock Capital Strength Portfolio: The model’s out of sample performance YTD is -8.1%, and for the last 12 months is -12.1%. Over the same period the benchmark SPY performance was 17.3% and 15.3% respectively. Over the previous week the market value of the iM 6-Stock Capital Strength Portfolio gained -0.51% at a time when SPY gained -0.28%. A starting capital of $100,000 at inception on 10/28/2016 would have grown to $246,116 which includes $698 cash and excludes $4,323 spent on fees and slippage. |
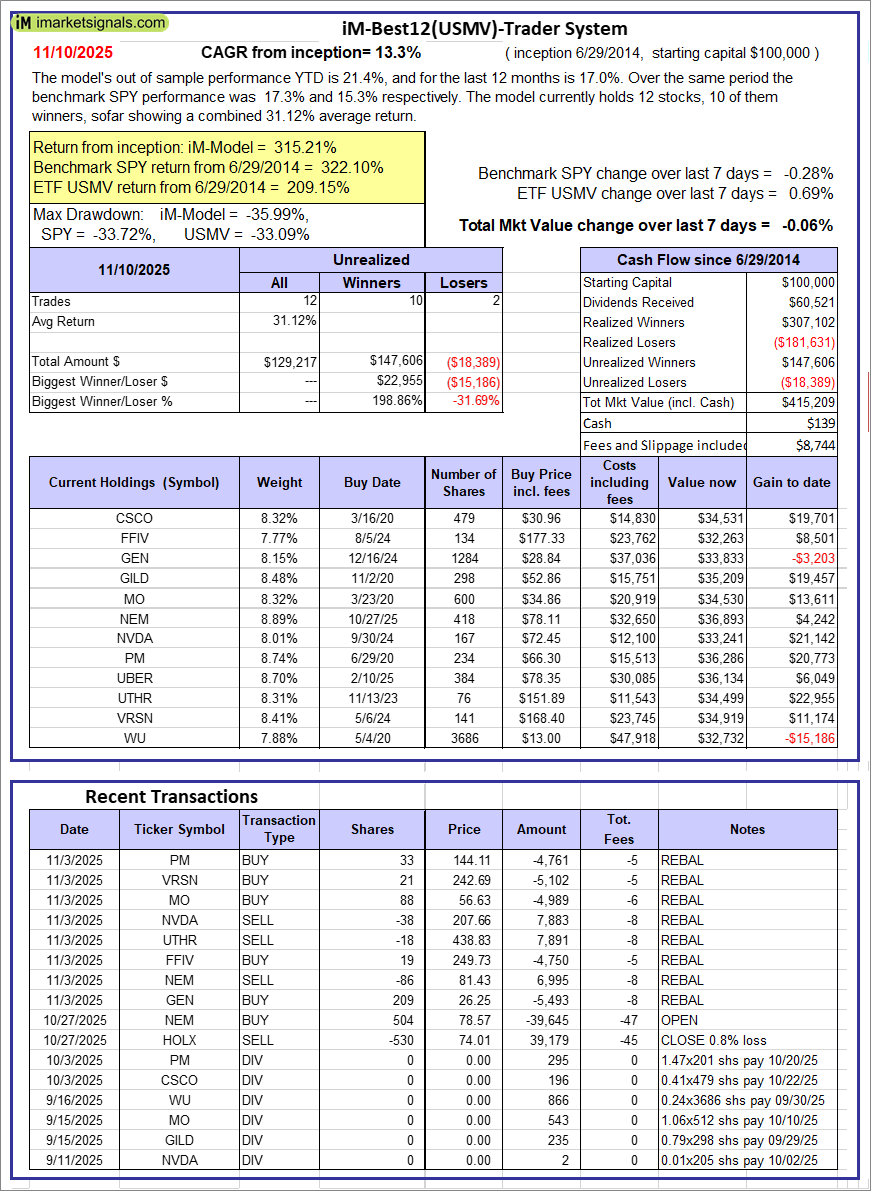 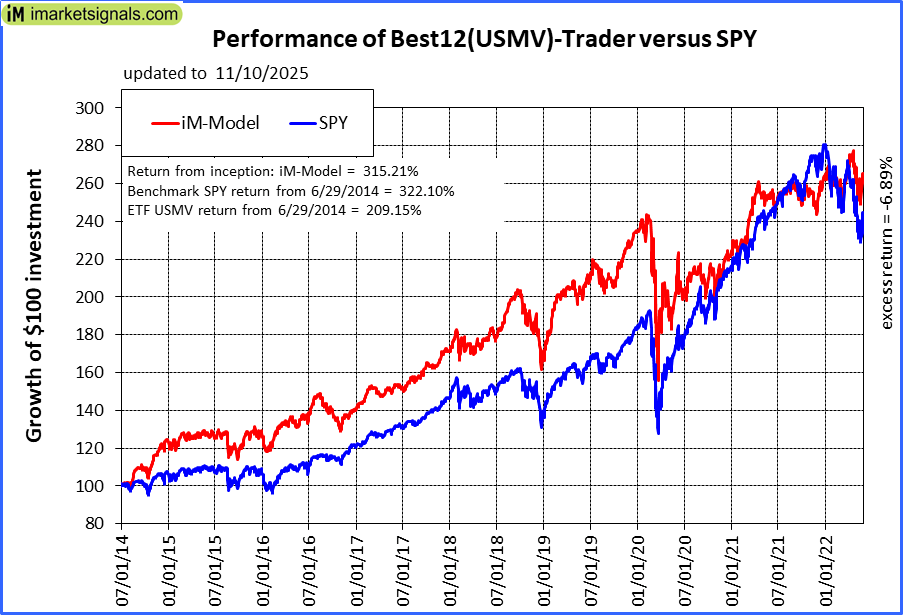 |
iM-Best12(USMV)-Trader: The model’s out of sample performance YTD is 21.4%, and for the last 12 months is 17.0%. Over the same period the benchmark SPY performance was 17.3% and 15.3% respectively. Since inception, on 6/30/2014, the model gained 315.21% while the benchmark SPY gained 322.10% and the ETF USMV gained 209.15% over the same period. Over the previous week the market value of iM-Best12(USMV)-Trader gained -0.06% at a time when SPY gained -0.28%. A starting capital of $100,000 at inception on 6/30/2014 would have grown to $415,209 which includes $139 cash and excludes $8,744 spent on fees and slippage. |
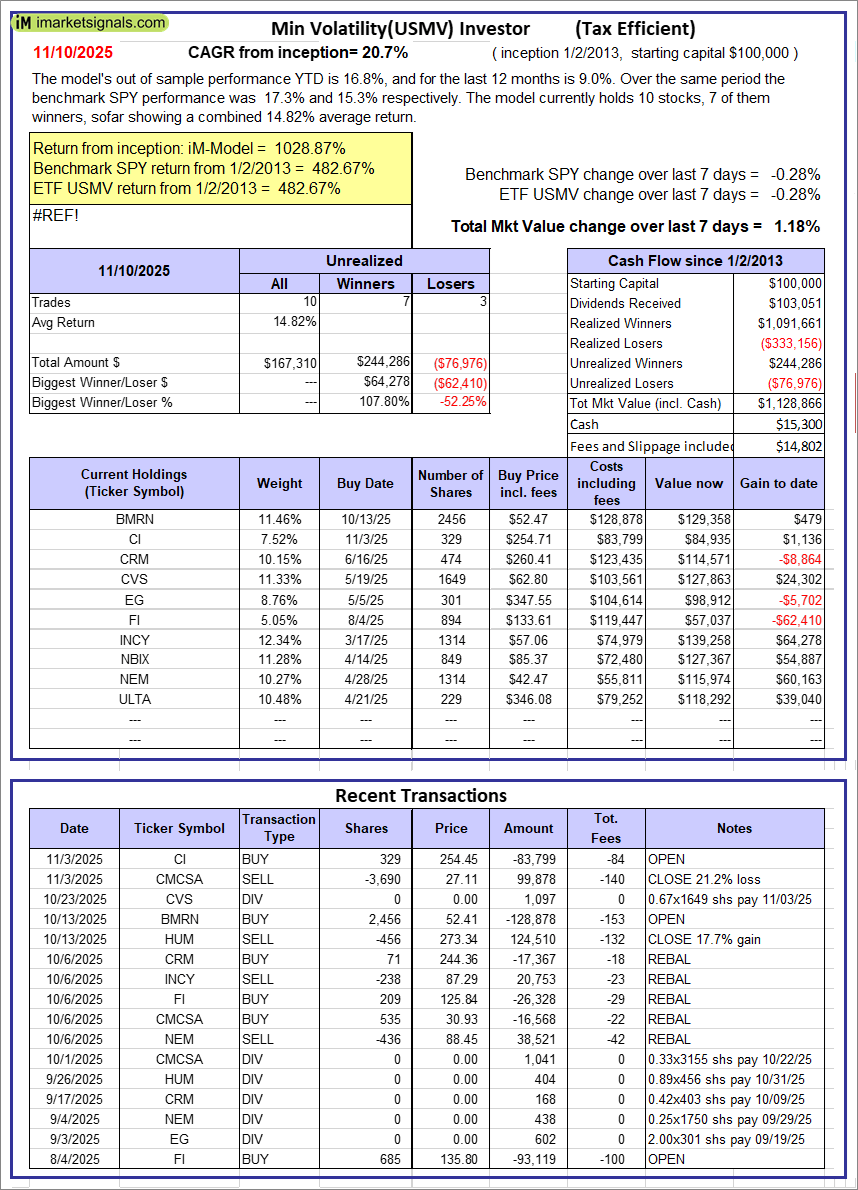 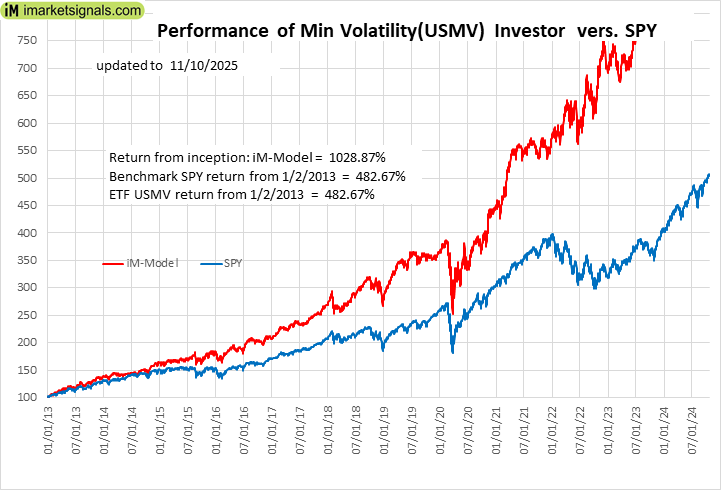 |
iM-Min Volatility(USMV) Investor (Tax Efficient): The model’s out of sample performance YTD is 16.8%, and for the last 12 months is 9.0%. Over the same period the benchmark SPY performance was 17.3% and 15.3% respectively. Since inception, on 1/3/2013, the model gained 1028.87% while the benchmark SPY gained 482.67% and the ETF USMV gained 482.67% over the same period. Over the previous week the market value of iM-Best12(USMV)Q1 gained 1.18% at a time when SPY gained -0.28%. A starting capital of $100,000 at inception on 1/3/2013 would have grown to $1,128,866 which includes $15,300 cash and excludes $14,802 spent on fees and slippage. |
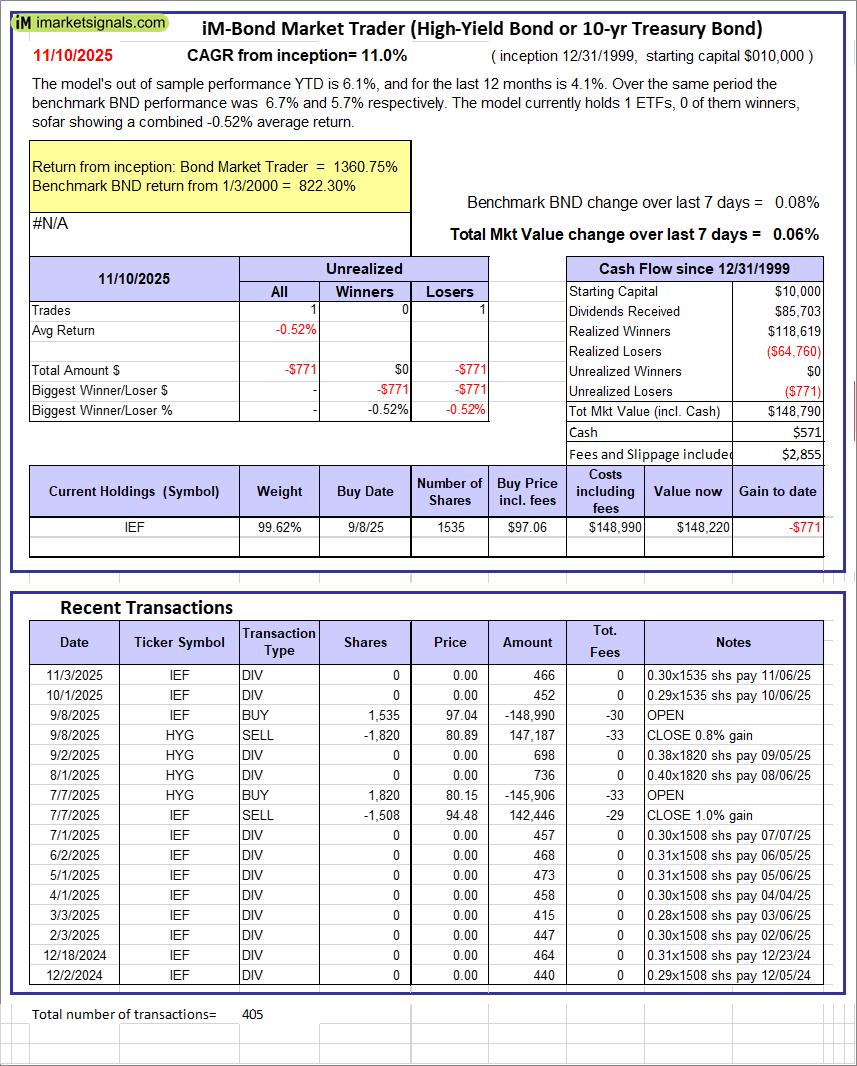 |
iM-Bond Market Trader (High-Yield Bond or 10-yr Treasury Bond): The model’s out of sample performance YTD is 6.1%, and for the last 12 months is 4.1%. Over the same period the benchmark BND performance was 6.7% and 5.7% respectively. Over the previous week the market value of the iM-Bond Market Trader (High-Yield Bond or 10-yr Treasury Bond) gained 0.06% at a time when BND gained 0.08%. A starting capital of $10,000 at inception on 1/3/2000 would have grown to $148,790 which includes $571 cash and excludes $2,855 spent on fees and slippage. |
|
|
iM-ModSum/YieldCurve Timer: The model’s out of sample performance YTD is 19.1%, and for the last 12 months is 18.7%. Over the same period the benchmark SPY performance was 17.3% and 15.3% respectively. Over the previous week the market value of iM-PortSum/YieldCurve Timer gained 0.06% at a time when SPY gained -0.28%. A starting capital of $100,000 at inception on 1/1/2016 would have grown to $382,178 which includes $2,215 cash and excludes $2,213 spent on fees and slippage. |
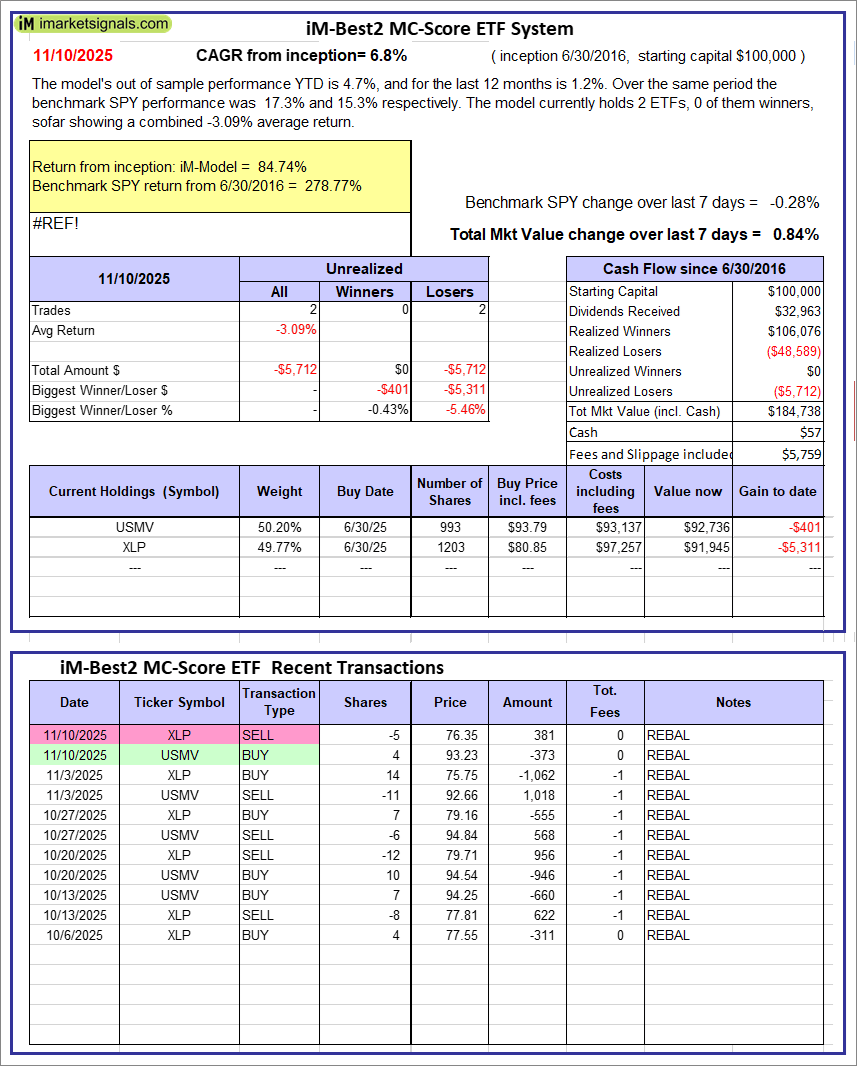 |
iM-Best2 MC-Score ETF System: The model’s out of sample performance YTD is 4.7%, and for the last 12 months is 1.2%. Over the same period the benchmark SPY performance was 17.3% and 15.3% respectively. Over the previous week the market value of the iM-Best2 MC-Score ETF System gained 0.84% at a time when SPY gained -0.28%. A starting capital of $100,000 at inception on 6/30/2016 would have grown to $184,738 which includes $57 cash and excludes $5,759 spent on fees and slippage. |
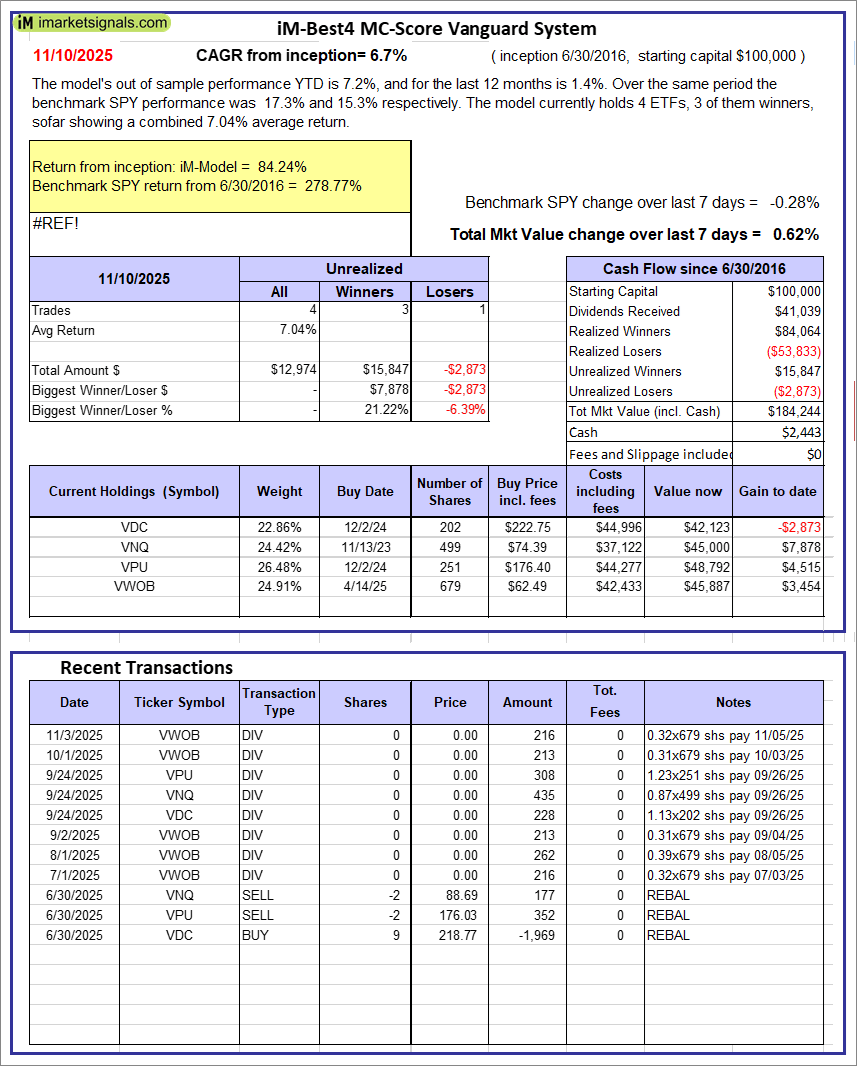 |
iM-Best4 MC-Score Vanguard System: The model’s out of sample performance YTD is 7.2%, and for the last 12 months is 1.4%. Over the same period the benchmark SPY performance was 17.3% and 15.3% respectively. Over the previous week the market value of the iM-Best4 MC-Score Vanguard System gained 0.62% at a time when SPY gained -0.28%. A starting capital of $100,000 at inception on 6/30/2016 would have grown to $184,244 which includes $2,443 cash and excludes $00 spent on fees and slippage. |
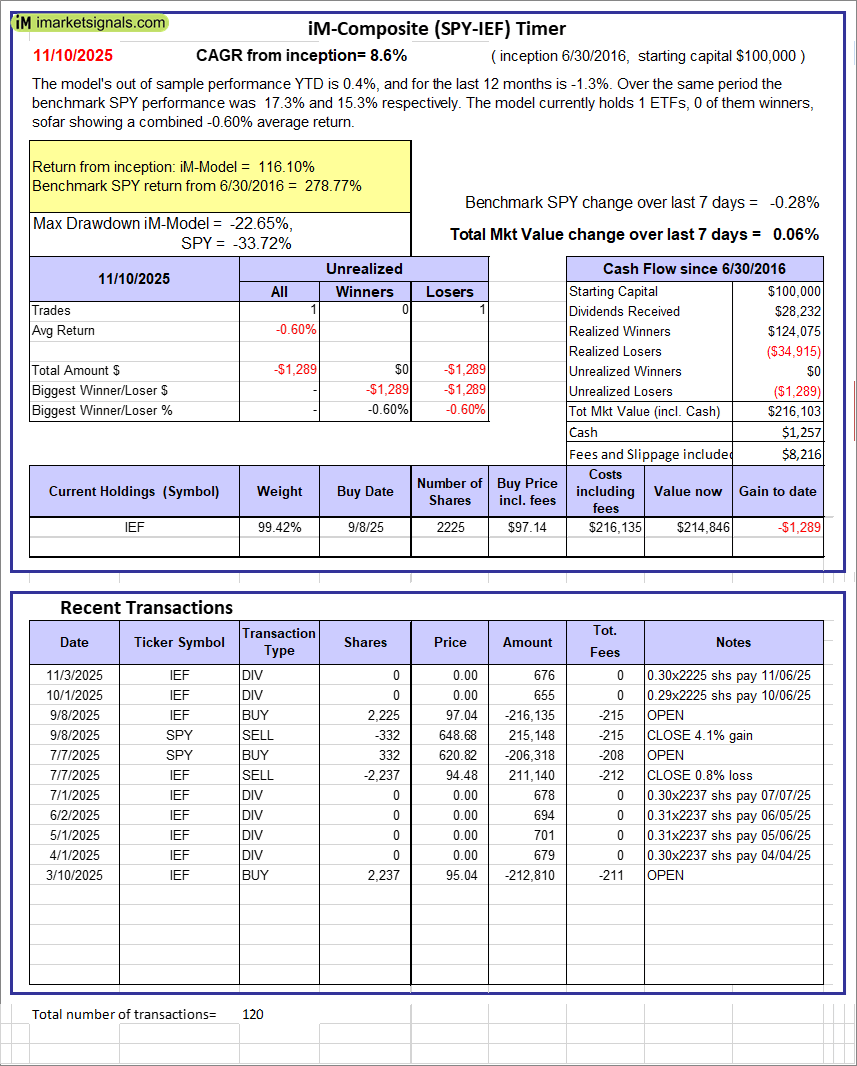 |
iM-Composite (SPY-IEF) Timer: The model’s out of sample performance YTD is 0.4%, and for the last 12 months is -1.3%. Over the same period the benchmark SPY performance was 17.3% and 15.3% respectively. Over the previous week the market value of the iM-Composite (SPY-IEF) Timer gained 0.06% at a time when SPY gained -0.28%. A starting capital of $100,000 at inception on 6/30/2016 would have grown to $216,103 which includes $1,257 cash and excludes $8,216 spent on fees and slippage. |
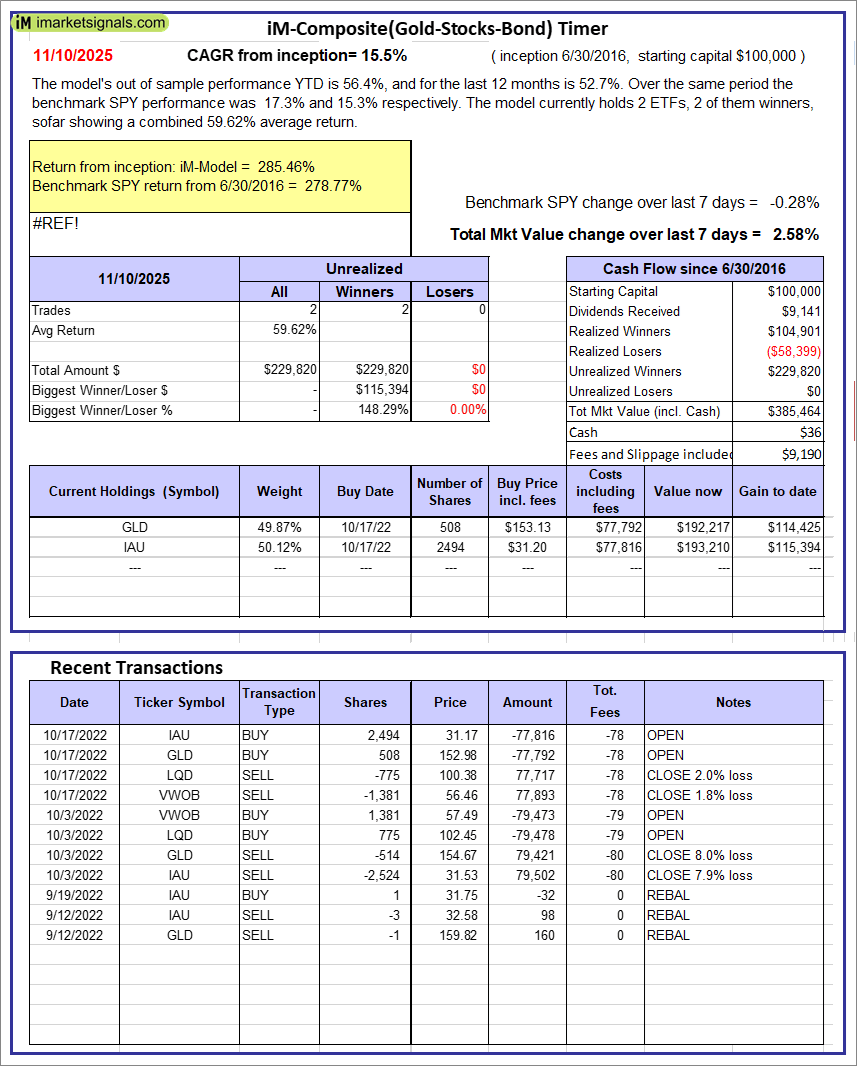 |
iM-Composite(Gold-Stocks-Bond) Timer: The model’s out of sample performance YTD is 56.4%, and for the last 12 months is 52.7%. Over the same period the benchmark SPY performance was 17.3% and 15.3% respectively. Over the previous week the market value of the iM-Composite(Gold-Stocks-Bond) Timer gained 2.58% at a time when SPY gained -0.28%. A starting capital of $100,000 at inception on 6/30/2016 would have grown to $385,464 which includes $36 cash and excludes $9,190 spent on fees and slippage. |
iM-Best Reports – 11/10/2025
Posted in pmp SPY-SH
Leave a Reply
You must be logged in to post a comment.