
  |
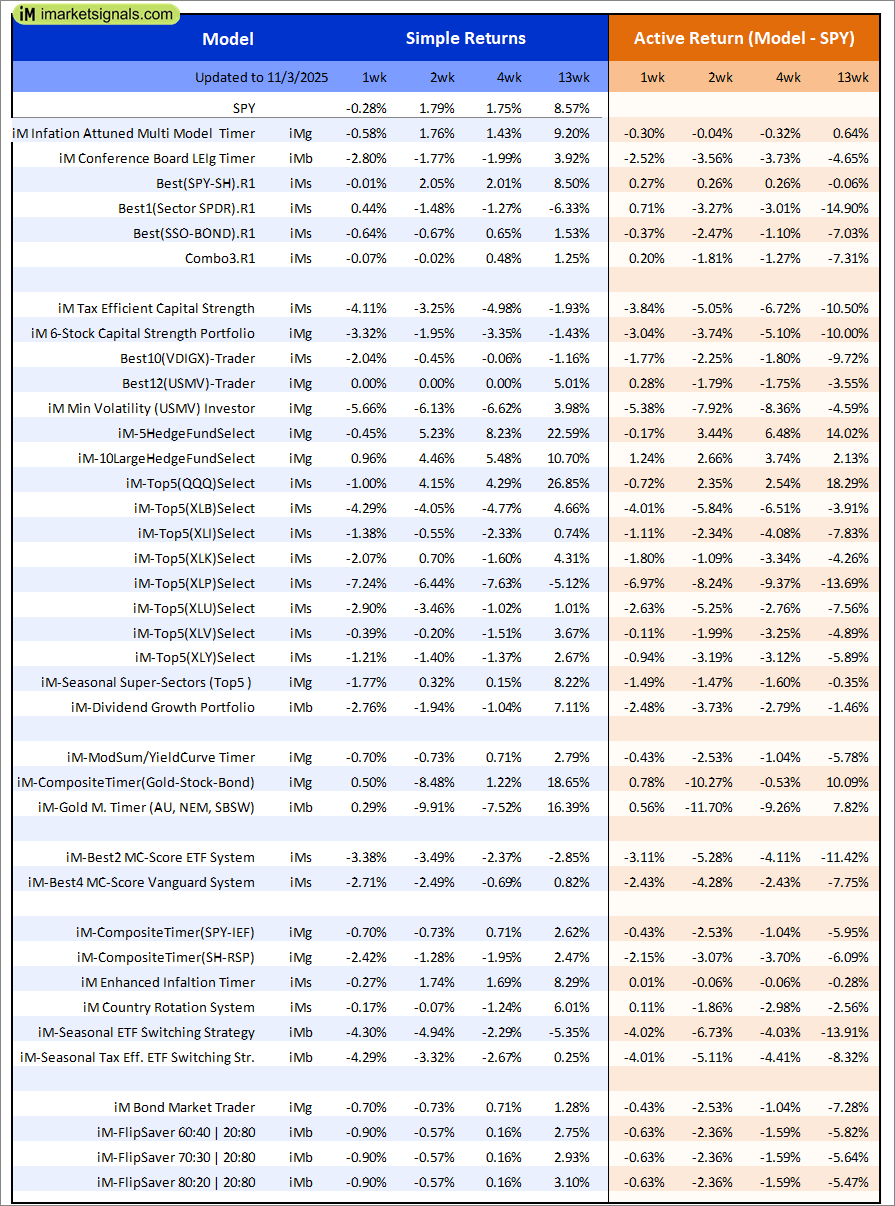
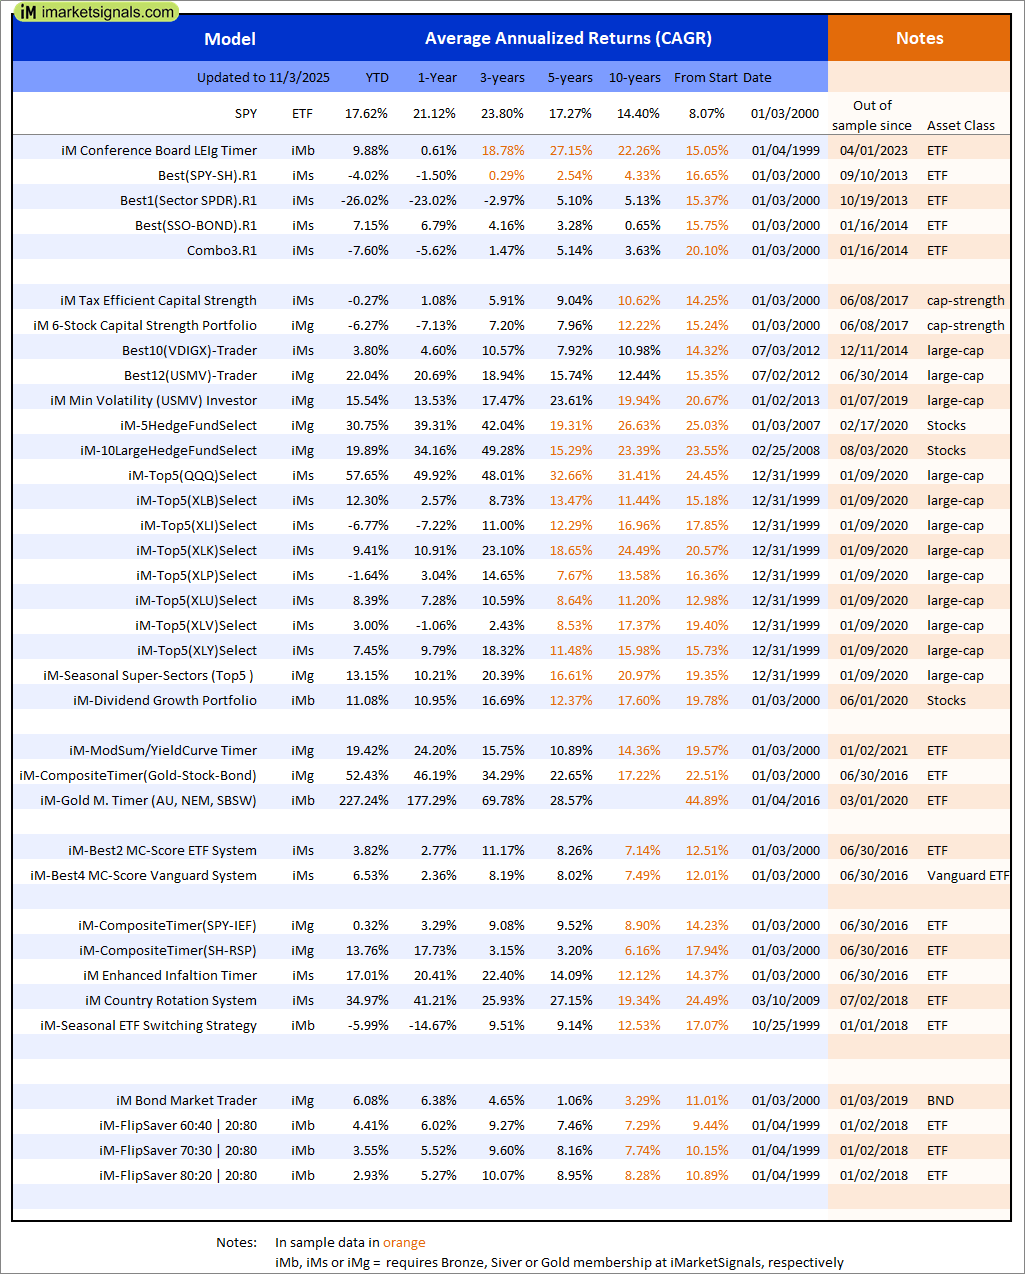
Out of sample performance summary of our models for the past 1, 2, 4 and 13 week periods. The active active return indicates how the models over- or underperformed the benchmark ETF SPY. Also the YTD, and the 1-, 3-, 5- and 10-year annualized returns are shown in the second table |
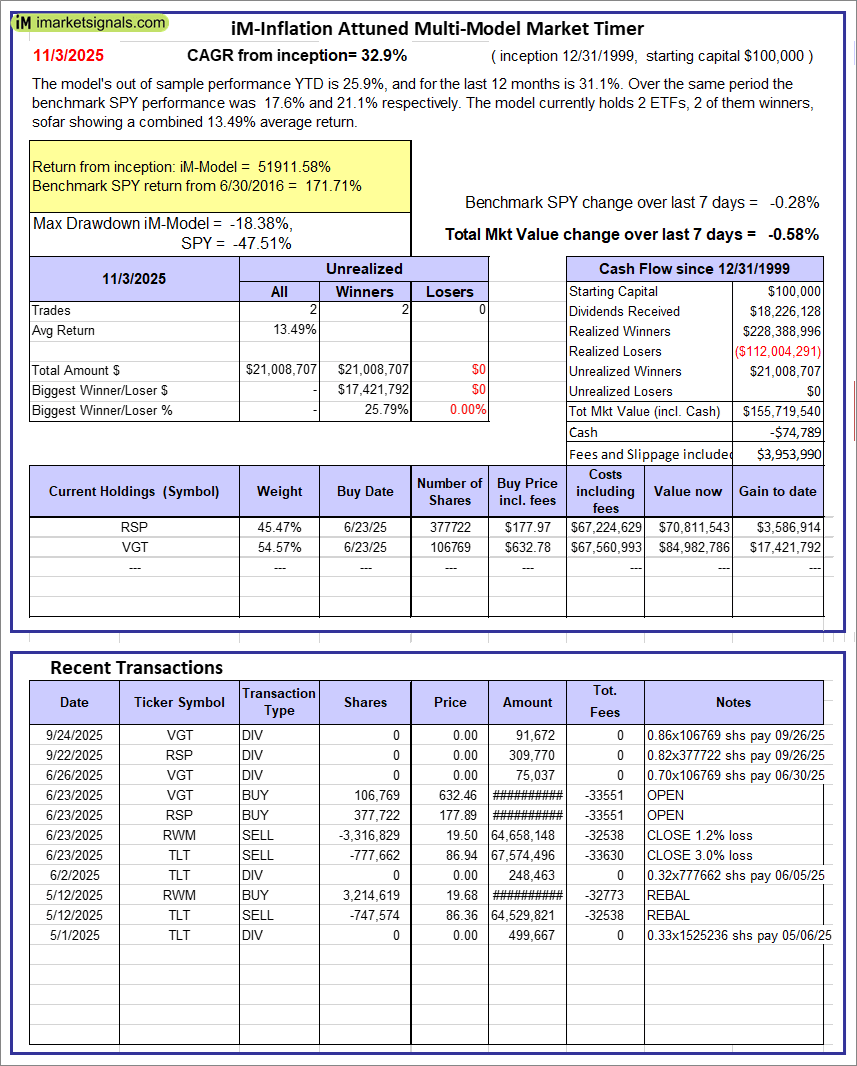 |
iM-Inflation Attuned Multi-Model Market Timer: The model’s out of sample performance YTD is 25.9%, and for the last 12 months is 31.1%. Over the same period the benchmark SPY performance was 17.6% and 21.1% respectively. Over the previous week the market value of the iM-Inflation Attuned Multi-Model Market Timer gained -0.58% at a time when SPY gained -0.28%. A starting capital of $100,000 at inception on 3/24/2017 would have grown to $155,719,540 which includes -$74,789 cash and excludes $3,953,990 spent on fees and slippage. |
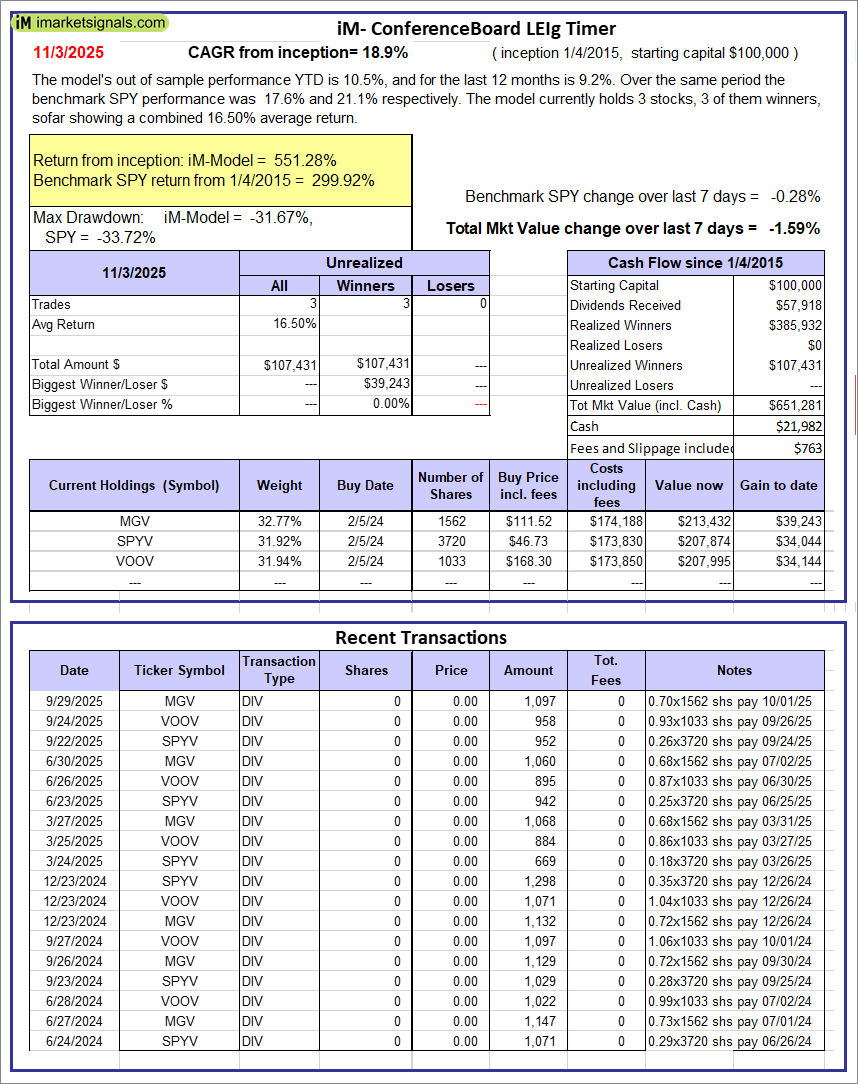 |
iM-Conference Board LEIg Timer: The model’s performance YTD is 14.3%, and for the last 12 months is 7.3%. Over the same period the benchmark SPY performance was 20.1% and 9.4% respectively. Over the previous week the market value of the iM-Conference Board LEIg Timer gained -1.59% at a time when SPY gained -0.28%. A starting capital of $100,000 at inception on 4/5/2017 would have grown to $651,281 which includes $21,982 cash and excludes $763 spent on fees and slippage. |
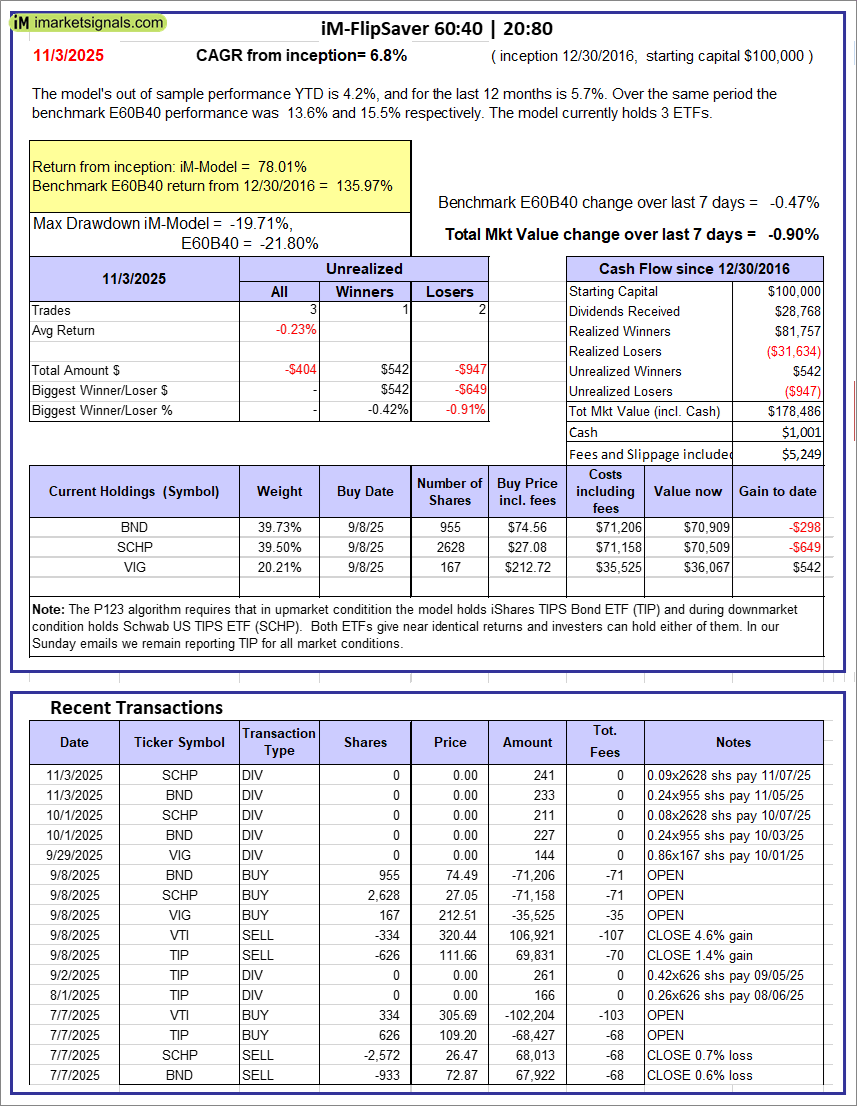 |
iM-FlipSaver 60:40 | 20:80 – 2017: The model’s out of sample performance YTD is 4.2%, and for the last 12 months is 5.7%. Over the same period the benchmark E60B40 performance was 13.6% and 15.5% respectively. Over the previous week the market value of iM-FlipSaver 80:20 | 20:80 gained -0.90% at a time when SPY gained -0.47%. A starting capital of $100,000 at inception on 7/16/2015 would have grown to $178,486 which includes $1,001 cash and excludes $5,249 spent on fees and slippage. |
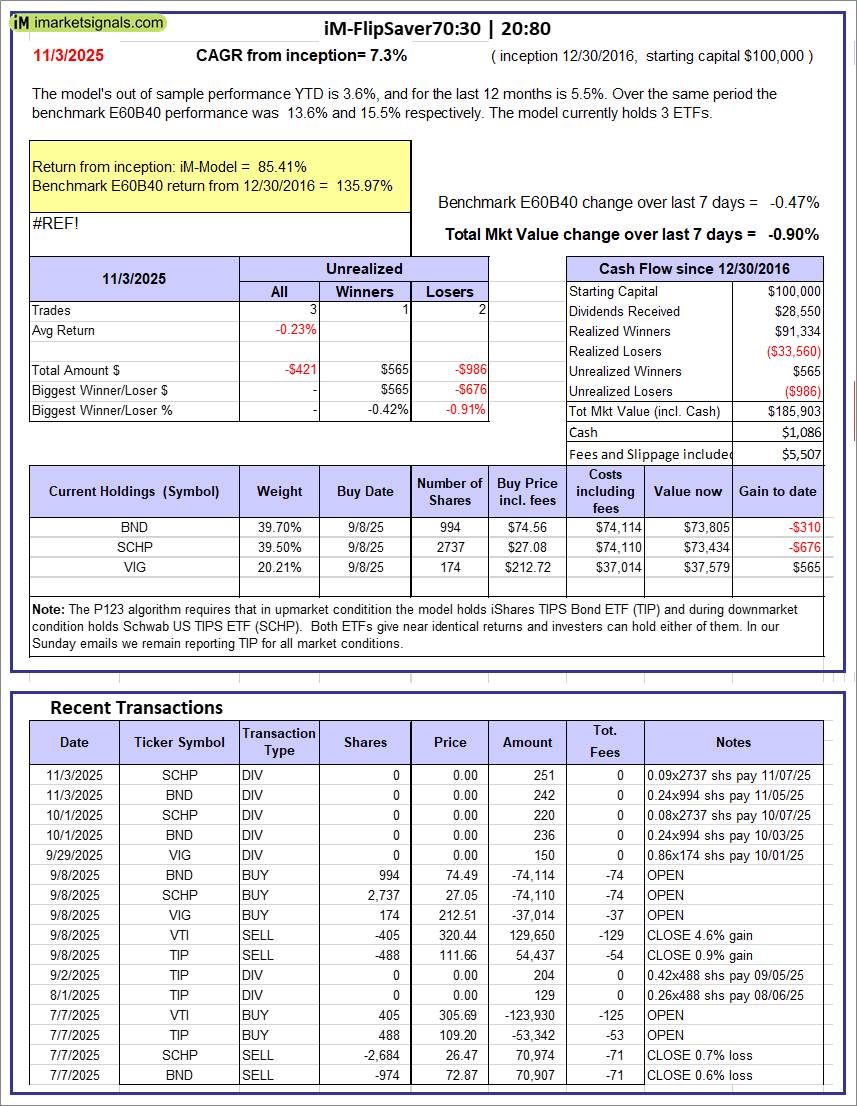 |
iM-FlipSaver 70:30 | 20:80 – 2017: The model’s out of sample performance YTD is 3.6%, and for the last 12 months is 5.5%. Over the same period the benchmark E60B40 performance was 13.6% and 15.5% respectively. Over the previous week the market value of iM-FlipSaver 70:30 | 20:80 gained -0.90% at a time when SPY gained -0.47%. A starting capital of $100,000 at inception on 7/15/2015 would have grown to $185,903 which includes $1,086 cash and excludes $5,507 spent on fees and slippage. |
 |
iM-FlipSaver 80:20 | 20:80 – 2017: The model’s out of sample performance YTD is 2.9%, and for the last 12 months is 5.3%. Over the same period the benchmark E60B40 performance was 13.6% and 15.5% respectively. Over the previous week the market value of iM-FlipSaver 80:20 | 20:80 gained -0.90% at a time when SPY gained -0.47%. A starting capital of $100,000 at inception on 1/2/2017 would have grown to $193,233 which includes $1,138 cash and excludes $5,756 spent on fees and slippage. |
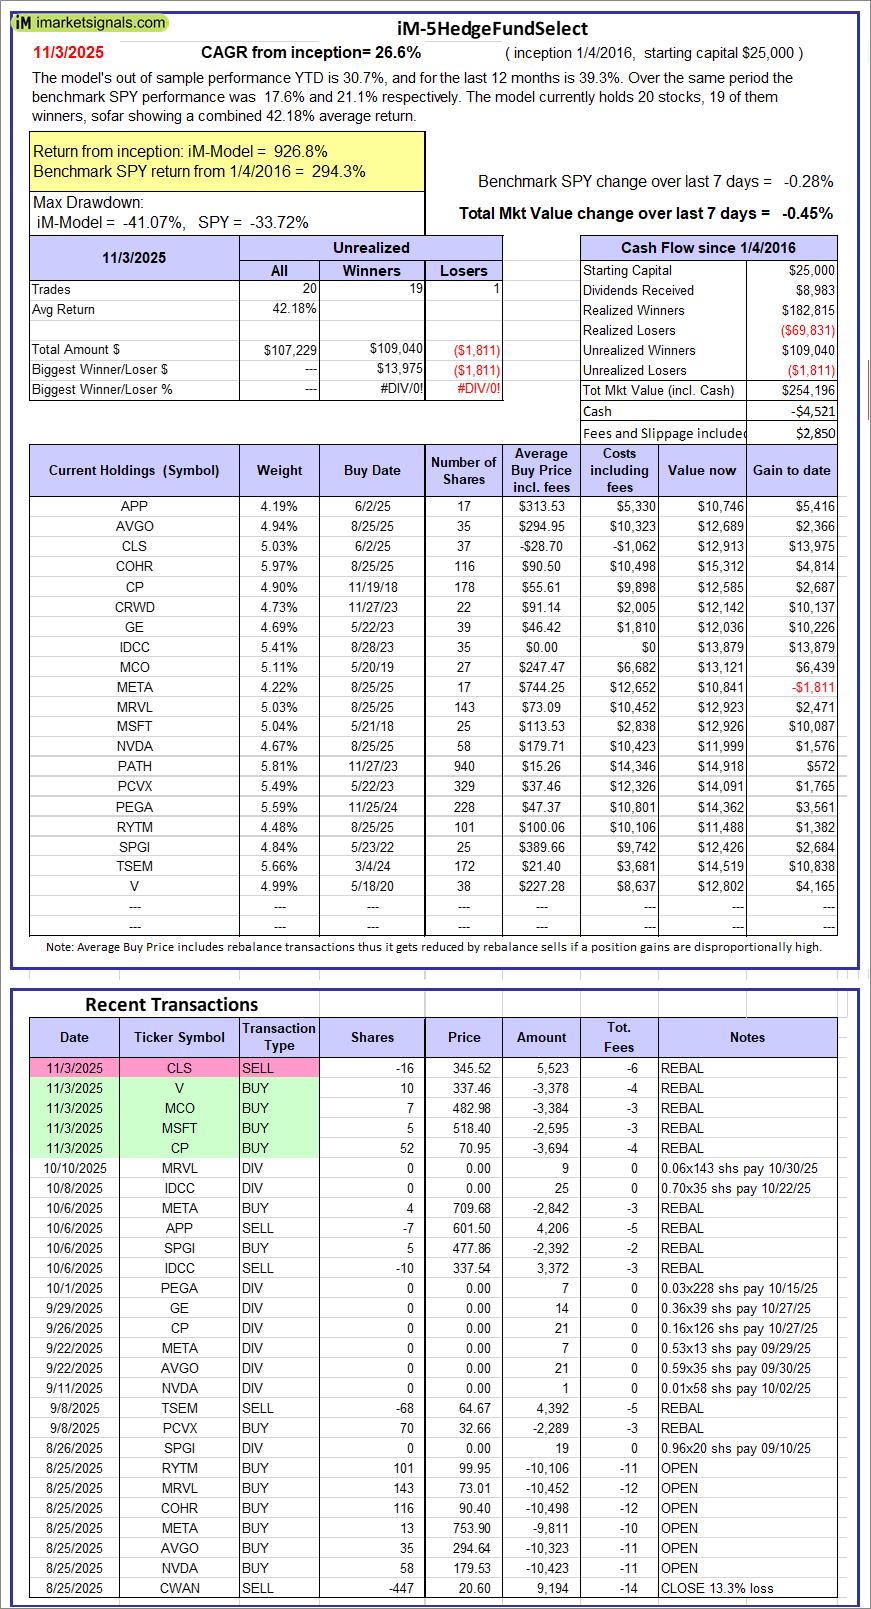 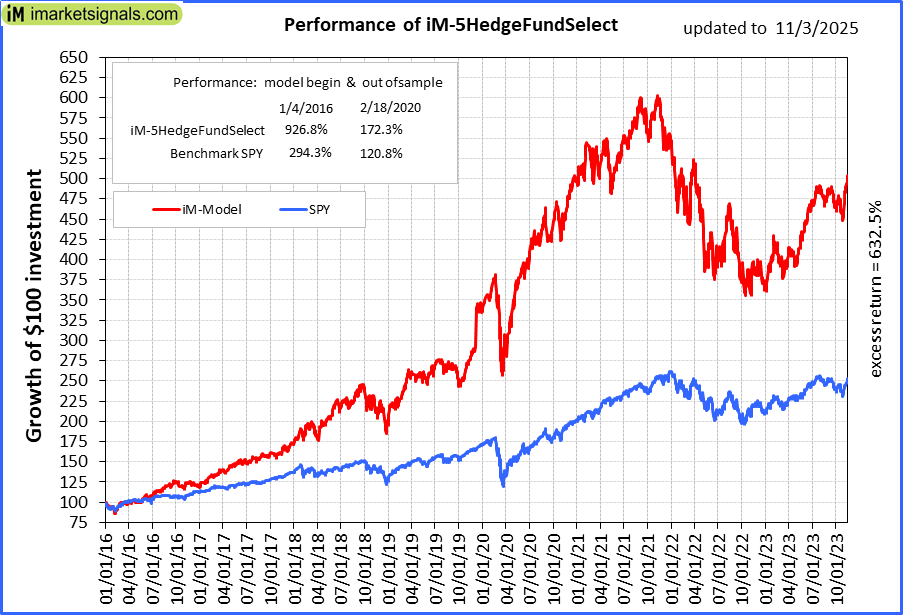 |
iM-5HedgeFundSelect: Since inception, on 1/5/2016, the model gained 926.77% while the benchmark SPY gained 294.32% over the same period. Over the previous week the market value of iM-5HedgeFundSelect gained -0.45% at a time when SPY gained -0.28%. A starting capital of $25,000 at inception on 1/5/2016 would have grown to $254,196 which includes -$4,521 cash and excludes $2,850 spent on fees and slippage. |
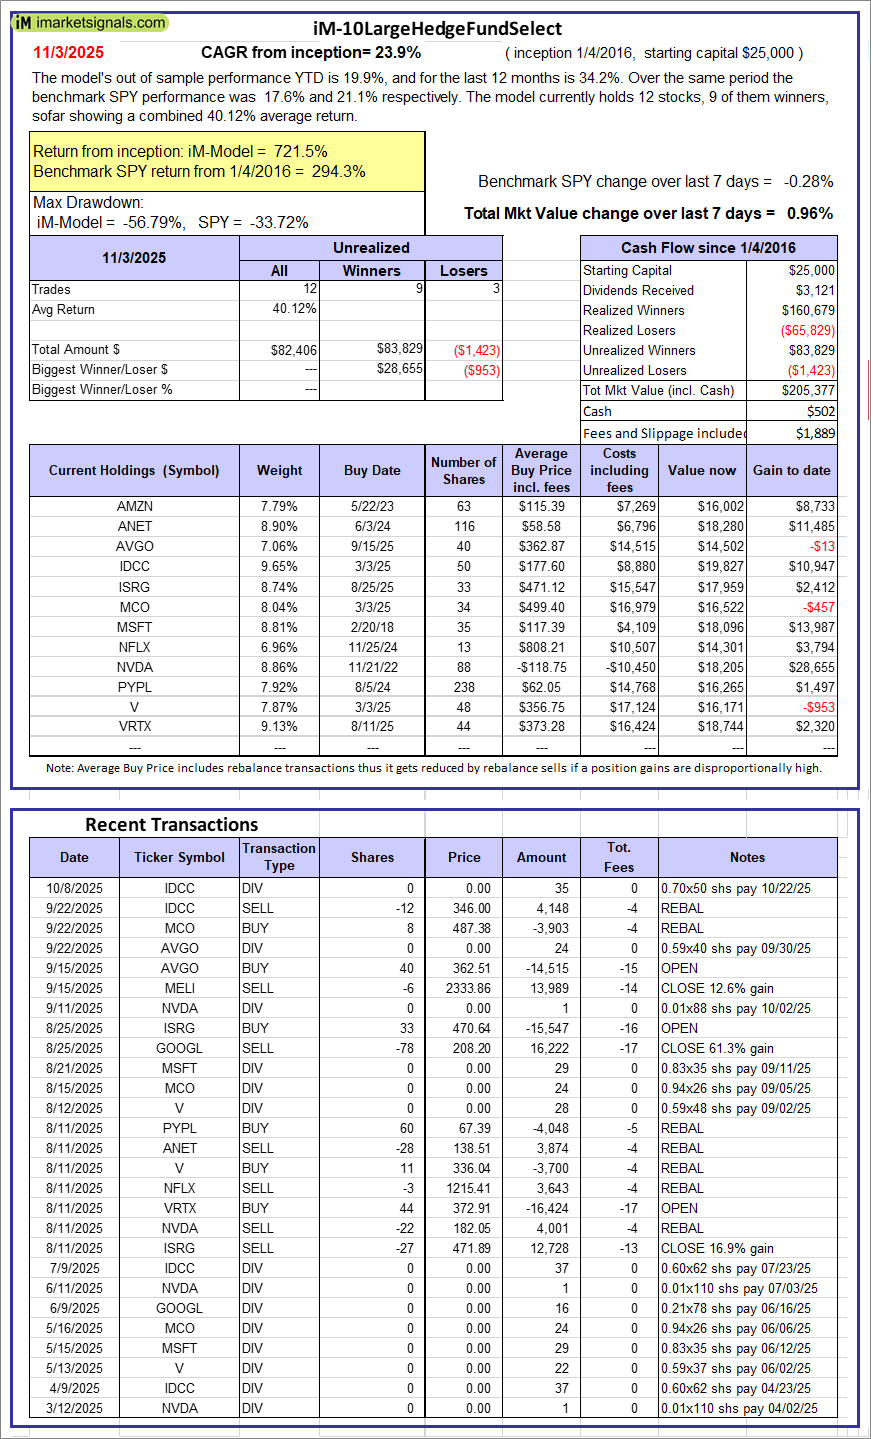 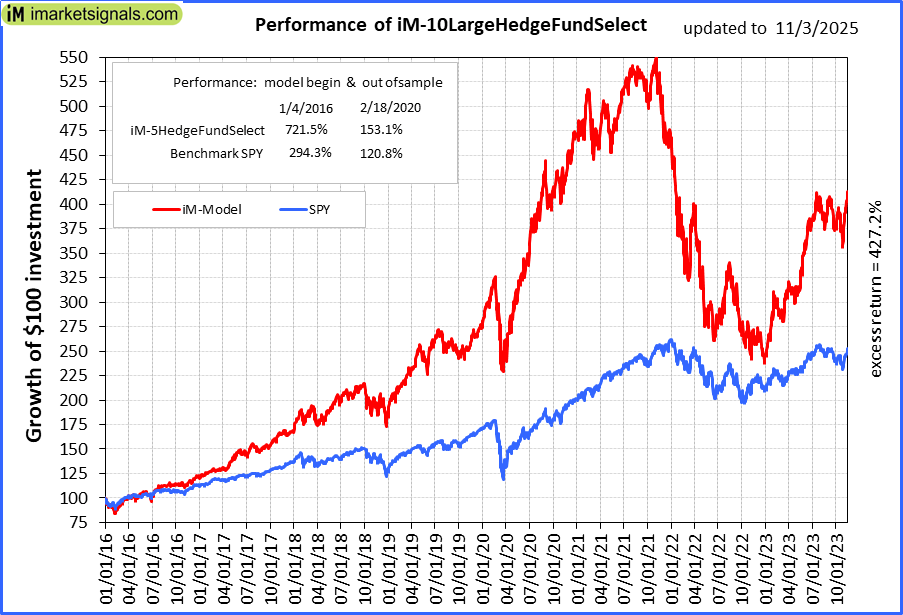 |
iM-10LargeHedgeFundSelect: Since inception, on 1/5/2016, the model gained 721.51% while the benchmark SPY gained 294.32% over the same period. Over the previous week the market value of iM-10LargeHedgeFundSelect gained 0.96% at a time when SPY gained -0.28%. A starting capital of $25,000 at inception on 1/5/2016 would have grown to $205,377 which includes $502 cash and excludes $1,889 spent on fees and slippage. |
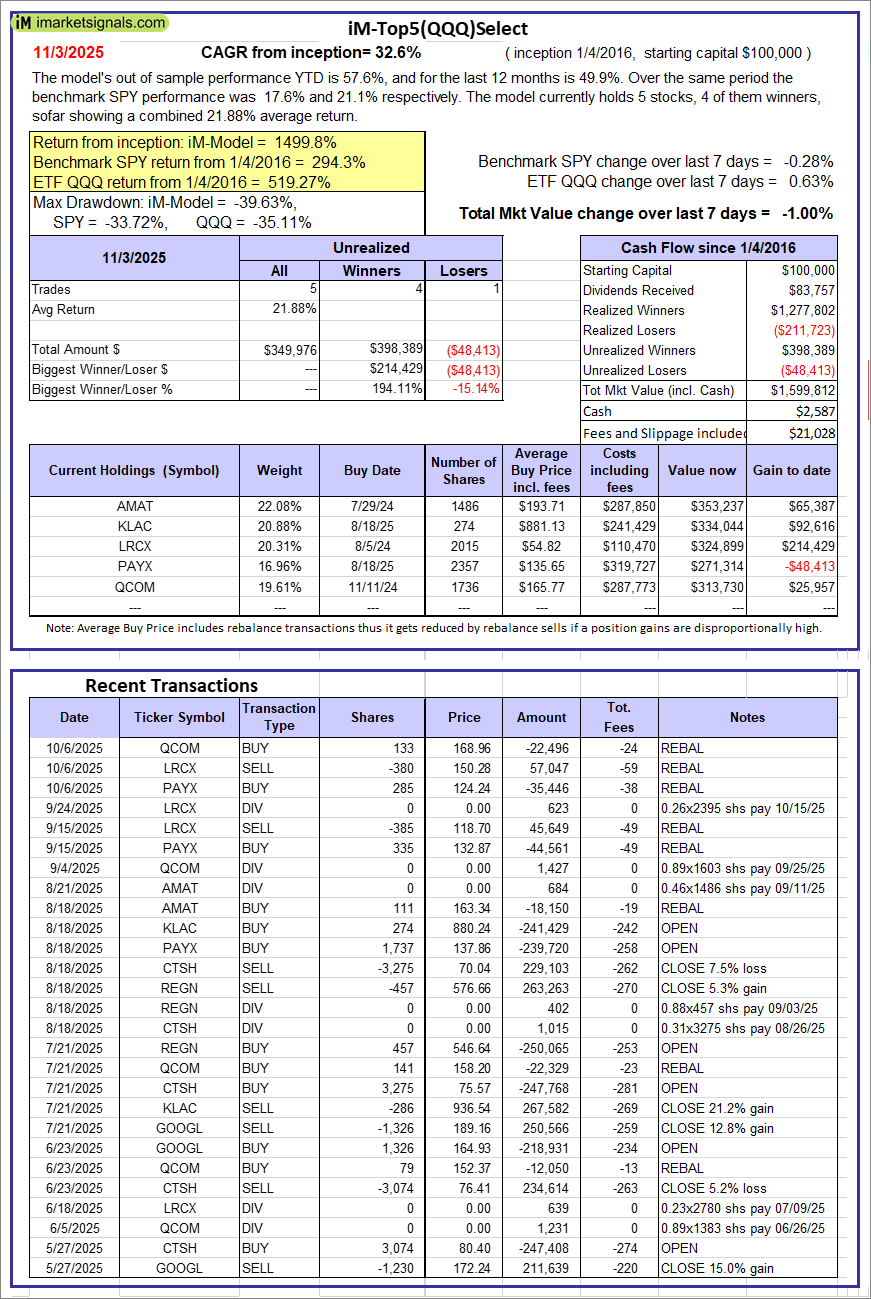 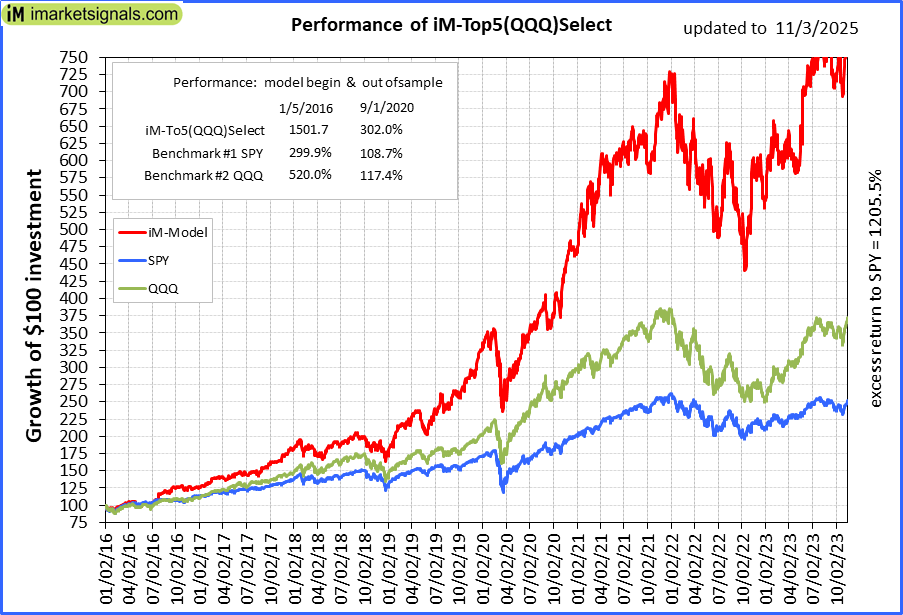 |
iM-Top5(QQQ)Select: Since inception, on 1/5/2016, the model gained 1499.81% while the benchmark SPY gained 294.32% over the same period. Over the previous week the market value of iM-Top5(QQQ)Select gained -1.00% at a time when SPY gained -0.28%. A starting capital of $100,000 at inception on 1/5/2016 would have grown to $1,599,812 which includes $2,587 cash and excludes $21,028 spent on fees and slippage. |
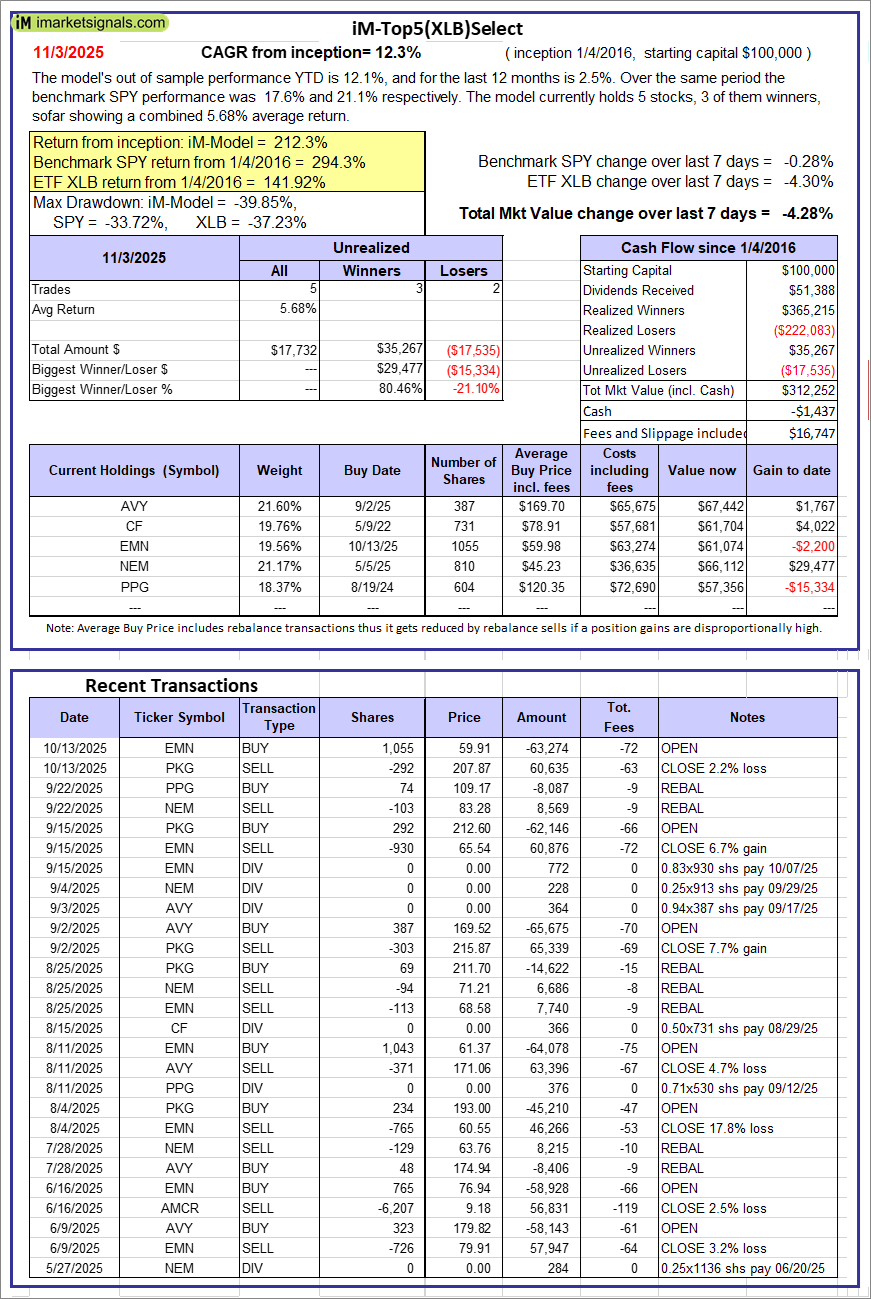 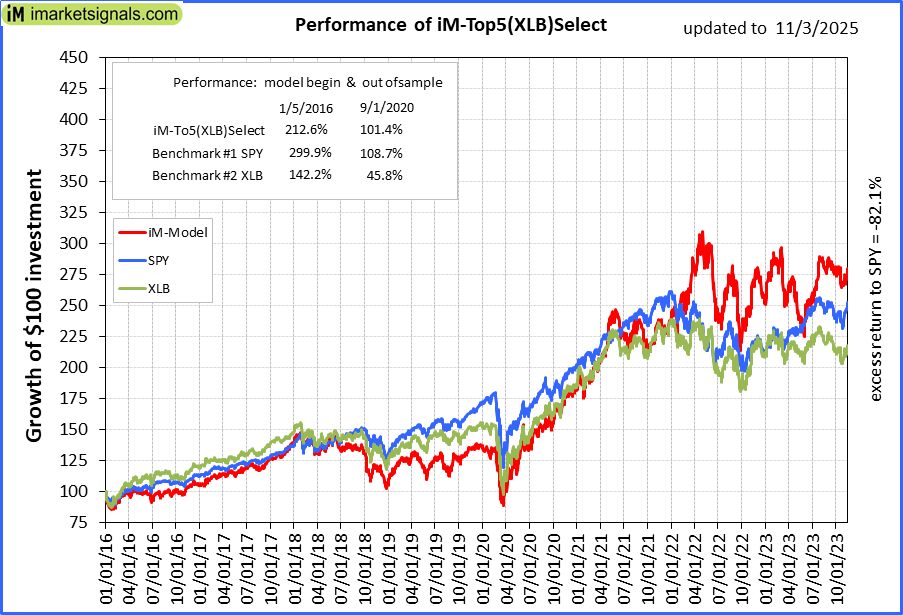 |
iM-Top5(XLB)Select: Since inception, on 1/5/2016, the model gained 212.25% while the benchmark SPY gained 294.32% over the same period. Over the previous week the market value of iM-Top5(XLB)Select gained -4.28% at a time when SPY gained -0.28%. A starting capital of $100,000 at inception on 1/5/2016 would have grown to $312,252 which includes -$1,437 cash and excludes $16,747 spent on fees and slippage. |
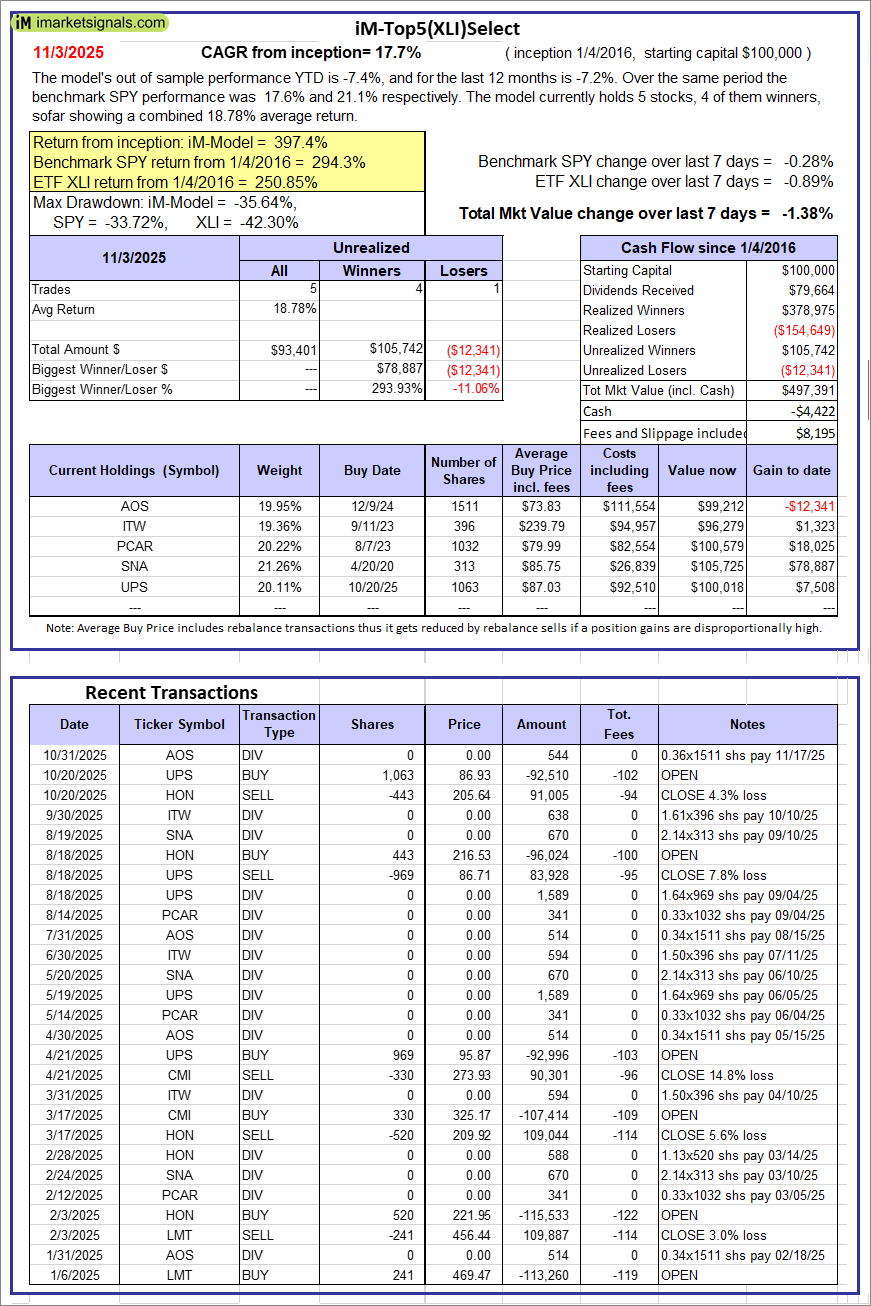 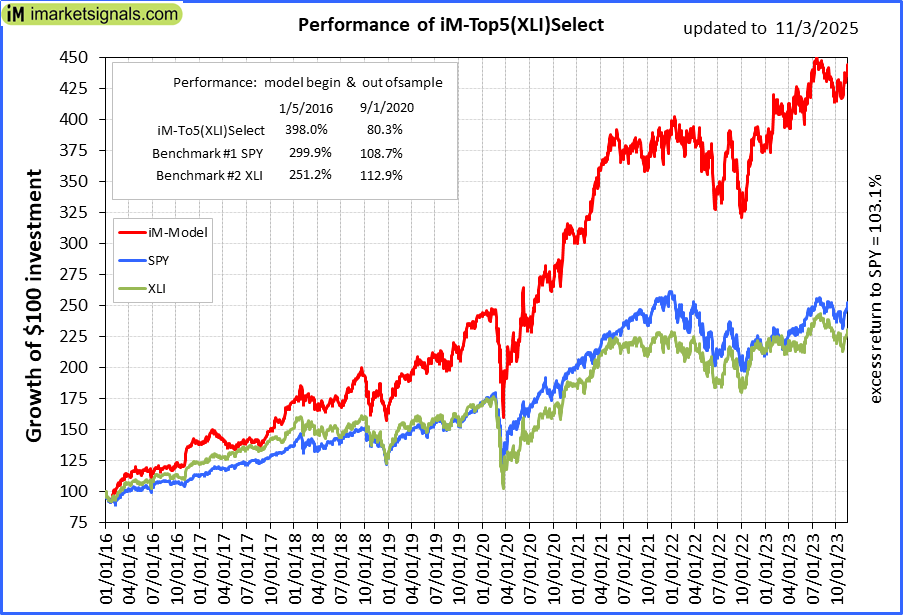 |
iM-Top5(XLI)Select: Since inception, on 1/5/2016, the model gained 397.39% while the benchmark SPY gained 294.32% over the same period. Over the previous week the market value of iM-Top5(XLI)Select gained -1.38% at a time when SPY gained -0.28%. A starting capital of $100,000 at inception on 1/5/2016 would have grown to $497,391 which includes -$4,422 cash and excludes $8,195 spent on fees and slippage. |
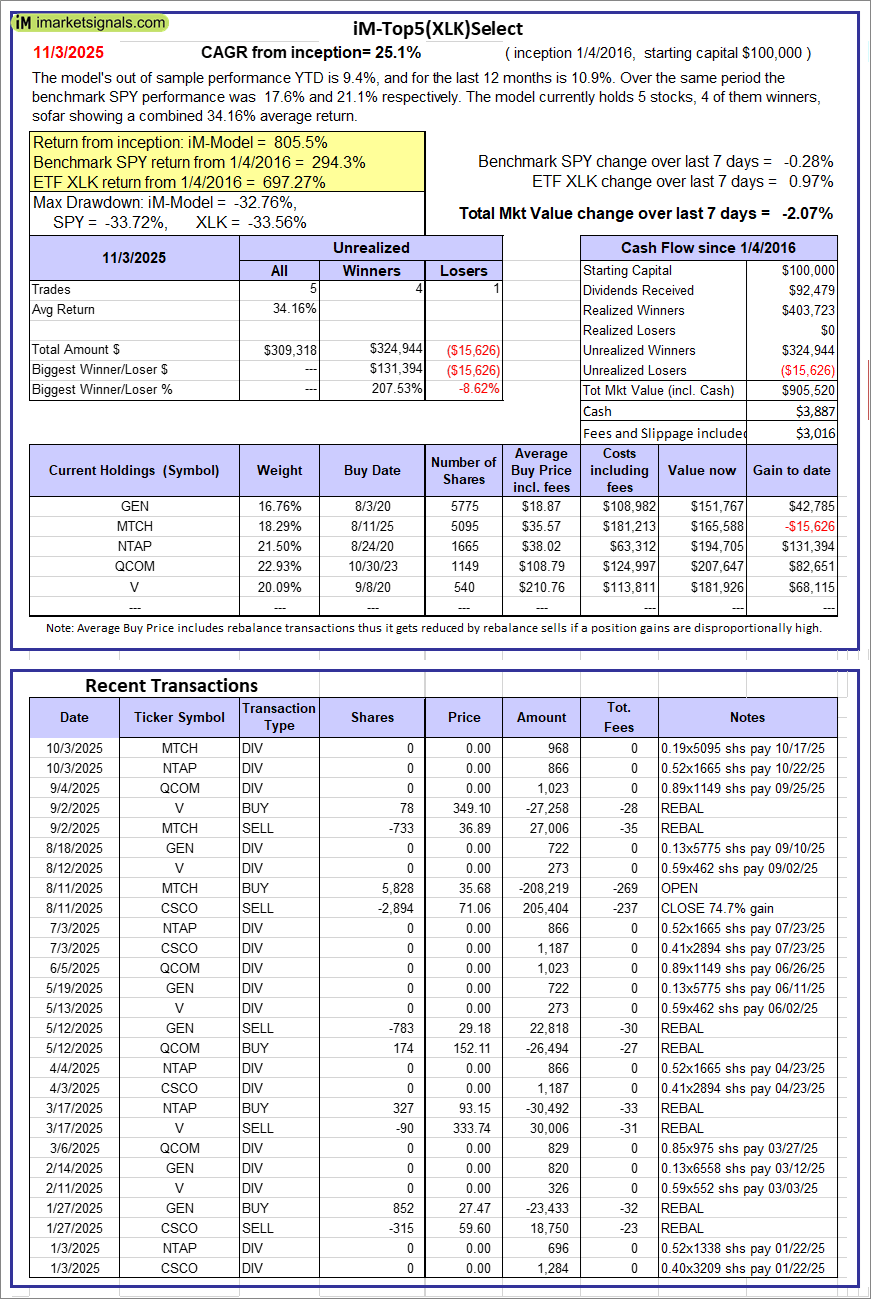 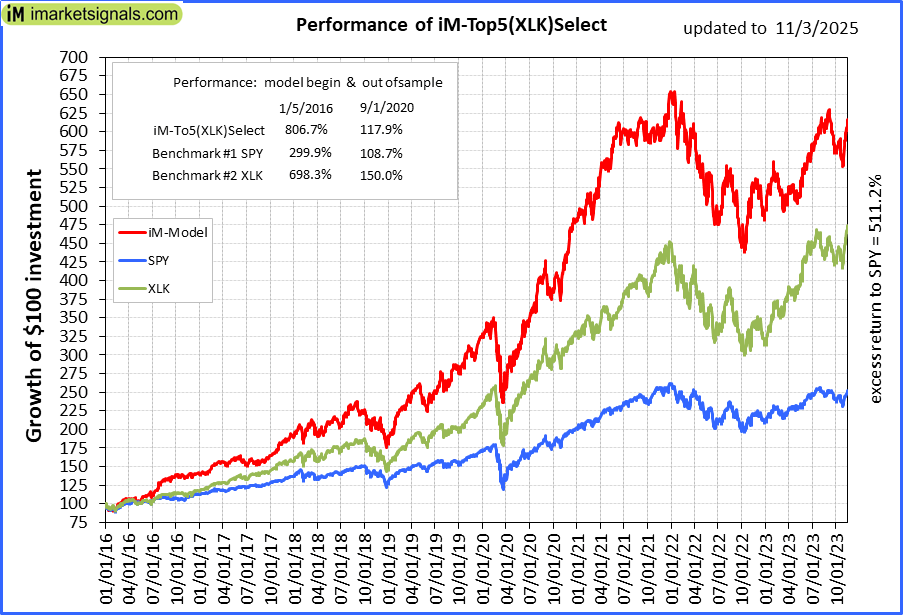 |
iM-Top5(XLK)Select: Since inception, on 1/5/2016, the model gained 805.52% while the benchmark SPY gained 294.32% over the same period. Over the previous week the market value of iM-Top5(XLK)Select gained -2.07% at a time when SPY gained -0.28%. A starting capital of $100,000 at inception on 1/5/2016 would have grown to $905,520 which includes $3,887 cash and excludes $3,016 spent on fees and slippage. |
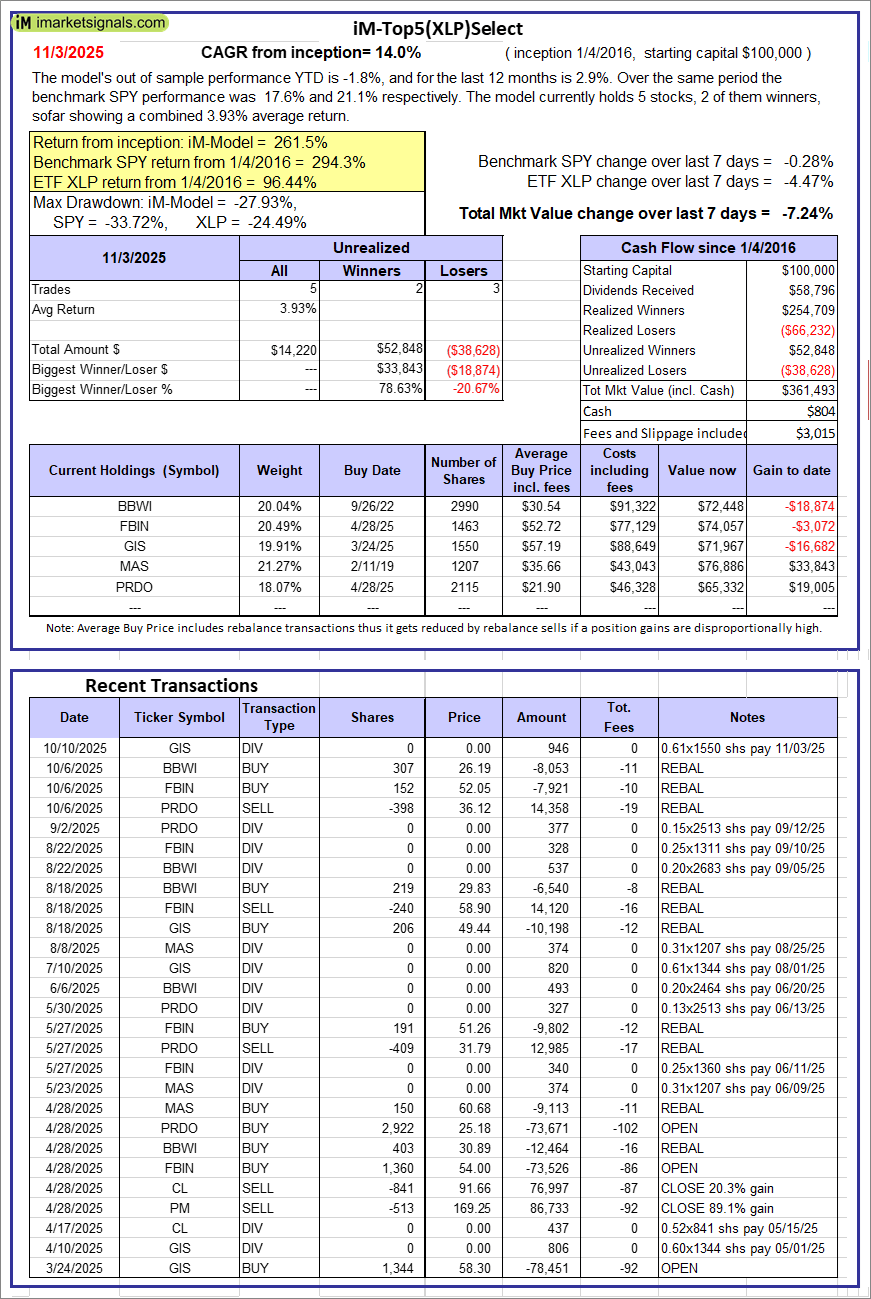 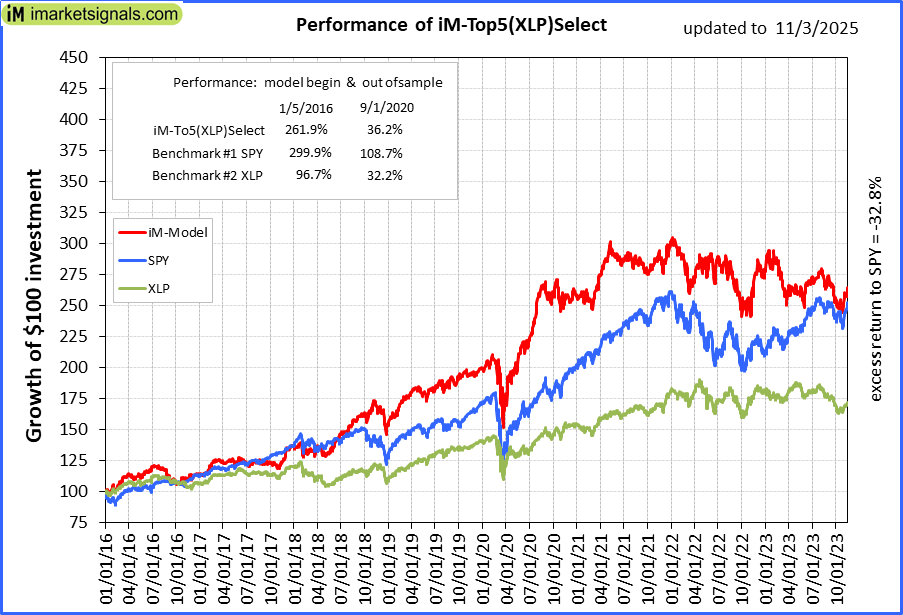 |
iM-Top5(XLP)Select: Since inception, on 1/5/2016, the model gained 261.49% while the benchmark SPY gained 294.32% over the same period. Over the previous week the market value of iM-Top5(XLP)Select gained -7.24% at a time when SPY gained -0.28%. A starting capital of $100,000 at inception on 1/5/2016 would have grown to $361,493 which includes $804 cash and excludes $3,015 spent on fees and slippage. |
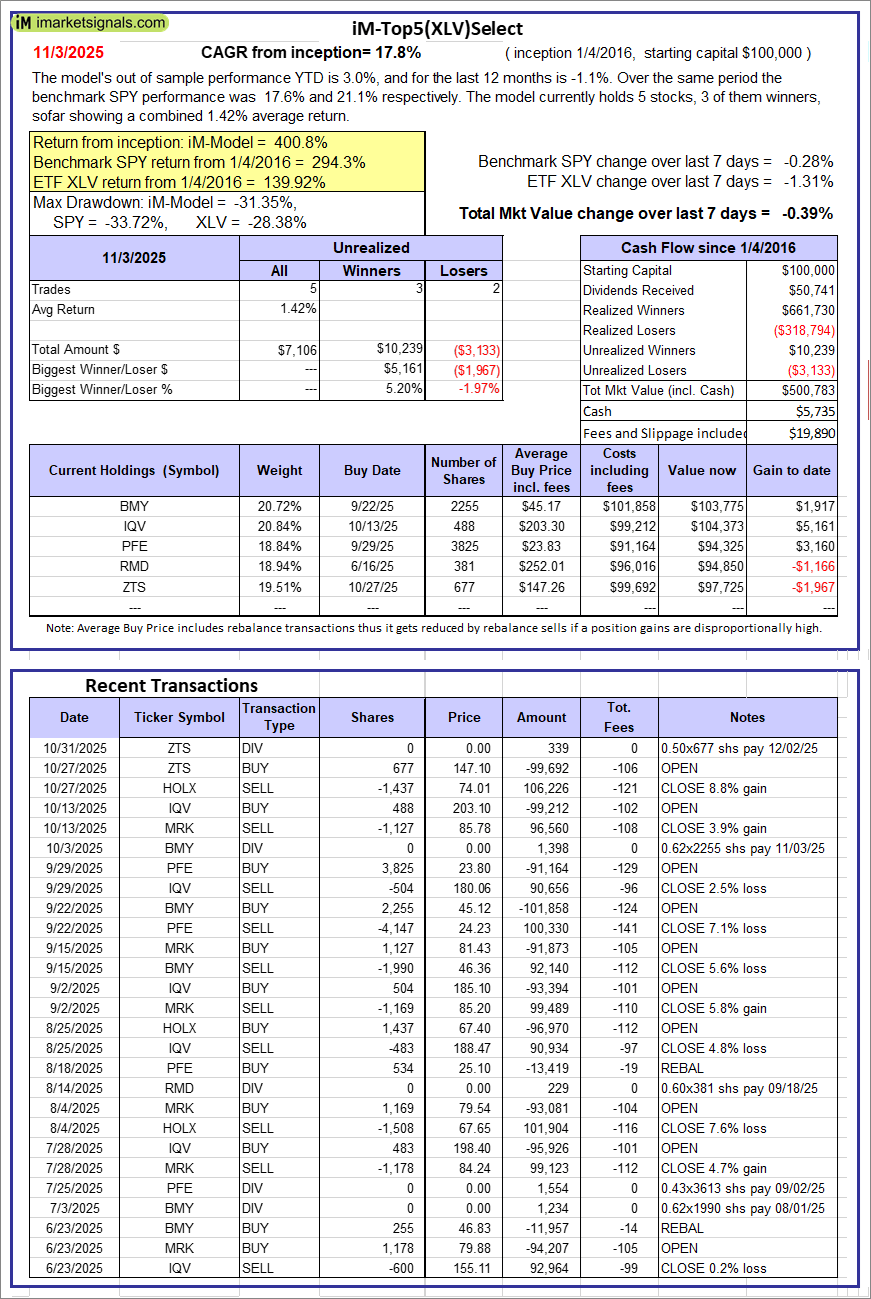 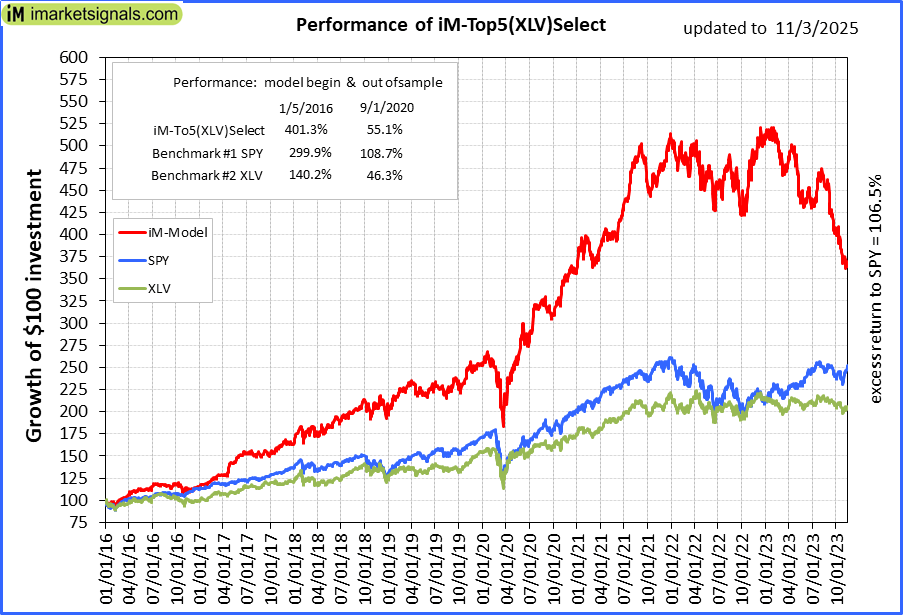 |
iM-Top5(XLV)Select: Since inception, on 1/5/2016, the model gained 400.78% while the benchmark SPY gained 294.32% over the same period. Over the previous week the market value of iM-Top5(XLV)Select gained -0.39% at a time when SPY gained -0.28%. A starting capital of $100,000 at inception on 1/5/2016 would have grown to $500,783 which includes $5,735 cash and excludes $19,890 spent on fees and slippage. |
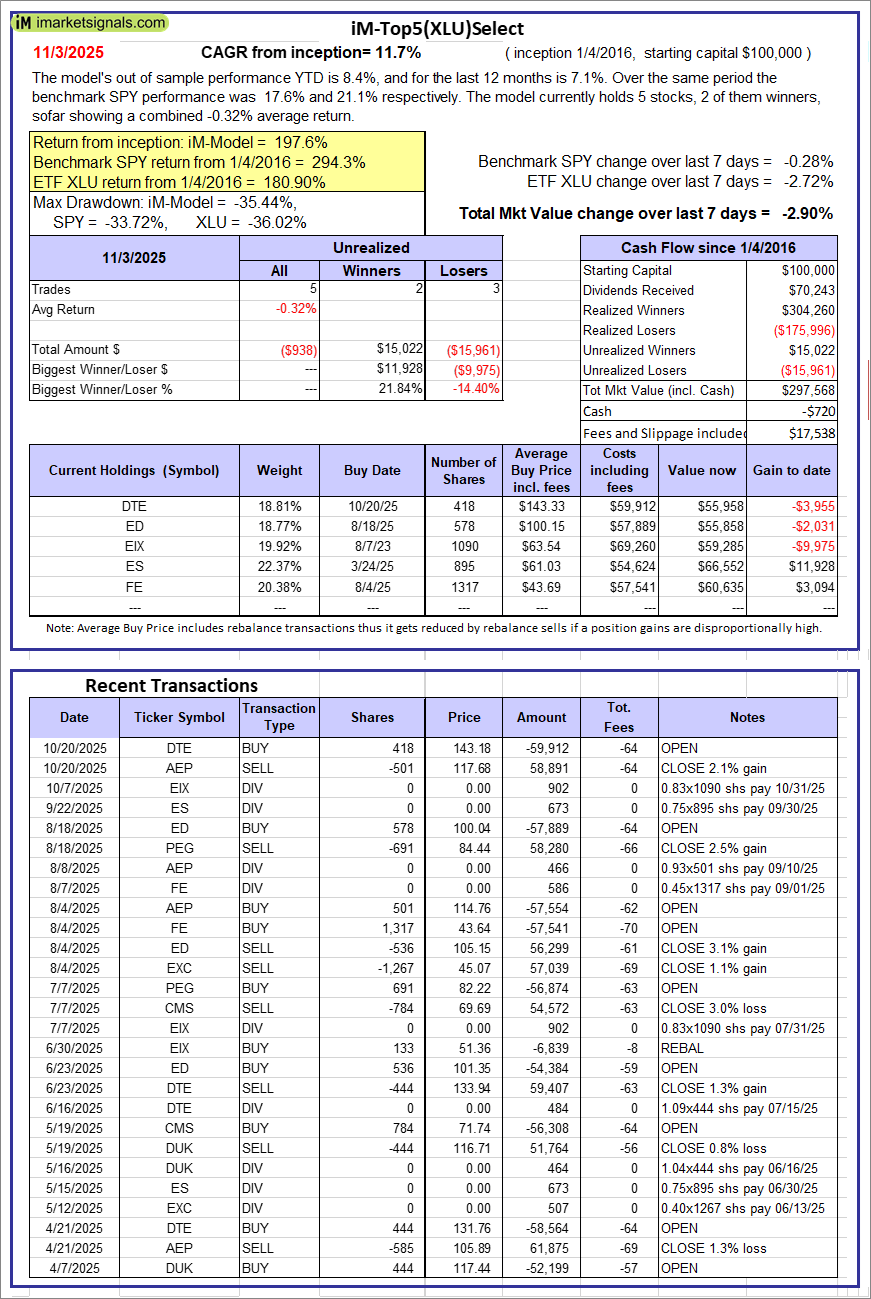 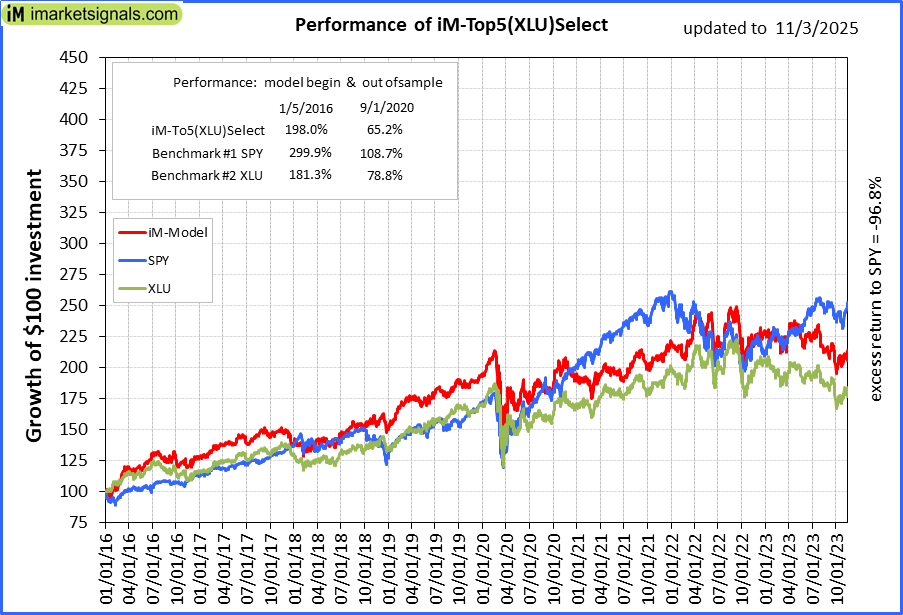 |
iM-Top5(XLU)Select: Since inception, on 1/5/2016, the model gained 197.57% while the benchmark SPY gained 294.32% over the same period. Over the previous week the market value of iM-Top5(XLU)Select gained -2.90% at a time when SPY gained -0.28%. A starting capital of $100,000 at inception on 1/5/2016 would have grown to $297,568 which includes -$720 cash and excludes $17,538 spent on fees and slippage. |
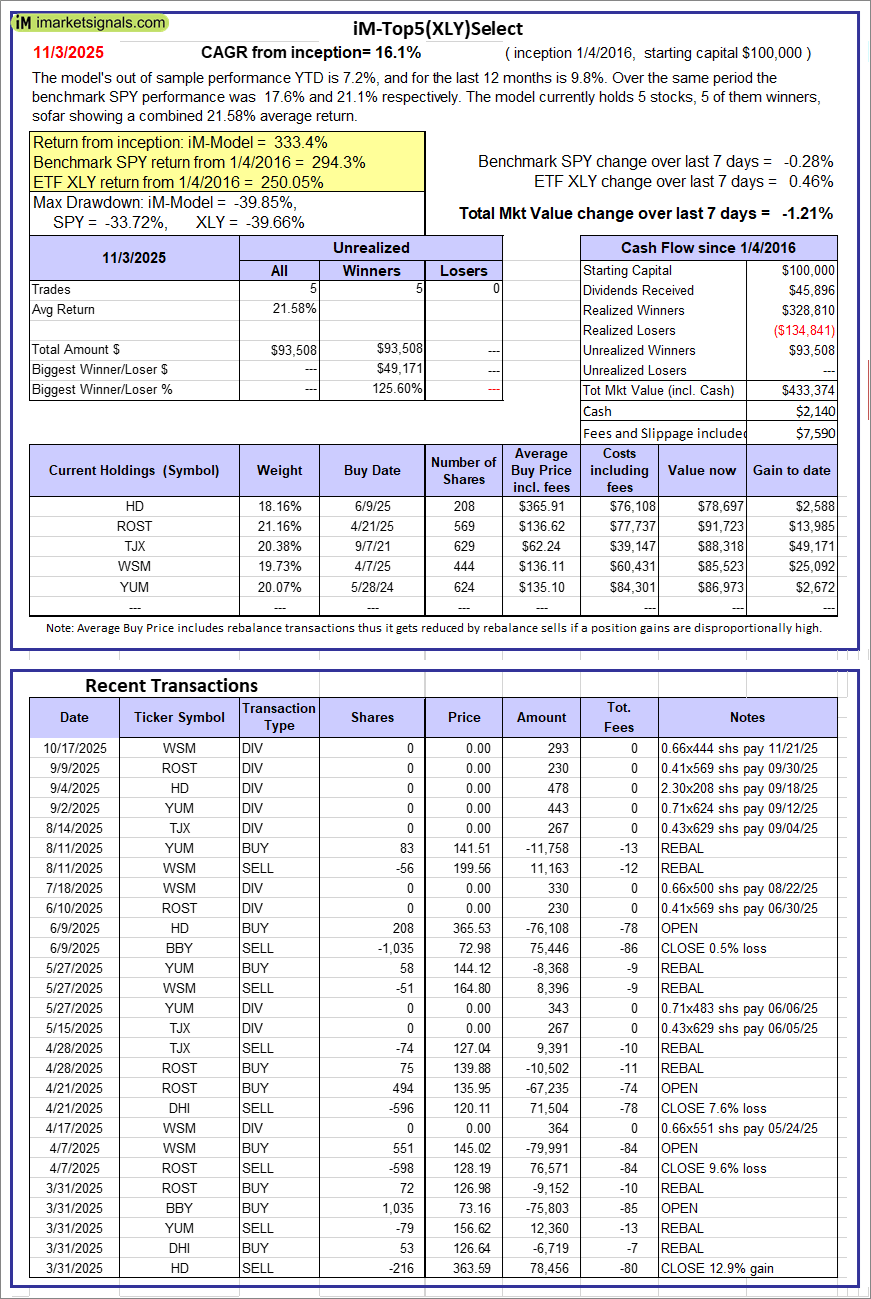 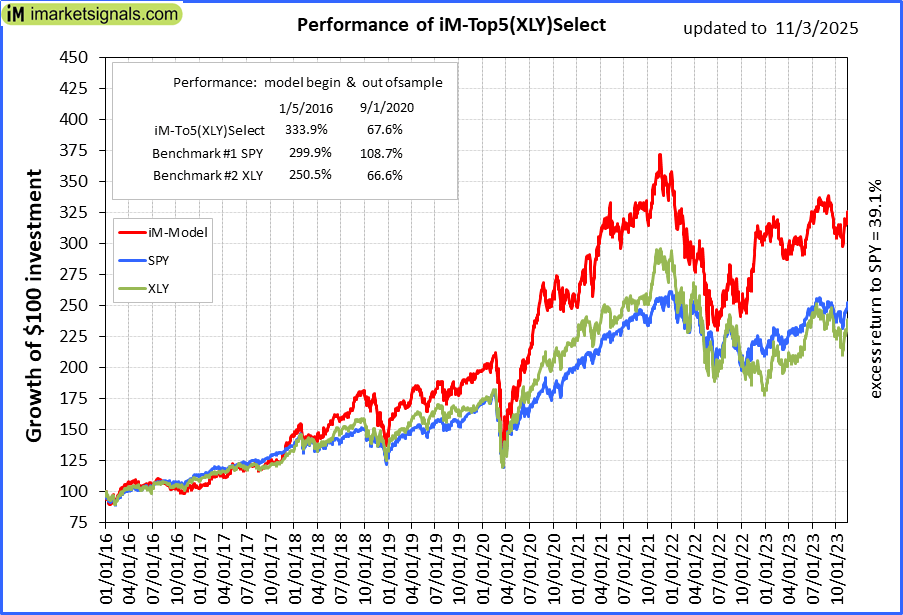 |
iM-Top5(XLY)Select: Since inception, on 1/5/2016, the model gained 333.37% while the benchmark SPY gained 294.32% over the same period. Over the previous week the market value of iM-Top5(XLY)Select gained -1.21% at a time when SPY gained -0.28%. A starting capital of $100,000 at inception on 1/5/2016 would have grown to $433,374 which includes $2,140 cash and excludes $7,590 spent on fees and slippage. |
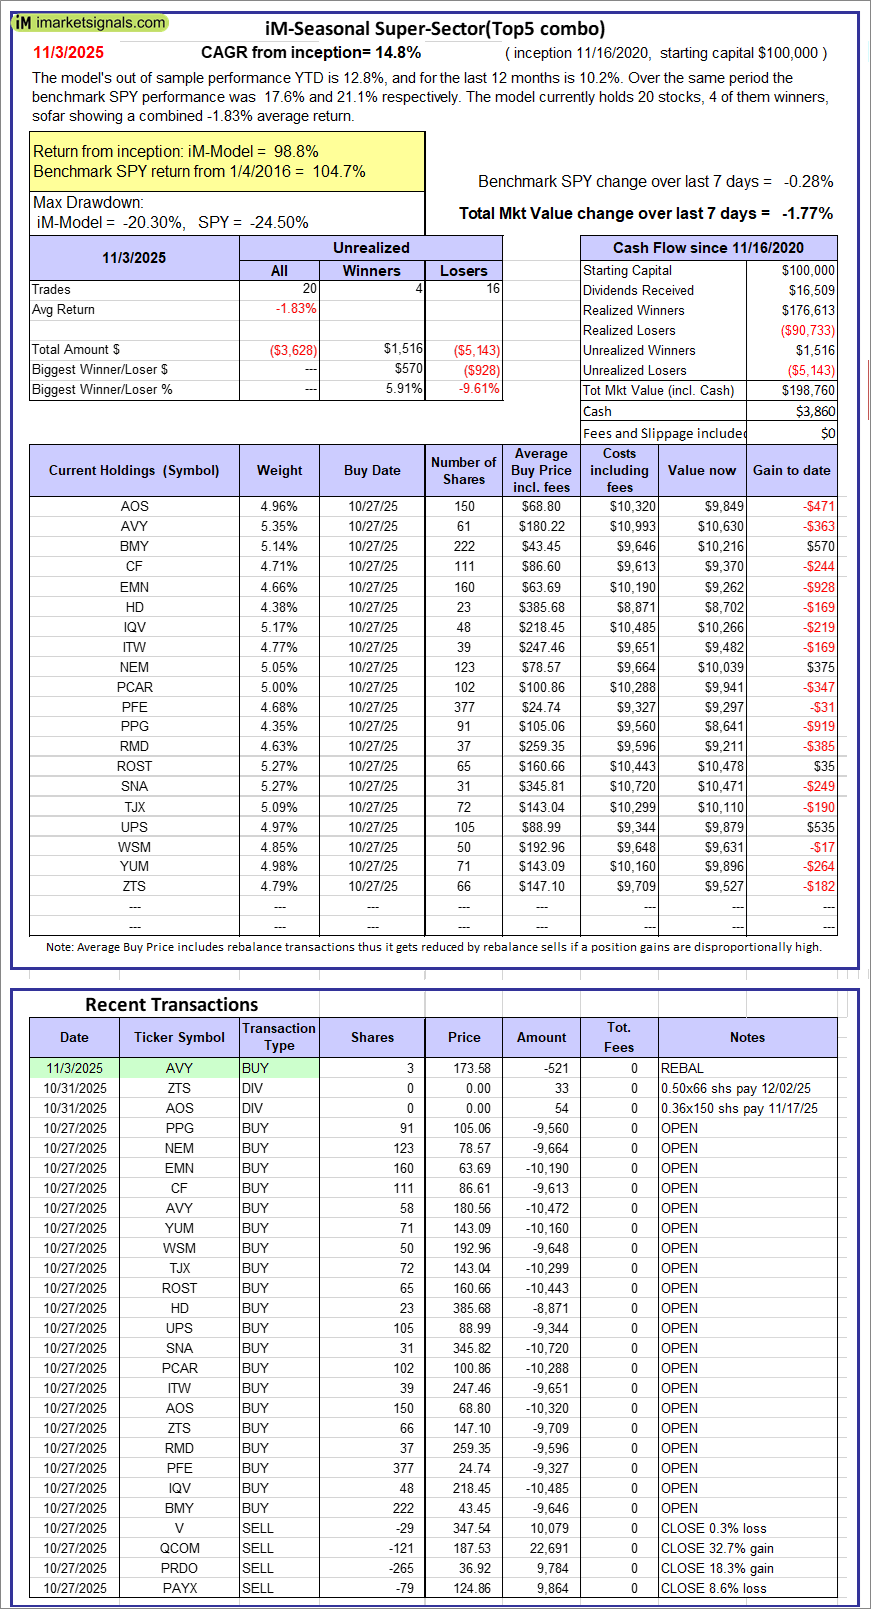 |
iM-Seasonal Super-Sectors (Top5 combo) : Since inception, on 11/17/2020, the model gained 98.76% while the benchmark SPY gained 104.69% over the same period. Over the previous week the market value of iM-Seasonal Super-Sectors (Top5 combo) gained -1.77% at a time when SPY gained -0.28%. A starting capital of $100,000 at inception on 11/17/2020 would have grown to $198,760 which includes $3,860 cash and excludes $00 spent on fees and slippage. |
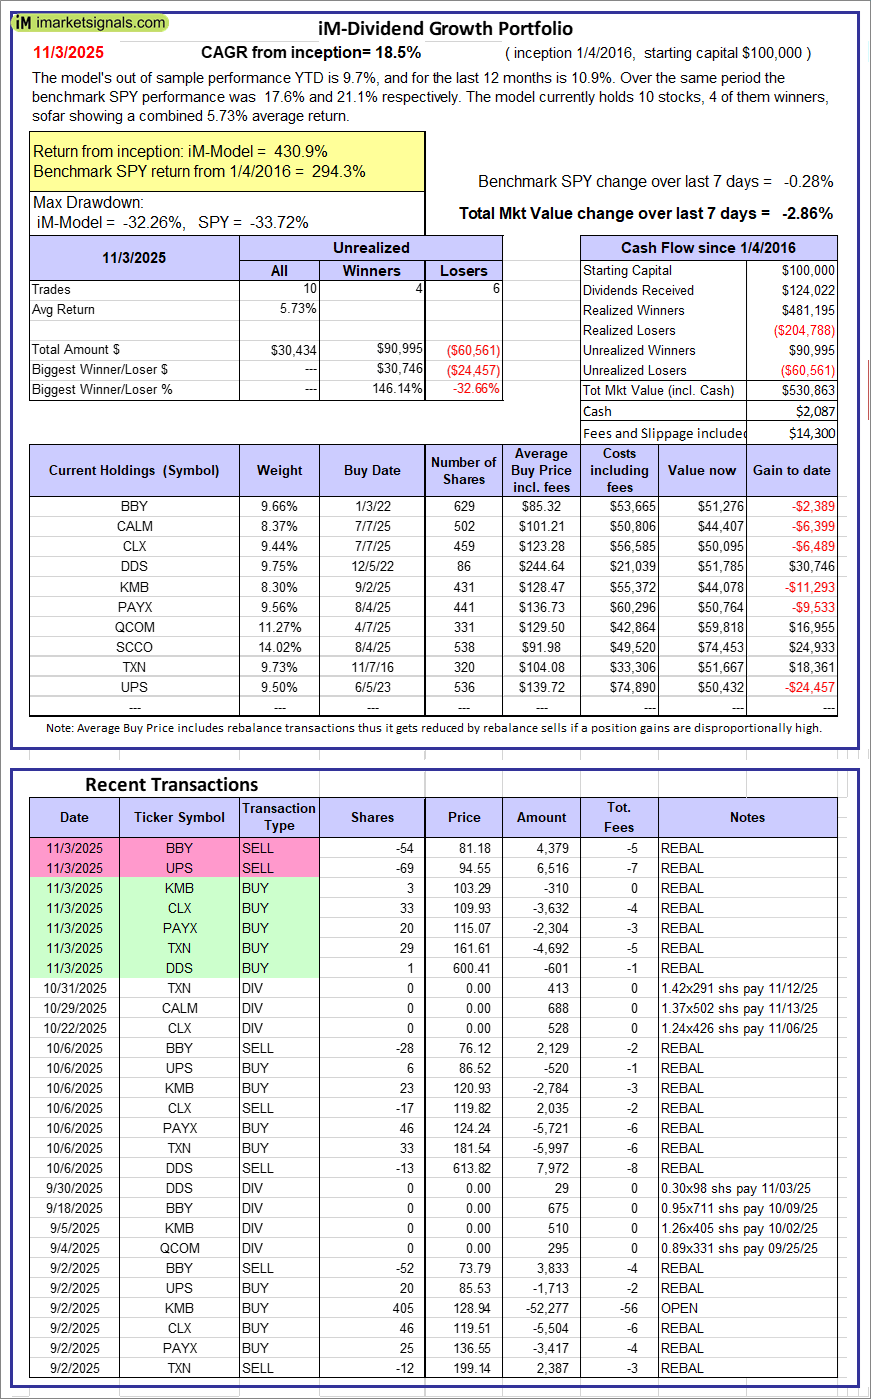 |
iM-Dividend Growth Portfolio: The model’s out of sample performance YTD is 9.7%, and for the last 12 months is 10.9%. Over the same period the benchmark SPY performance was 17.6% and 21.1% respectively. Over the previous week the market value of the iM-Dividend Growth Portfolio gained -2.86% at a time when SPY gained -0.28%. A starting capital of $100,000 at inception on 6/30/2016 would have grown to $530,863 which includes $2,087 cash and excludes $14,300 spent on fees and slippage. |
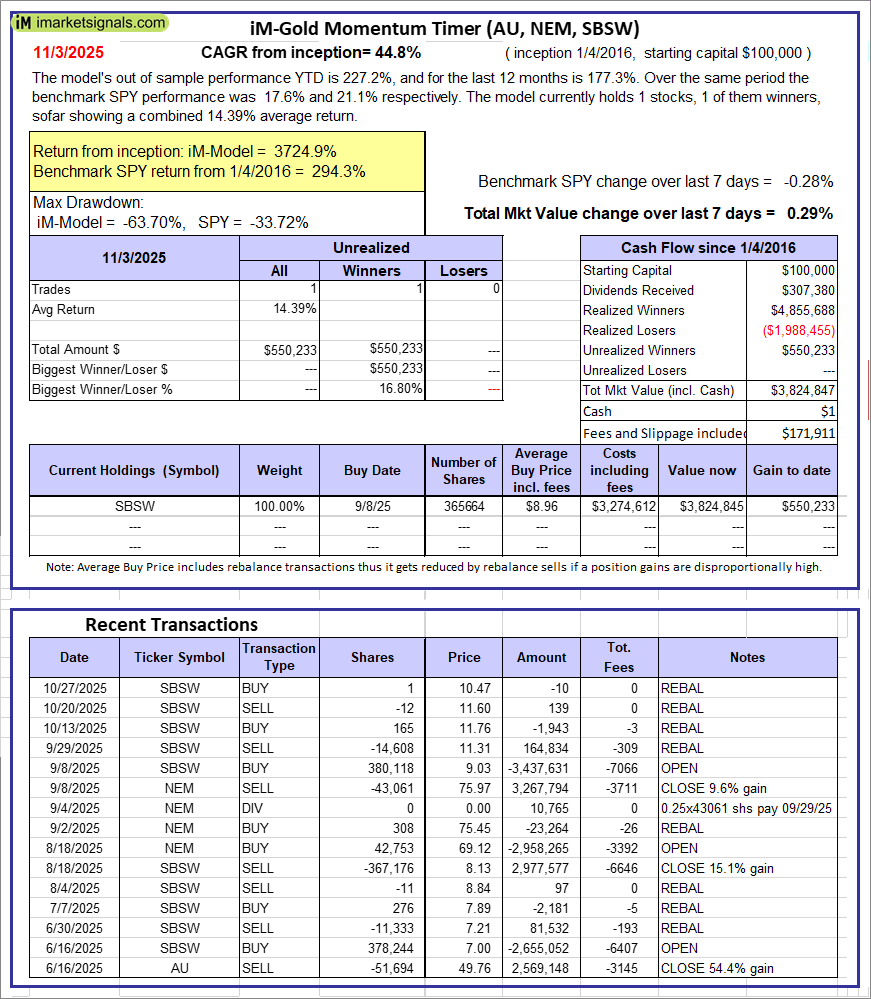 |
iM-Gold Momentum Timer (AU, NEM, SBSW): The model’s out of sample performance YTD is 227.2%, and for the last 12 months is 177.3%. Over the same period the benchmark SPY performance was 17.6% and 21.1% respectively. Over the previous week the market value of iM-Gold Momentum Timer (AU, NEM, SBSW) gained 0.29% at a time when SPY gained -0.28%. A starting capital of $100,000 at inception on 6/30/2016 would have grown to $01 which includes $171,911 cash and excludes Gain to date spent on fees and slippage. |
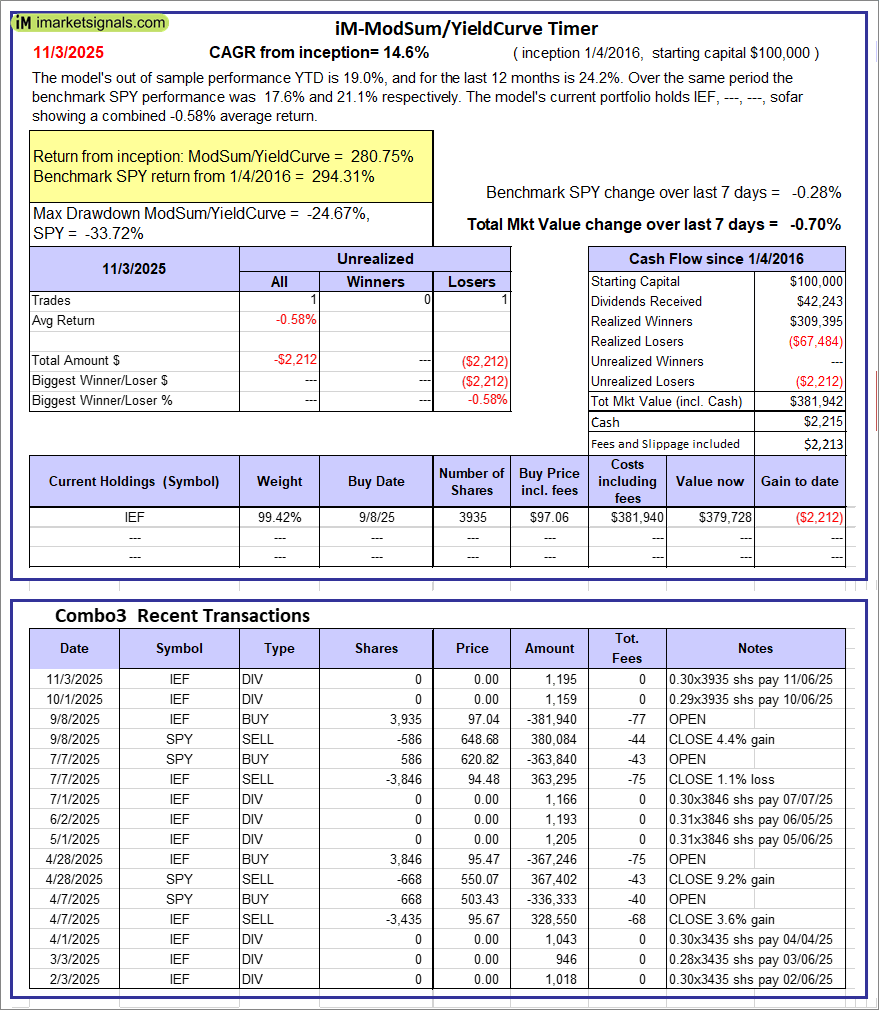 |
iM-ModSum/YieldCurve Timer: The model’s out of sample performance YTD is 19.0%, and for the last 12 months is 24.2%. Over the same period the benchmark SPY performance was 17.6% and 21.1% respectively. Over the previous week the market value of iM-PortSum/YieldCurve Timer gained -0.70% at a time when SPY gained -0.28%. A starting capital of $100,000 at inception on 1/1/2016 would have grown to $381,942 which includes $2,215 cash and excludes $2,213 spent on fees and slippage. |
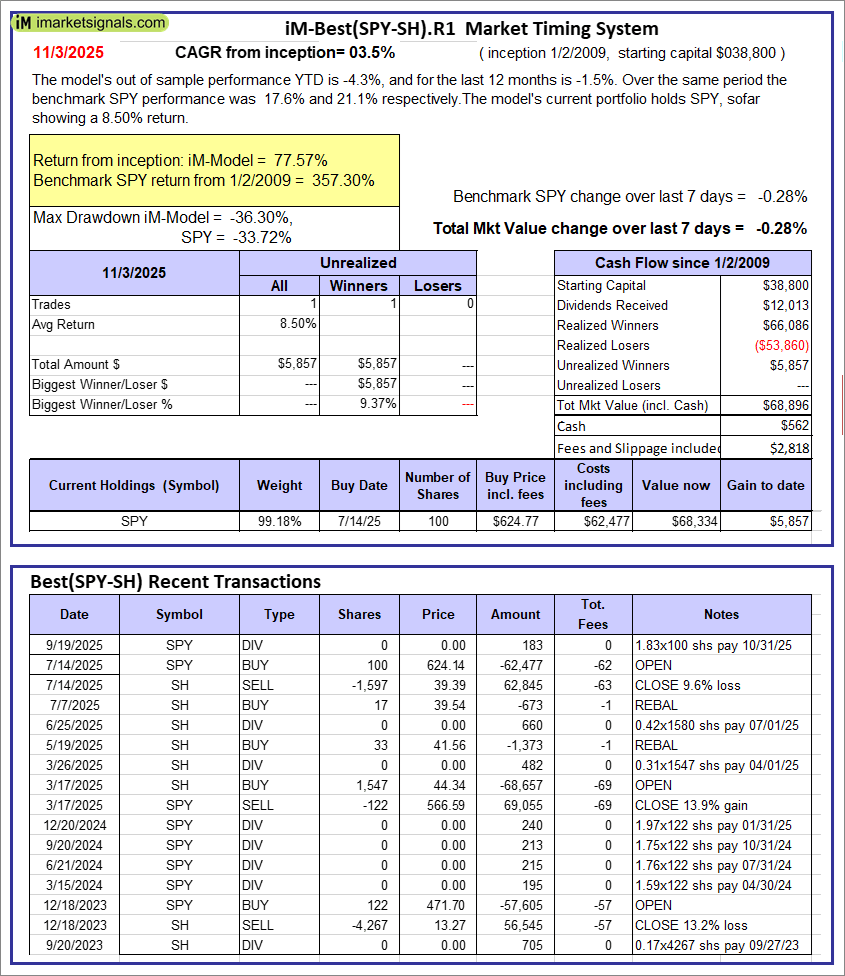 |
iM-Best(SPY-SH).R1: The model’s out of sample performance YTD is -4.3%, and for the last 12 months is -1.5%. Over the same period the benchmark SPY performance was 17.6% and 21.1% respectively. Over the previous week the market value of Best(SPY-SH) gained -0.28% at a time when SPY gained -0.28%. A starting capital of $100,000 at inception on 1/2/2009 would have grown to $68,896 which includes $562 cash and excludes $2,818 spent on fees and slippage. |
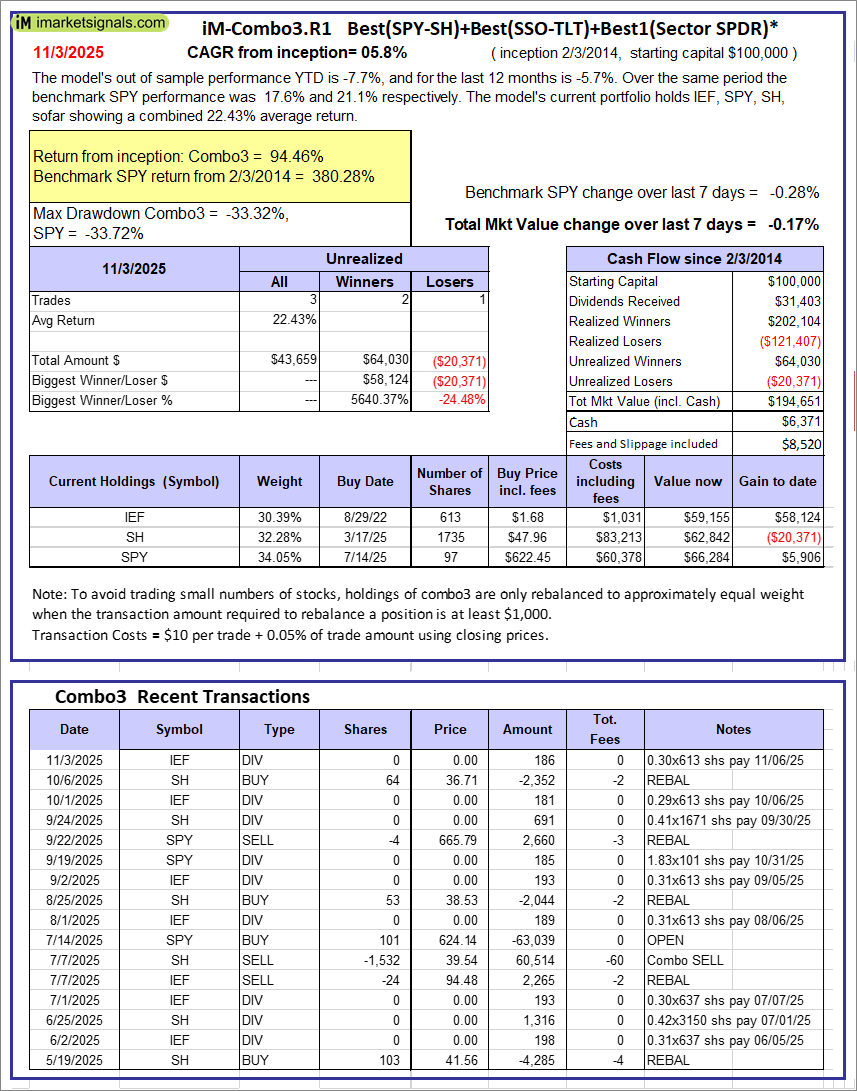 |
iM-Combo3.R1: The model’s out of sample performance YTD is -7.7%, and for the last 12 months is -5.7%. Over the same period the benchmark SPY performance was 17.6% and 21.1% respectively. Over the previous week the market value of iM-Combo3.R1 gained -0.17% at a time when SPY gained -0.28%. A starting capital of $100,000 at inception on 2/3/2014 would have grown to $194,651 which includes $6,371 cash and excludes $8,520 spent on fees and slippage. |
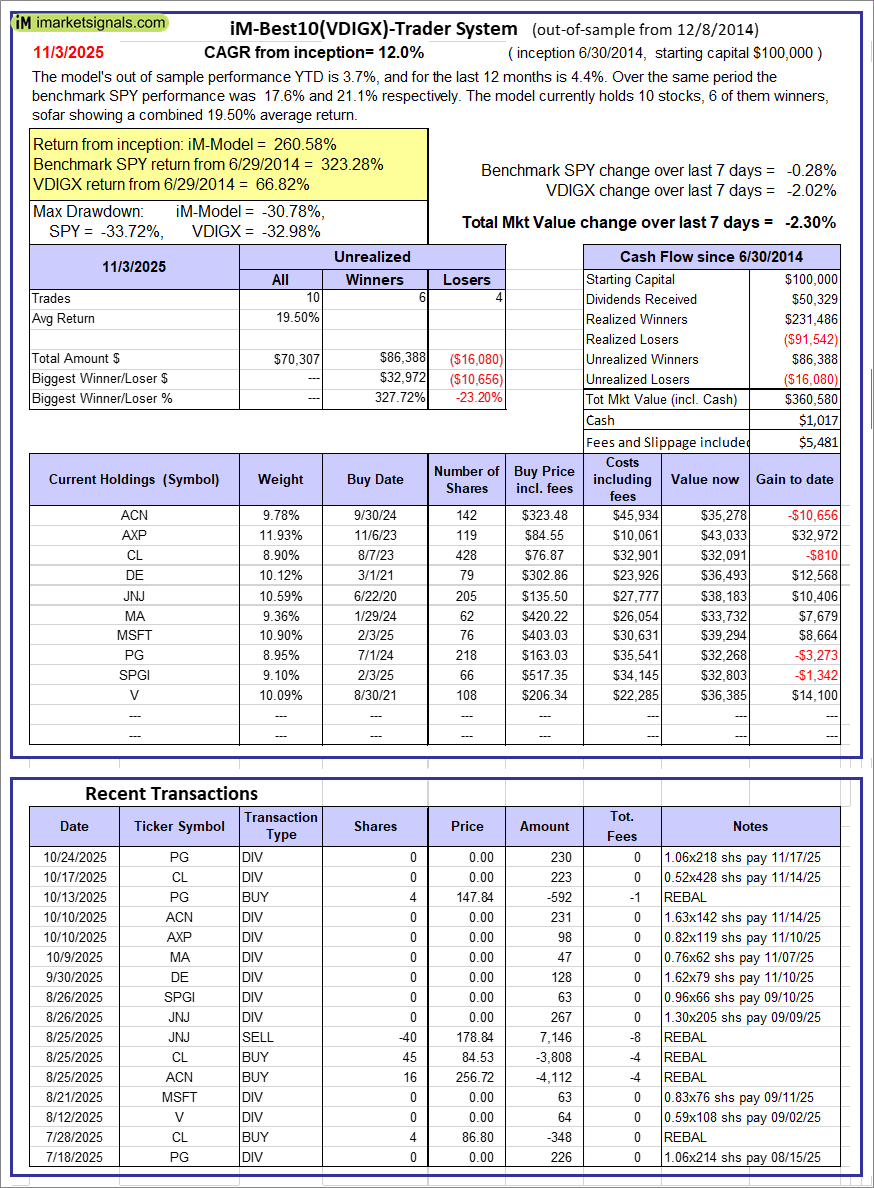 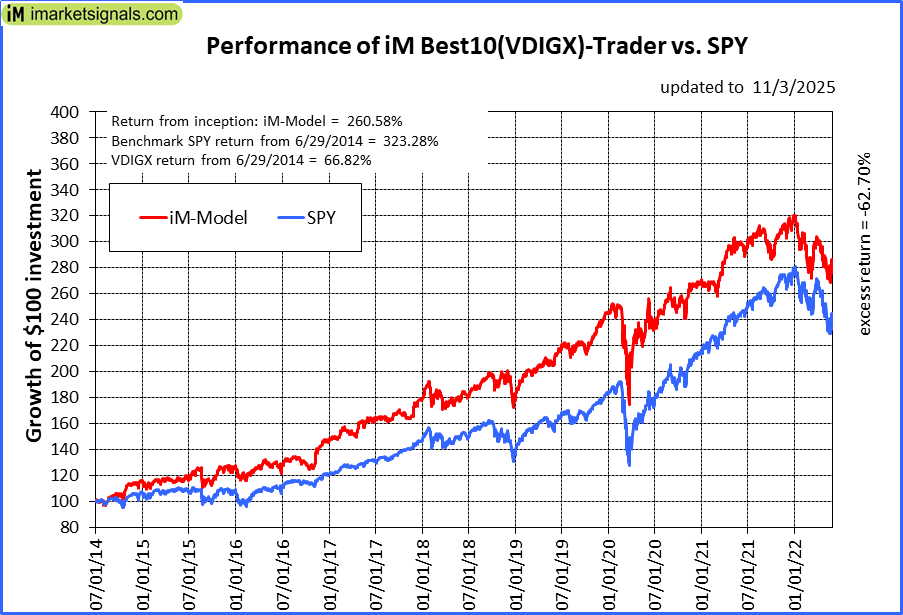 |
iM-Best10(VDIGX)-Trader: The model’s out of sample performance YTD is 3.7%, and for the last 12 months is 4.4%. Over the same period the benchmark SPY performance was 17.6% and 21.1% respectively. Since inception, on 7/1/2014, the model gained 260.58% while the benchmark SPY gained 323.28% and VDIGX gained 66.82% over the same period. Over the previous week the market value of iM-Best10(VDIGX) gained -2.30% at a time when SPY gained -0.28%. A starting capital of $100,000 at inception on 7/1/2014 would have grown to $360,580 which includes $1,017 cash and excludes $5,481 spent on fees and slippage. |
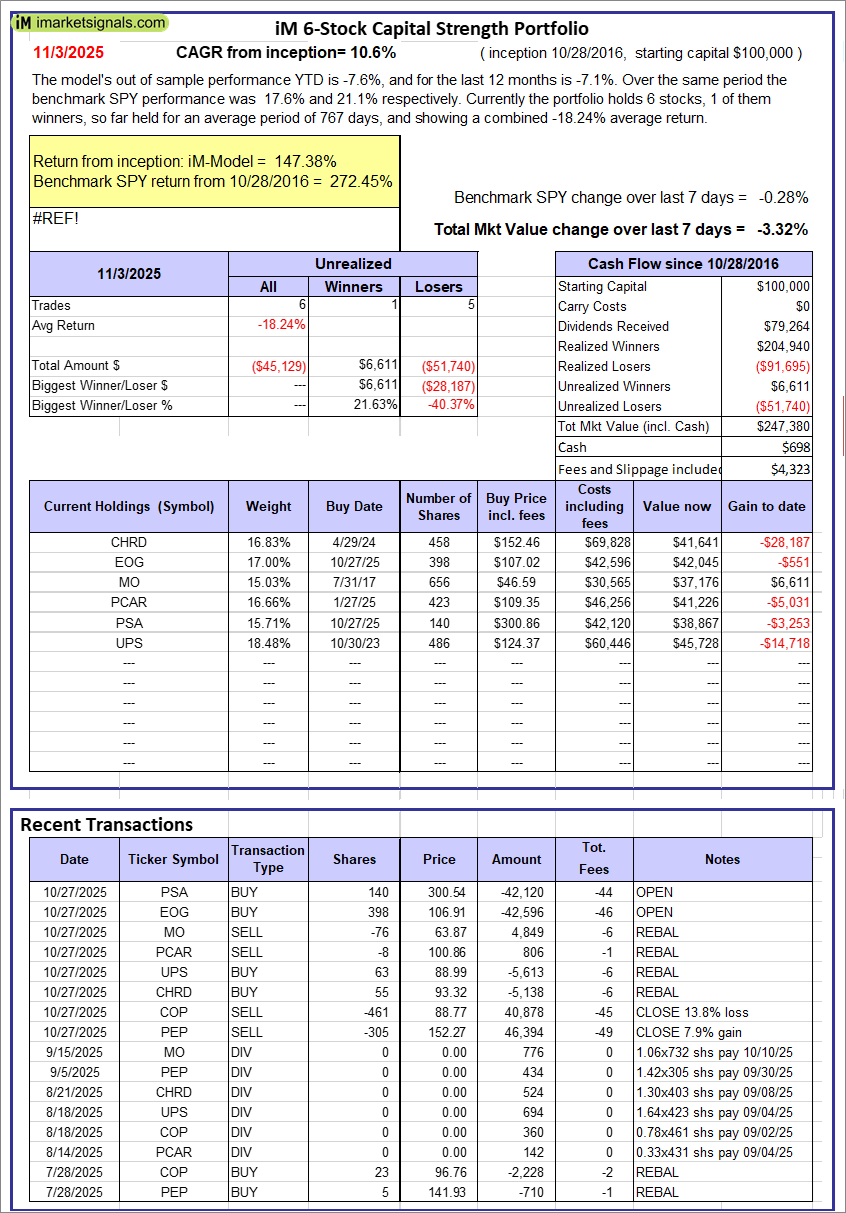 |
iM 6-Stock Capital Strength Portfolio: The model’s out of sample performance YTD is -7.6%, and for the last 12 months is -7.1%. Over the same period the benchmark SPY performance was 17.6% and 21.1% respectively. Over the previous week the market value of the iM 6-Stock Capital Strength Portfolio gained -3.32% at a time when SPY gained -0.28%. A starting capital of $100,000 at inception on 10/28/2016 would have grown to $247,380 which includes $698 cash and excludes $4,323 spent on fees and slippage. |
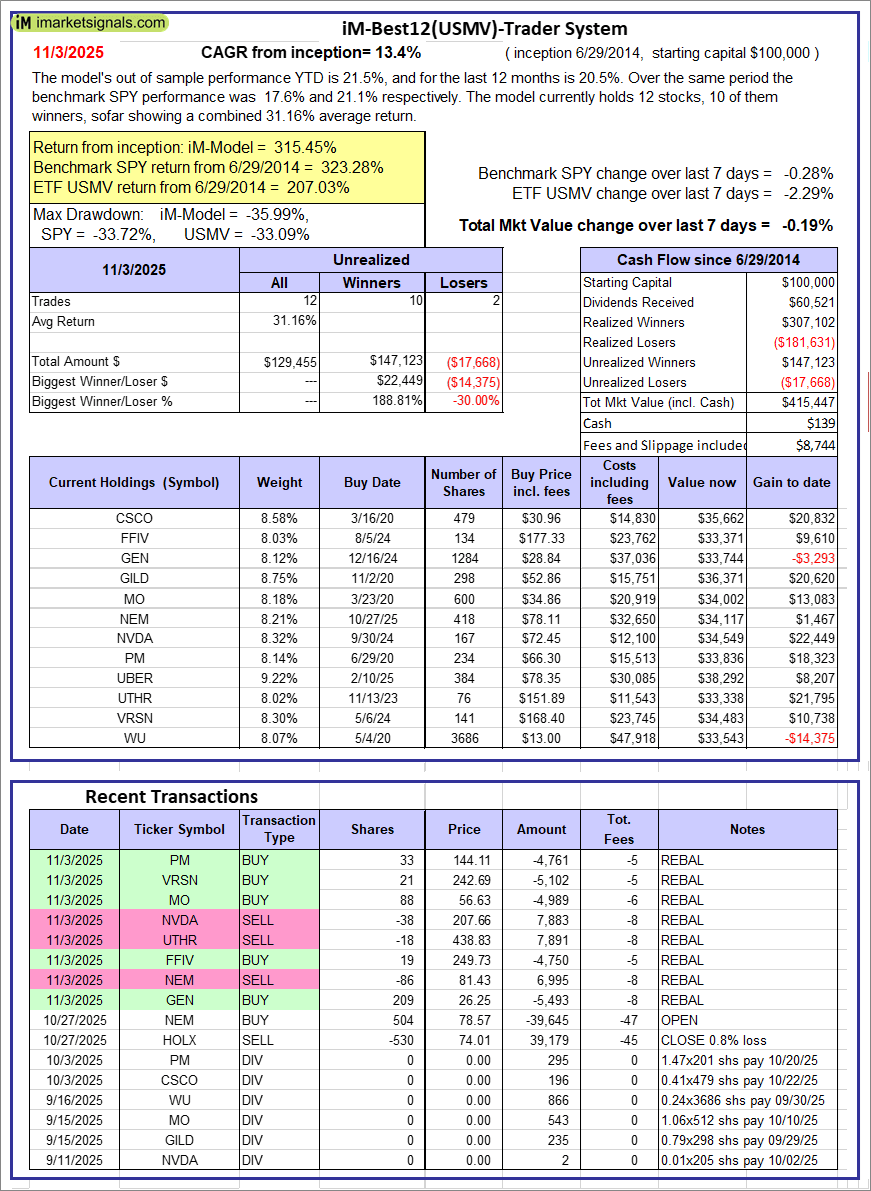 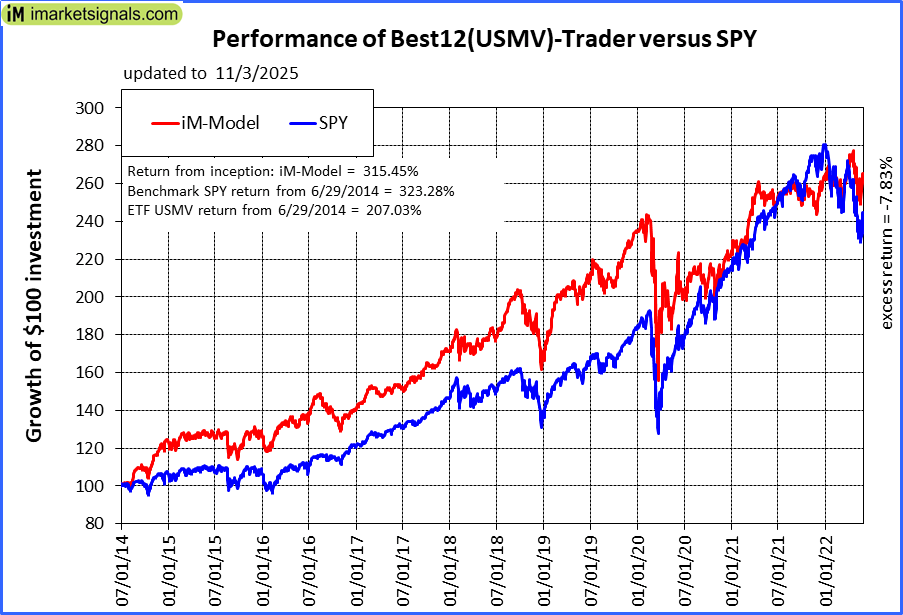 |
iM-Best12(USMV)-Trader: The model’s out of sample performance YTD is 21.5%, and for the last 12 months is 20.5%. Over the same period the benchmark SPY performance was 17.6% and 21.1% respectively. Since inception, on 6/30/2014, the model gained 315.45% while the benchmark SPY gained 323.28% and the ETF USMV gained 207.03% over the same period. Over the previous week the market value of iM-Best12(USMV)-Trader gained -0.19% at a time when SPY gained -0.28%. A starting capital of $100,000 at inception on 6/30/2014 would have grown to $415,447 which includes $139 cash and excludes $8,744 spent on fees and slippage. |
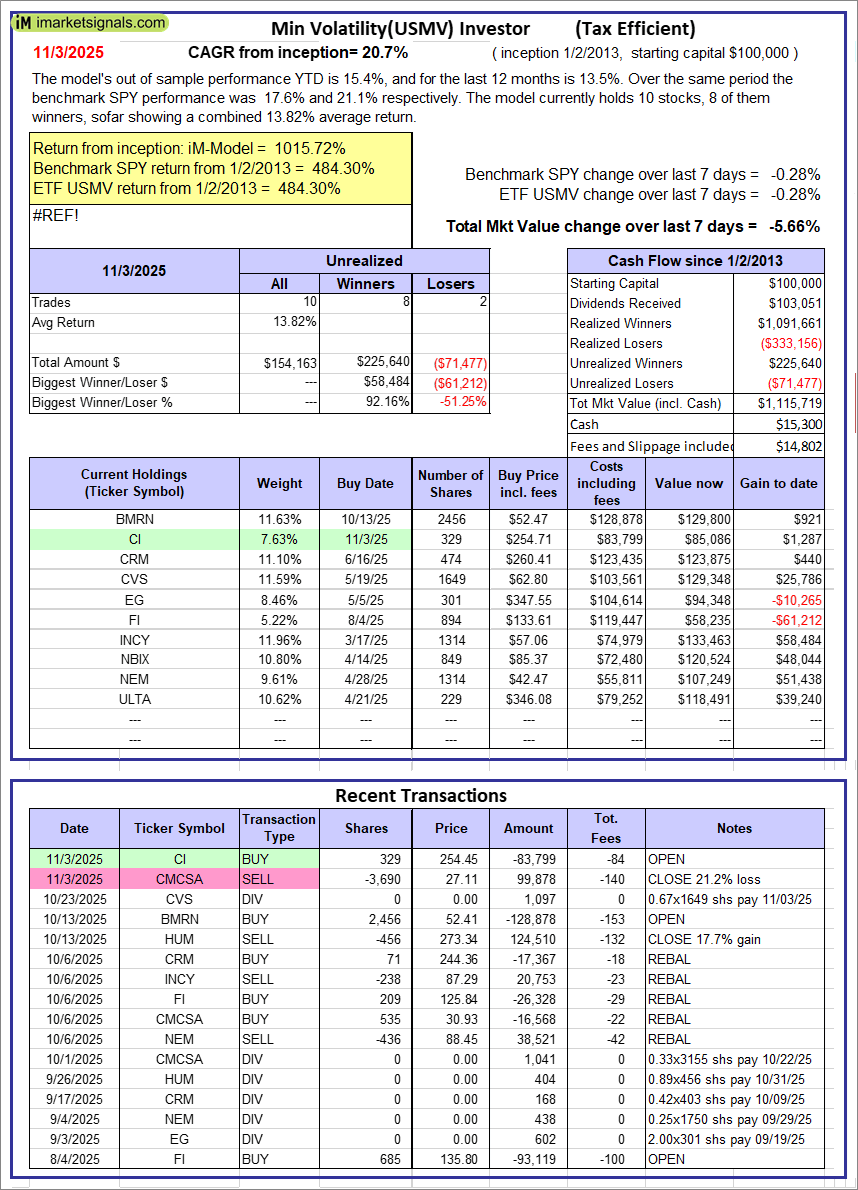 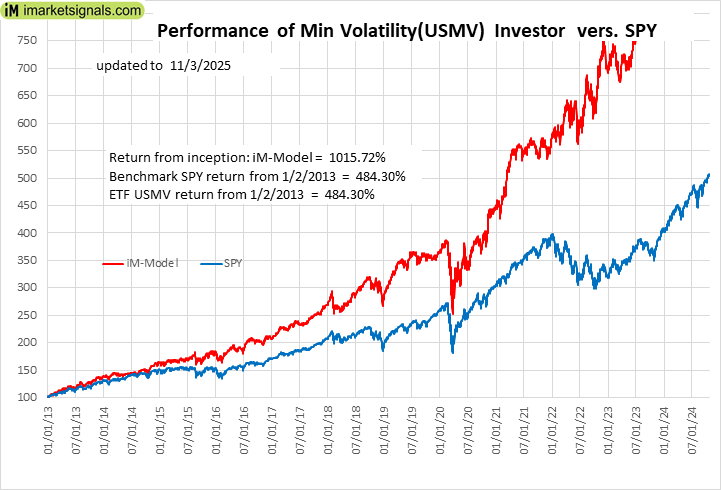 |
iM-Min Volatility(USMV) Investor (Tax Efficient): The model’s out of sample performance YTD is 15.4%, and for the last 12 months is 13.5%. Over the same period the benchmark SPY performance was 17.6% and 21.1% respectively. Since inception, on 1/3/2013, the model gained 1015.72% while the benchmark SPY gained 484.30% and the ETF USMV gained 484.30% over the same period. Over the previous week the market value of iM-Best12(USMV)Q1 gained -5.66% at a time when SPY gained -0.28%. A starting capital of $100,000 at inception on 1/3/2013 would have grown to $1,115,719 which includes $15,300 cash and excludes $14,802 spent on fees and slippage. |
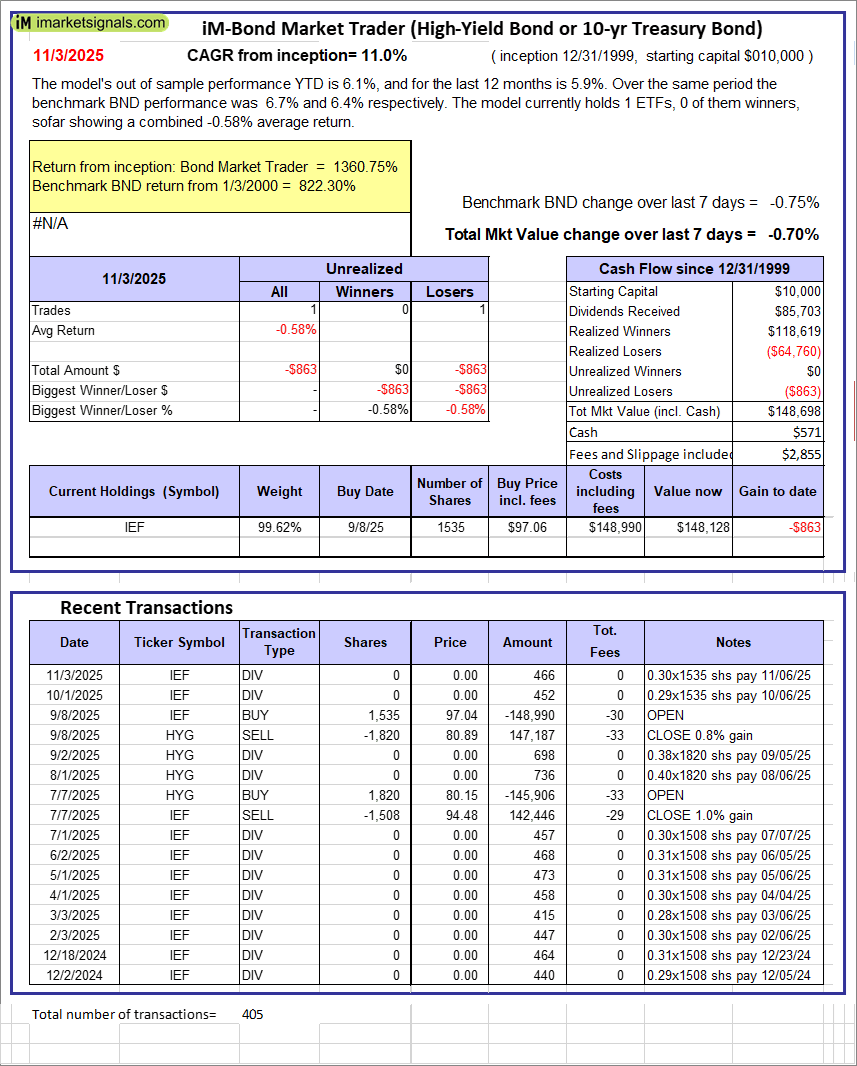 |
iM-Bond Market Trader (High-Yield Bond or 10-yr Treasury Bond): The model’s out of sample performance YTD is 6.1%, and for the last 12 months is 5.9%. Over the same period the benchmark BND performance was 6.7% and 6.4% respectively. Over the previous week the market value of the iM-Bond Market Trader (High-Yield Bond or 10-yr Treasury Bond) gained -0.70% at a time when BND gained -0.75%. A starting capital of $10,000 at inception on 1/3/2000 would have grown to $148,698 which includes $571 cash and excludes $2,855 spent on fees and slippage. |
|
|
iM-ModSum/YieldCurve Timer: The model’s out of sample performance YTD is 19.0%, and for the last 12 months is 24.2%. Over the same period the benchmark SPY performance was 17.6% and 21.1% respectively. Over the previous week the market value of iM-PortSum/YieldCurve Timer gained -0.70% at a time when SPY gained -0.28%. A starting capital of $100,000 at inception on 1/1/2016 would have grown to $381,942 which includes $2,215 cash and excludes $2,213 spent on fees and slippage. |
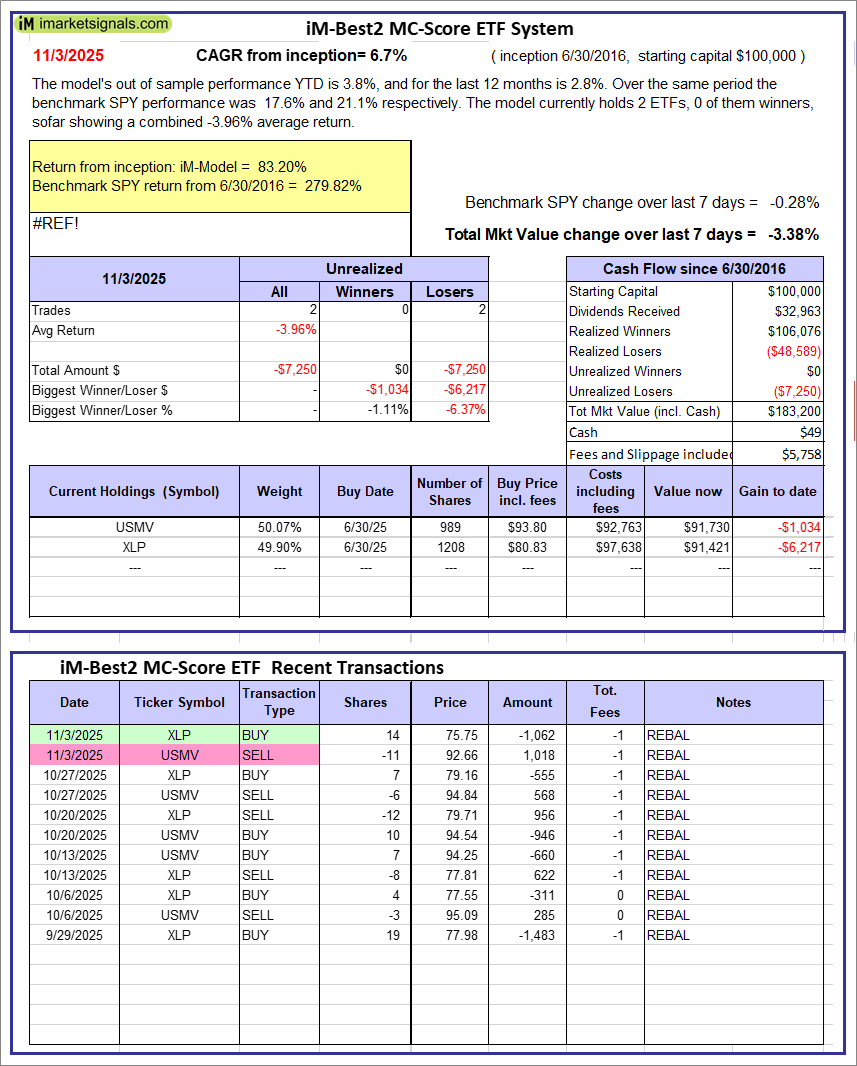 |
iM-Best2 MC-Score ETF System: The model’s out of sample performance YTD is 3.8%, and for the last 12 months is 2.8%. Over the same period the benchmark SPY performance was 17.6% and 21.1% respectively. Over the previous week the market value of the iM-Best2 MC-Score ETF System gained -3.38% at a time when SPY gained -0.28%. A starting capital of $100,000 at inception on 6/30/2016 would have grown to $183,200 which includes $49 cash and excludes $5,758 spent on fees and slippage. |
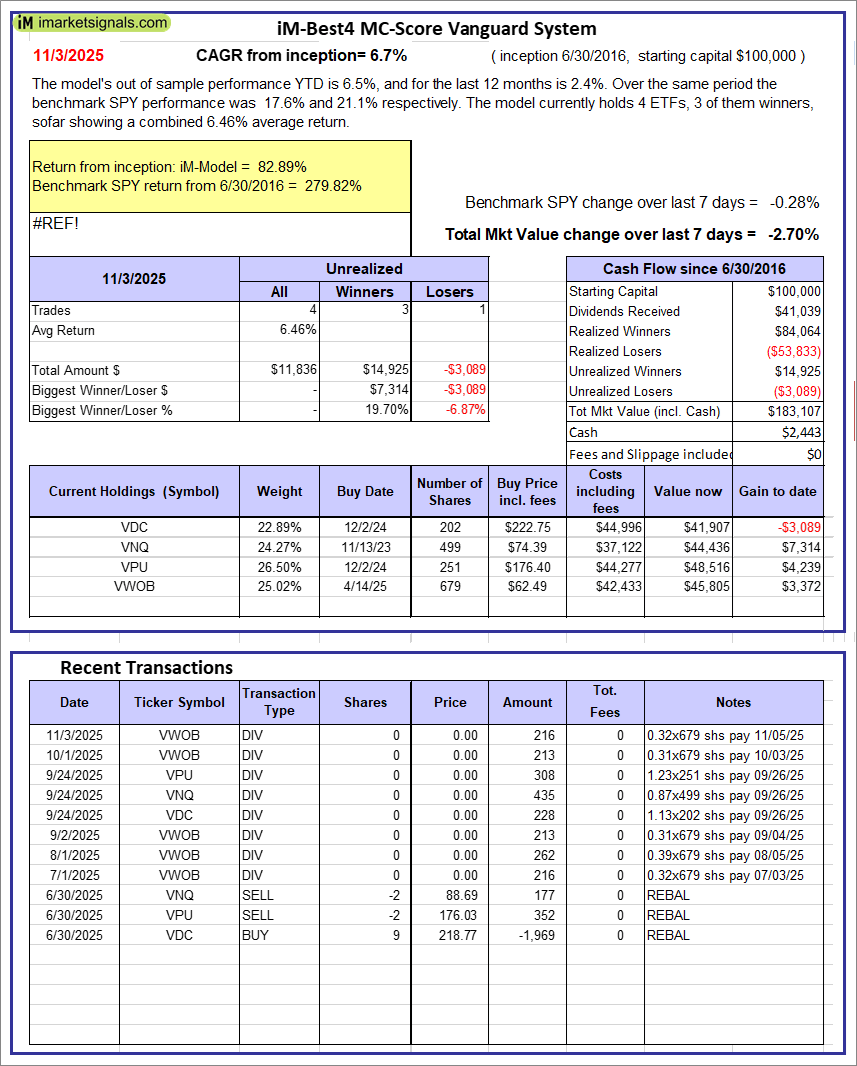 |
iM-Best4 MC-Score Vanguard System: The model’s out of sample performance YTD is 6.5%, and for the last 12 months is 2.4%. Over the same period the benchmark SPY performance was 17.6% and 21.1% respectively. Over the previous week the market value of the iM-Best4 MC-Score Vanguard System gained -2.70% at a time when SPY gained -0.28%. A starting capital of $100,000 at inception on 6/30/2016 would have grown to $183,107 which includes $2,443 cash and excludes $00 spent on fees and slippage. |
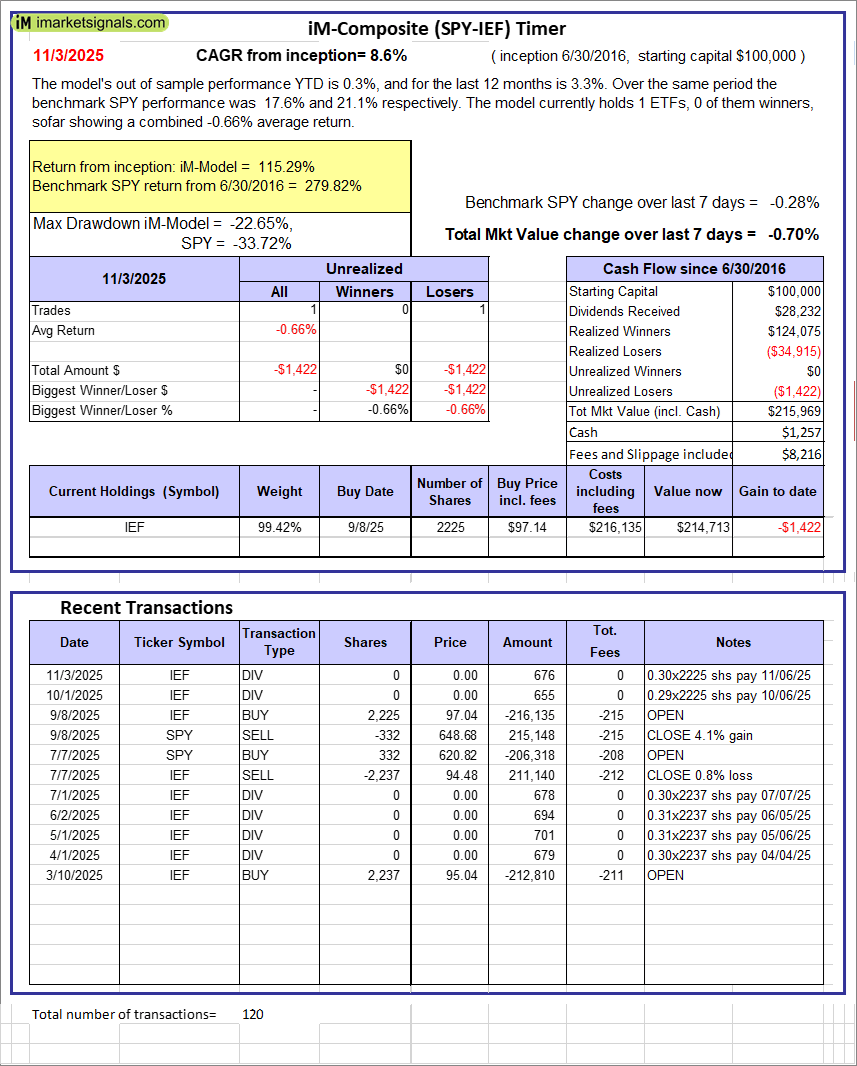 |
iM-Composite (SPY-IEF) Timer: The model’s out of sample performance YTD is 0.3%, and for the last 12 months is 3.3%. Over the same period the benchmark SPY performance was 17.6% and 21.1% respectively. Over the previous week the market value of the iM-Composite (SPY-IEF) Timer gained -0.70% at a time when SPY gained -0.28%. A starting capital of $100,000 at inception on 6/30/2016 would have grown to $215,969 which includes $1,257 cash and excludes $8,216 spent on fees and slippage. |
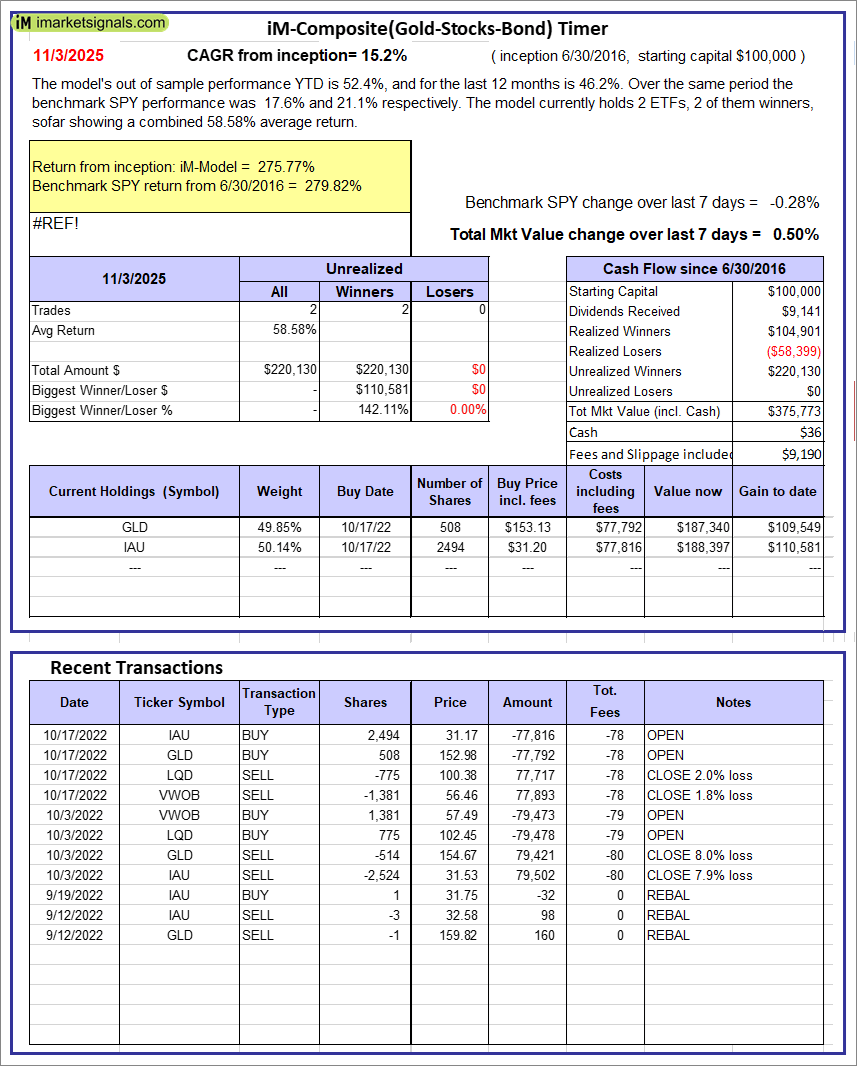 |
iM-Composite(Gold-Stocks-Bond) Timer: The model’s out of sample performance YTD is 52.4%, and for the last 12 months is 46.2%. Over the same period the benchmark SPY performance was 17.6% and 21.1% respectively. Over the previous week the market value of the iM-Composite(Gold-Stocks-Bond) Timer gained 0.50% at a time when SPY gained -0.28%. A starting capital of $100,000 at inception on 6/30/2016 would have grown to $375,773 which includes $36 cash and excludes $9,190 spent on fees and slippage. |
iM-Best Reports – 11/3/2025
Posted in pmp SPY-SH
Leave a Reply
You must be logged in to post a comment.