
  |
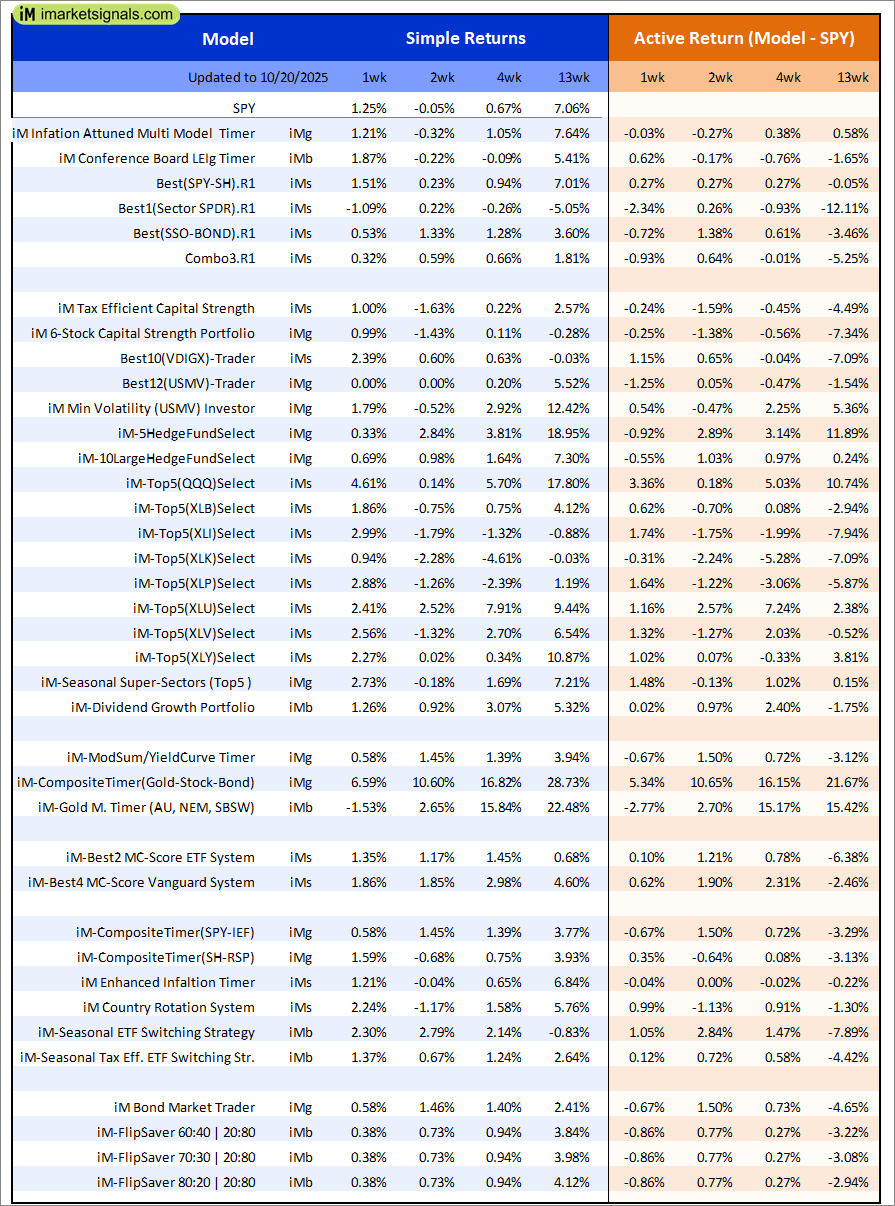
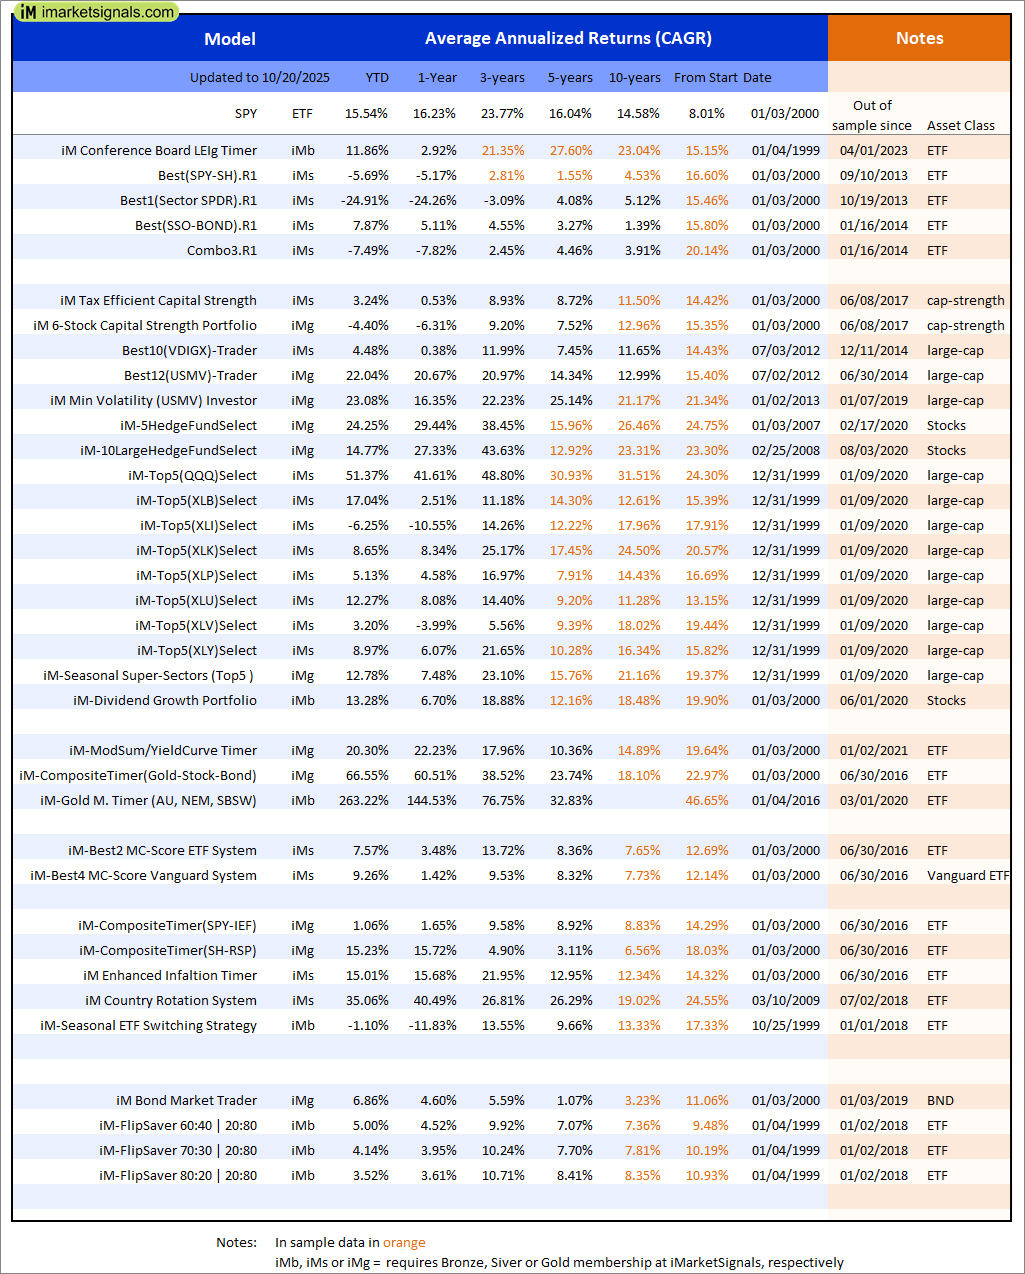
Out of sample performance summary of our models for the past 1, 2, 4 and 13 week periods. The active active return indicates how the models over- or underperformed the benchmark ETF SPY. Also the YTD, and the 1-, 3-, 5- and 10-year annualized returns are shown in the second table |
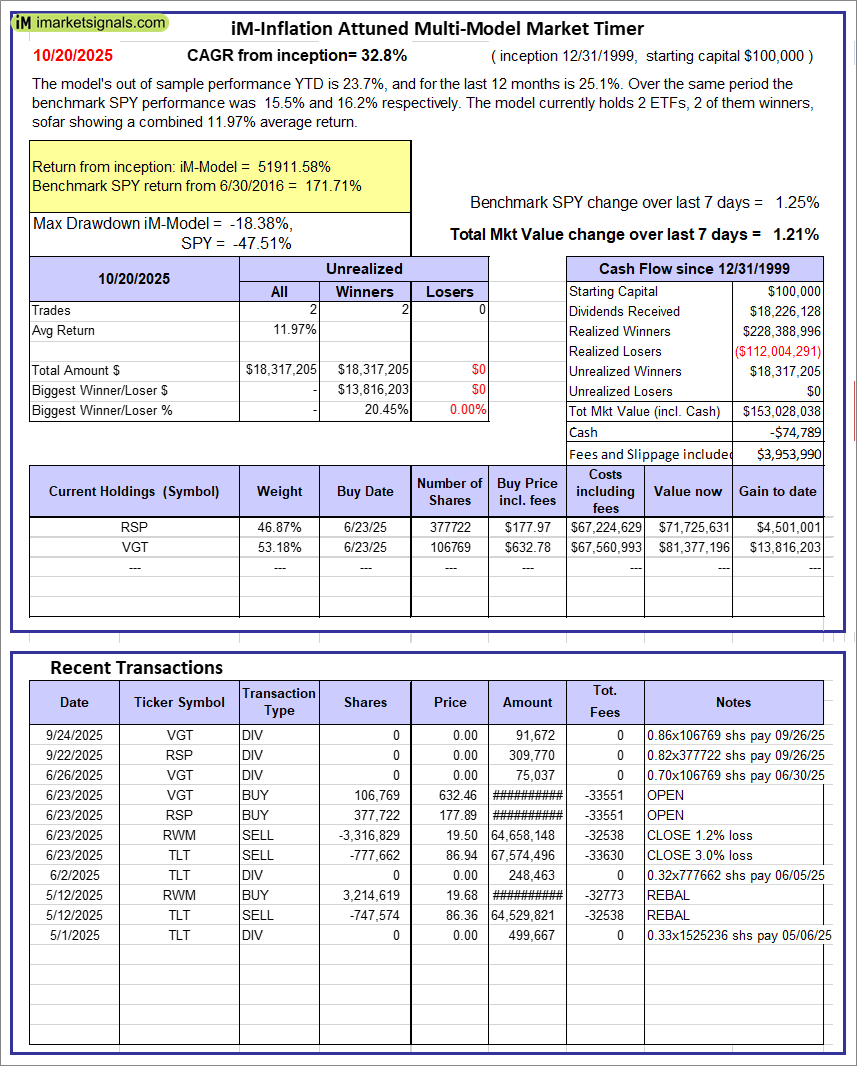 |
iM-Inflation Attuned Multi-Model Market Timer: The model’s out of sample performance YTD is 23.7%, and for the last 12 months is 25.1%. Over the same period the benchmark SPY performance was 15.5% and 16.2% respectively. Over the previous week the market value of the iM-Inflation Attuned Multi-Model Market Timer gained 1.21% at a time when SPY gained 1.25%. A starting capital of $100,000 at inception on 3/24/2017 would have grown to $153,028,038 which includes -$74,789 cash and excludes $3,953,990 spent on fees and slippage. |
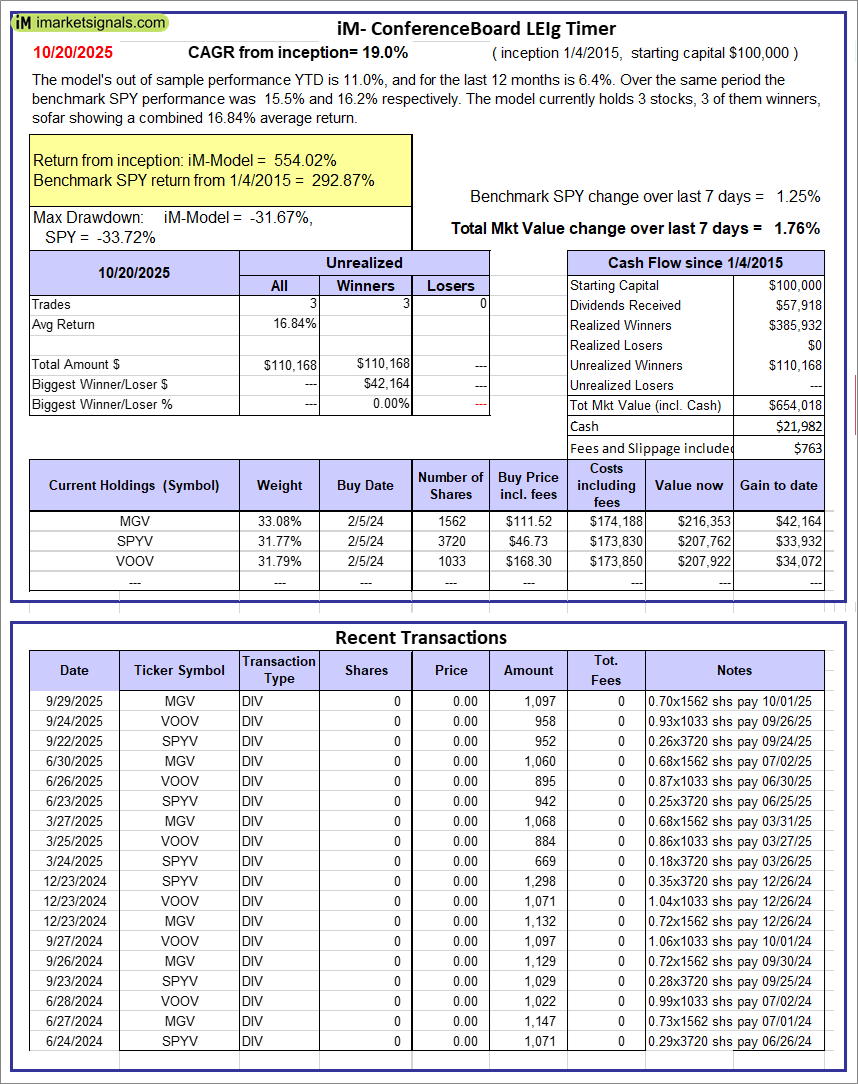 |
iM-Conference Board LEIg Timer: The model’s performance YTD is 14.3%, and for the last 12 months is 7.3%. Over the same period the benchmark SPY performance was 20.1% and 9.4% respectively. Over the previous week the market value of the iM-Conference Board LEIg Timer gained 1.76% at a time when SPY gained 1.25%. A starting capital of $100,000 at inception on 4/5/2017 would have grown to $654,018 which includes $21,982 cash and excludes $763 spent on fees and slippage. |
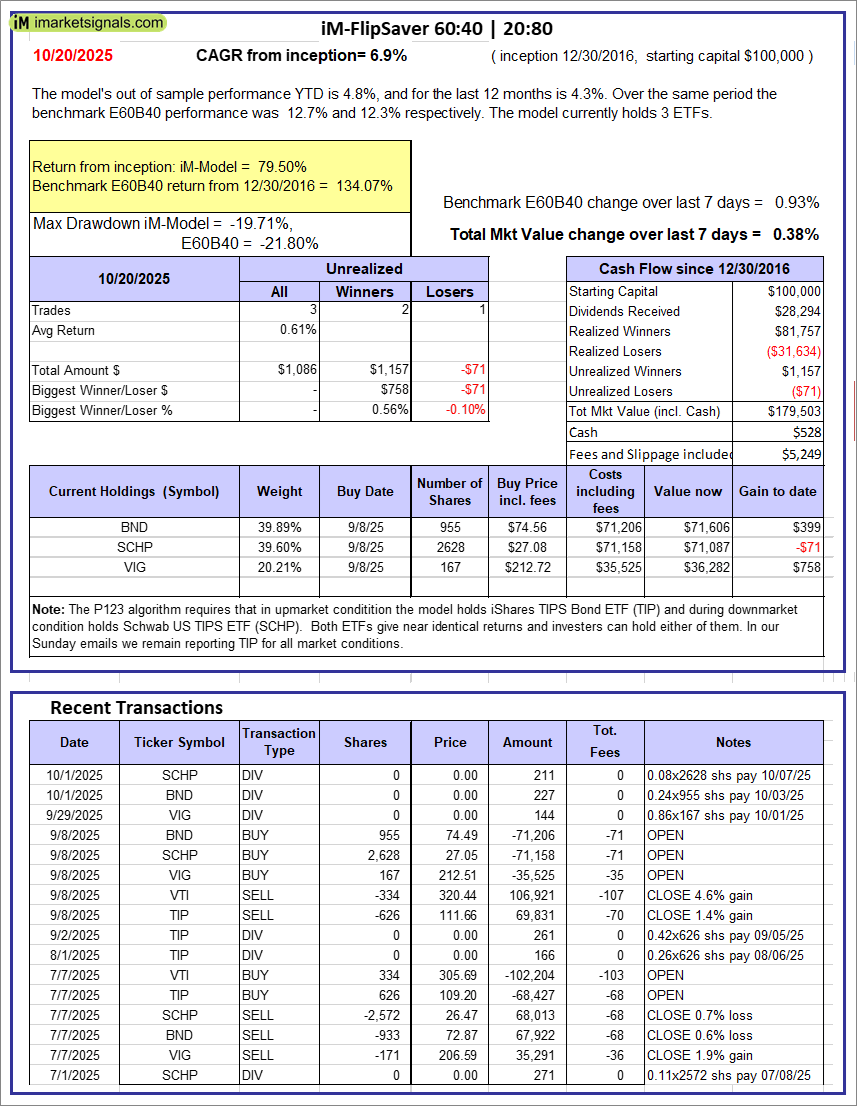 |
iM-FlipSaver 60:40 | 20:80 – 2017: The model’s out of sample performance YTD is 4.8%, and for the last 12 months is 4.3%. Over the same period the benchmark E60B40 performance was 12.7% and 12.3% respectively. Over the previous week the market value of iM-FlipSaver 80:20 | 20:80 gained 0.38% at a time when SPY gained 0.93%. A starting capital of $100,000 at inception on 7/16/2015 would have grown to $179,503 which includes $528 cash and excludes $5,249 spent on fees and slippage. |
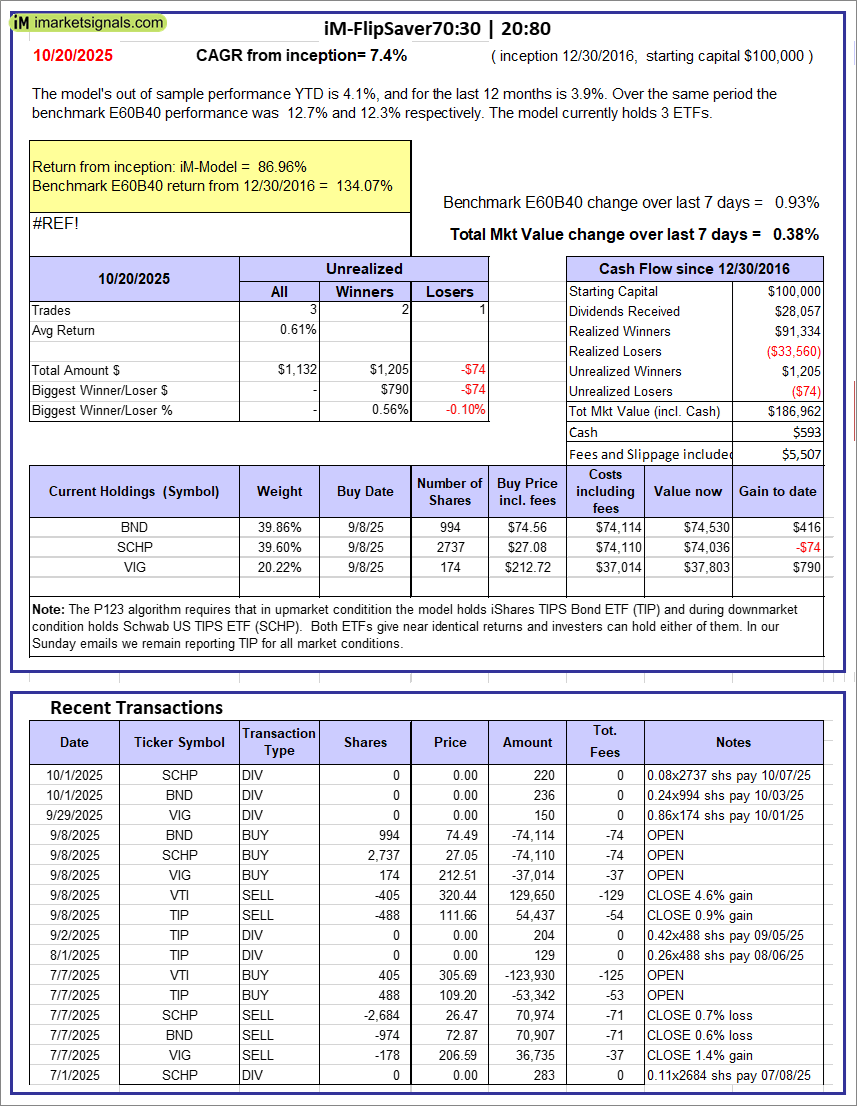 |
iM-FlipSaver 70:30 | 20:80 – 2017: The model’s out of sample performance YTD is 4.1%, and for the last 12 months is 3.9%. Over the same period the benchmark E60B40 performance was 12.7% and 12.3% respectively. Over the previous week the market value of iM-FlipSaver 70:30 | 20:80 gained 0.38% at a time when SPY gained 0.93%. A starting capital of $100,000 at inception on 7/15/2015 would have grown to $186,962 which includes $593 cash and excludes $5,507 spent on fees and slippage. |
 |
iM-FlipSaver 80:20 | 20:80 – 2017: The model’s out of sample performance YTD is 3.5%, and for the last 12 months is 3.6%. Over the same period the benchmark E60B40 performance was 12.7% and 12.3% respectively. Over the previous week the market value of iM-FlipSaver 80:20 | 20:80 gained 0.38% at a time when SPY gained 0.93%. A starting capital of $100,000 at inception on 1/2/2017 would have grown to $194,334 which includes $625 cash and excludes $5,756 spent on fees and slippage. |
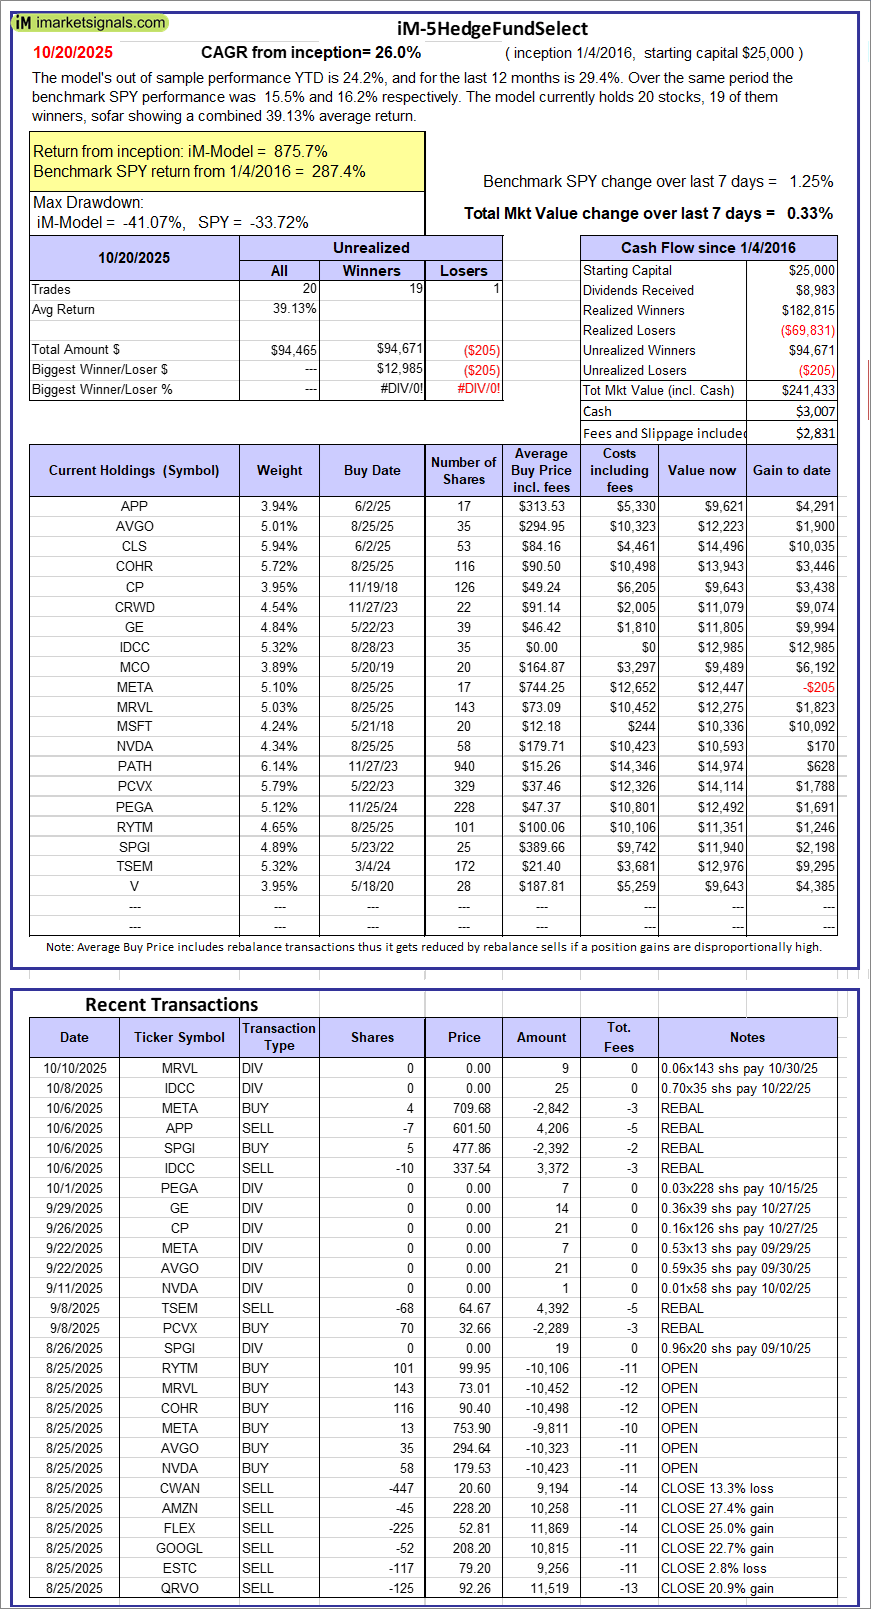 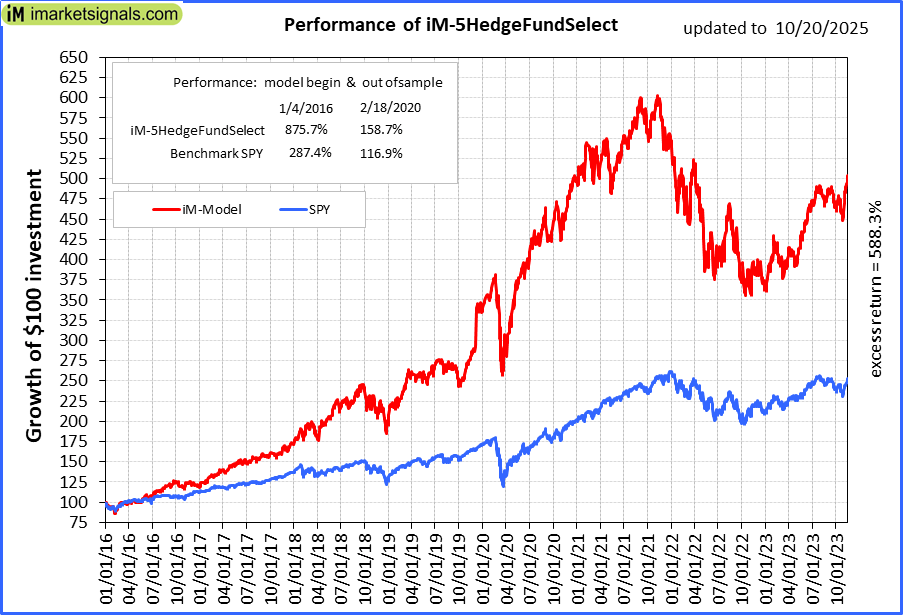 |
iM-5HedgeFundSelect: Since inception, on 1/5/2016, the model gained 875.71% while the benchmark SPY gained 287.37% over the same period. Over the previous week the market value of iM-5HedgeFundSelect gained 0.33% at a time when SPY gained 1.25%. A starting capital of $25,000 at inception on 1/5/2016 would have grown to $241,433 which includes $3,007 cash and excludes $2,831 spent on fees and slippage. |
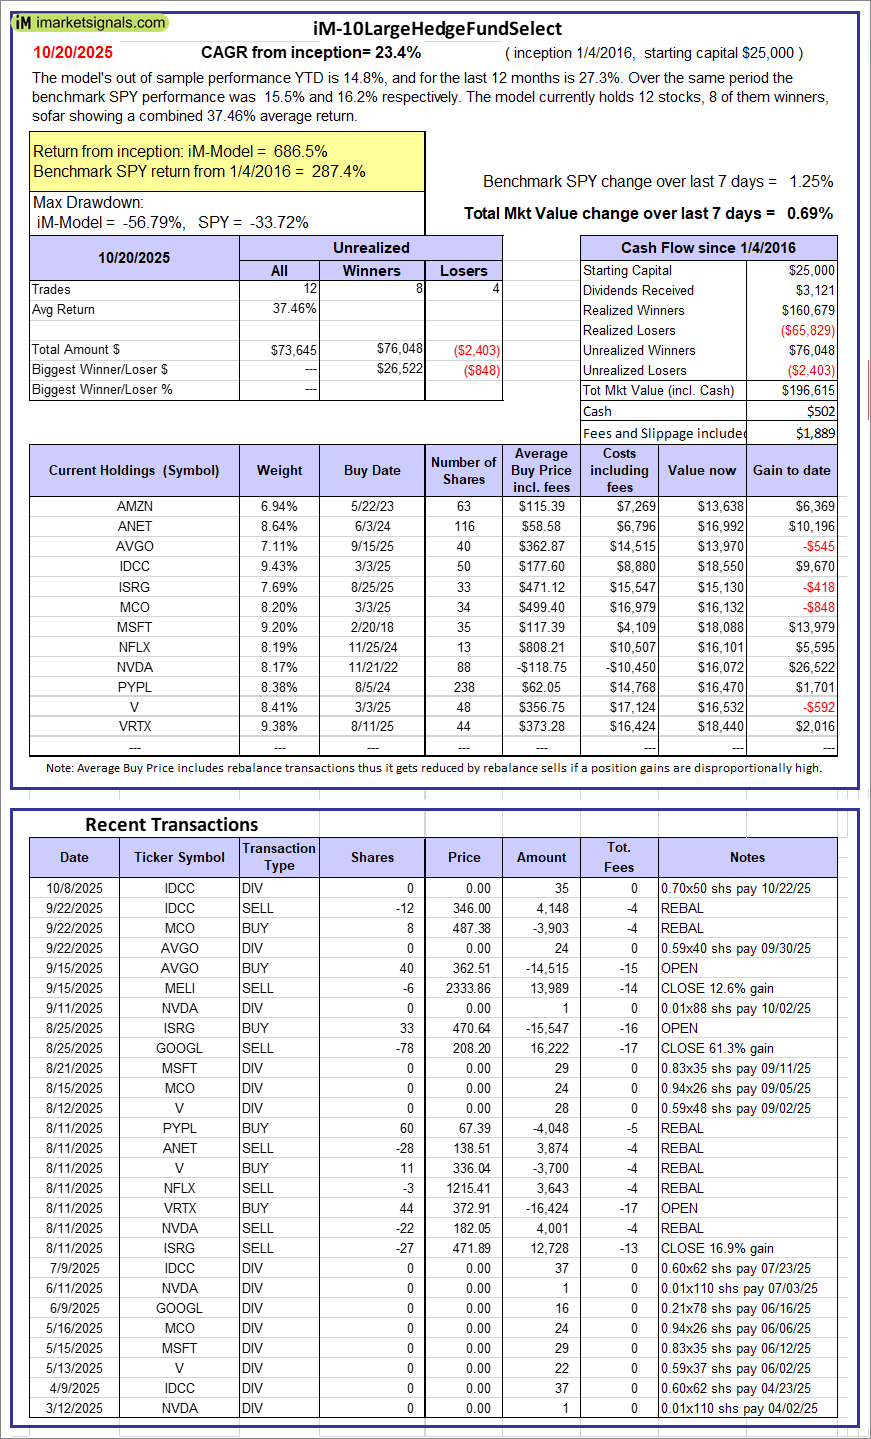 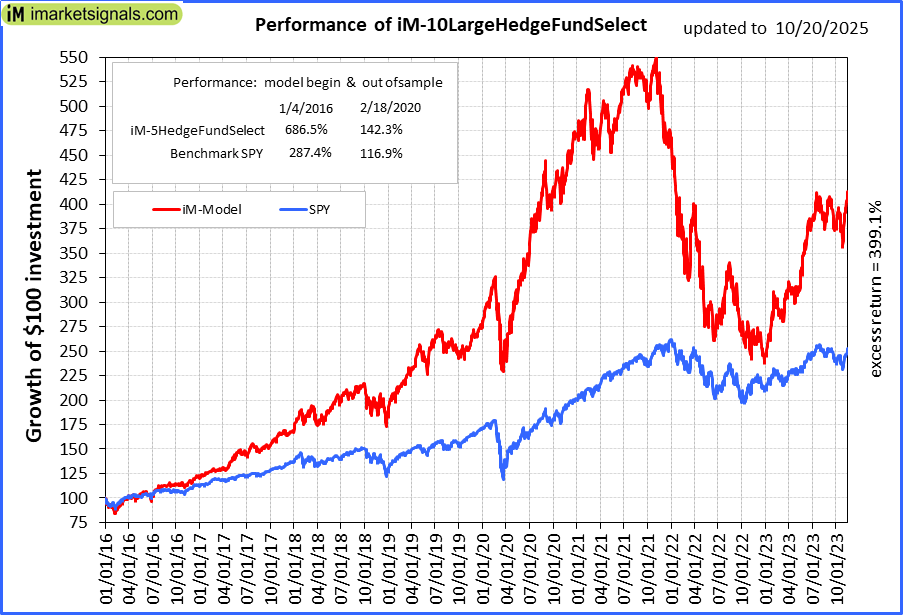 |
iM-10LargeHedgeFundSelect: Since inception, on 1/5/2016, the model gained 686.46% while the benchmark SPY gained 287.37% over the same period. Over the previous week the market value of iM-10LargeHedgeFundSelect gained 0.69% at a time when SPY gained 1.25%. A starting capital of $25,000 at inception on 1/5/2016 would have grown to $196,615 which includes $502 cash and excludes $1,889 spent on fees and slippage. |
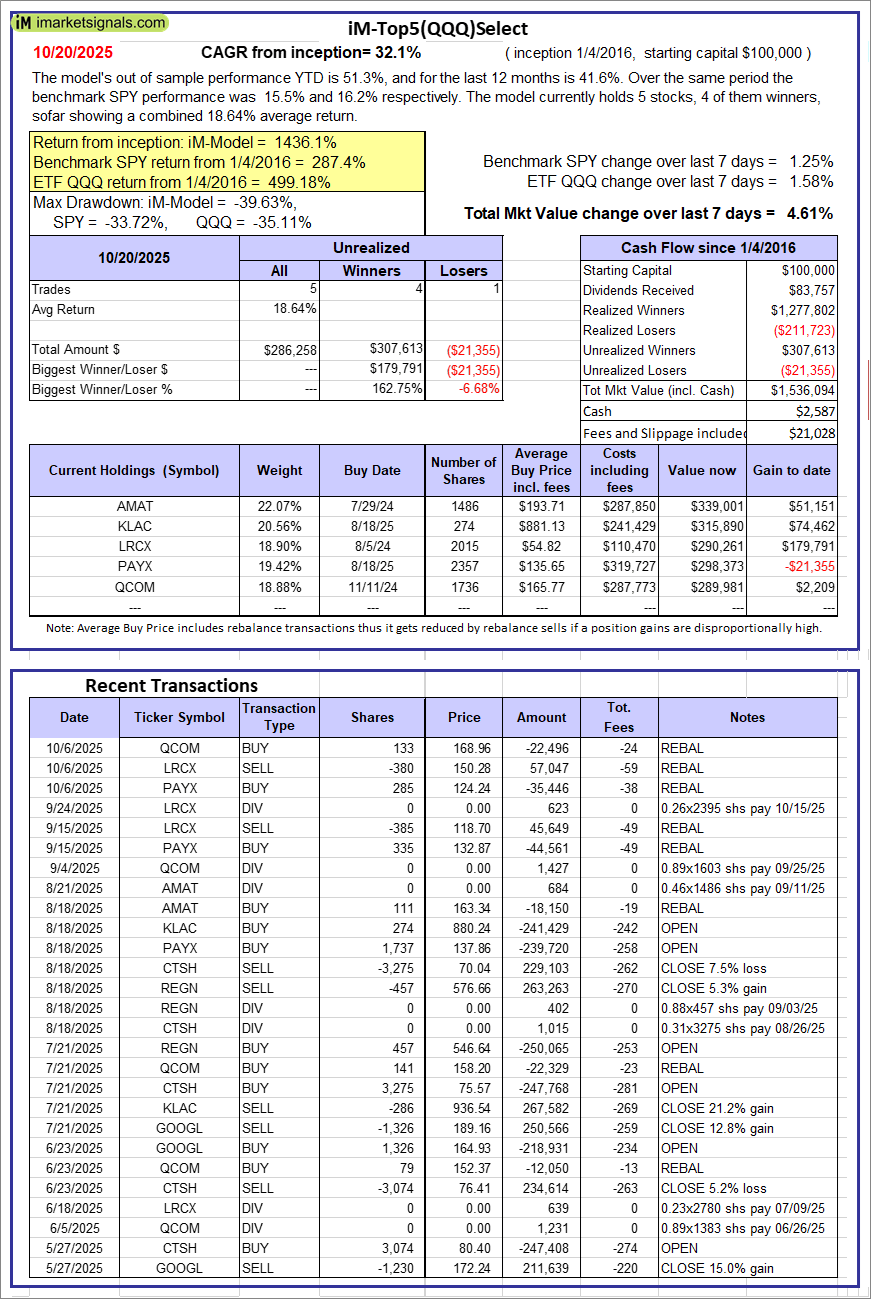 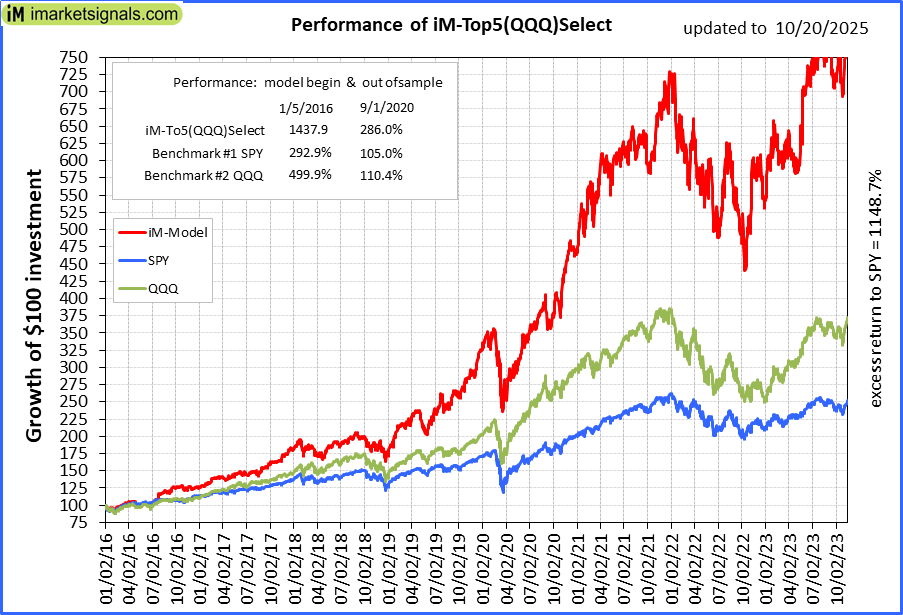 |
iM-Top5(QQQ)Select: Since inception, on 1/5/2016, the model gained 1436.09% while the benchmark SPY gained 287.37% over the same period. Over the previous week the market value of iM-Top5(QQQ)Select gained 4.61% at a time when SPY gained 1.25%. A starting capital of $100,000 at inception on 1/5/2016 would have grown to $1,536,094 which includes $2,587 cash and excludes $21,028 spent on fees and slippage. |
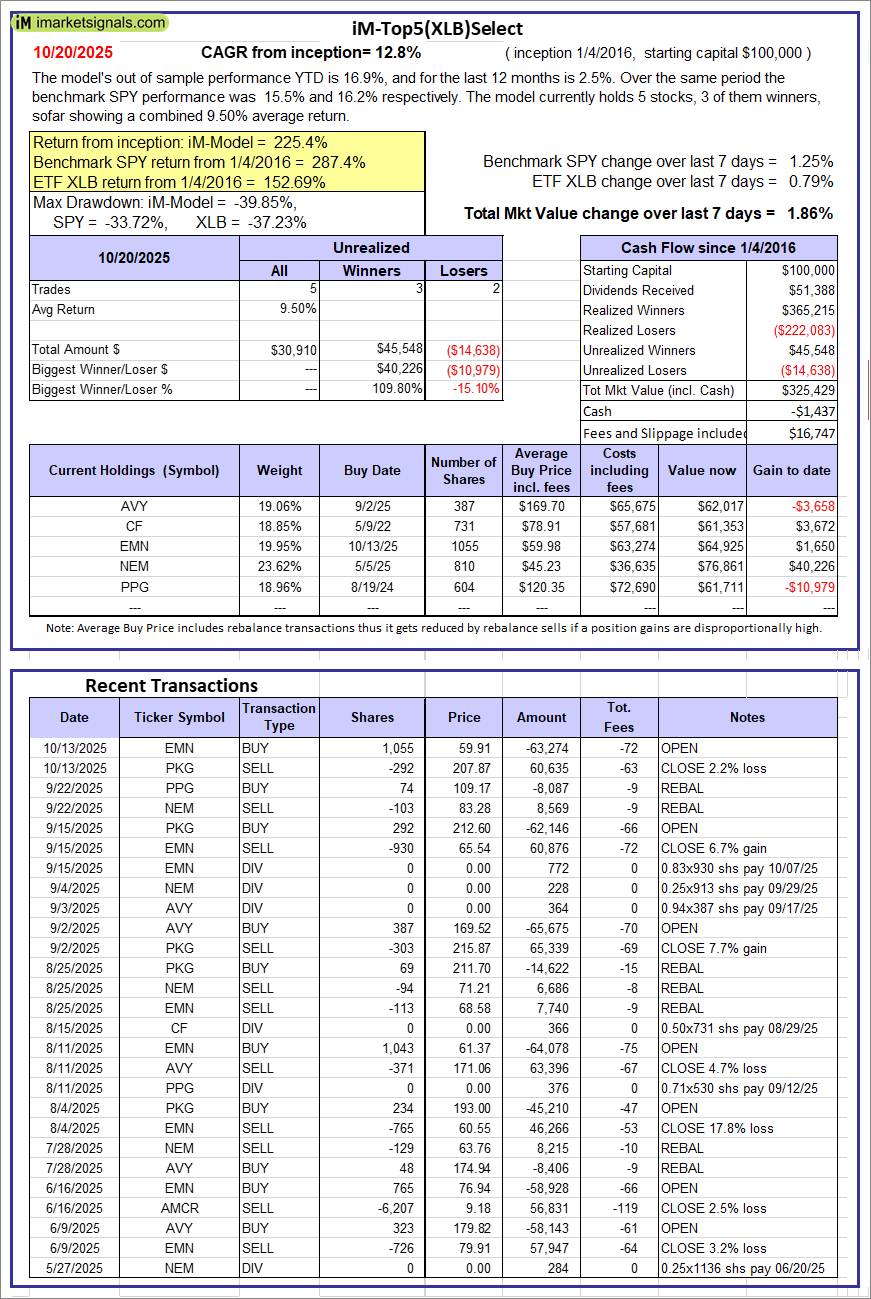 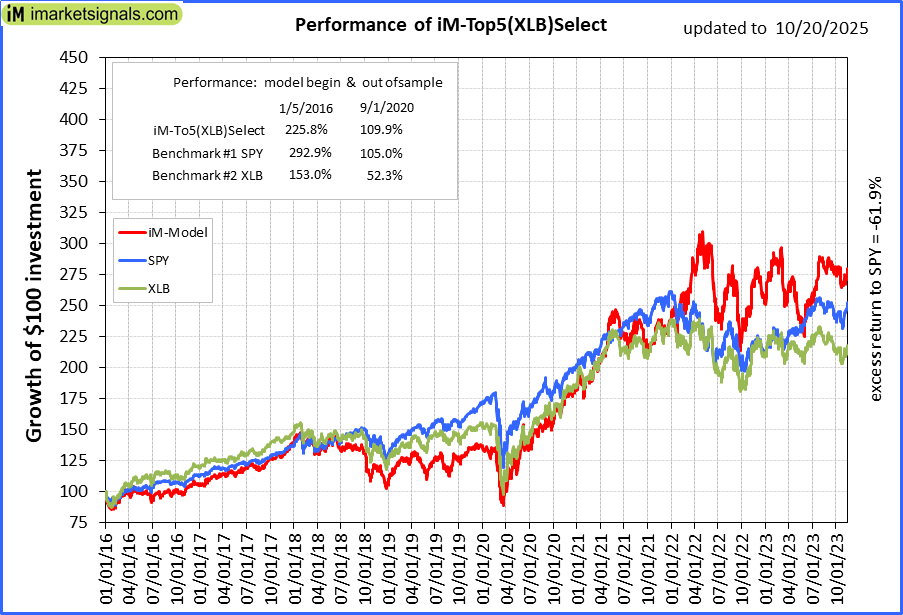 |
iM-Top5(XLB)Select: Since inception, on 1/5/2016, the model gained 225.43% while the benchmark SPY gained 287.37% over the same period. Over the previous week the market value of iM-Top5(XLB)Select gained 1.86% at a time when SPY gained 1.25%. A starting capital of $100,000 at inception on 1/5/2016 would have grown to $325,429 which includes -$1,437 cash and excludes $16,747 spent on fees and slippage. |
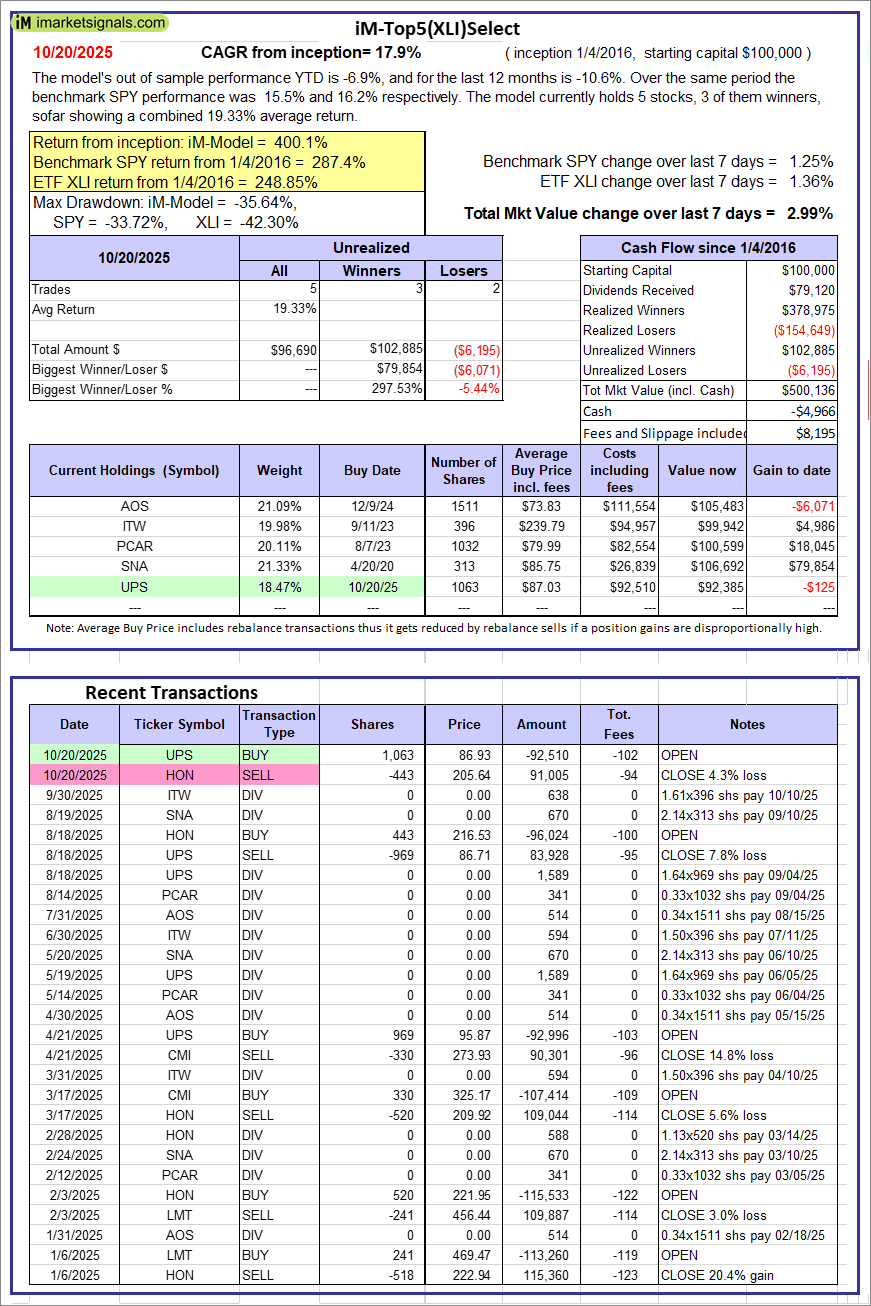 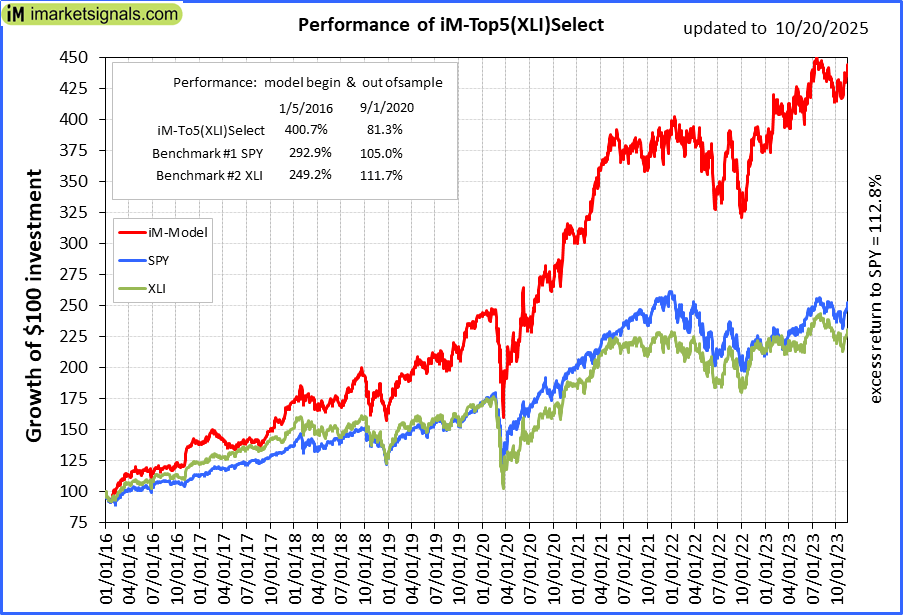 |
iM-Top5(XLI)Select: Since inception, on 1/5/2016, the model gained 400.14% while the benchmark SPY gained 287.37% over the same period. Over the previous week the market value of iM-Top5(XLI)Select gained 2.99% at a time when SPY gained 1.25%. A starting capital of $100,000 at inception on 1/5/2016 would have grown to $500,136 which includes -$4,966 cash and excludes $8,195 spent on fees and slippage. |
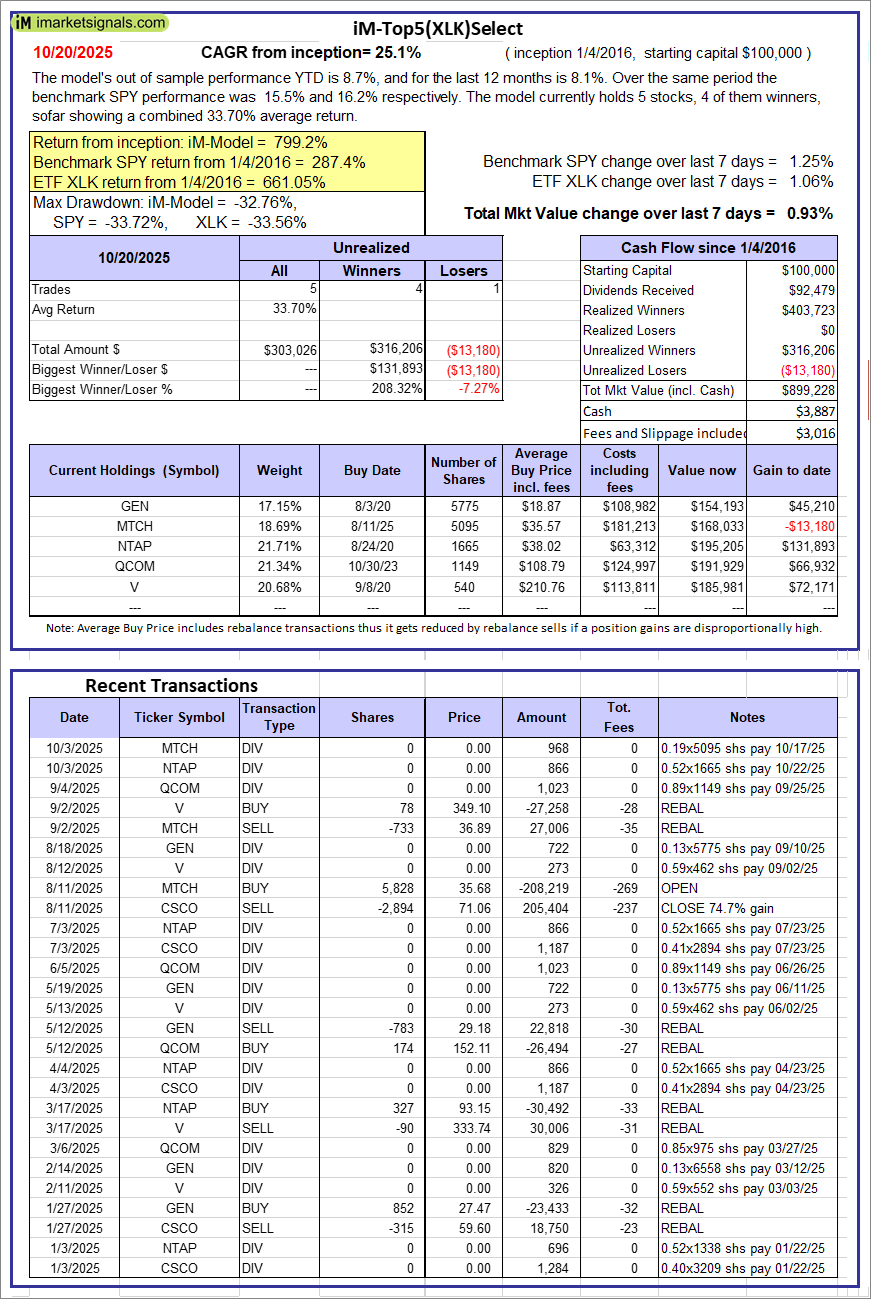 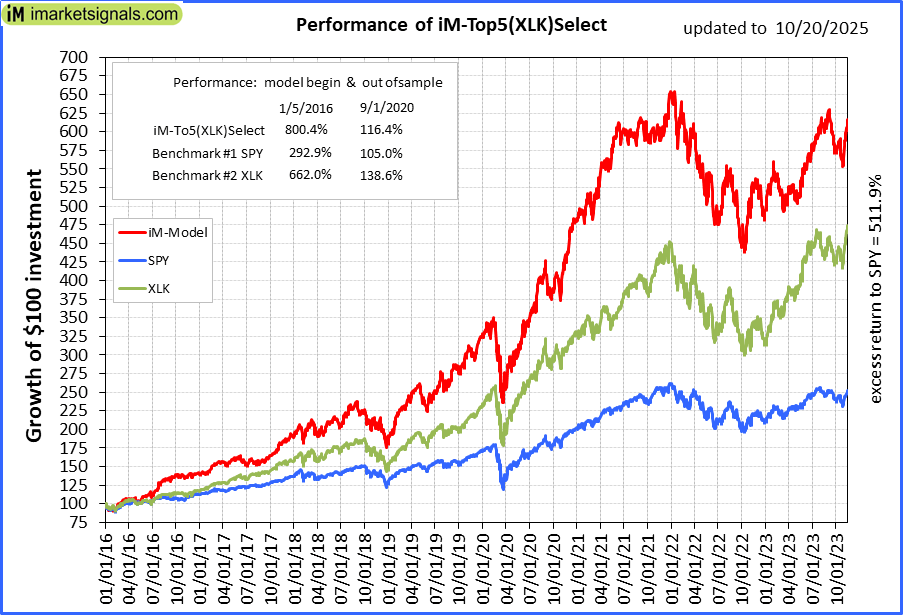 |
iM-Top5(XLK)Select: Since inception, on 1/5/2016, the model gained 799.23% while the benchmark SPY gained 287.37% over the same period. Over the previous week the market value of iM-Top5(XLK)Select gained 0.93% at a time when SPY gained 1.25%. A starting capital of $100,000 at inception on 1/5/2016 would have grown to $899,228 which includes $3,887 cash and excludes $3,016 spent on fees and slippage. |
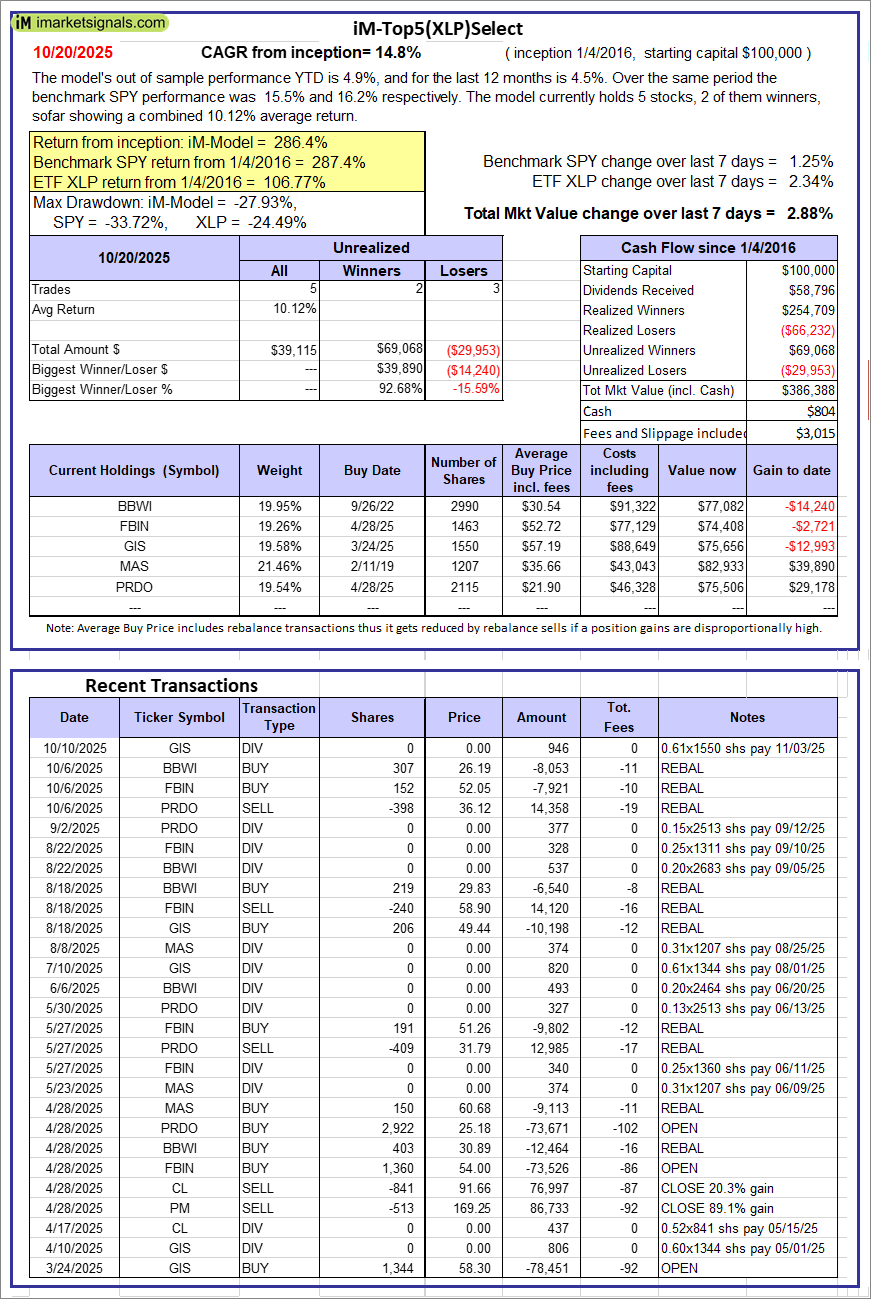 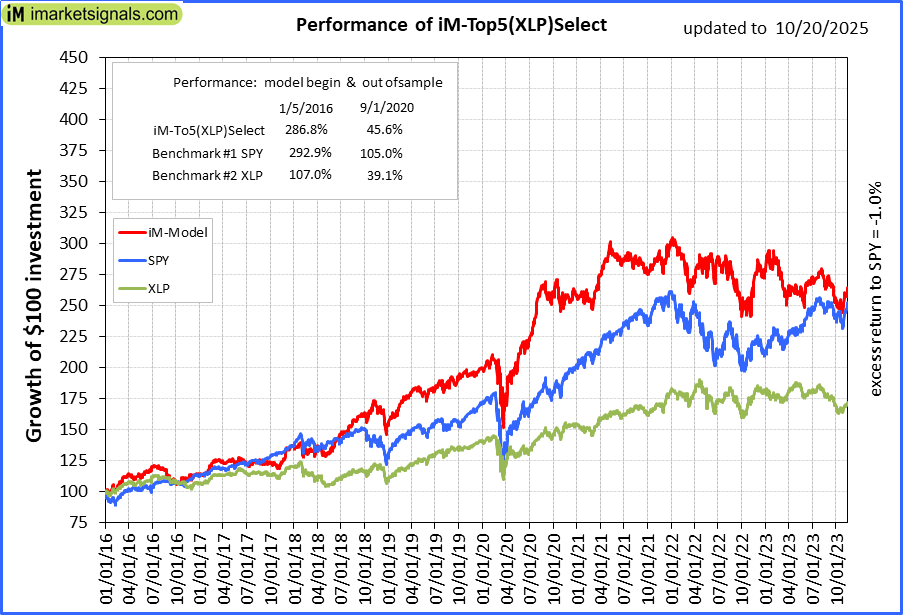 |
iM-Top5(XLP)Select: Since inception, on 1/5/2016, the model gained 286.39% while the benchmark SPY gained 287.37% over the same period. Over the previous week the market value of iM-Top5(XLP)Select gained 2.88% at a time when SPY gained 1.25%. A starting capital of $100,000 at inception on 1/5/2016 would have grown to $386,388 which includes $804 cash and excludes $3,015 spent on fees and slippage. |
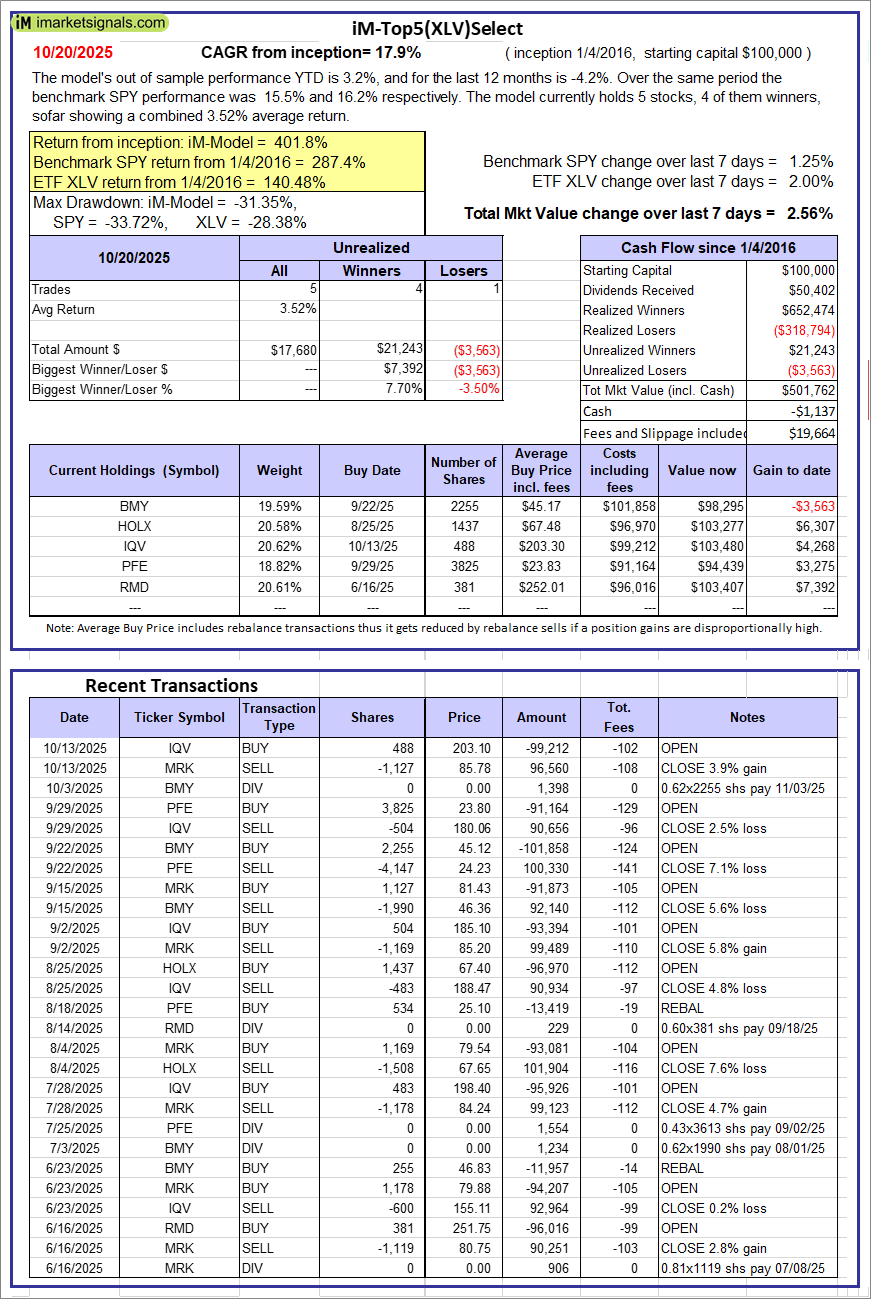 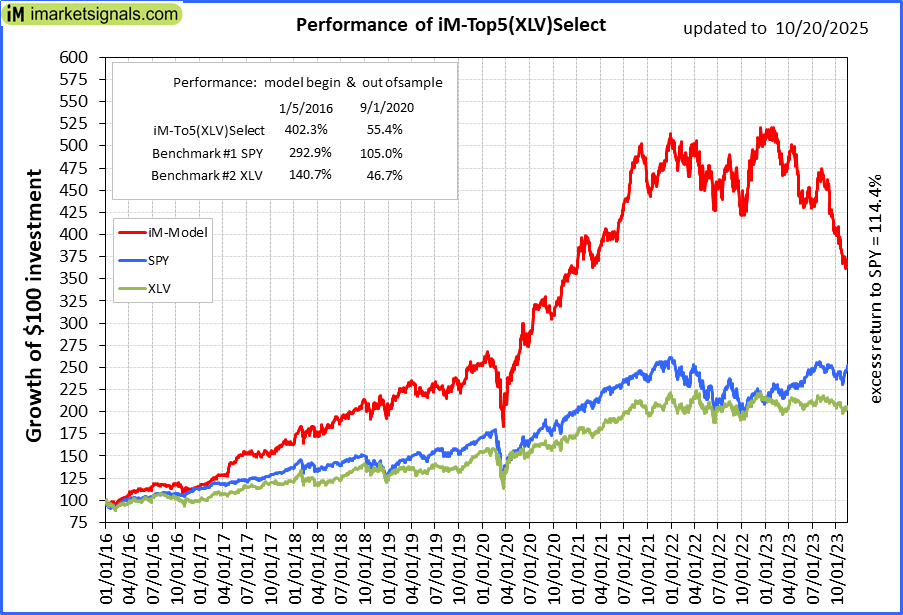 |
iM-Top5(XLV)Select: Since inception, on 1/5/2016, the model gained 401.76% while the benchmark SPY gained 287.37% over the same period. Over the previous week the market value of iM-Top5(XLV)Select gained 2.56% at a time when SPY gained 1.25%. A starting capital of $100,000 at inception on 1/5/2016 would have grown to $501,762 which includes -$1,137 cash and excludes $19,664 spent on fees and slippage. |
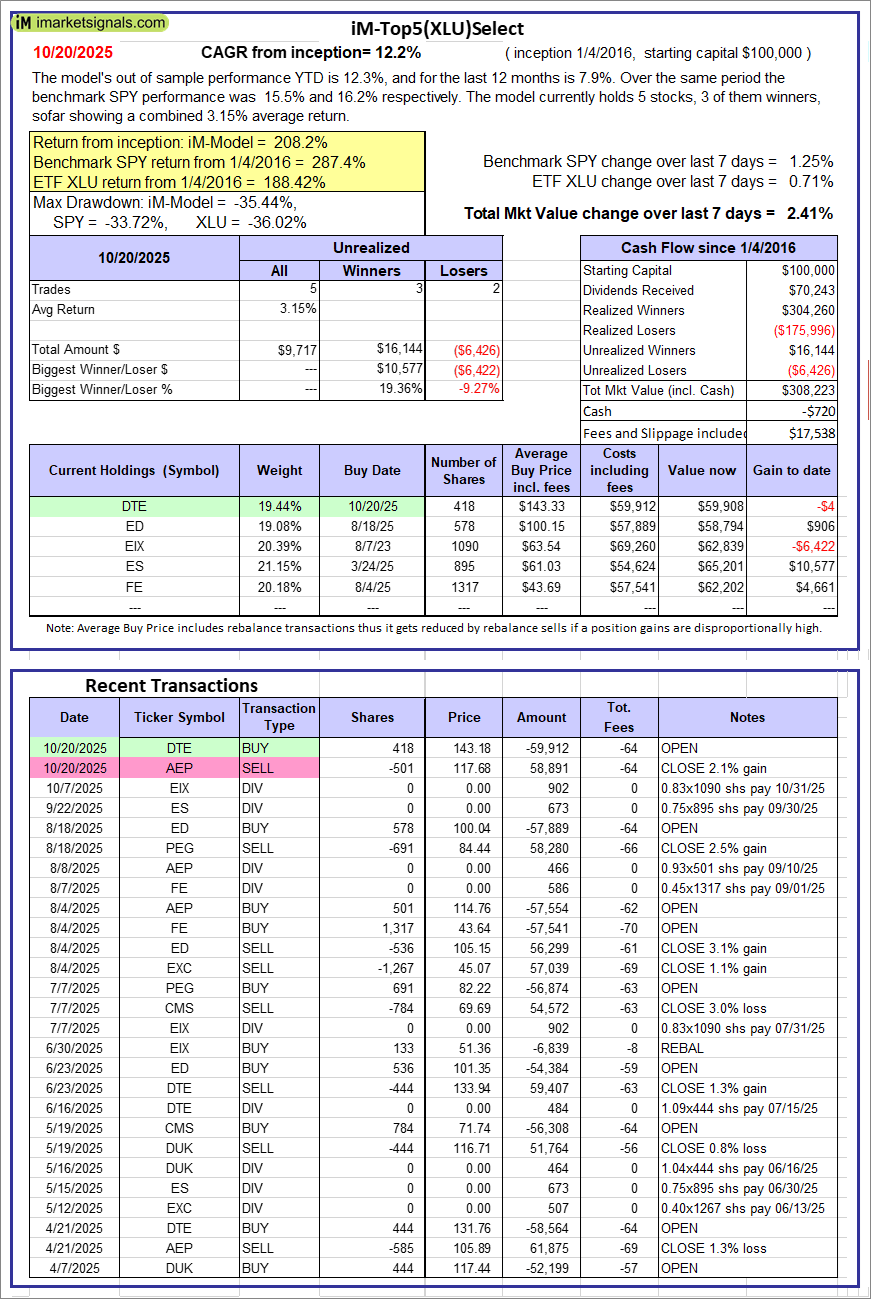 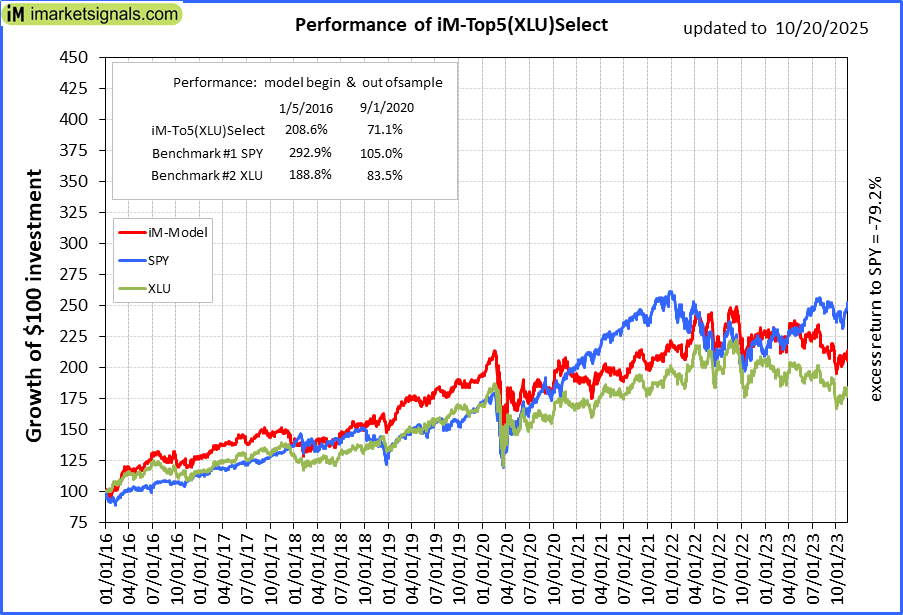 |
iM-Top5(XLU)Select: Since inception, on 1/5/2016, the model gained 208.22% while the benchmark SPY gained 287.37% over the same period. Over the previous week the market value of iM-Top5(XLU)Select gained 2.41% at a time when SPY gained 1.25%. A starting capital of $100,000 at inception on 1/5/2016 would have grown to $308,223 which includes -$720 cash and excludes $17,538 spent on fees and slippage. |
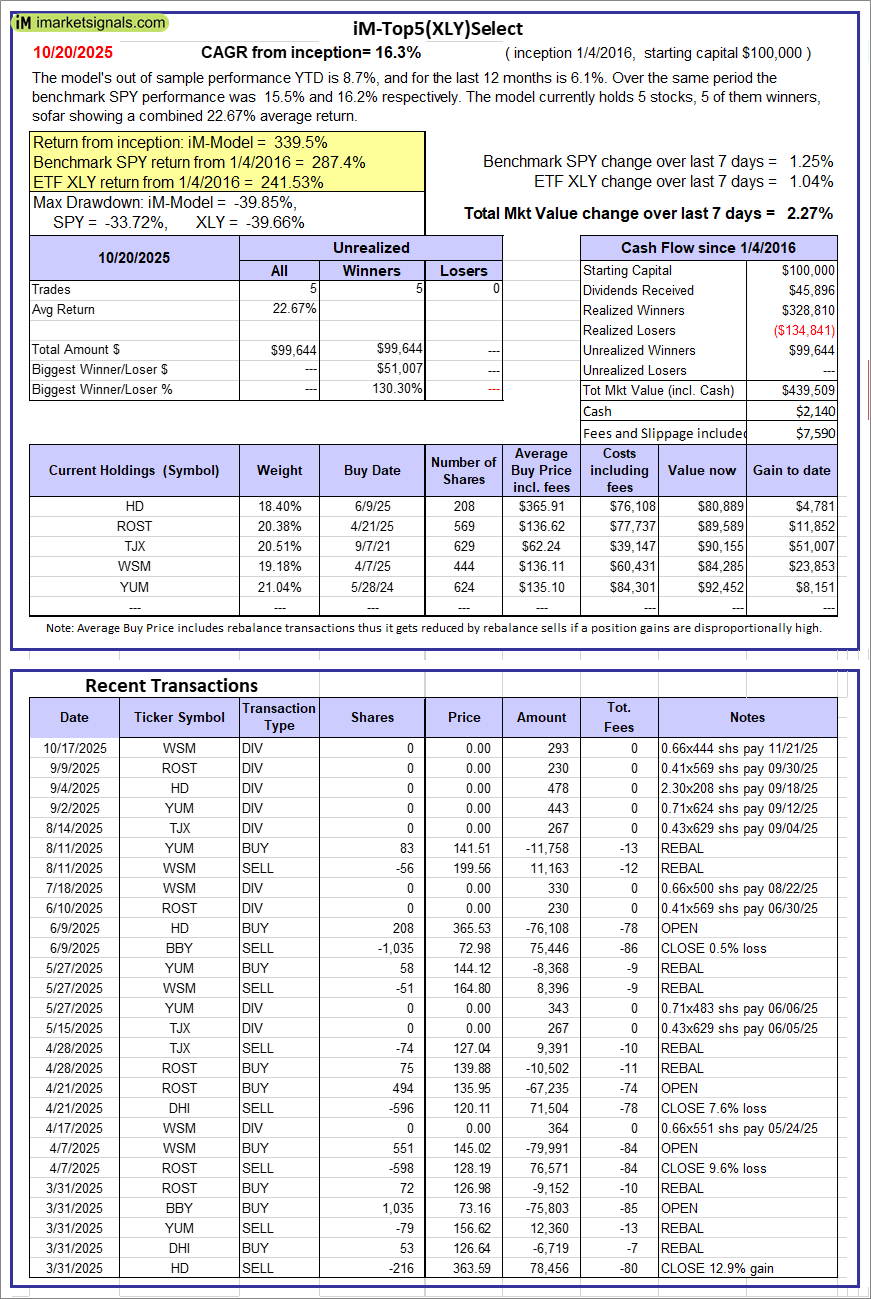 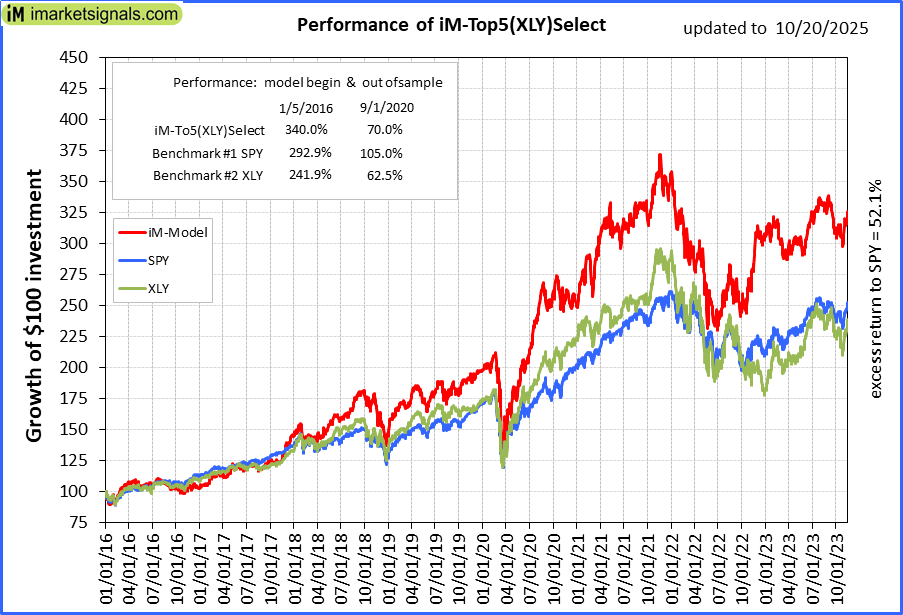 |
iM-Top5(XLY)Select: Since inception, on 1/5/2016, the model gained 339.51% while the benchmark SPY gained 287.37% over the same period. Over the previous week the market value of iM-Top5(XLY)Select gained 2.27% at a time when SPY gained 1.25%. A starting capital of $100,000 at inception on 1/5/2016 would have grown to $439,509 which includes $2,140 cash and excludes $7,590 spent on fees and slippage. |
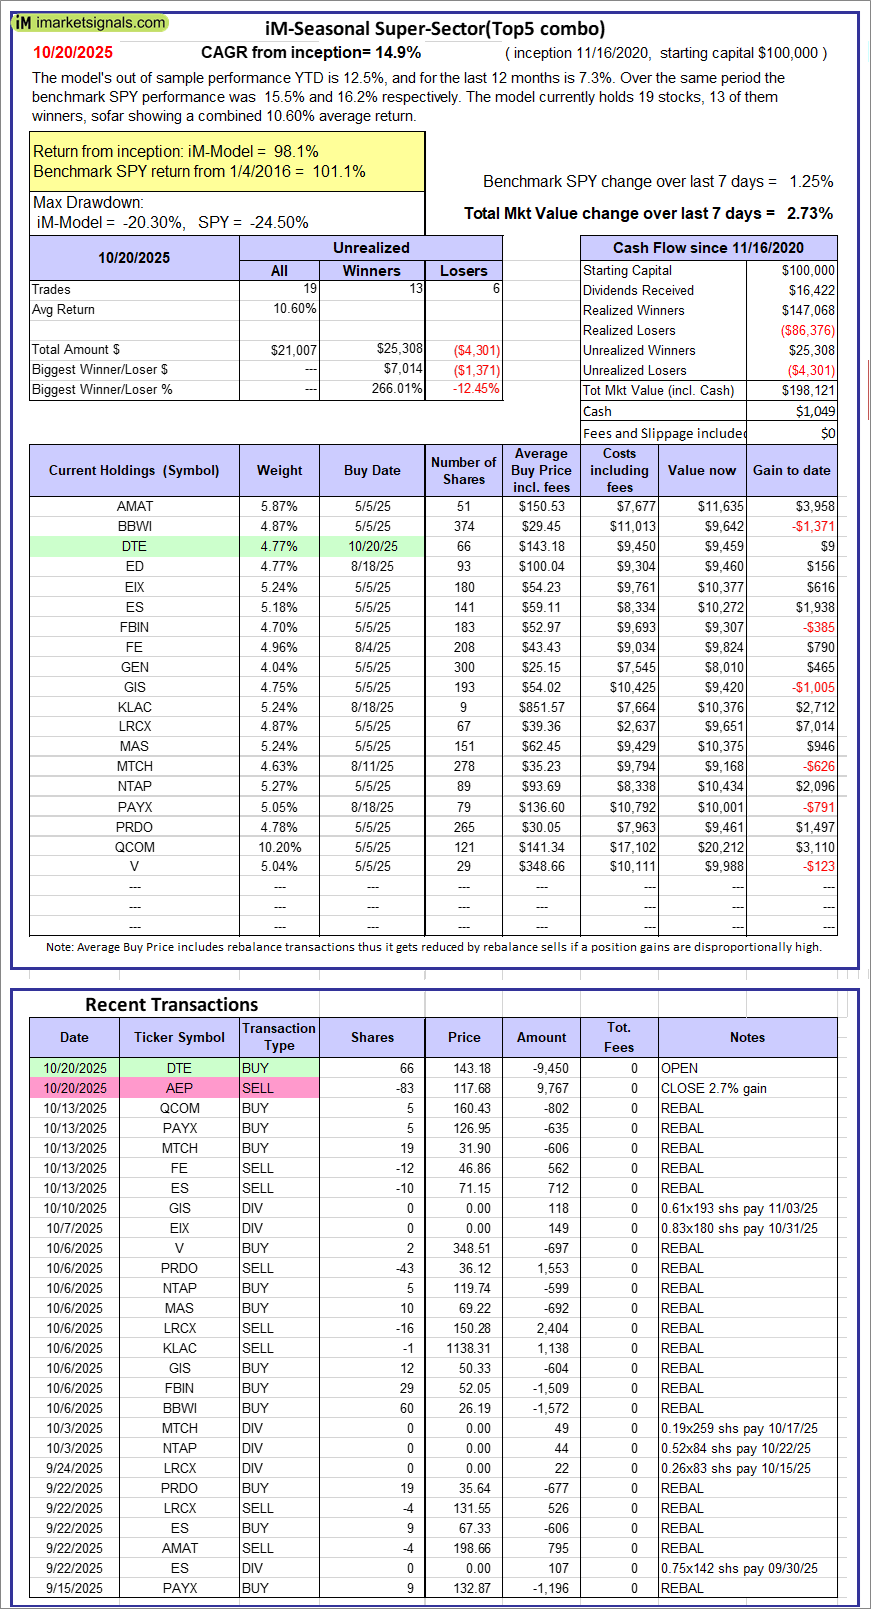 |
iM-Seasonal Super-Sectors (Top5 combo) : Since inception, on 11/17/2020, the model gained 98.12% while the benchmark SPY gained 101.08% over the same period. Over the previous week the market value of iM-Seasonal Super-Sectors (Top5 combo) gained 2.73% at a time when SPY gained 1.25%. A starting capital of $100,000 at inception on 11/17/2020 would have grown to $198,121 which includes $1,049 cash and excludes $00 spent on fees and slippage. |
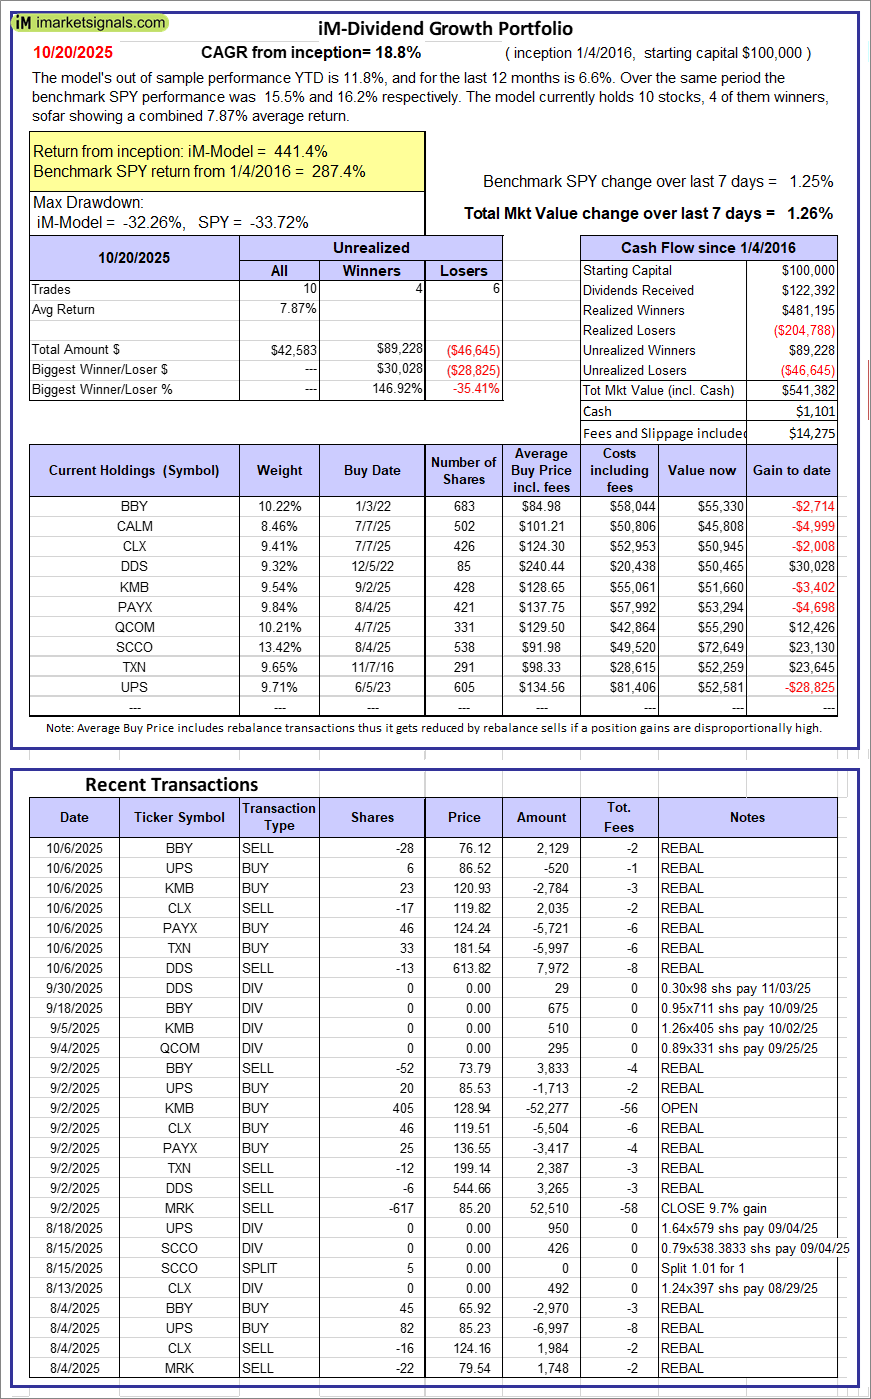 |
iM-Dividend Growth Portfolio: The model’s out of sample performance YTD is 11.8%, and for the last 12 months is 6.6%. Over the same period the benchmark SPY performance was 15.5% and 16.2% respectively. Over the previous week the market value of the iM-Dividend Growth Portfolio gained 1.26% at a time when SPY gained 1.25%. A starting capital of $100,000 at inception on 6/30/2016 would have grown to $541,382 which includes $1,101 cash and excludes $14,275 spent on fees and slippage. |
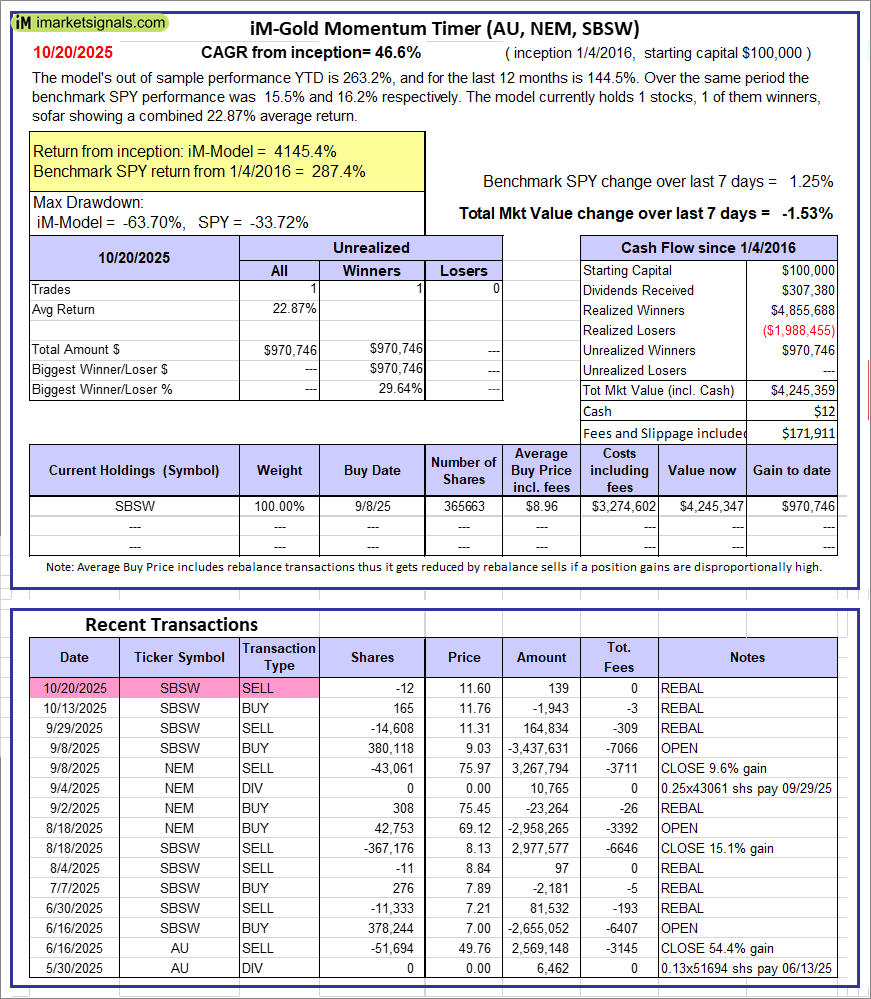 |
iM-Gold Momentum Timer (AU, NEM, SBSW): The model’s out of sample performance YTD is 263.2%, and for the last 12 months is 144.5%. Over the same period the benchmark SPY performance was 15.5% and 16.2% respectively. Over the previous week the market value of iM-Gold Momentum Timer (AU, NEM, SBSW) gained -1.53% at a time when SPY gained 1.25%. A starting capital of $100,000 at inception on 6/30/2016 would have grown to $12 which includes $171,911 cash and excludes Gain to date spent on fees and slippage. |
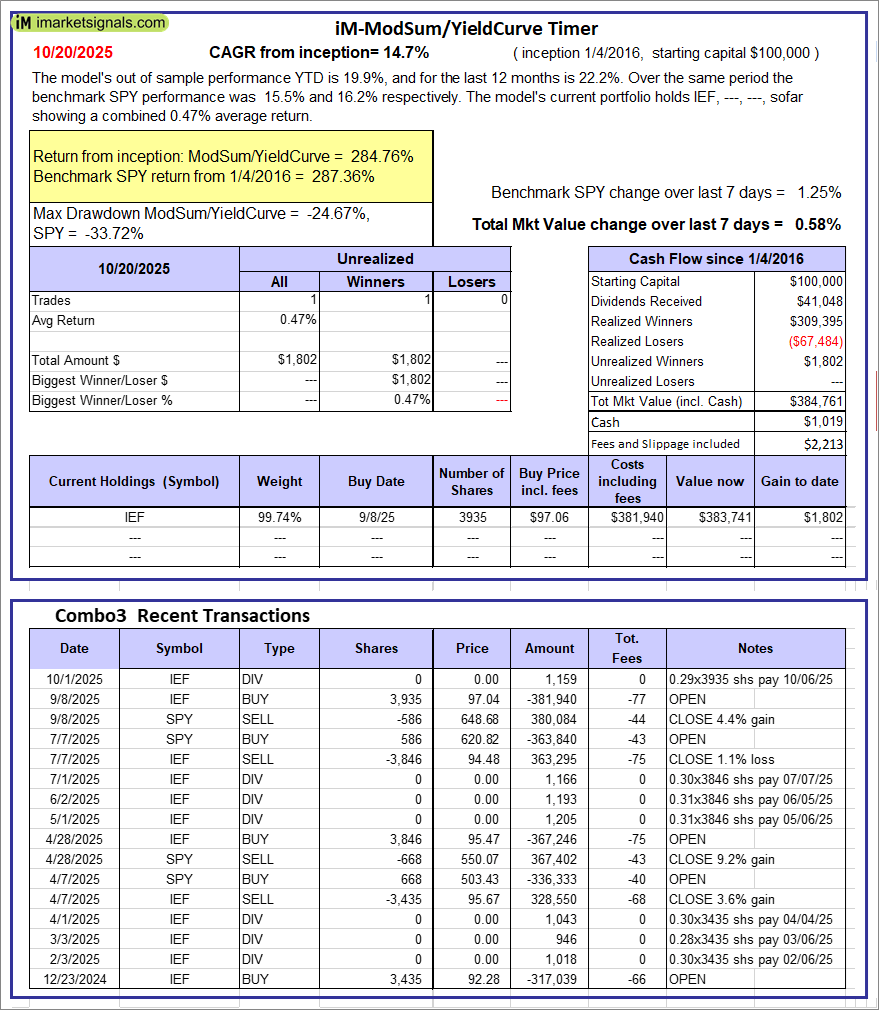 |
iM-ModSum/YieldCurve Timer: The model’s out of sample performance YTD is 19.9%, and for the last 12 months is 22.2%. Over the same period the benchmark SPY performance was 15.5% and 16.2% respectively. Over the previous week the market value of iM-PortSum/YieldCurve Timer gained 0.58% at a time when SPY gained 1.25%. A starting capital of $100,000 at inception on 1/1/2016 would have grown to $384,761 which includes $1,019 cash and excludes $2,213 spent on fees and slippage. |
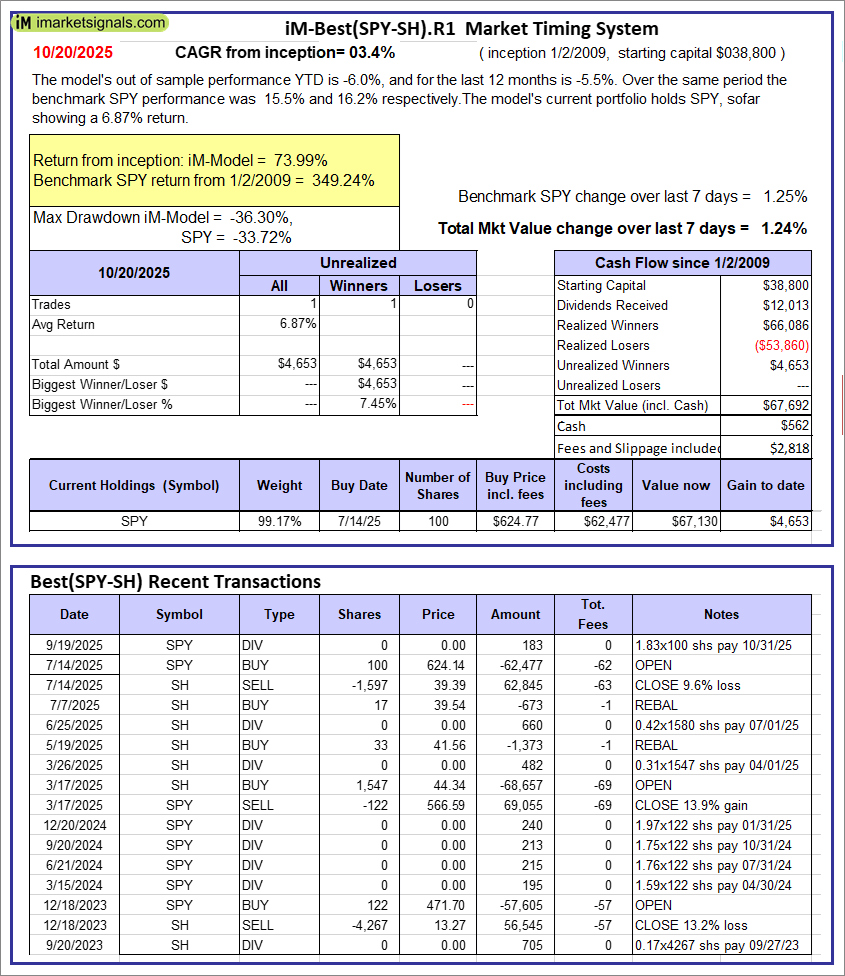 |
iM-Best(SPY-SH).R1: The model’s out of sample performance YTD is -6.0%, and for the last 12 months is -5.5%. Over the same period the benchmark SPY performance was 15.5% and 16.2% respectively. Over the previous week the market value of Best(SPY-SH) gained 1.24% at a time when SPY gained 1.25%. A starting capital of $100,000 at inception on 1/2/2009 would have grown to $67,692 which includes $562 cash and excludes $2,818 spent on fees and slippage. |
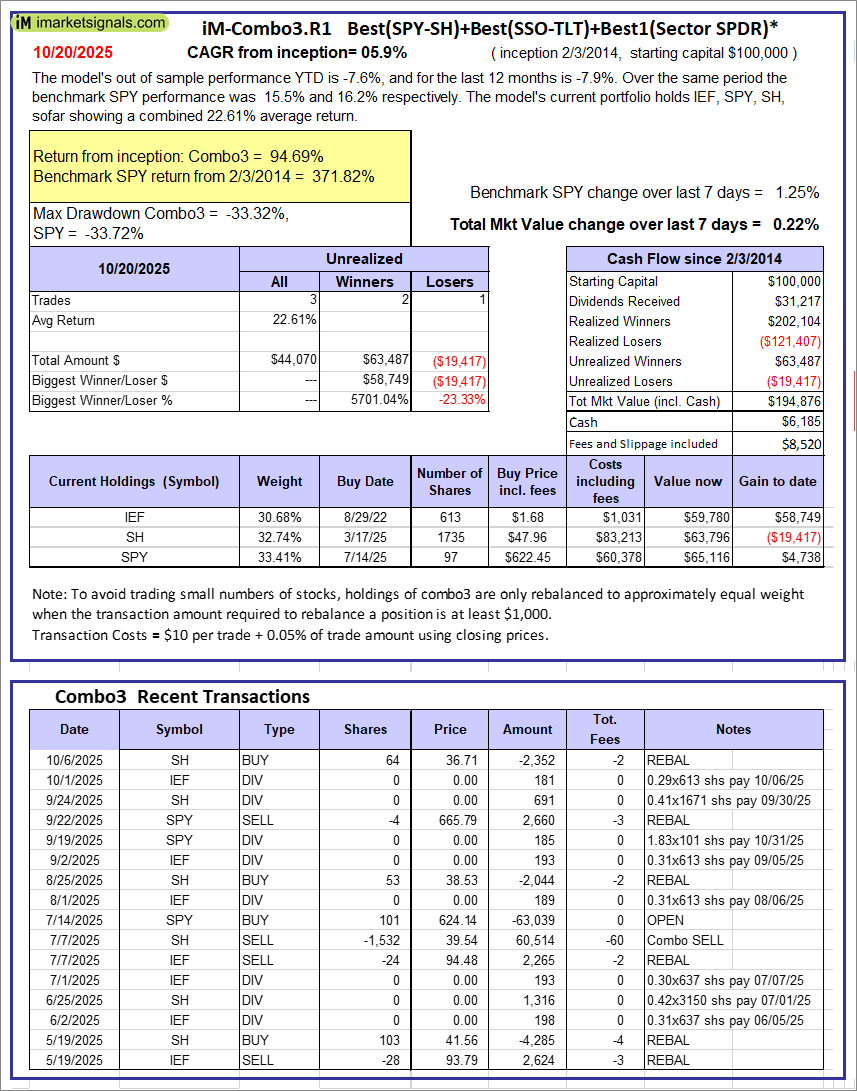 |
iM-Combo3.R1: The model’s out of sample performance YTD is -7.6%, and for the last 12 months is -7.9%. Over the same period the benchmark SPY performance was 15.5% and 16.2% respectively. Over the previous week the market value of iM-Combo3.R1 gained 0.22% at a time when SPY gained 1.25%. A starting capital of $100,000 at inception on 2/3/2014 would have grown to $194,876 which includes $6,185 cash and excludes $8,520 spent on fees and slippage. |
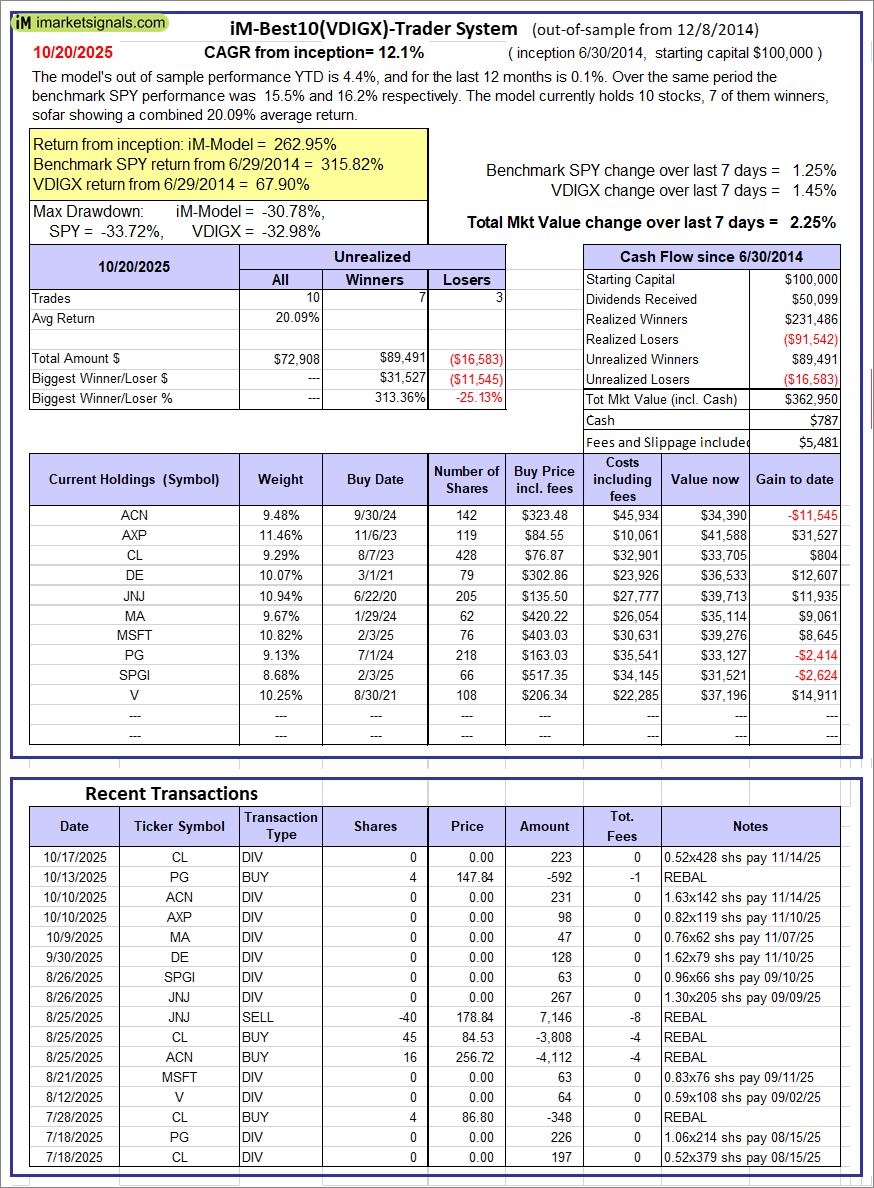 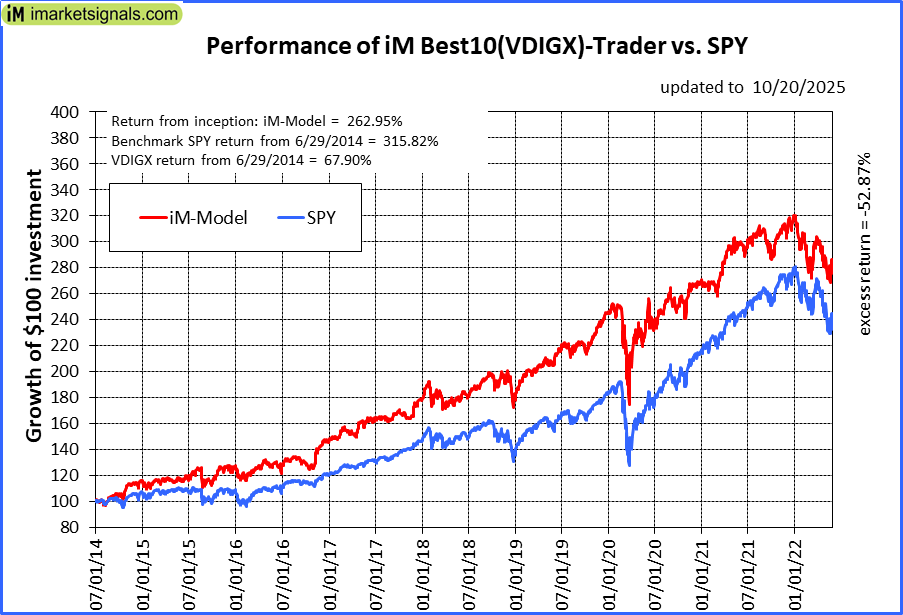 |
iM-Best10(VDIGX)-Trader: The model’s out of sample performance YTD is 4.4%, and for the last 12 months is 0.1%. Over the same period the benchmark SPY performance was 15.5% and 16.2% respectively. Since inception, on 7/1/2014, the model gained 262.95% while the benchmark SPY gained 315.82% and VDIGX gained 67.90% over the same period. Over the previous week the market value of iM-Best10(VDIGX) gained 2.25% at a time when SPY gained 1.25%. A starting capital of $100,000 at inception on 7/1/2014 would have grown to $362,950 which includes $787 cash and excludes $5,481 spent on fees and slippage. |
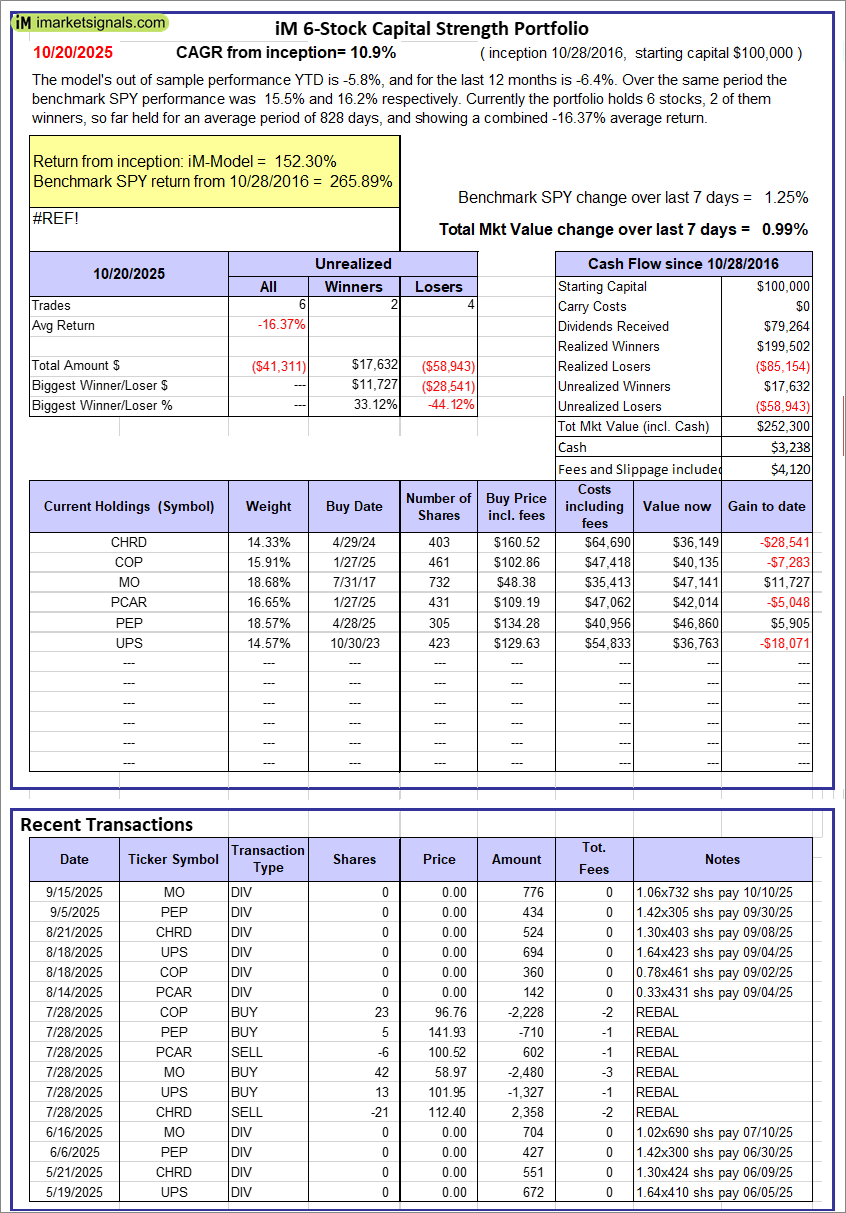 |
iM 6-Stock Capital Strength Portfolio: The model’s out of sample performance YTD is -5.8%, and for the last 12 months is -6.4%. Over the same period the benchmark SPY performance was 15.5% and 16.2% respectively. Over the previous week the market value of the iM 6-Stock Capital Strength Portfolio gained 0.99% at a time when SPY gained 1.25%. A starting capital of $100,000 at inception on 10/28/2016 would have grown to $252,300 which includes $3,238 cash and excludes $4,120 spent on fees and slippage. |
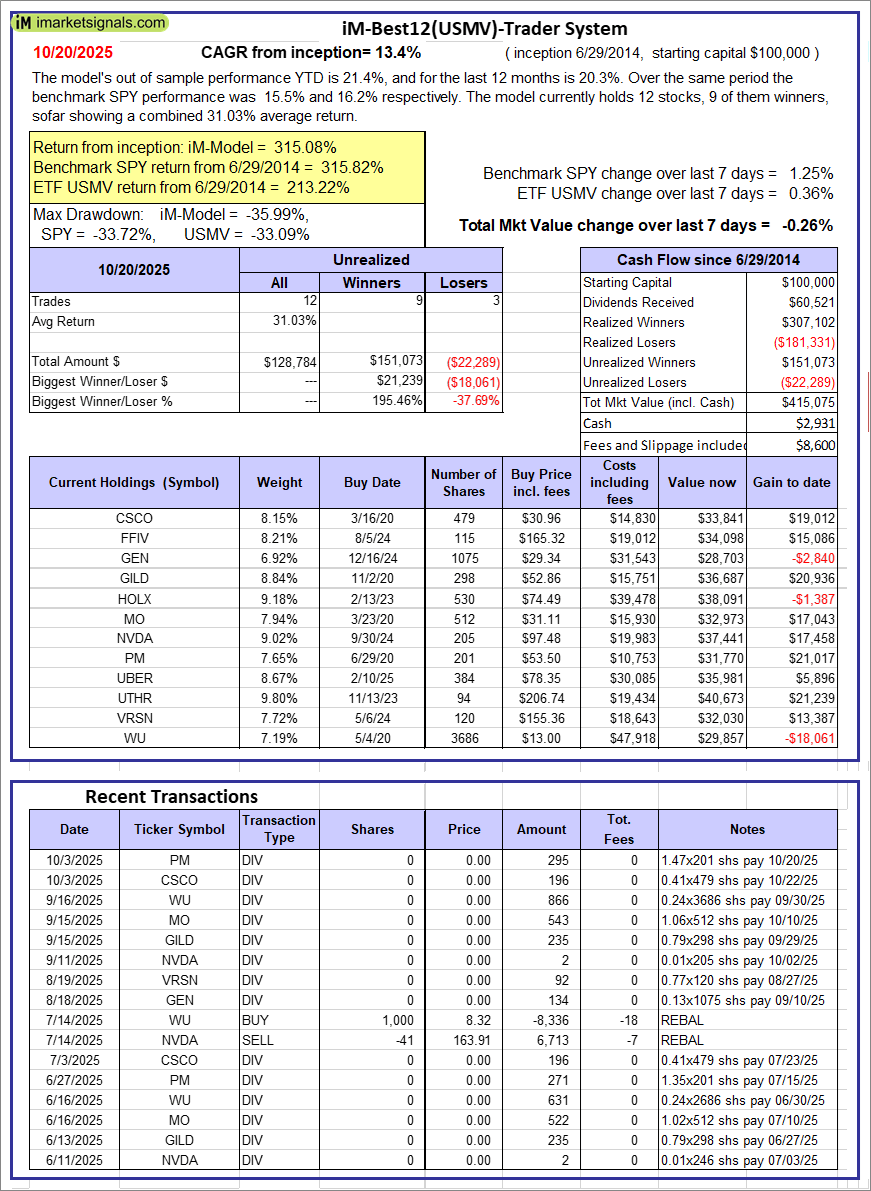 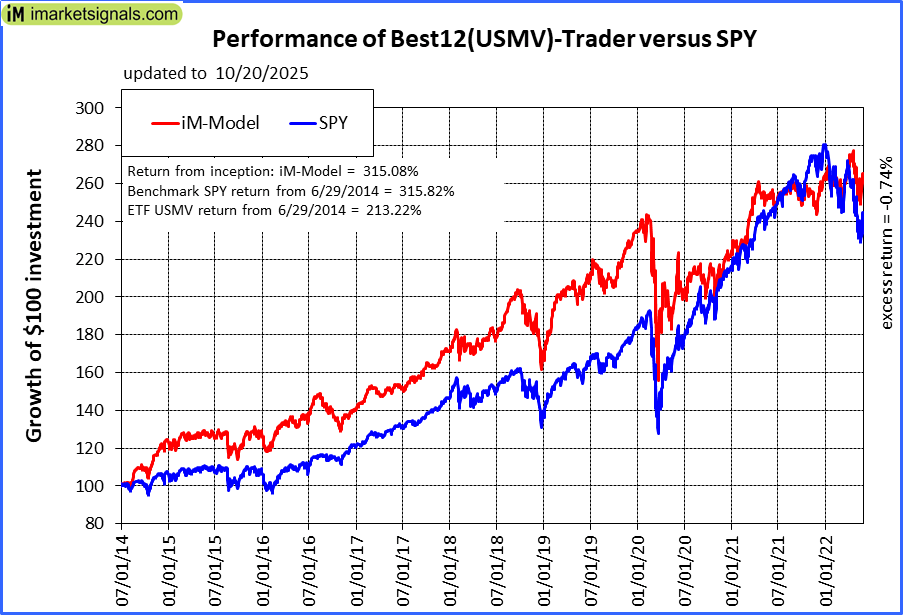 |
iM-Best12(USMV)-Trader: The model’s out of sample performance YTD is 21.4%, and for the last 12 months is 20.3%. Over the same period the benchmark SPY performance was 15.5% and 16.2% respectively. Since inception, on 6/30/2014, the model gained 315.08% while the benchmark SPY gained 315.82% and the ETF USMV gained 213.22% over the same period. Over the previous week the market value of iM-Best12(USMV)-Trader gained -0.26% at a time when SPY gained 1.25%. A starting capital of $100,000 at inception on 6/30/2014 would have grown to $415,075 which includes $2,931 cash and excludes $8,600 spent on fees and slippage. |
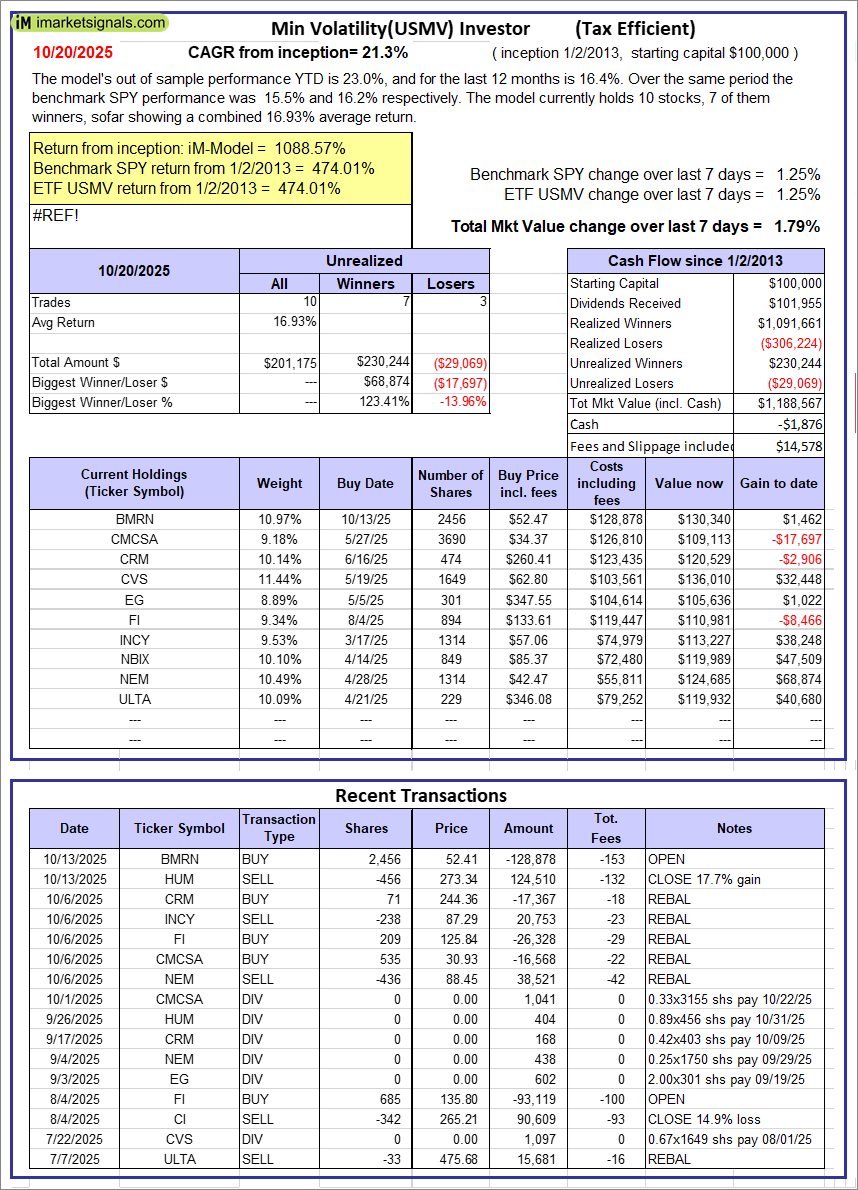 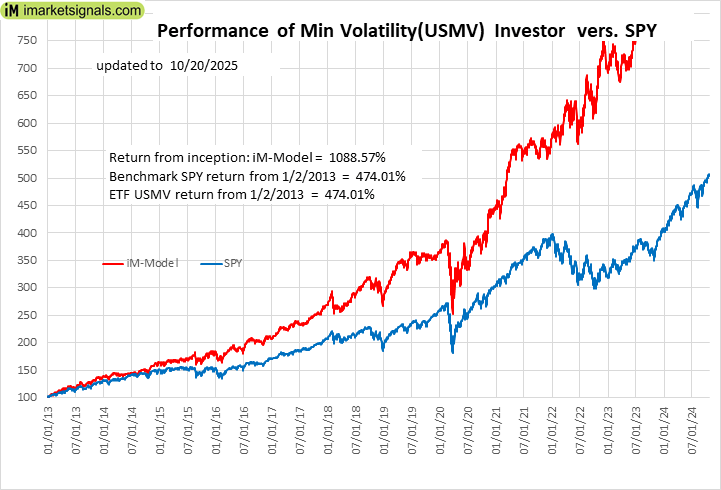 |
iM-Min Volatility(USMV) Investor (Tax Efficient): The model’s out of sample performance YTD is 23.0%, and for the last 12 months is 16.4%. Over the same period the benchmark SPY performance was 15.5% and 16.2% respectively. Since inception, on 1/3/2013, the model gained 1088.57% while the benchmark SPY gained 474.01% and the ETF USMV gained 474.01% over the same period. Over the previous week the market value of iM-Best12(USMV)Q1 gained 1.79% at a time when SPY gained 1.25%. A starting capital of $100,000 at inception on 1/3/2013 would have grown to $1,188,567 which includes -$1,876 cash and excludes $14,578 spent on fees and slippage. |
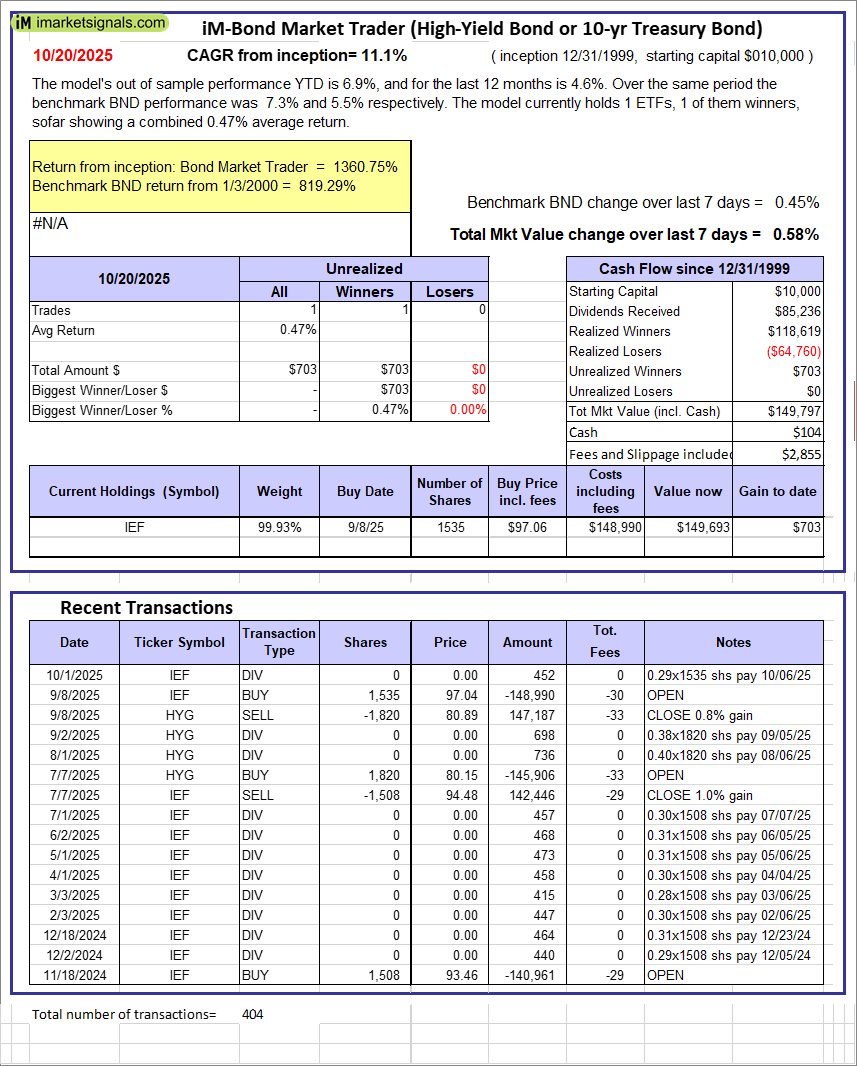 |
iM-Bond Market Trader (High-Yield Bond or 10-yr Treasury Bond): The model’s out of sample performance YTD is 6.9%, and for the last 12 months is 4.6%. Over the same period the benchmark BND performance was 7.3% and 5.5% respectively. Over the previous week the market value of the iM-Bond Market Trader (High-Yield Bond or 10-yr Treasury Bond) gained 0.58% at a time when BND gained 0.45%. A starting capital of $10,000 at inception on 1/3/2000 would have grown to $149,797 which includes $104 cash and excludes $2,855 spent on fees and slippage. |
|
|
iM-ModSum/YieldCurve Timer: The model’s out of sample performance YTD is 19.9%, and for the last 12 months is 22.2%. Over the same period the benchmark SPY performance was 15.5% and 16.2% respectively. Over the previous week the market value of iM-PortSum/YieldCurve Timer gained 0.58% at a time when SPY gained 1.25%. A starting capital of $100,000 at inception on 1/1/2016 would have grown to $384,761 which includes $1,019 cash and excludes $2,213 spent on fees and slippage. |
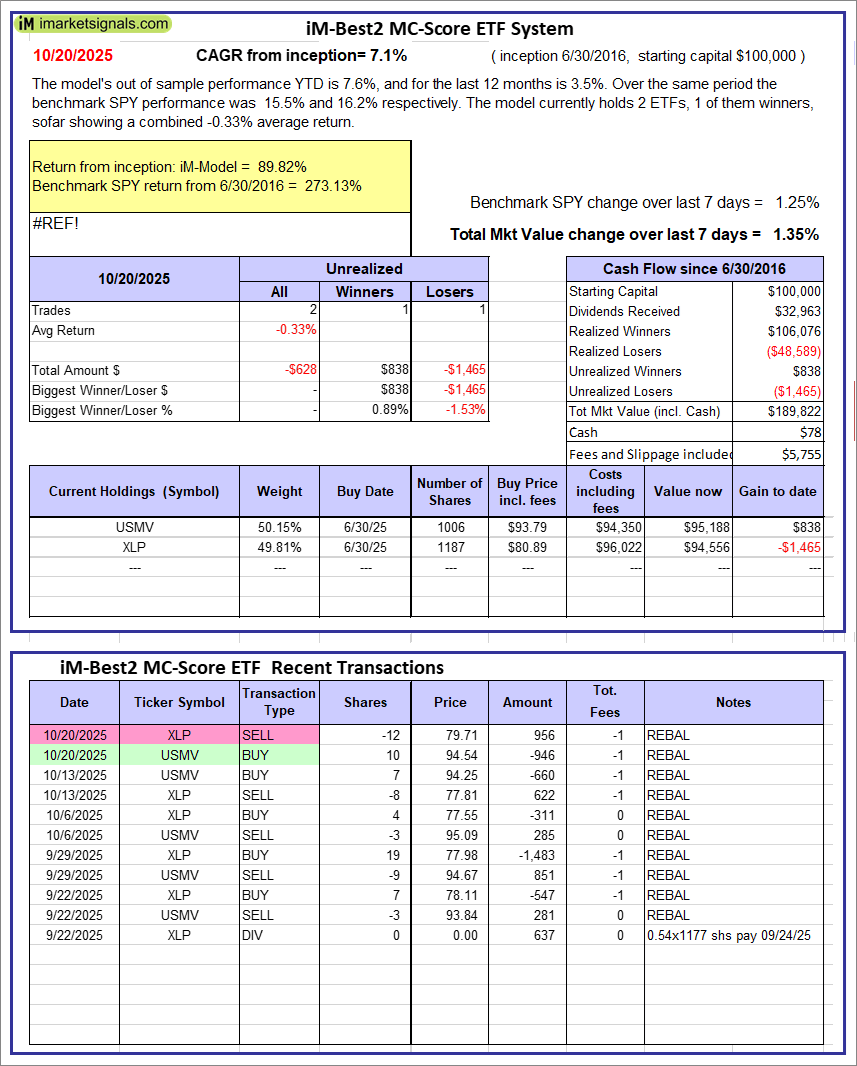 |
iM-Best2 MC-Score ETF System: The model’s out of sample performance YTD is 7.6%, and for the last 12 months is 3.5%. Over the same period the benchmark SPY performance was 15.5% and 16.2% respectively. Over the previous week the market value of the iM-Best2 MC-Score ETF System gained 1.35% at a time when SPY gained 1.25%. A starting capital of $100,000 at inception on 6/30/2016 would have grown to $189,822 which includes $78 cash and excludes $5,755 spent on fees and slippage. |
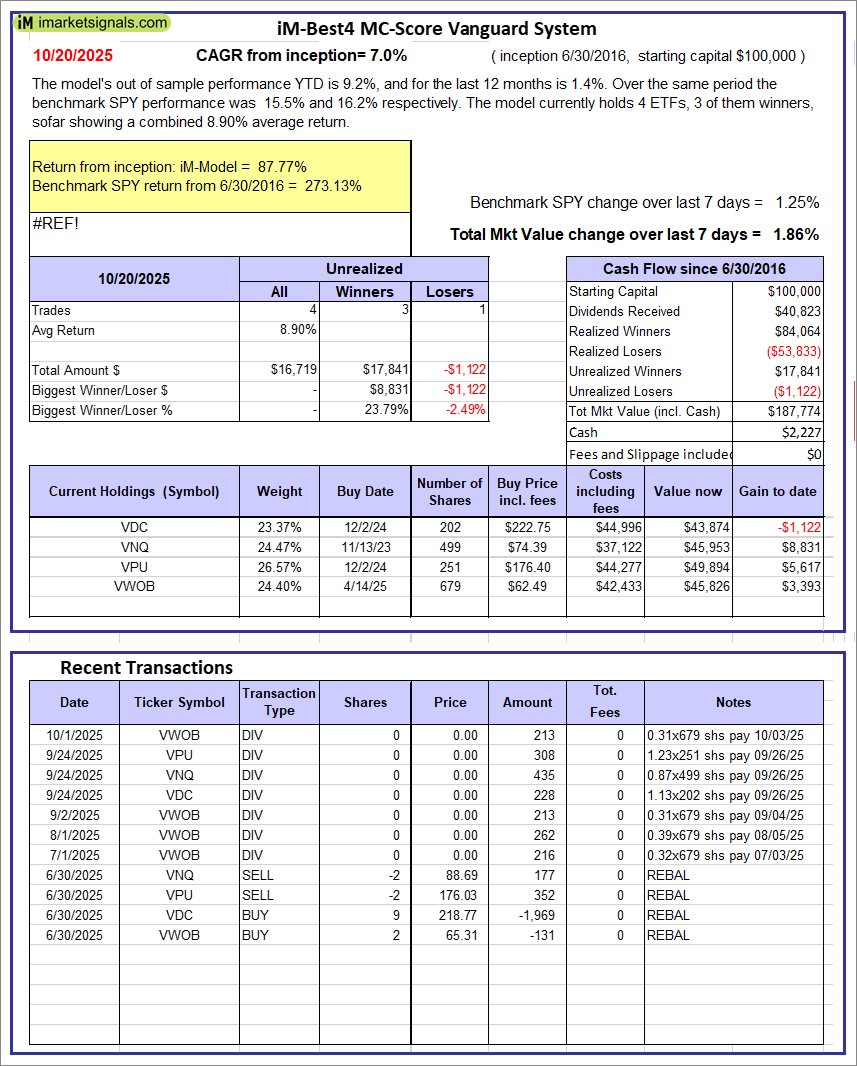 |
iM-Best4 MC-Score Vanguard System: The model’s out of sample performance YTD is 9.2%, and for the last 12 months is 1.4%. Over the same period the benchmark SPY performance was 15.5% and 16.2% respectively. Over the previous week the market value of the iM-Best4 MC-Score Vanguard System gained 1.86% at a time when SPY gained 1.25%. A starting capital of $100,000 at inception on 6/30/2016 would have grown to $187,774 which includes $2,227 cash and excludes $00 spent on fees and slippage. |
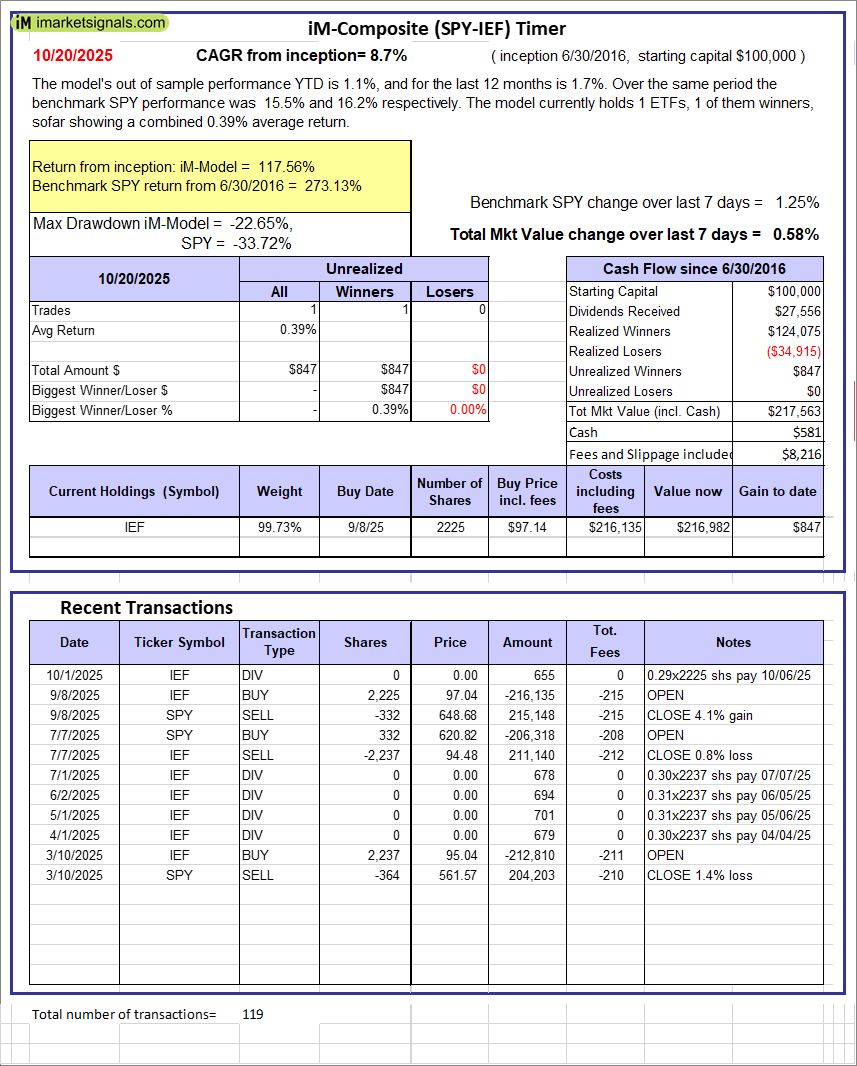 |
iM-Composite (SPY-IEF) Timer: The model’s out of sample performance YTD is 1.1%, and for the last 12 months is 1.7%. Over the same period the benchmark SPY performance was 15.5% and 16.2% respectively. Over the previous week the market value of the iM-Composite (SPY-IEF) Timer gained 0.58% at a time when SPY gained 1.25%. A starting capital of $100,000 at inception on 6/30/2016 would have grown to $217,563 which includes $581 cash and excludes $8,216 spent on fees and slippage. |
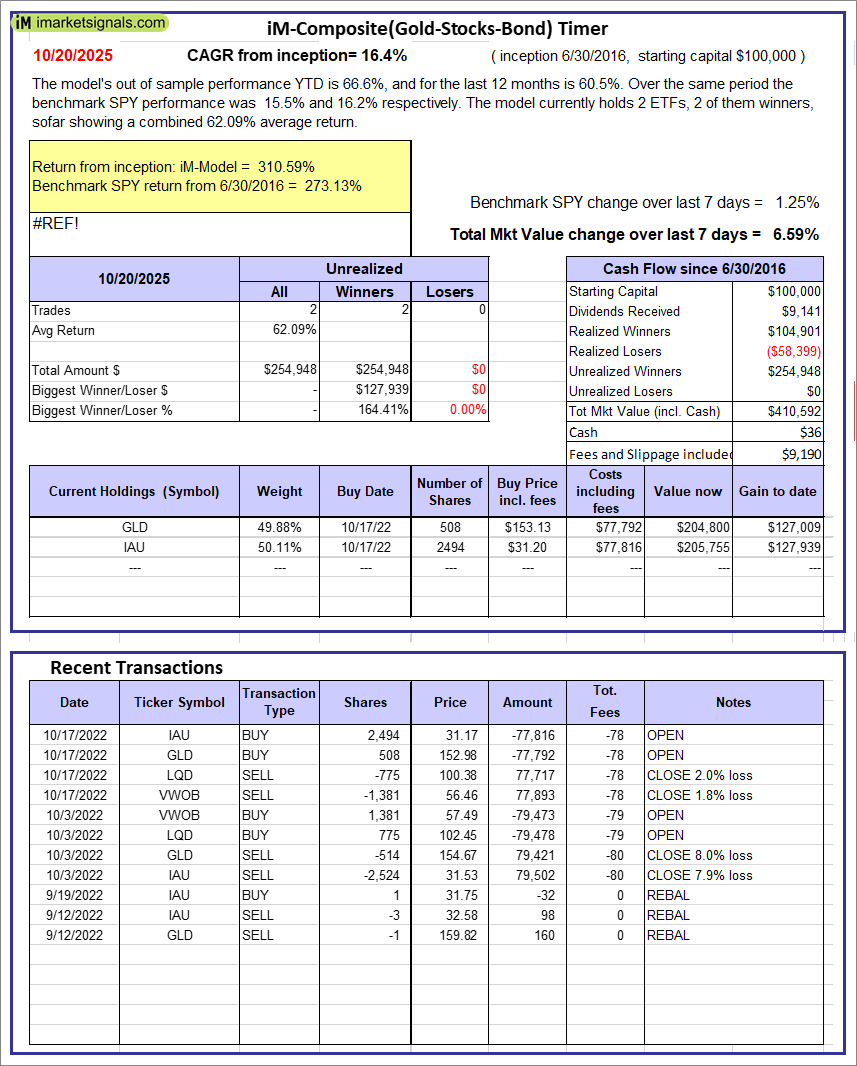 |
iM-Composite(Gold-Stocks-Bond) Timer: The model’s out of sample performance YTD is 66.6%, and for the last 12 months is 60.5%. Over the same period the benchmark SPY performance was 15.5% and 16.2% respectively. Over the previous week the market value of the iM-Composite(Gold-Stocks-Bond) Timer gained 6.59% at a time when SPY gained 1.25%. A starting capital of $100,000 at inception on 6/30/2016 would have grown to $410,592 which includes $36 cash and excludes $9,190 spent on fees and slippage. |
iM-Best Reports – 10/20/2025
Posted in pmp SPY-SH
Leave a Reply
You must be logged in to post a comment.