
  |
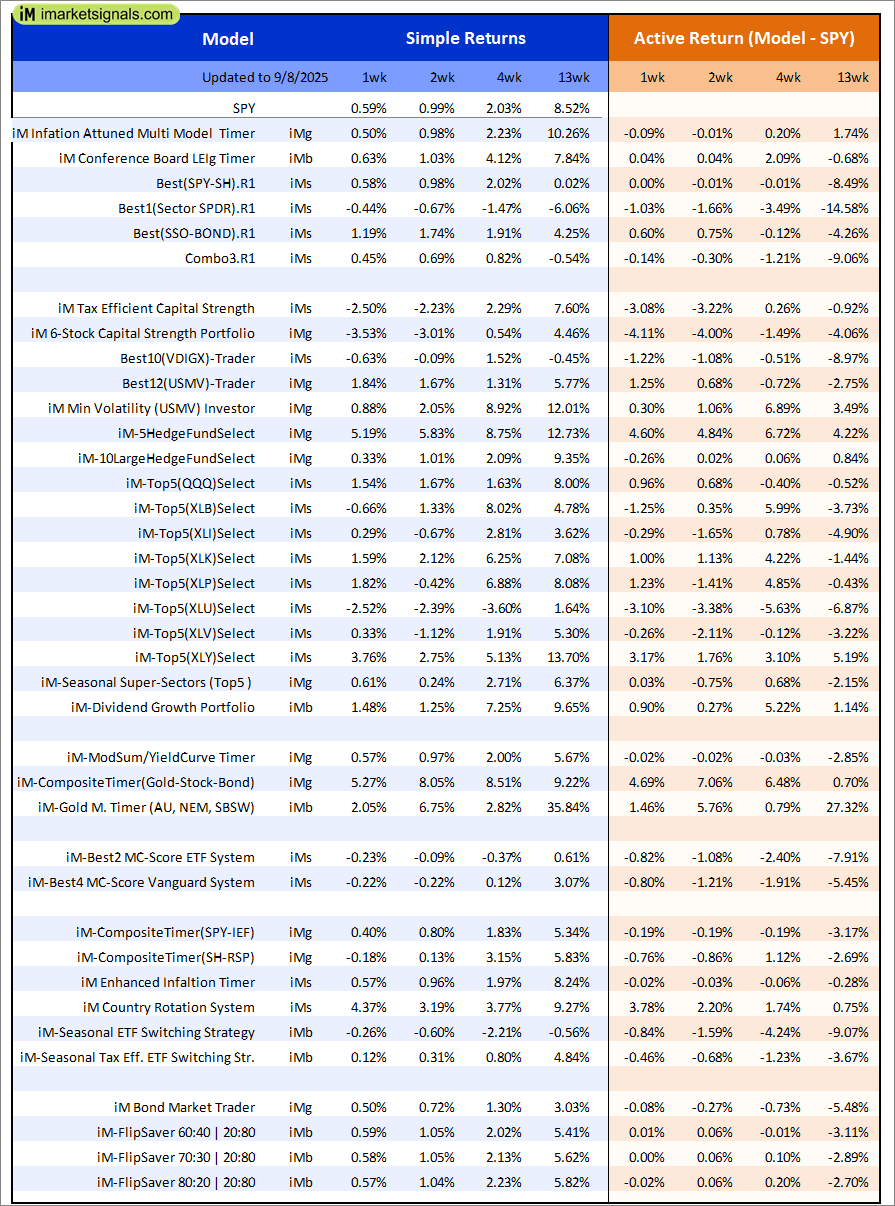
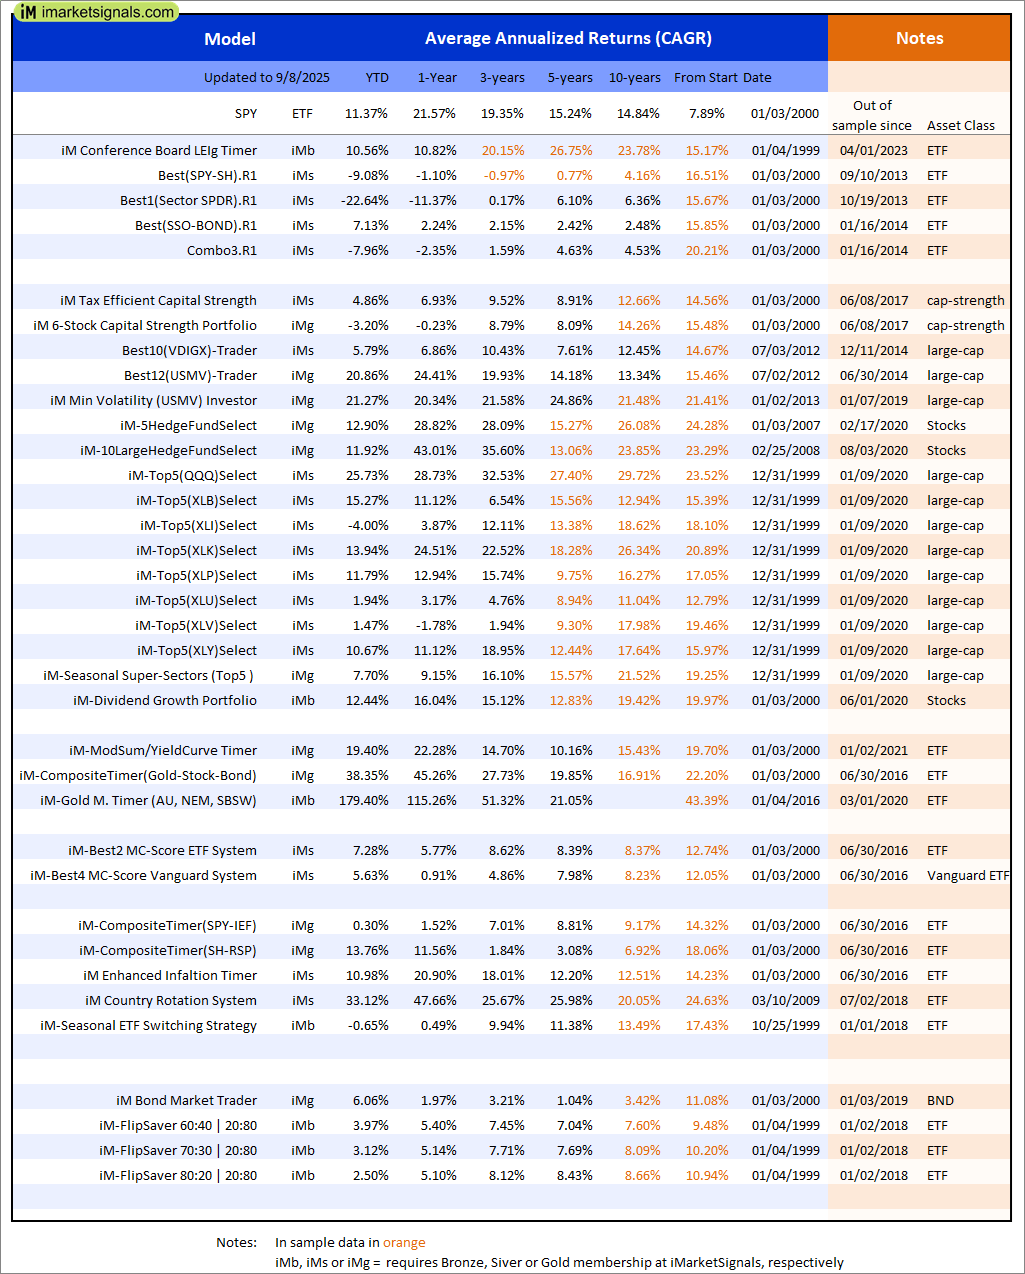
Out of sample performance summary of our models for the past 1, 2, 4 and 13 week periods. The active active return indicates how the models over- or underperformed the benchmark ETF SPY. Also the YTD, and the 1-, 3-, 5- and 10-year annualized returns are shown in the second table |
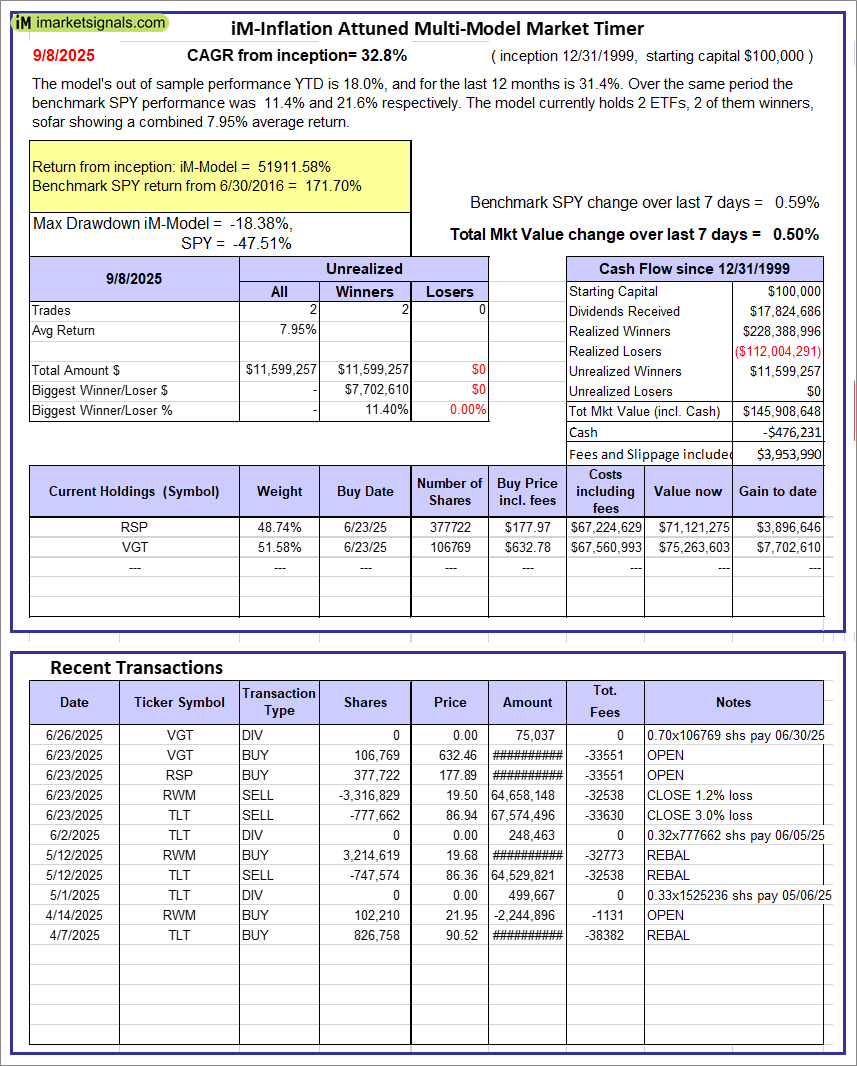 |
iM-Inflation Attuned Multi-Model Market Timer: The model’s out of sample performance YTD is 18.0%, and for the last 12 months is 31.4%. Over the same period the benchmark SPY performance was 11.4% and 21.6% respectively. Over the previous week the market value of the iM-Inflation Attuned Multi-Model Market Timer gained 0.50% at a time when SPY gained 0.59%. A starting capital of $100,000 at inception on 3/24/2017 would have grown to $145,908,648 which includes -$476,231 cash and excludes $3,953,990 spent on fees and slippage. |
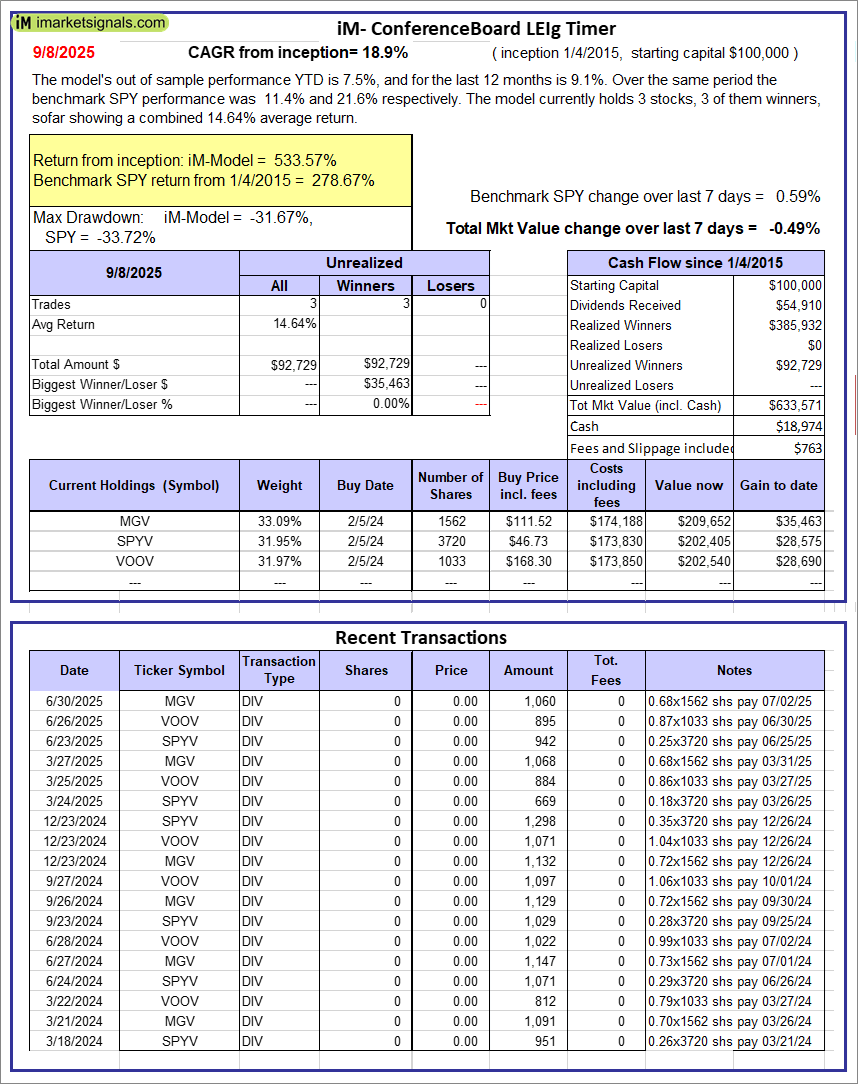 |
iM-Conference Board LEIg Timer: The model’s performance YTD is 14.3%, and for the last 12 months is 7.3%. Over the same period the benchmark SPY performance was 20.1% and 9.4% respectively. Over the previous week the market value of the iM-Conference Board LEIg Timer gained -0.49% at a time when SPY gained 0.59%. A starting capital of $100,000 at inception on 4/5/2017 would have grown to $633,571 which includes $18,974 cash and excludes $763 spent on fees and slippage. |
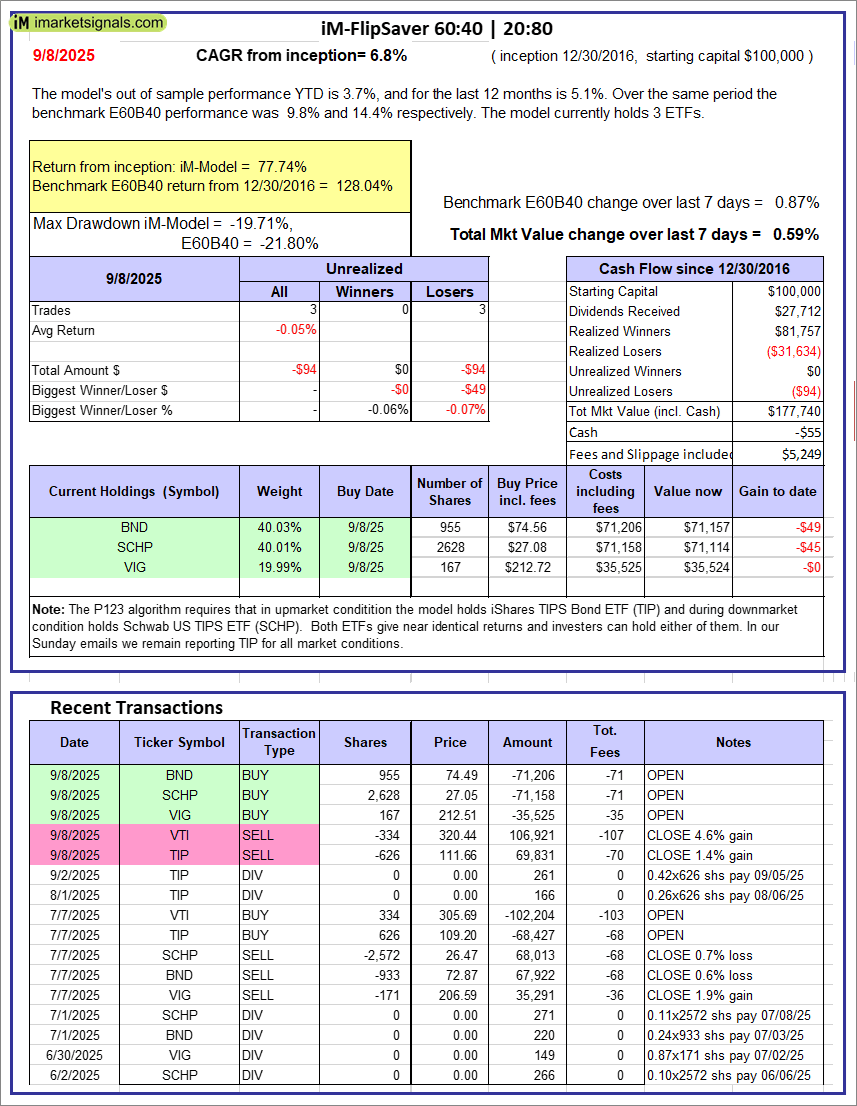 |
iM-FlipSaver 60:40 | 20:80 – 2017: The model’s out of sample performance YTD is 3.7%, and for the last 12 months is 5.1%. Over the same period the benchmark E60B40 performance was 9.8% and 14.4% respectively. Over the previous week the market value of iM-FlipSaver 80:20 | 20:80 gained 0.59% at a time when SPY gained 0.87%. A starting capital of $100,000 at inception on 7/16/2015 would have grown to $177,740 which includes -$55 cash and excludes $5,249 spent on fees and slippage. |
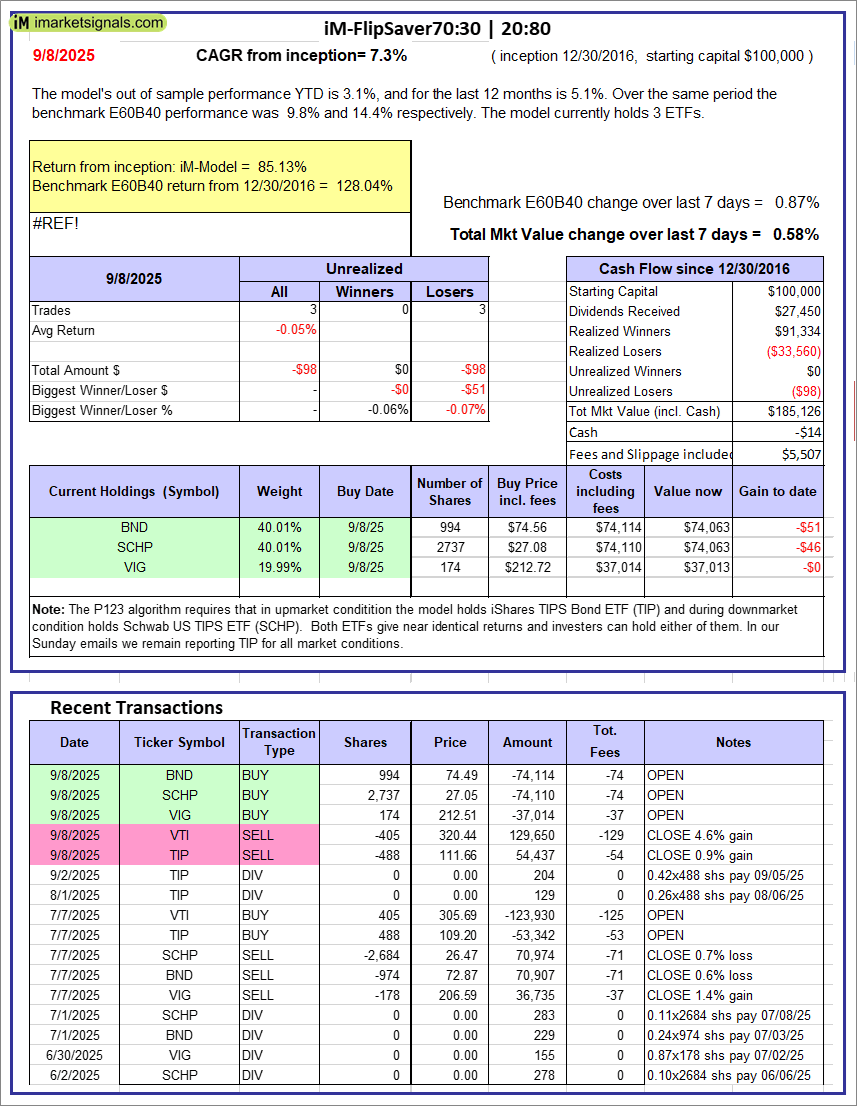 |
iM-FlipSaver 70:30 | 20:80 – 2017: The model’s out of sample performance YTD is 3.1%, and for the last 12 months is 5.1%. Over the same period the benchmark E60B40 performance was 9.8% and 14.4% respectively. Over the previous week the market value of iM-FlipSaver 70:30 | 20:80 gained 0.58% at a time when SPY gained 0.87%. A starting capital of $100,000 at inception on 7/15/2015 would have grown to $185,126 which includes -$14 cash and excludes $5,507 spent on fees and slippage. |
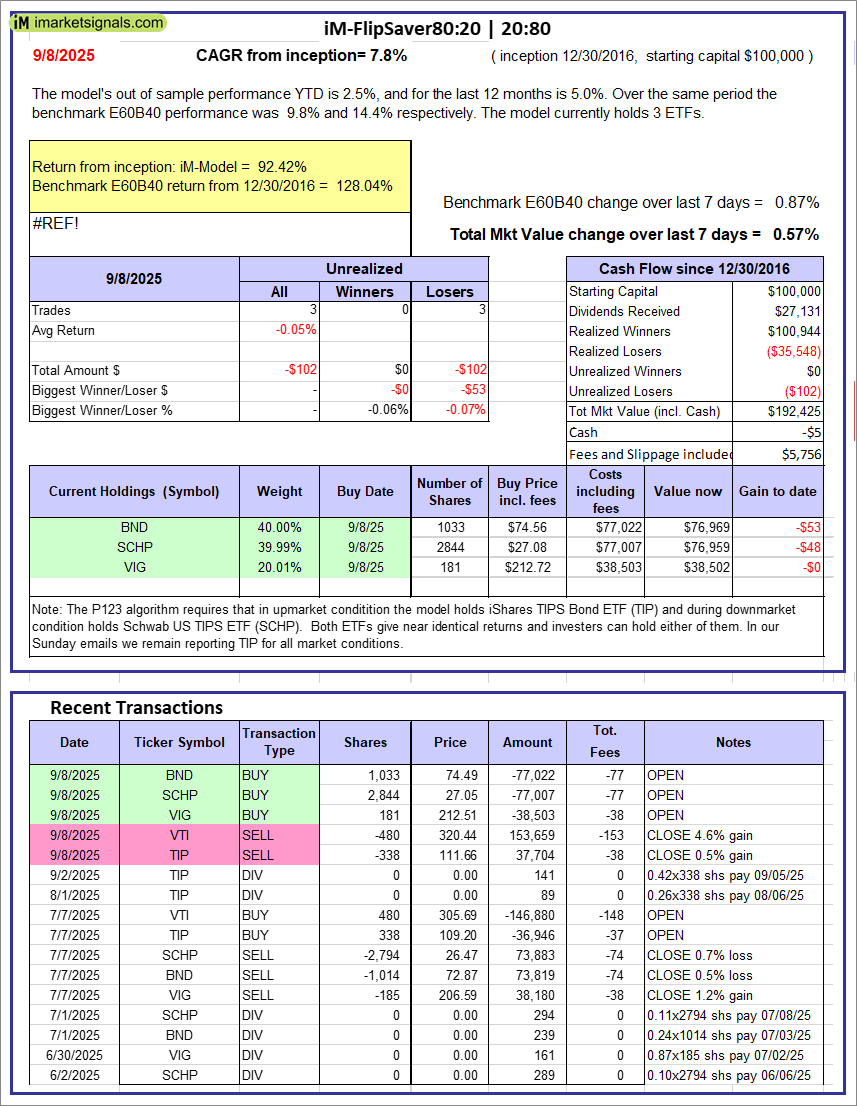 |
iM-FlipSaver 80:20 | 20:80 – 2017: The model’s out of sample performance YTD is 2.5%, and for the last 12 months is 5.0%. Over the same period the benchmark E60B40 performance was 9.8% and 14.4% respectively. Over the previous week the market value of iM-FlipSaver 80:20 | 20:80 gained 0.57% at a time when SPY gained 0.87%. A starting capital of $100,000 at inception on 1/2/2017 would have grown to $192,425 which includes -$5 cash and excludes $5,756 spent on fees and slippage. |
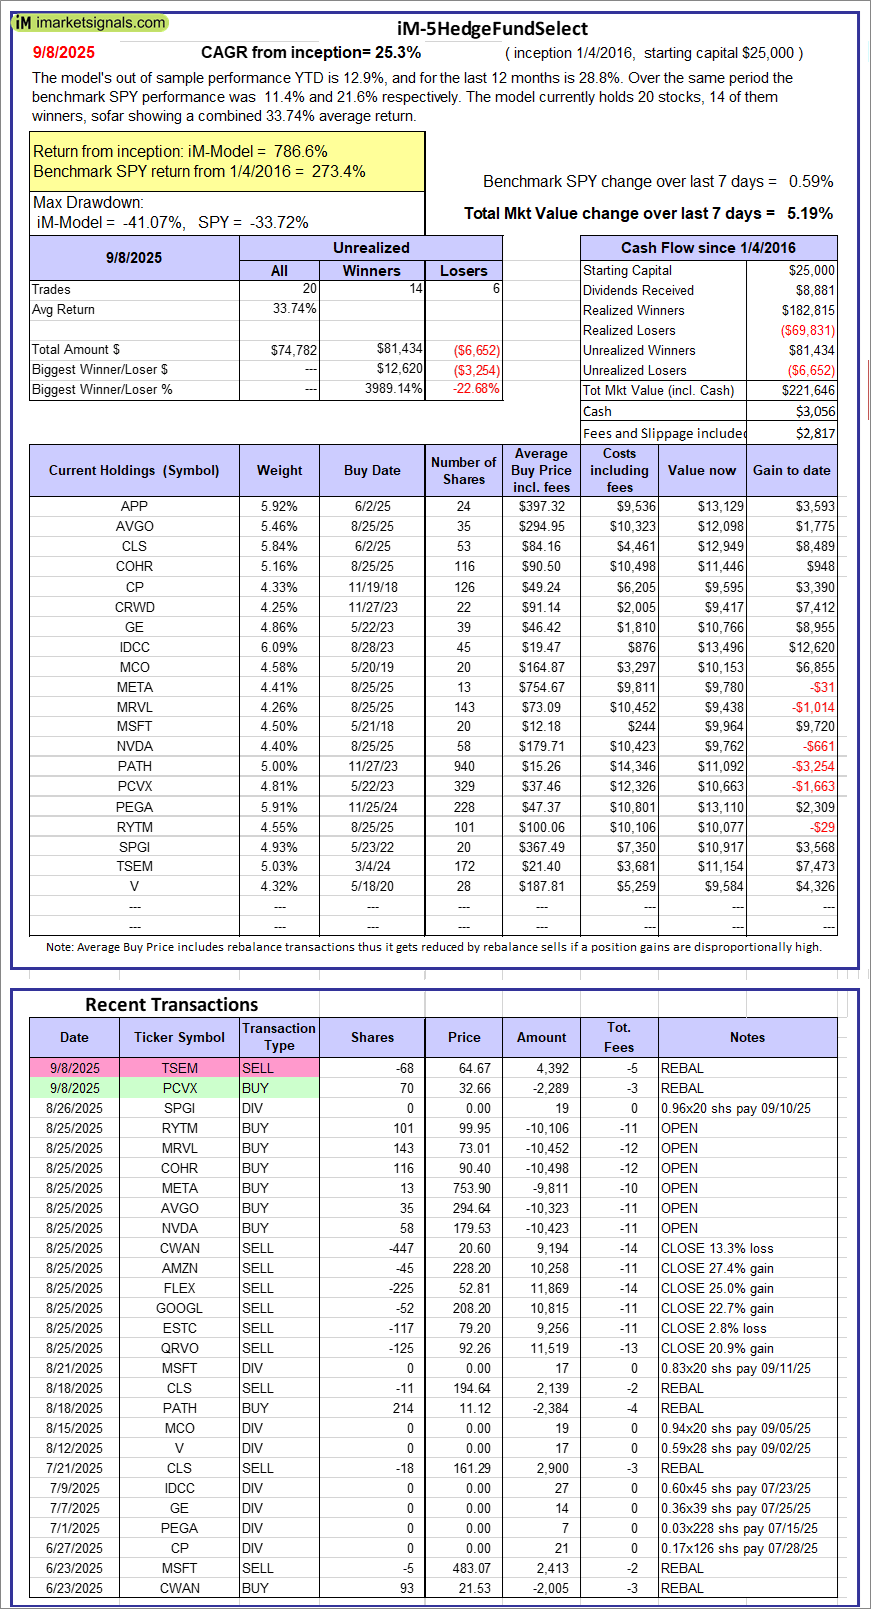 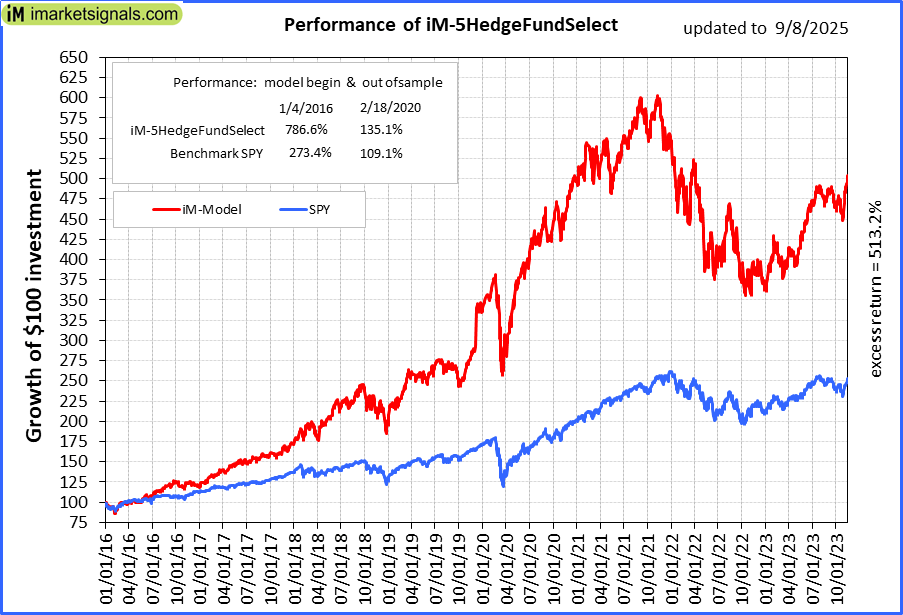 |
iM-5HedgeFundSelect: Since inception, on 1/5/2016, the model gained 786.58% while the benchmark SPY gained 273.37% over the same period. Over the previous week the market value of iM-5HedgeFundSelect gained 5.19% at a time when SPY gained 0.59%. A starting capital of $25,000 at inception on 1/5/2016 would have grown to $221,646 which includes $3,056 cash and excludes $2,817 spent on fees and slippage. |
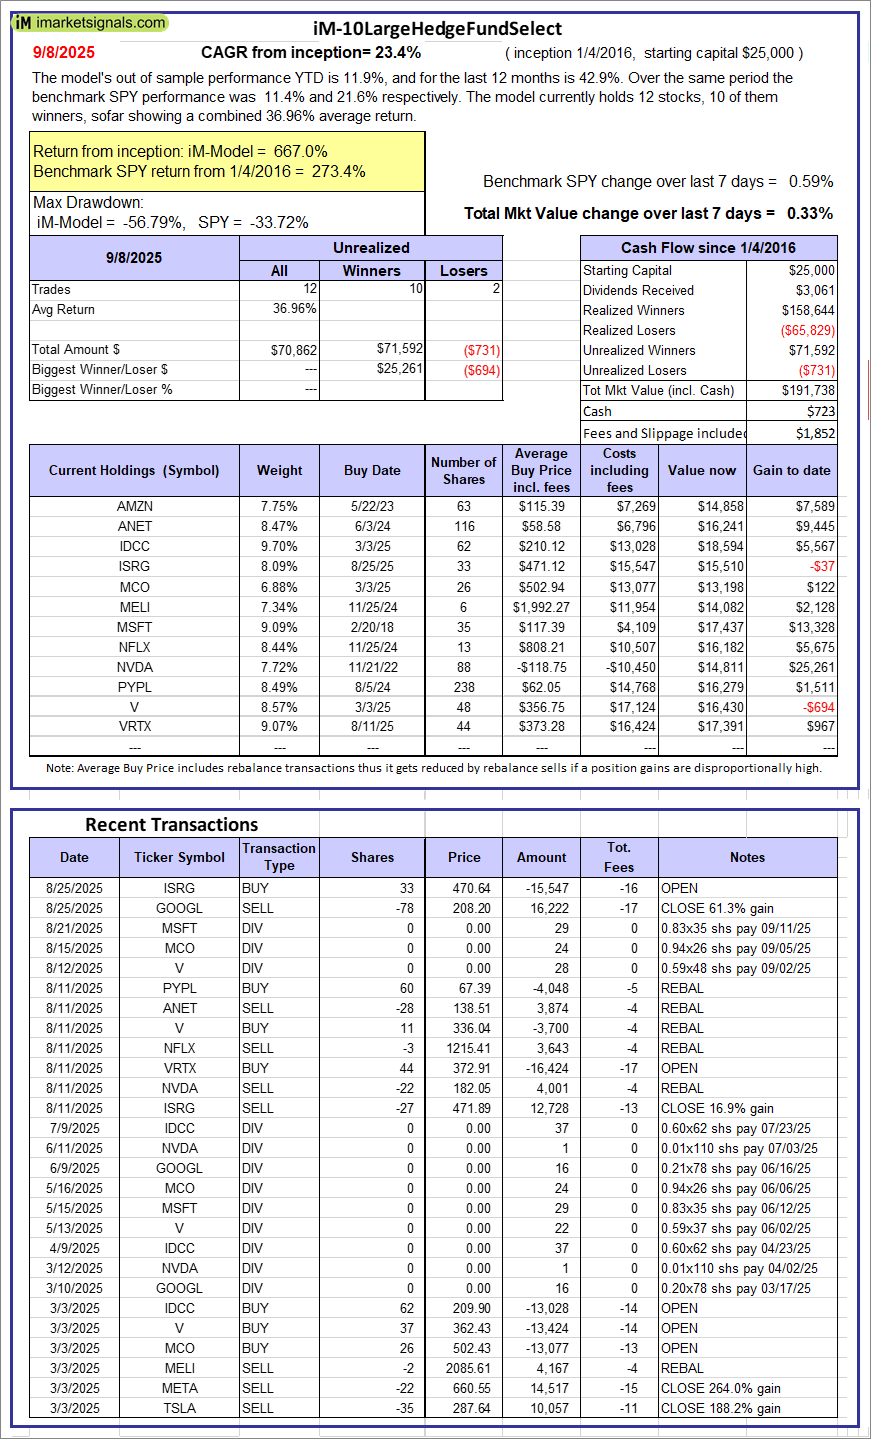 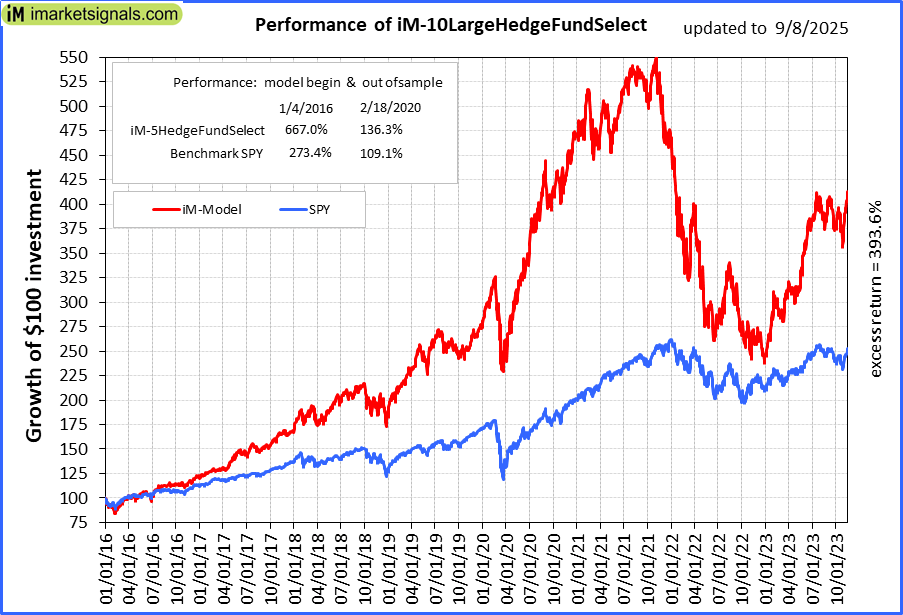 |
iM-10LargeHedgeFundSelect: Since inception, on 1/5/2016, the model gained 666.95% while the benchmark SPY gained 273.37% over the same period. Over the previous week the market value of iM-10LargeHedgeFundSelect gained 0.33% at a time when SPY gained 0.59%. A starting capital of $25,000 at inception on 1/5/2016 would have grown to $191,738 which includes $723 cash and excludes $1,852 spent on fees and slippage. |
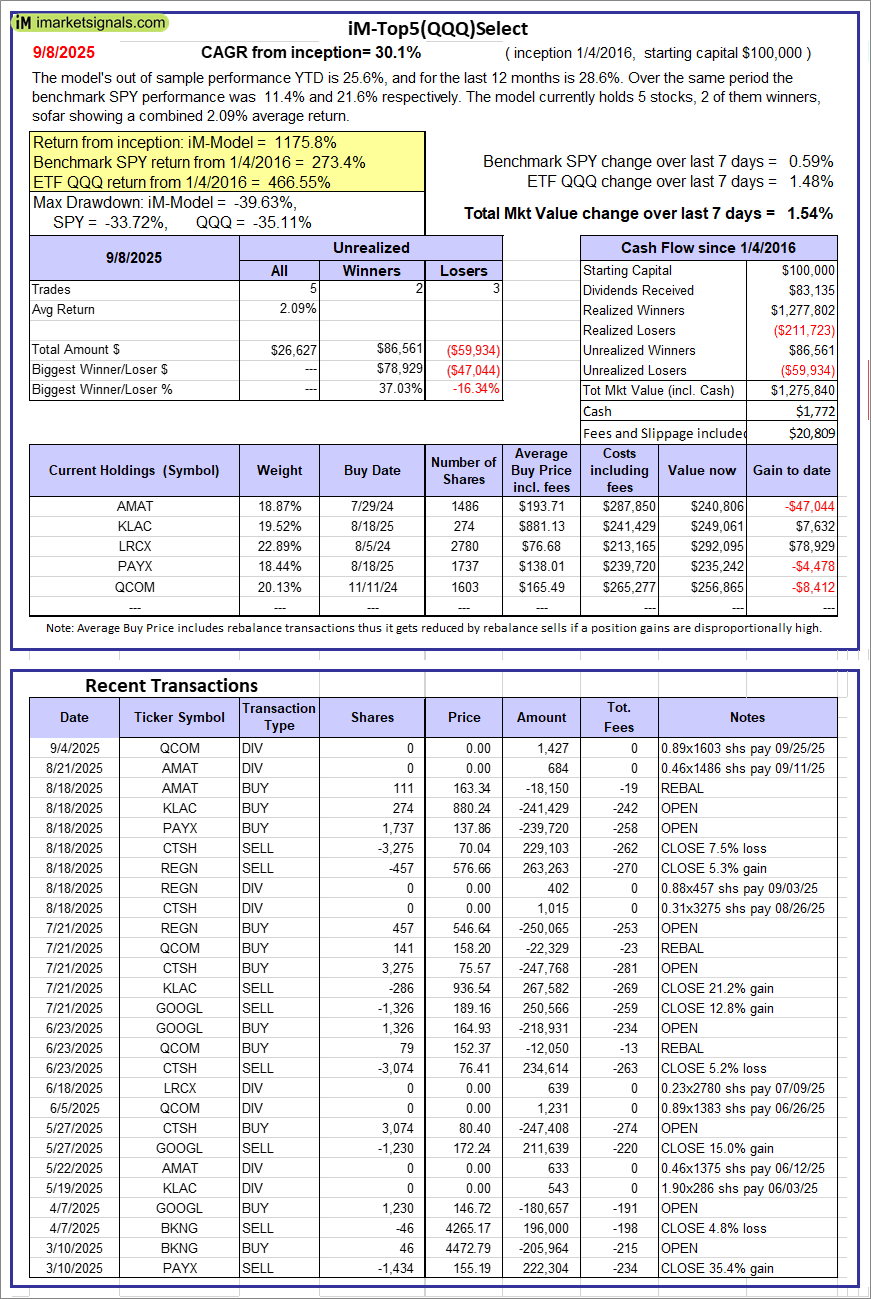 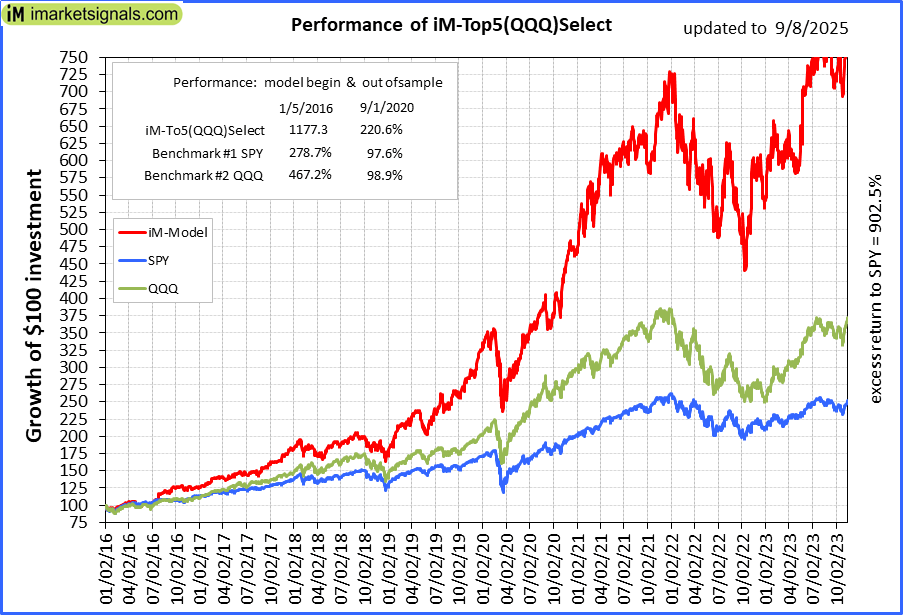 |
iM-Top5(QQQ)Select: Since inception, on 1/5/2016, the model gained 1175.84% while the benchmark SPY gained 273.37% over the same period. Over the previous week the market value of iM-Top5(QQQ)Select gained 1.54% at a time when SPY gained 0.59%. A starting capital of $100,000 at inception on 1/5/2016 would have grown to $1,275,840 which includes $1,772 cash and excludes $20,809 spent on fees and slippage. |
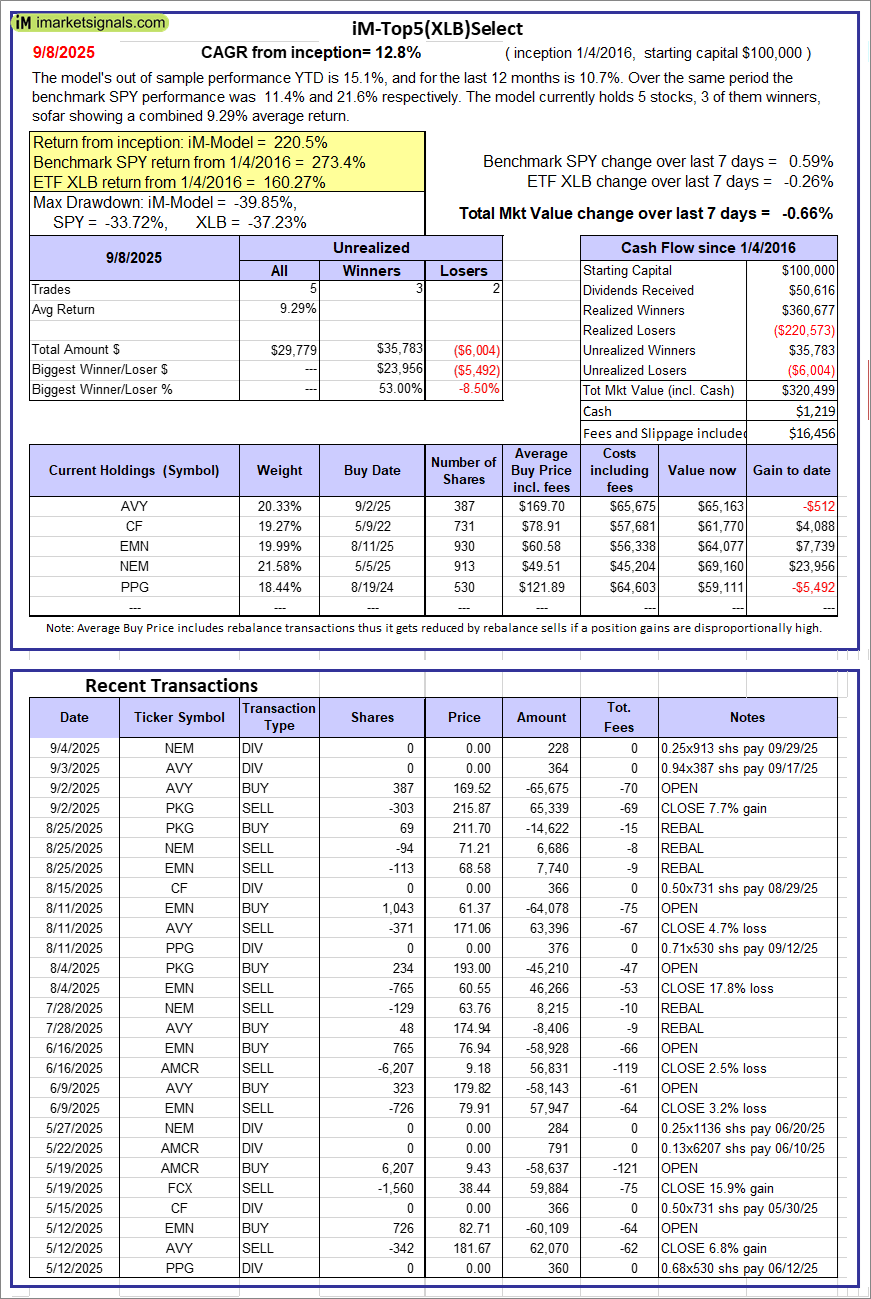 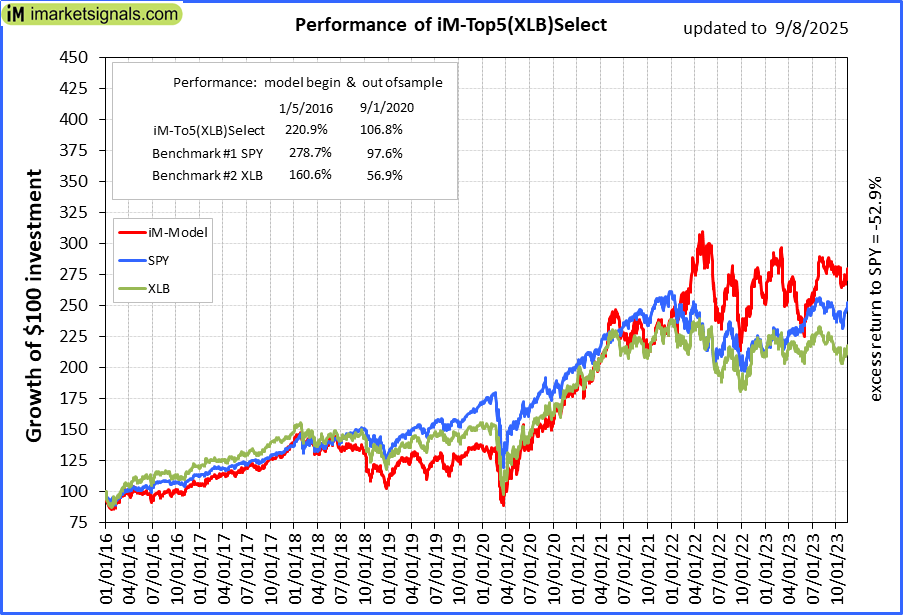 |
iM-Top5(XLB)Select: Since inception, on 1/5/2016, the model gained 220.50% while the benchmark SPY gained 273.37% over the same period. Over the previous week the market value of iM-Top5(XLB)Select gained -0.66% at a time when SPY gained 0.59%. A starting capital of $100,000 at inception on 1/5/2016 would have grown to $320,499 which includes $1,219 cash and excludes $16,456 spent on fees and slippage. |
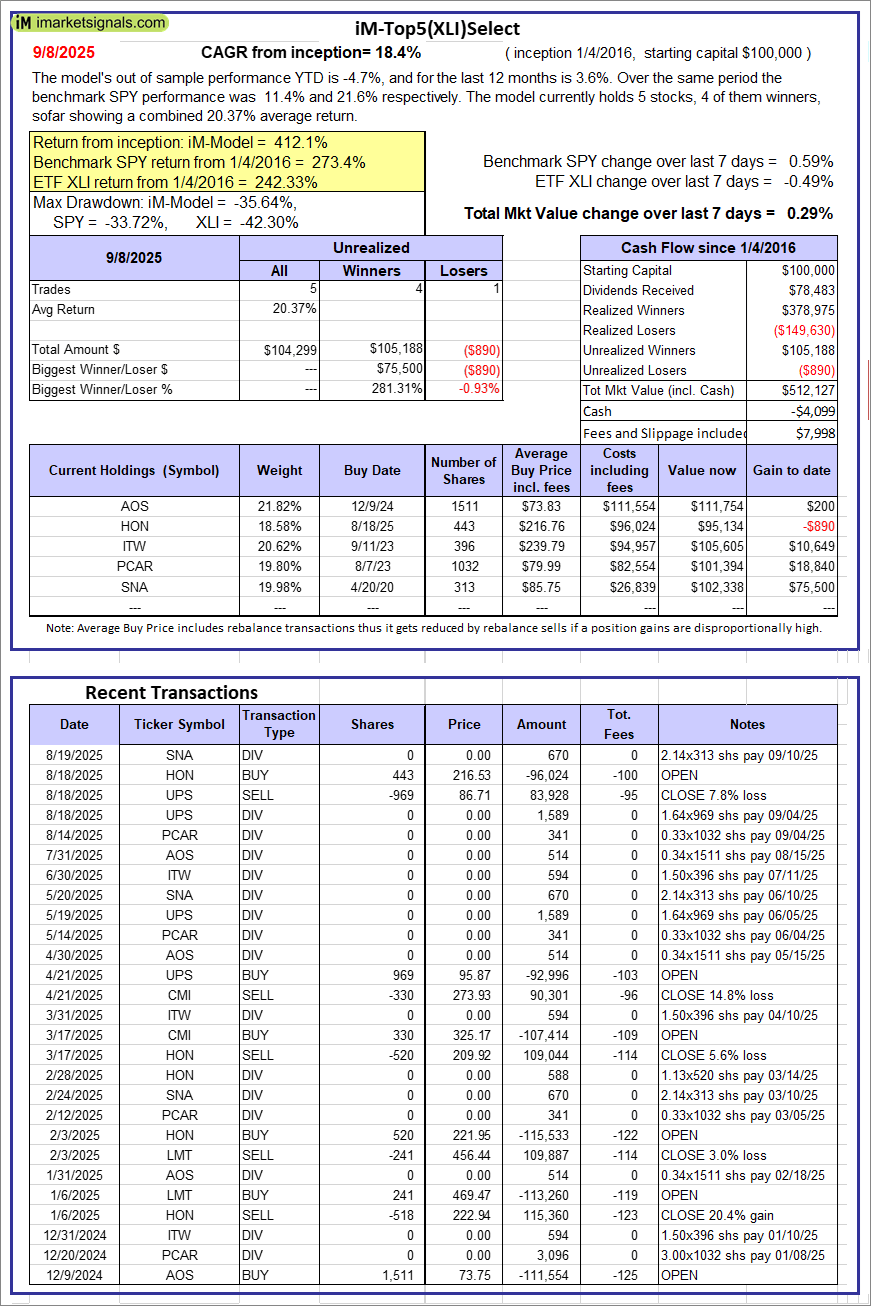 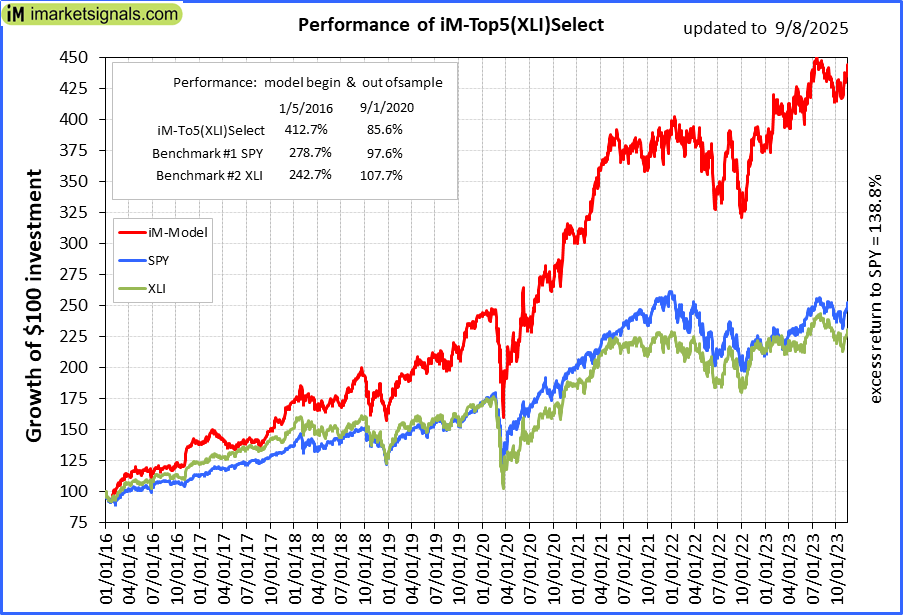 |
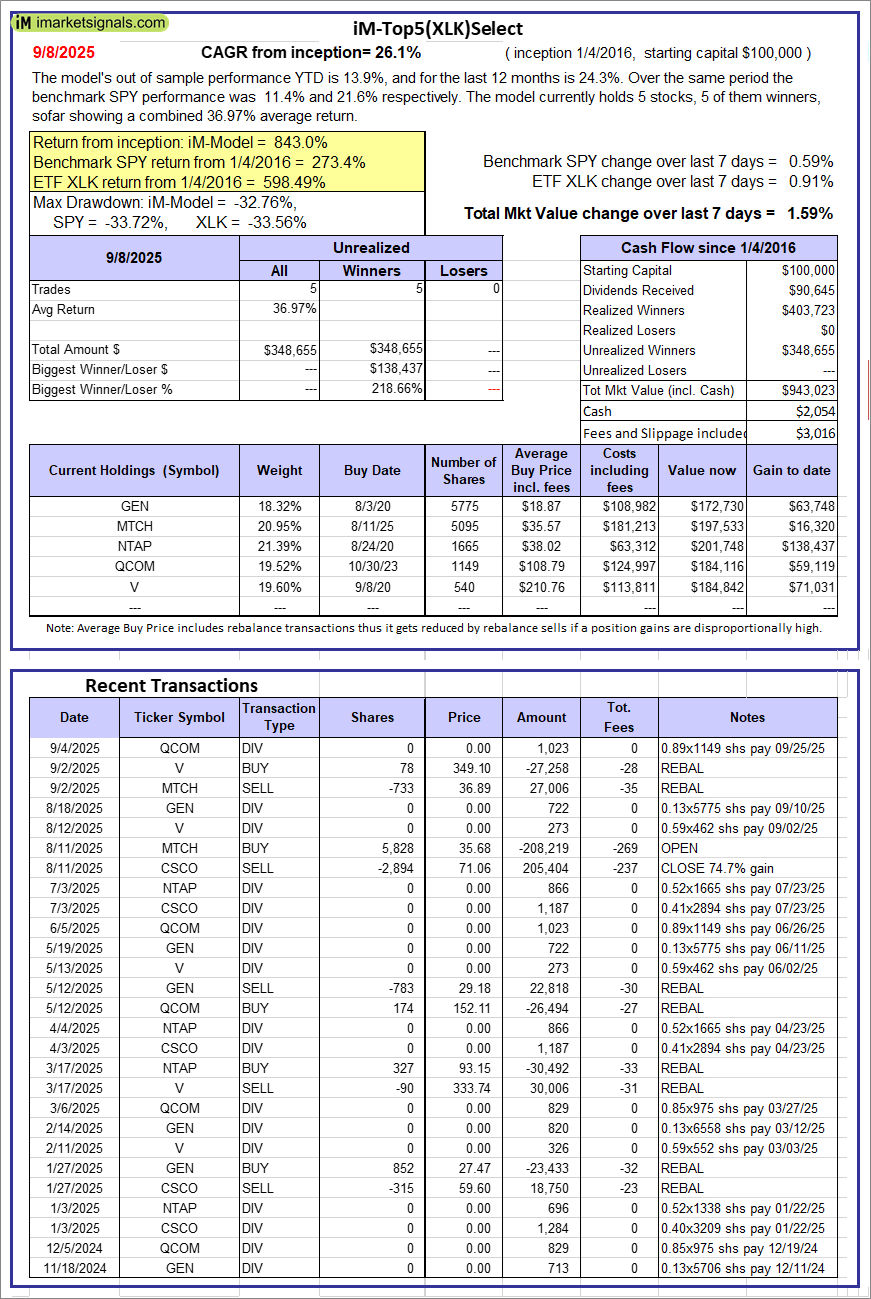
iM-Top5(XLI)Select: Since inception, on 1/5/2016, the model gained 412.13% while the benchmark SPY gained 273.37% over the same period. Over the previous week the market value of iM-Top5(XLI)Select gained 0.29% at a time when SPY gained 0.59%. A starting capital of $100,000 at inception on 1/5/2016 would have grown to $512,127 which includes -$4,099 cash and excludes $7,998 spent on fees and slippage. |
 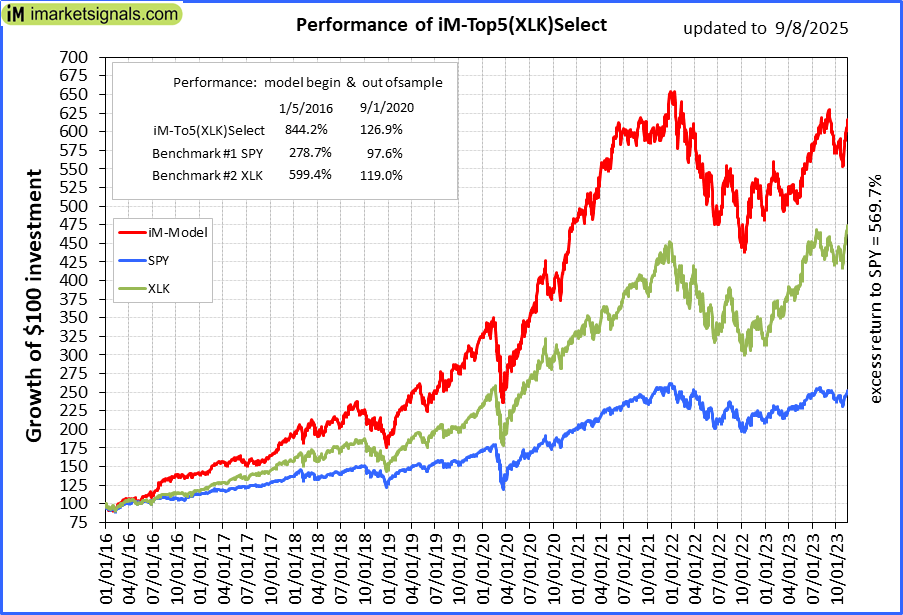 |
iM-Top5(XLK)Select: Since inception, on 1/5/2016, the model gained 843.02% while the benchmark SPY gained 273.37% over the same period. Over the previous week the market value of iM-Top5(XLK)Select gained 1.59% at a time when SPY gained 0.59%. A starting capital of $100,000 at inception on 1/5/2016 would have grown to $943,023 which includes $2,054 cash and excludes $3,016 spent on fees and slippage. |
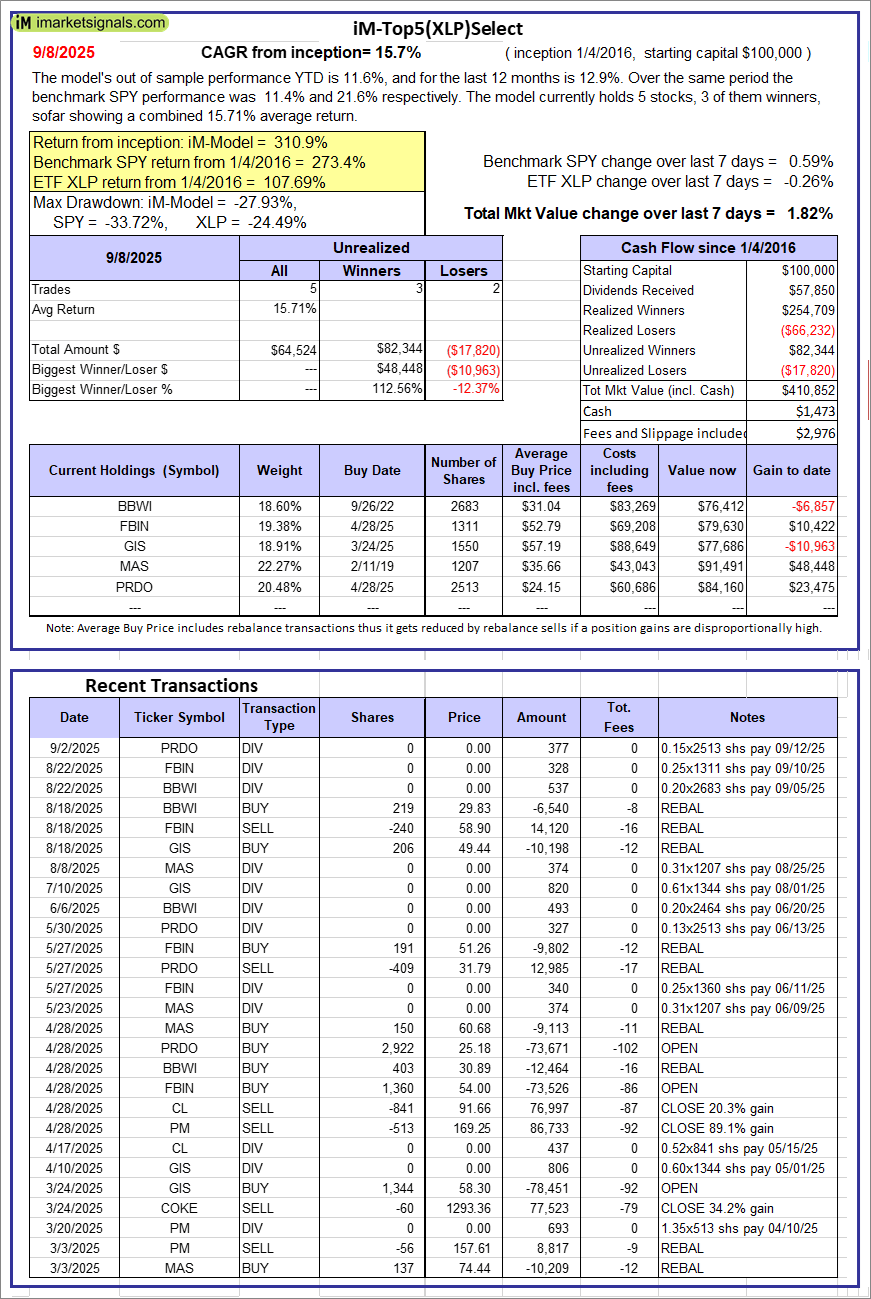 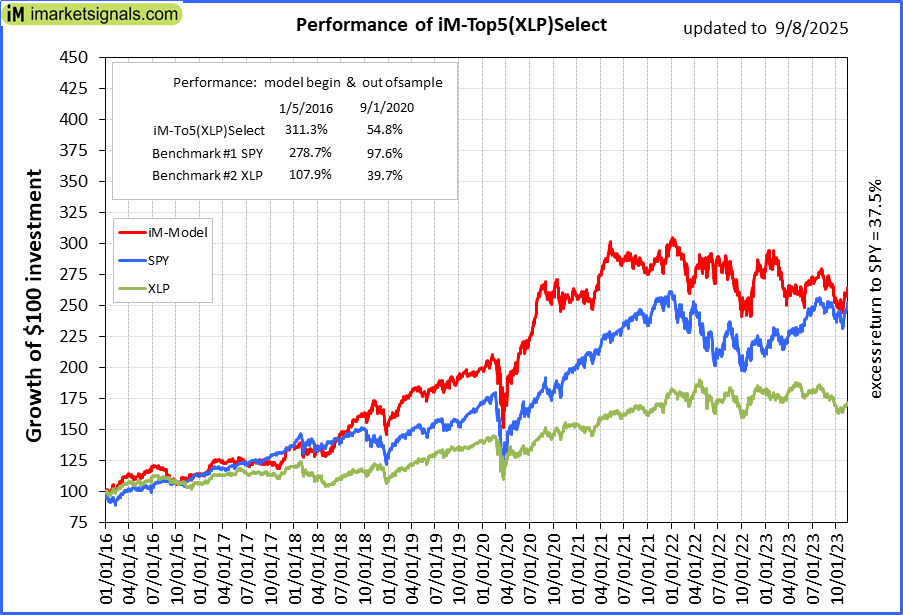 |
iM-Top5(XLP)Select: Since inception, on 1/5/2016, the model gained 310.85% while the benchmark SPY gained 273.37% over the same period. Over the previous week the market value of iM-Top5(XLP)Select gained 1.82% at a time when SPY gained 0.59%. A starting capital of $100,000 at inception on 1/5/2016 would have grown to $410,852 which includes $1,473 cash and excludes $2,976 spent on fees and slippage. |
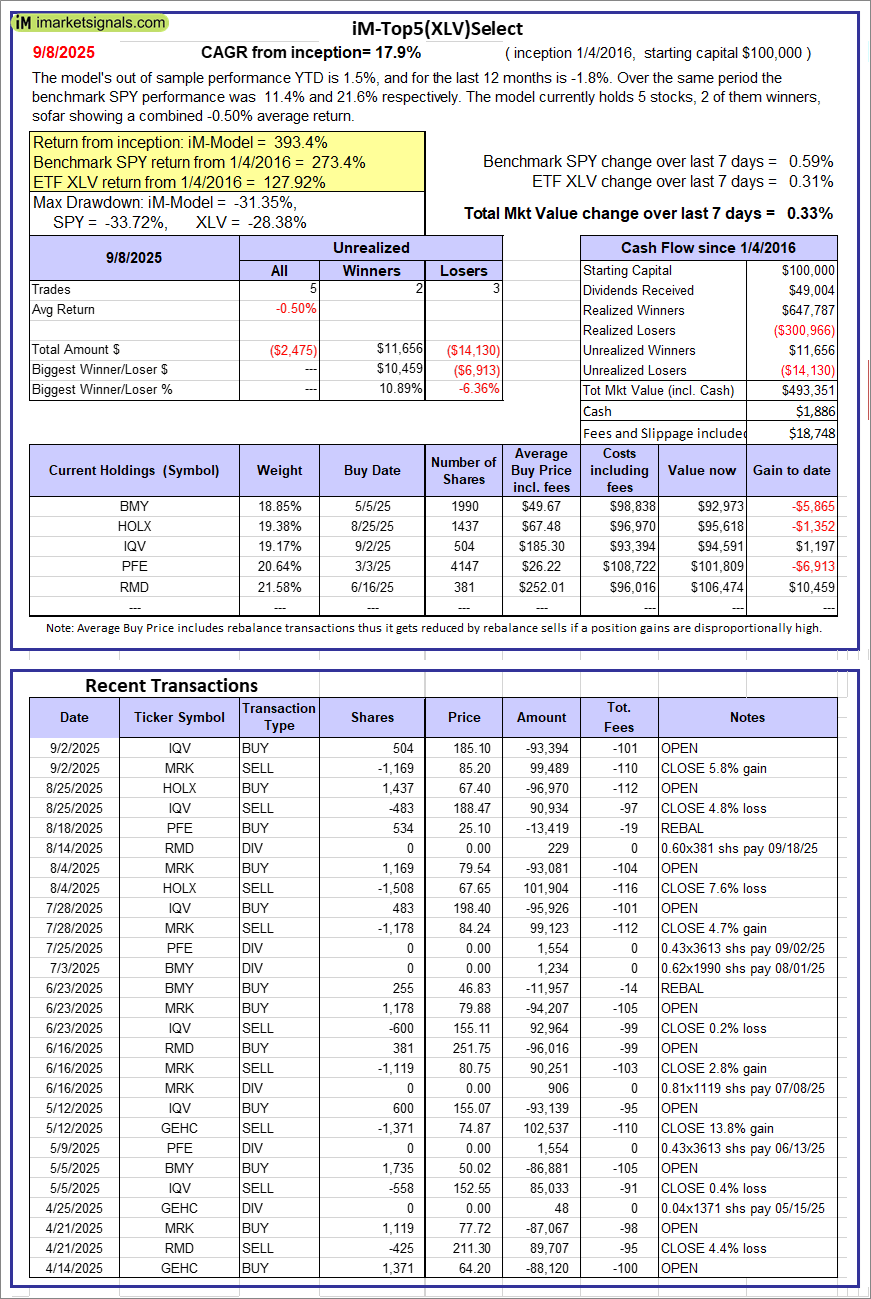 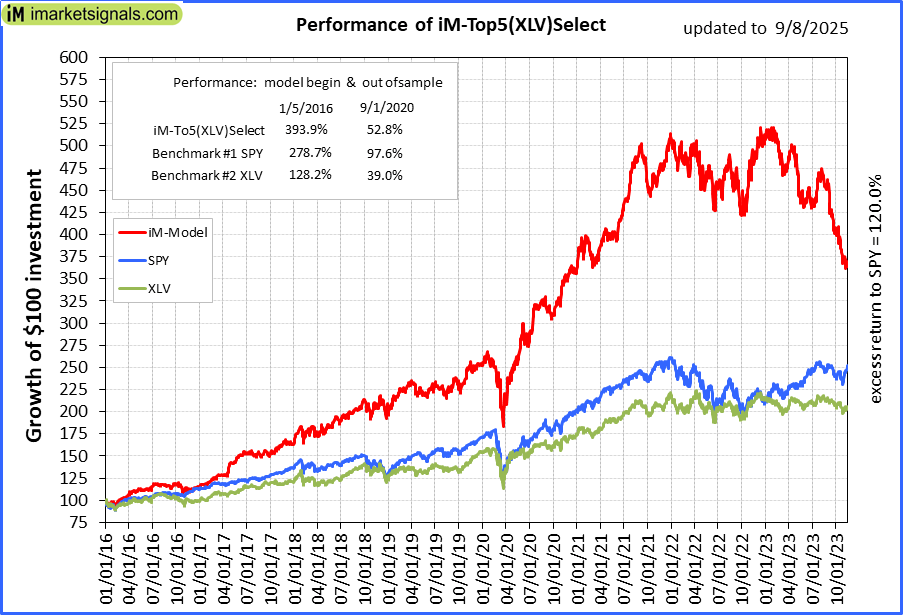 |
iM-Top5(XLV)Select: Since inception, on 1/5/2016, the model gained 393.35% while the benchmark SPY gained 273.37% over the same period. Over the previous week the market value of iM-Top5(XLV)Select gained 0.33% at a time when SPY gained 0.59%. A starting capital of $100,000 at inception on 1/5/2016 would have grown to $493,351 which includes $1,886 cash and excludes $18,748 spent on fees and slippage. |
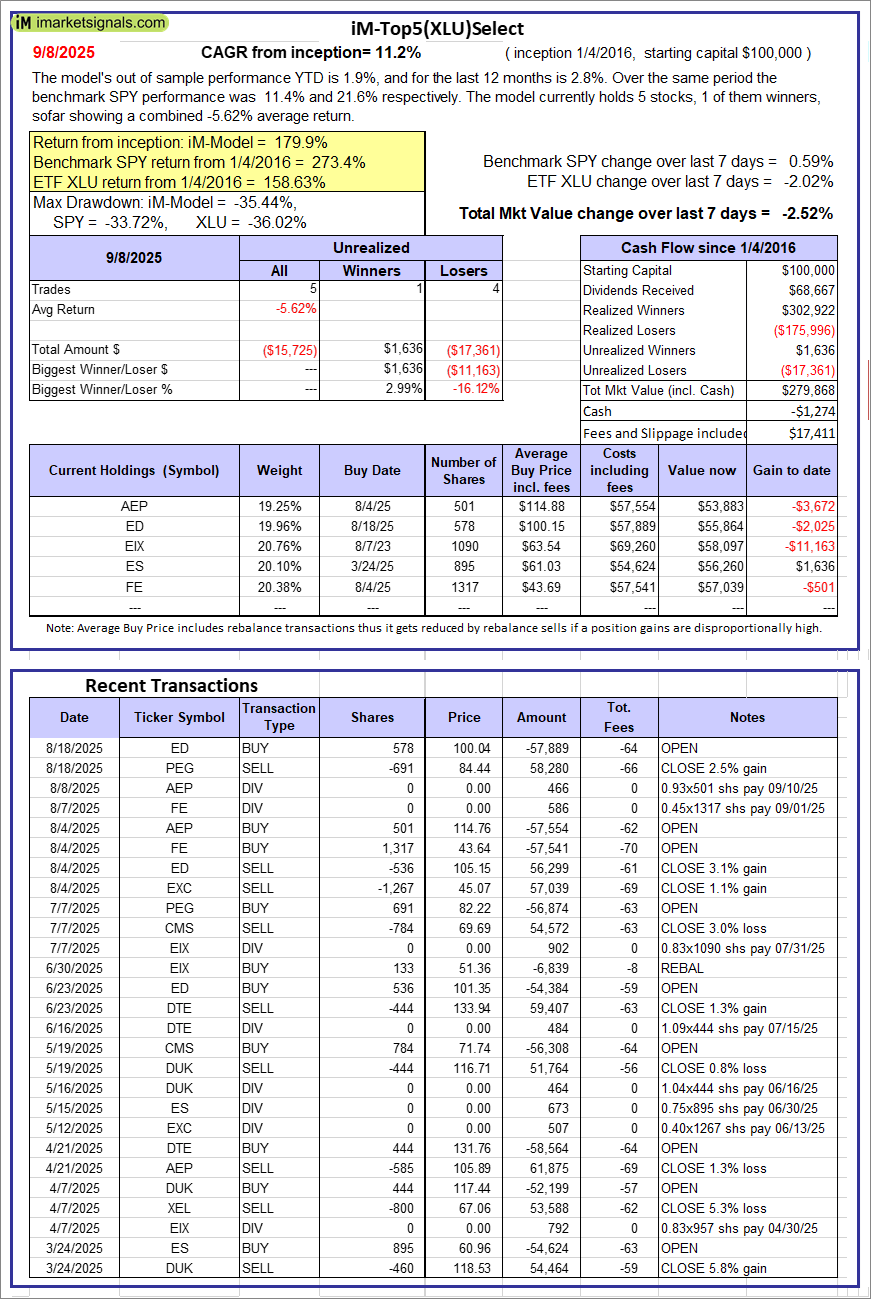 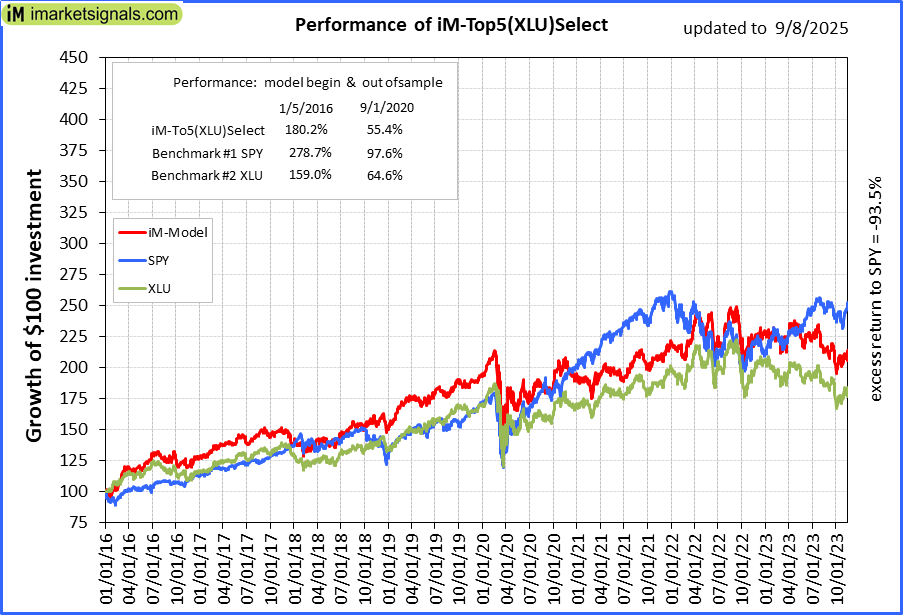 |
iM-Top5(XLU)Select: Since inception, on 1/5/2016, the model gained 179.87% while the benchmark SPY gained 273.37% over the same period. Over the previous week the market value of iM-Top5(XLU)Select gained -2.52% at a time when SPY gained 0.59%. A starting capital of $100,000 at inception on 1/5/2016 would have grown to $279,868 which includes -$1,274 cash and excludes $17,411 spent on fees and slippage. |
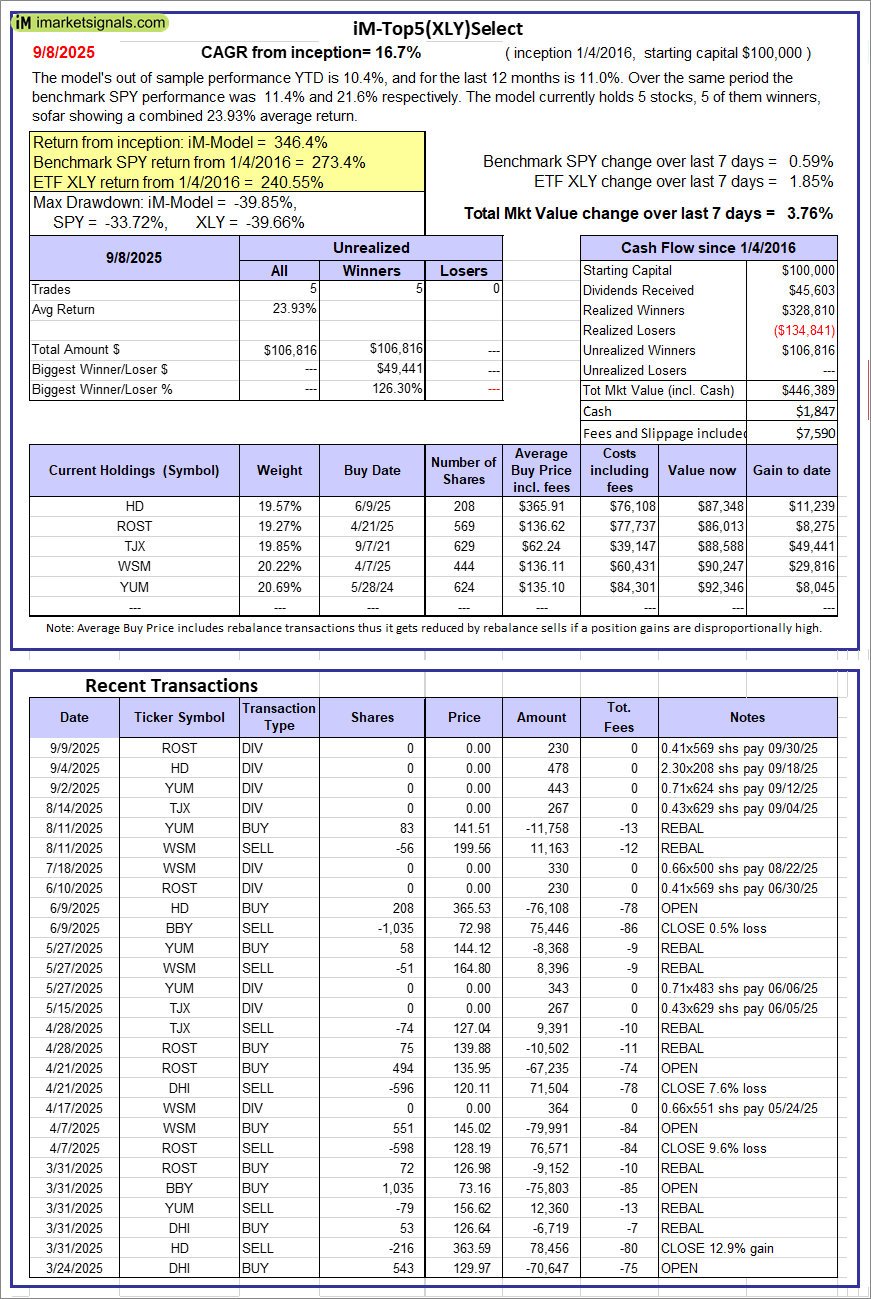 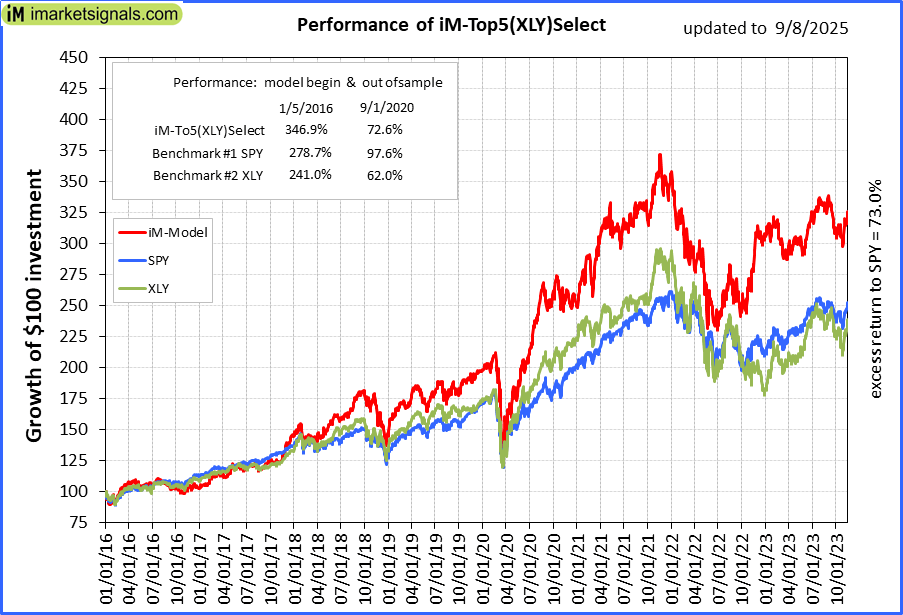 |
iM-Top5(XLY)Select: Since inception, on 1/5/2016, the model gained 346.39% while the benchmark SPY gained 273.37% over the same period. Over the previous week the market value of iM-Top5(XLY)Select gained 3.76% at a time when SPY gained 0.59%. A starting capital of $100,000 at inception on 1/5/2016 would have grown to $446,389 which includes $1,847 cash and excludes $7,590 spent on fees and slippage. |
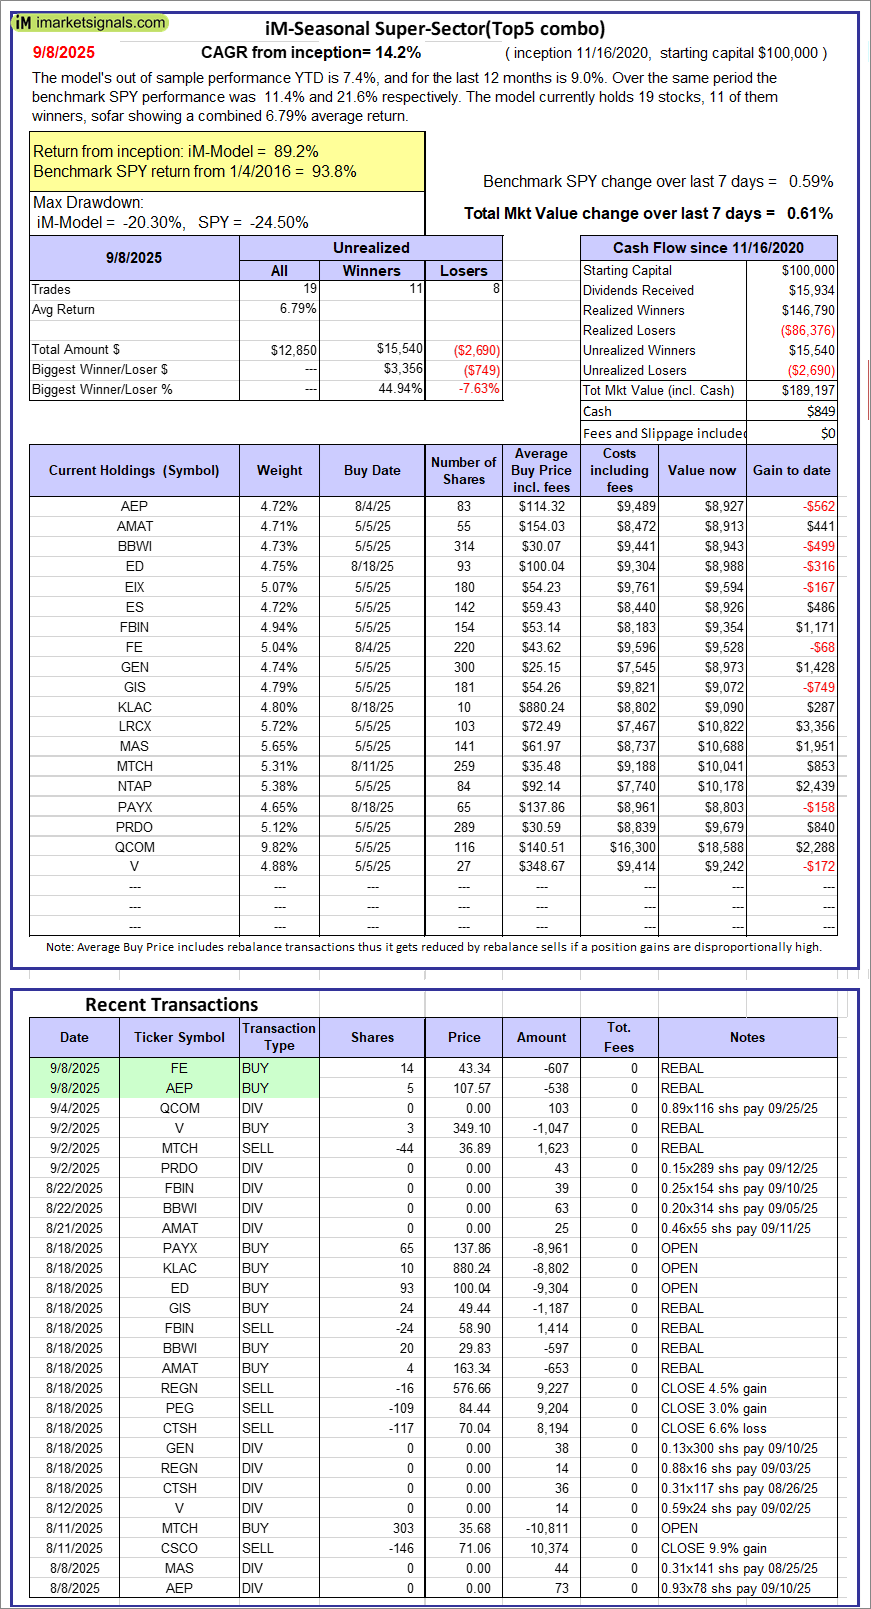 |
iM-Seasonal Super-Sectors (Top5 combo) : Since inception, on 11/17/2020, the model gained 89.20% while the benchmark SPY gained 93.82% over the same period. Over the previous week the market value of iM-Seasonal Super-Sectors (Top5 combo) gained 0.61% at a time when SPY gained 0.59%. A starting capital of $100,000 at inception on 11/17/2020 would have grown to $189,197 which includes $849 cash and excludes $00 spent on fees and slippage. |
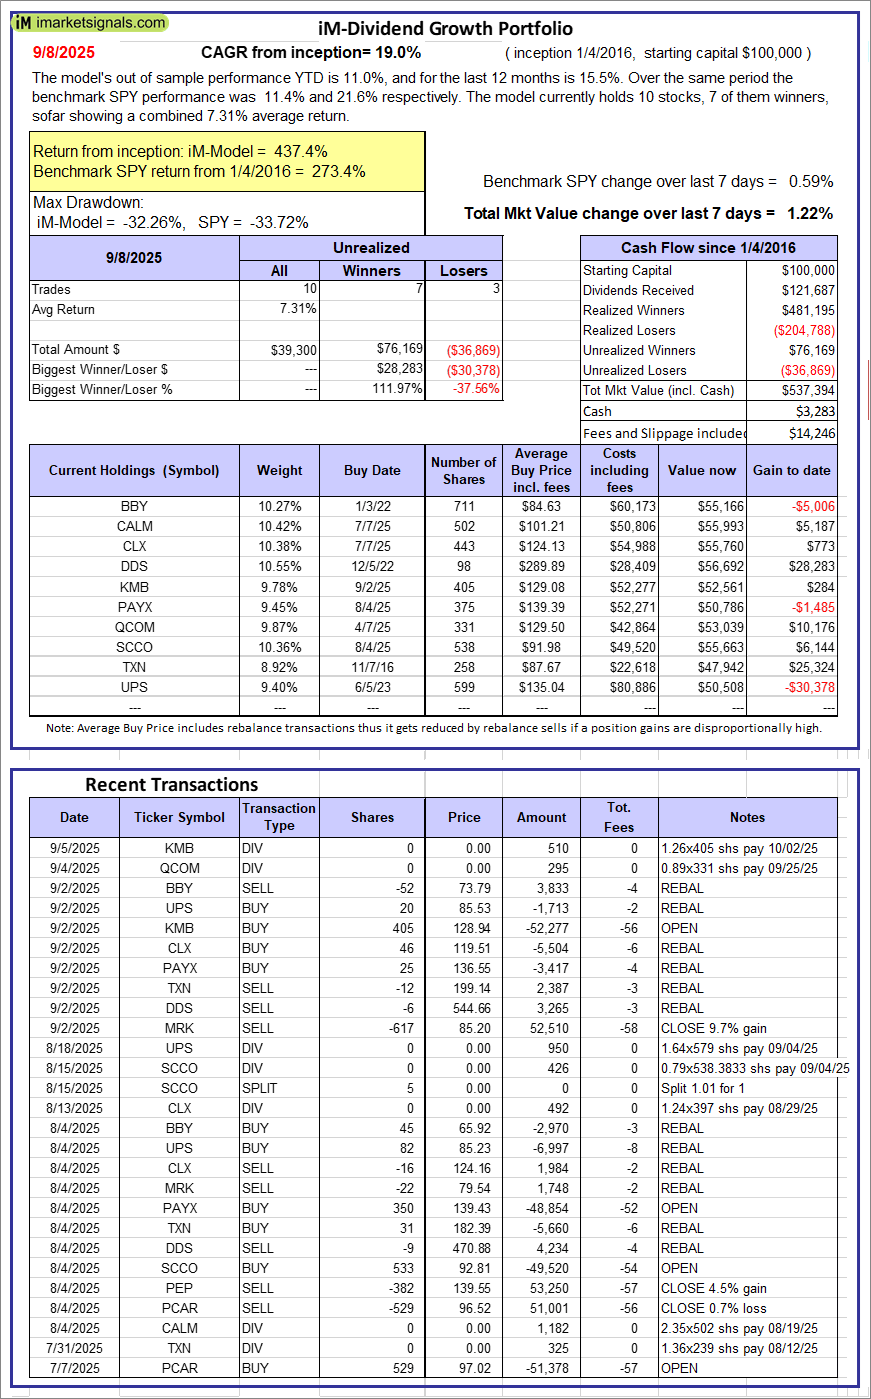 |
iM-Dividend Growth Portfolio: The model’s out of sample performance YTD is 11.0%, and for the last 12 months is 15.5%. Over the same period the benchmark SPY performance was 11.4% and 21.6% respectively. Over the previous week the market value of the iM-Dividend Growth Portfolio gained 1.22% at a time when SPY gained 0.59%. A starting capital of $100,000 at inception on 6/30/2016 would have grown to $537,394 which includes $3,283 cash and excludes $14,246 spent on fees and slippage. |
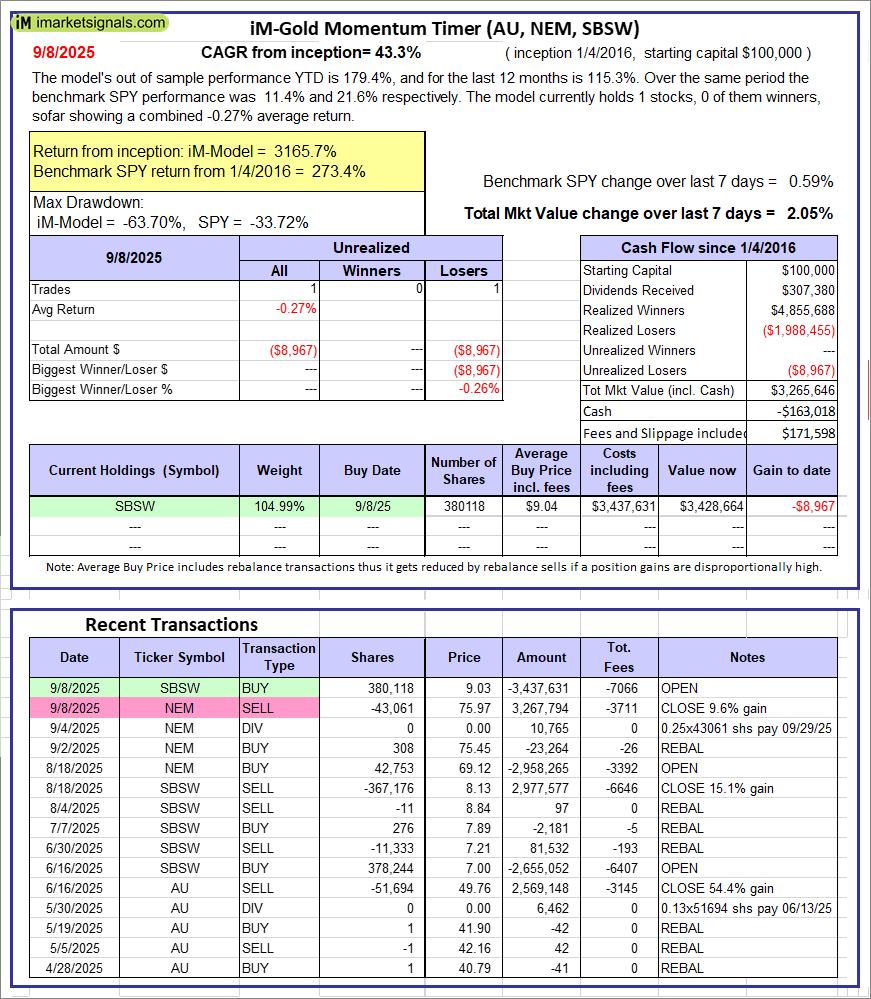 |
iM-Gold Momentum Timer (AU, NEM, SBSW): The model’s out of sample performance YTD is 179.4%, and for the last 12 months is 115.3%. Over the same period the benchmark SPY performance was 11.4% and 21.6% respectively. Over the previous week the market value of iM-Gold Momentum Timer (AU, NEM, SBSW) gained 2.05% at a time when SPY gained 0.59%. A starting capital of $100,000 at inception on 6/30/2016 would have grown to -$163,018 which includes $171,598 cash and excludes Gain to date spent on fees and slippage. |
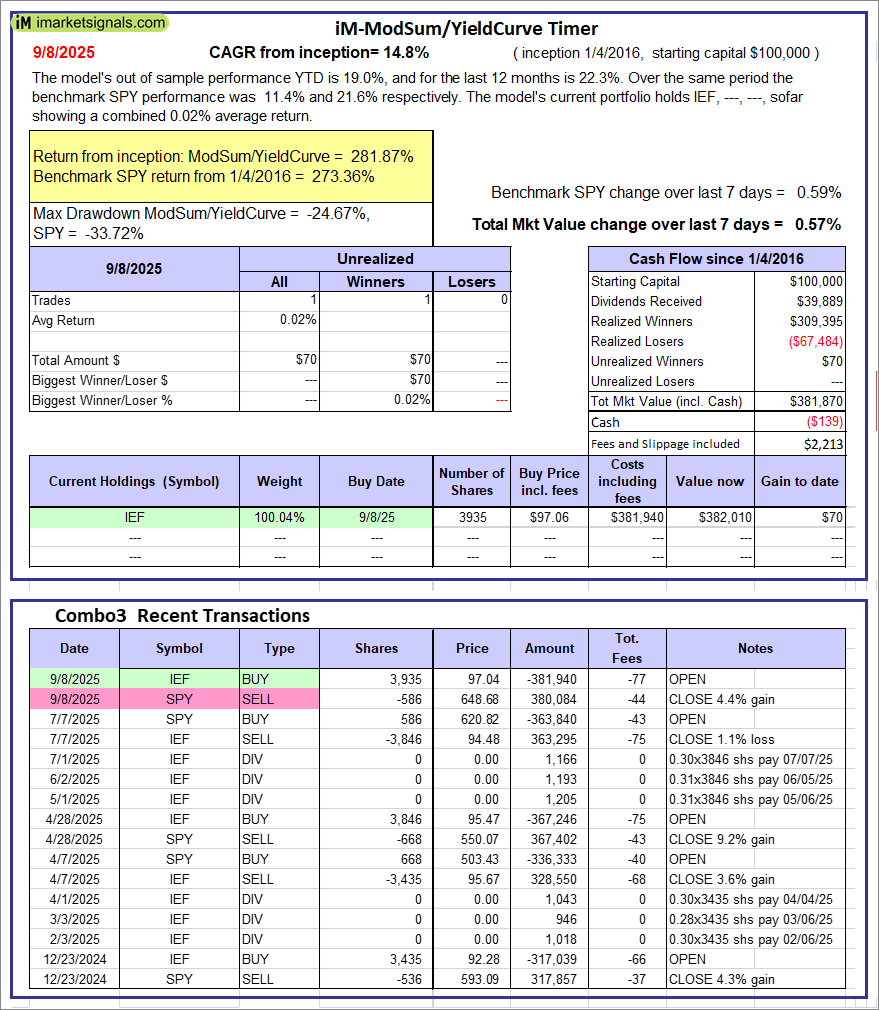 |
iM-ModSum/YieldCurve Timer: The model’s out of sample performance YTD is 19.0%, and for the last 12 months is 22.3%. Over the same period the benchmark SPY performance was 11.4% and 21.6% respectively. Over the previous week the market value of iM-PortSum/YieldCurve Timer gained 0.57% at a time when SPY gained 0.59%. A starting capital of $100,000 at inception on 1/1/2016 would have grown to $381,870 which includes -$139 cash and excludes $2,213 spent on fees and slippage. |
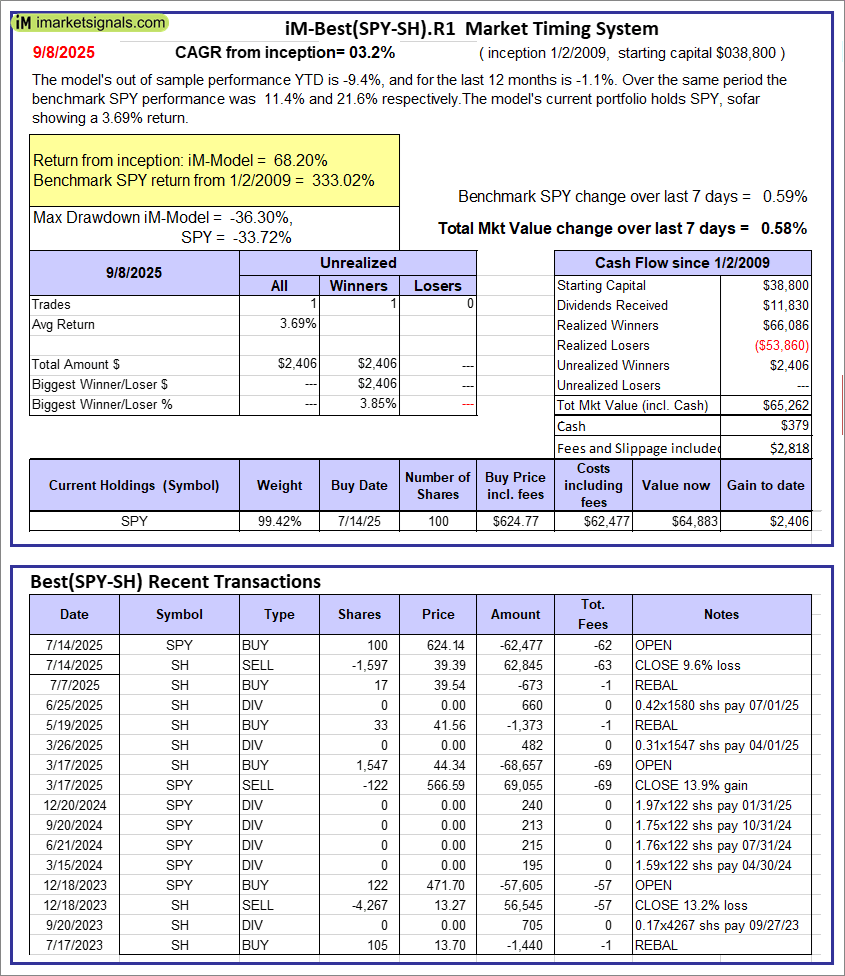 |
iM-Best(SPY-SH).R1: The model’s out of sample performance YTD is -9.4%, and for the last 12 months is -1.1%. Over the same period the benchmark SPY performance was 11.4% and 21.6% respectively. Over the previous week the market value of Best(SPY-SH) gained 0.58% at a time when SPY gained 0.59%. A starting capital of $100,000 at inception on 1/2/2009 would have grown to $65,262 which includes $379 cash and excludes $2,818 spent on fees and slippage. |
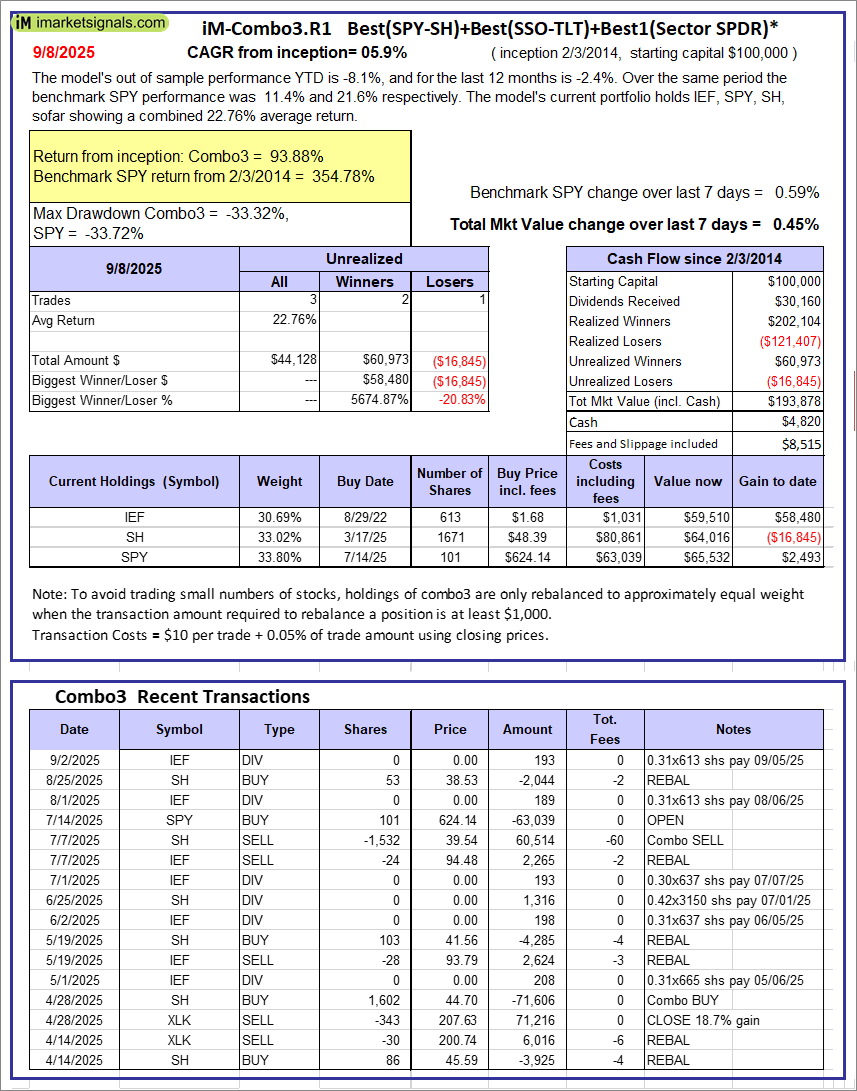 |
iM-Combo3.R1: The model’s out of sample performance YTD is -8.1%, and for the last 12 months is -2.4%. Over the same period the benchmark SPY performance was 11.4% and 21.6% respectively. Over the previous week the market value of iM-Combo3.R1 gained 0.45% at a time when SPY gained 0.59%. A starting capital of $100,000 at inception on 2/3/2014 would have grown to $193,878 which includes $4,820 cash and excludes $8,515 spent on fees and slippage. |
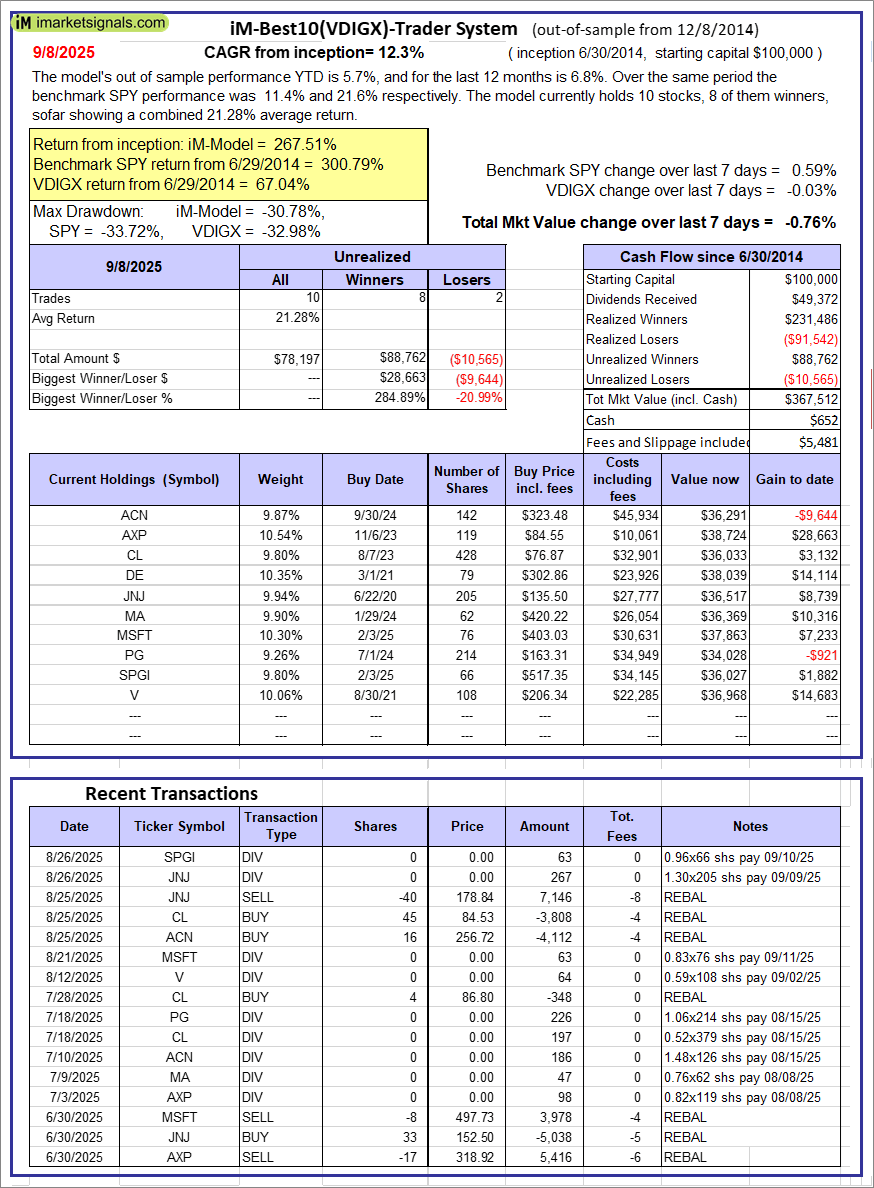 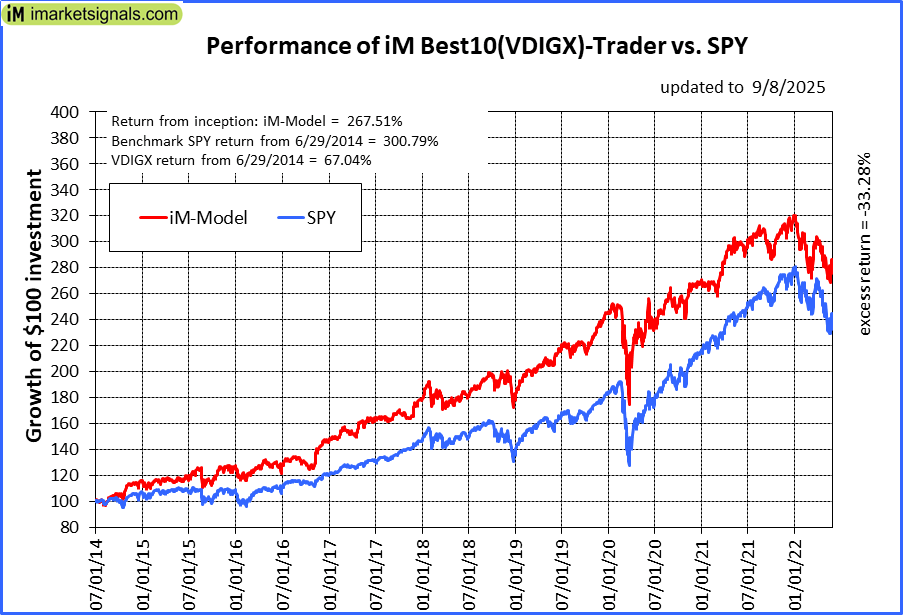 |
iM-Best10(VDIGX)-Trader: The model’s out of sample performance YTD is 5.7%, and for the last 12 months is 6.8%. Over the same period the benchmark SPY performance was 11.4% and 21.6% respectively. Since inception, on 7/1/2014, the model gained 267.51% while the benchmark SPY gained 300.79% and VDIGX gained 67.04% over the same period. Over the previous week the market value of iM-Best10(VDIGX) gained -0.76% at a time when SPY gained 0.59%. A starting capital of $100,000 at inception on 7/1/2014 would have grown to $367,512 which includes $652 cash and excludes $5,481 spent on fees and slippage. |
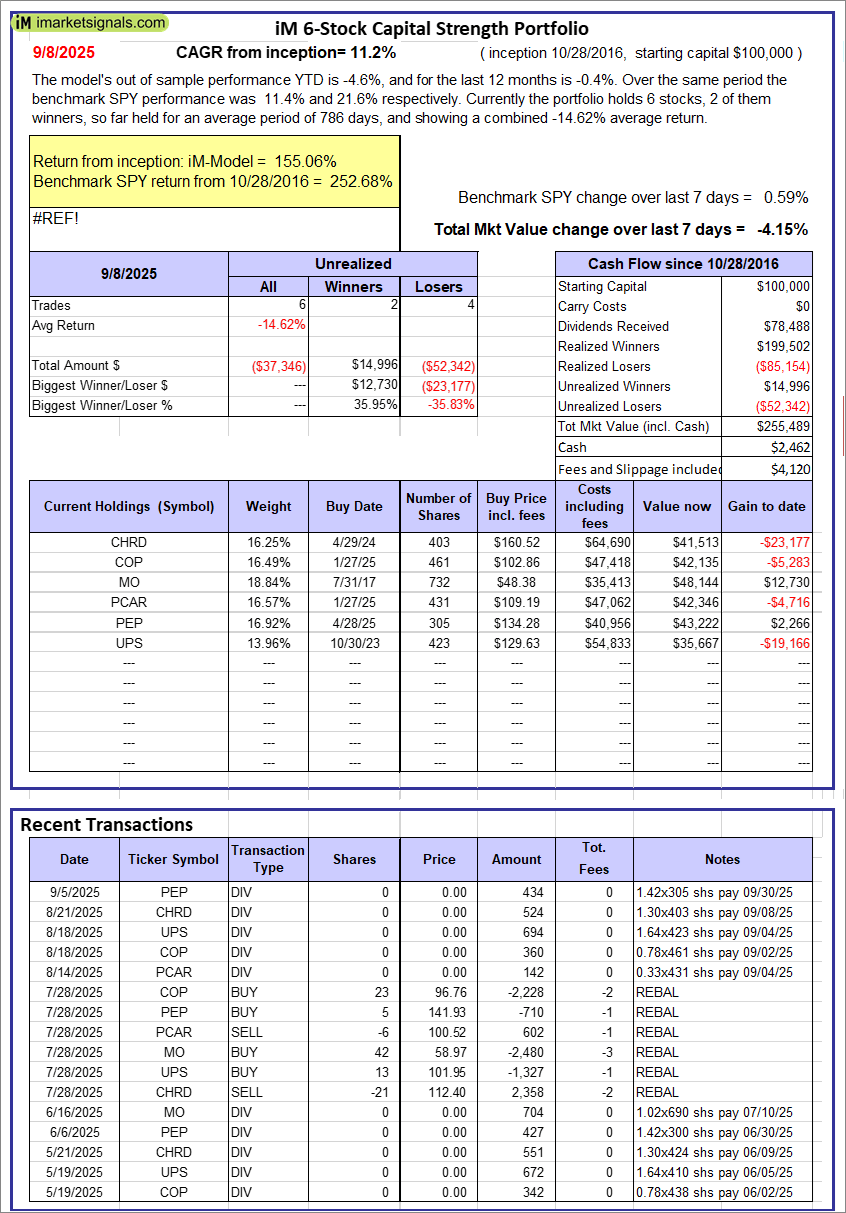 |
iM 6-Stock Capital Strength Portfolio: The model’s out of sample performance YTD is -4.6%, and for the last 12 months is -0.4%. Over the same period the benchmark SPY performance was 11.4% and 21.6% respectively. Over the previous week the market value of the iM 6-Stock Capital Strength Portfolio gained -4.15% at a time when SPY gained 0.59%. A starting capital of $100,000 at inception on 10/28/2016 would have grown to $255,489 which includes $2,462 cash and excludes $4,120 spent on fees and slippage. |
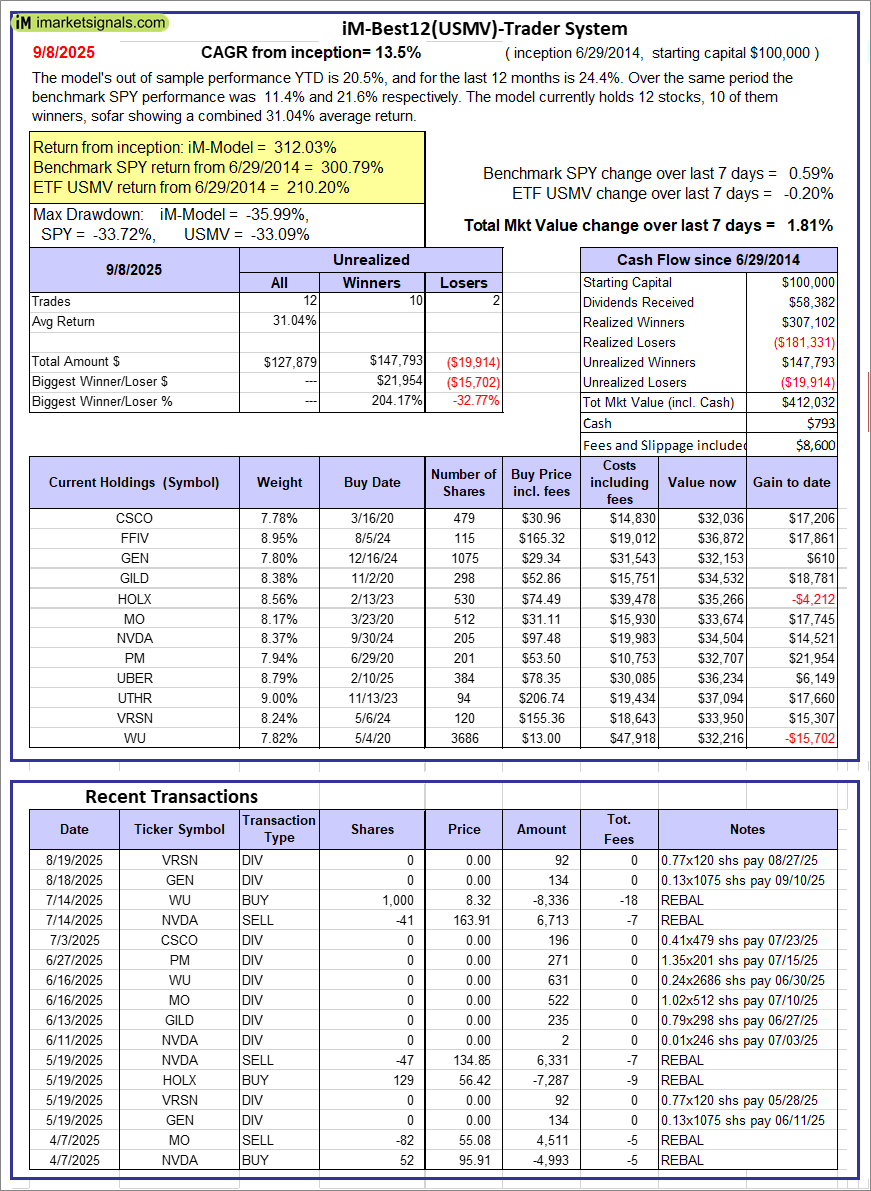 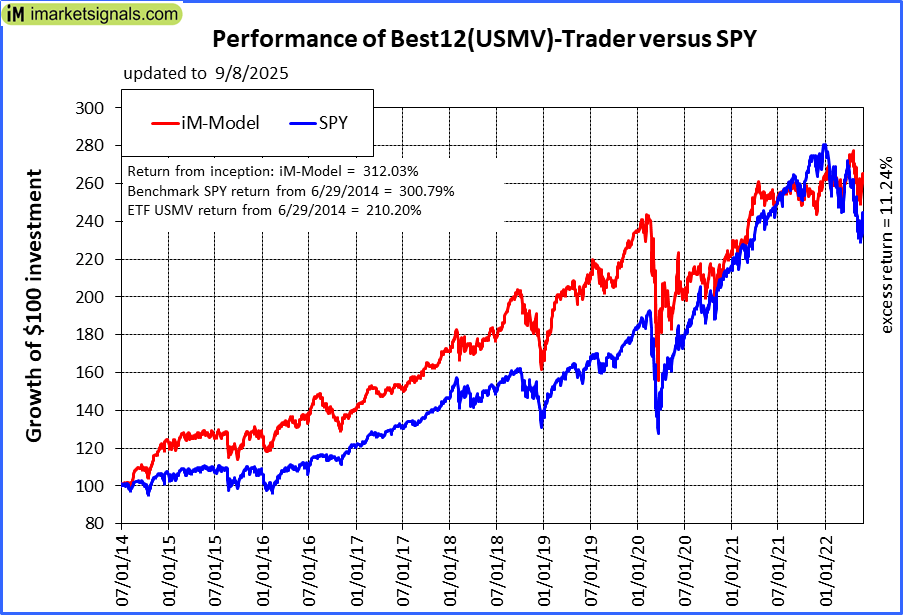 |
iM-Best12(USMV)-Trader: The model’s out of sample performance YTD is 20.5%, and for the last 12 months is 24.4%. Over the same period the benchmark SPY performance was 11.4% and 21.6% respectively. Since inception, on 6/30/2014, the model gained 312.03% while the benchmark SPY gained 300.79% and the ETF USMV gained 210.20% over the same period. Over the previous week the market value of iM-Best12(USMV)-Trader gained 1.81% at a time when SPY gained 0.59%. A starting capital of $100,000 at inception on 6/30/2014 would have grown to $412,032 which includes $793 cash and excludes $8,600 spent on fees and slippage. |
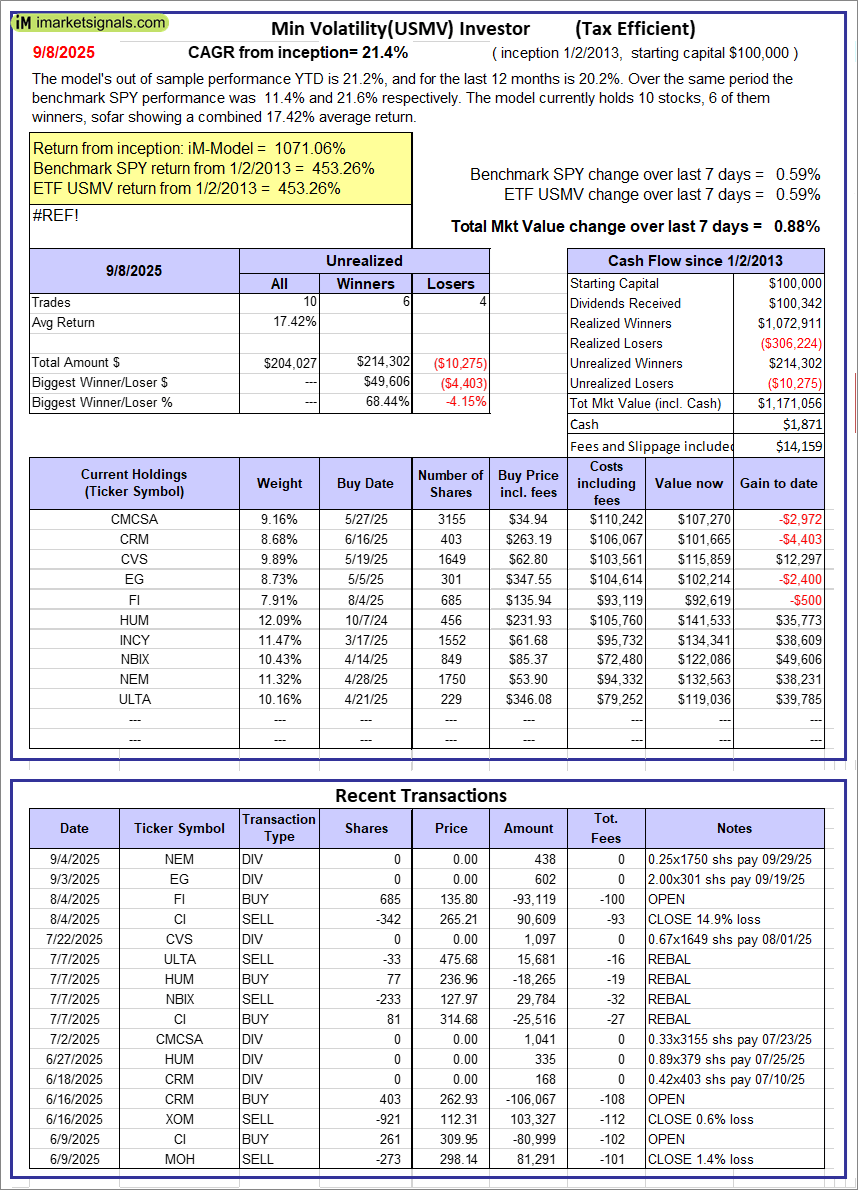 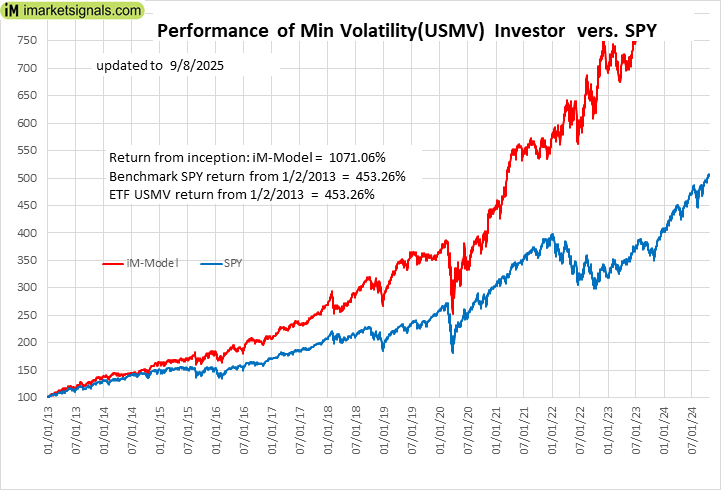 |
iM-Min Volatility(USMV) Investor (Tax Efficient): The model’s out of sample performance YTD is 21.2%, and for the last 12 months is 20.2%. Over the same period the benchmark SPY performance was 11.4% and 21.6% respectively. Since inception, on 1/3/2013, the model gained 1071.06% while the benchmark SPY gained 453.26% and the ETF USMV gained 453.26% over the same period. Over the previous week the market value of iM-Best12(USMV)Q1 gained 0.88% at a time when SPY gained 0.59%. A starting capital of $100,000 at inception on 1/3/2013 would have grown to $1,171,056 which includes $1,871 cash and excludes $14,159 spent on fees and slippage. |
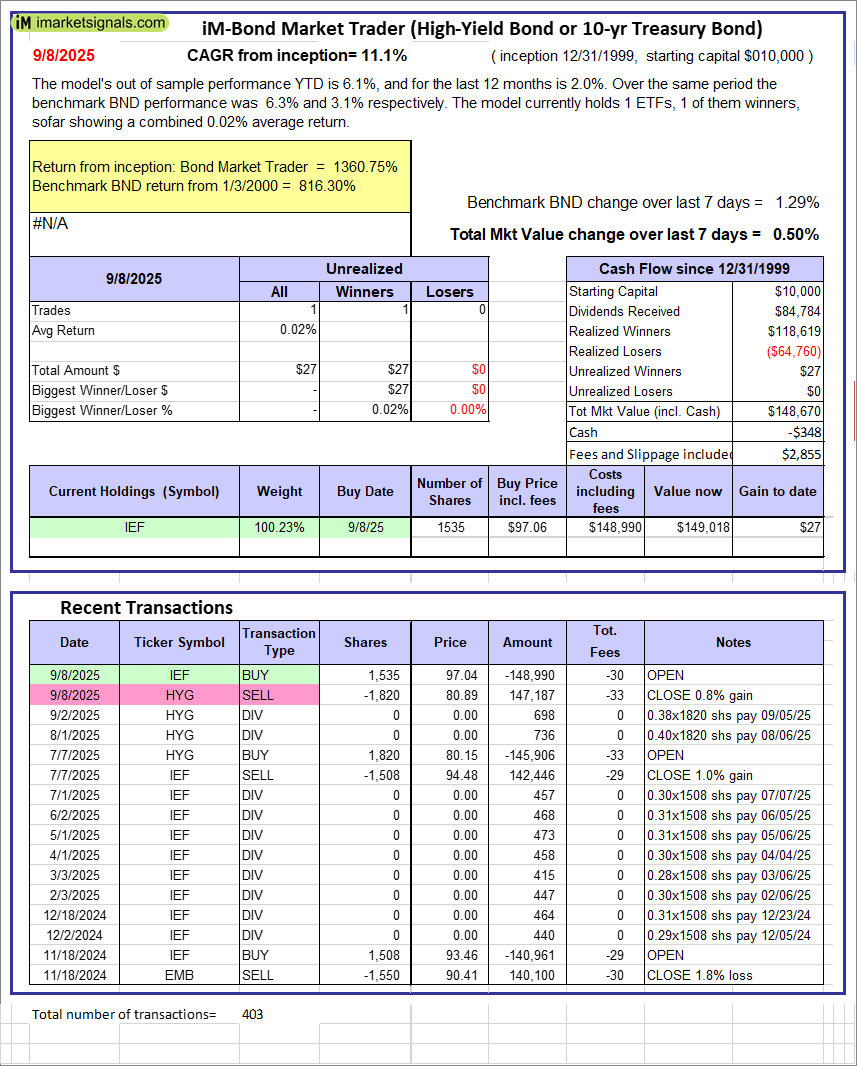 |
iM-Bond Market Trader (High-Yield Bond or 10-yr Treasury Bond): The model’s out of sample performance YTD is 6.1%, and for the last 12 months is 2.0%. Over the same period the benchmark BND performance was 6.3% and 3.1% respectively. Over the previous week the market value of the iM-Bond Market Trader (High-Yield Bond or 10-yr Treasury Bond) gained 0.50% at a time when BND gained 1.29%. A starting capital of $10,000 at inception on 1/3/2000 would have grown to $148,670 which includes -$348 cash and excludes $2,855 spent on fees and slippage. |
|
|
iM-ModSum/YieldCurve Timer: The model’s out of sample performance YTD is 19.0%, and for the last 12 months is 22.3%. Over the same period the benchmark SPY performance was 11.4% and 21.6% respectively. Over the previous week the market value of iM-PortSum/YieldCurve Timer gained 0.57% at a time when SPY gained 0.59%. A starting capital of $100,000 at inception on 1/1/2016 would have grown to $381,870 which includes -$139 cash and excludes $2,213 spent on fees and slippage. |
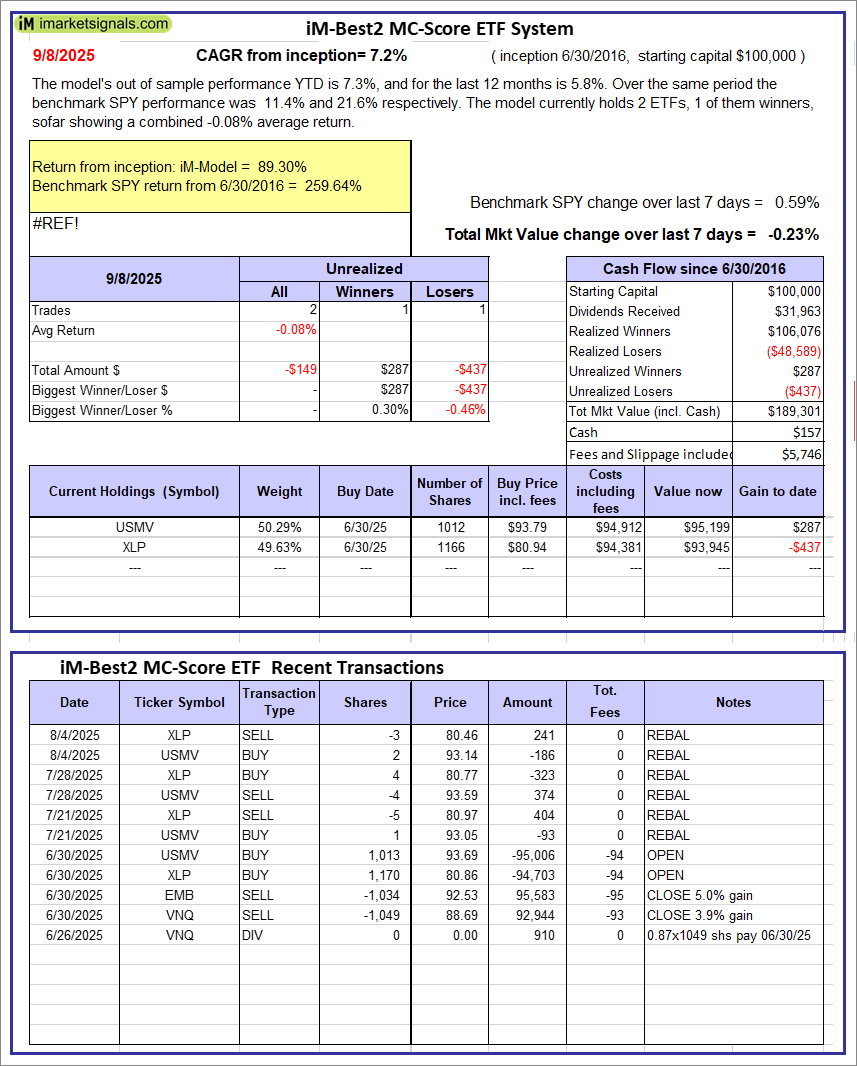 |
iM-Best2 MC-Score ETF System: The model’s out of sample performance YTD is 7.3%, and for the last 12 months is 5.8%. Over the same period the benchmark SPY performance was 11.4% and 21.6% respectively. Over the previous week the market value of the iM-Best2 MC-Score ETF System gained -0.23% at a time when SPY gained 0.59%. A starting capital of $100,000 at inception on 6/30/2016 would have grown to $189,301 which includes $157 cash and excludes $5,746 spent on fees and slippage. |
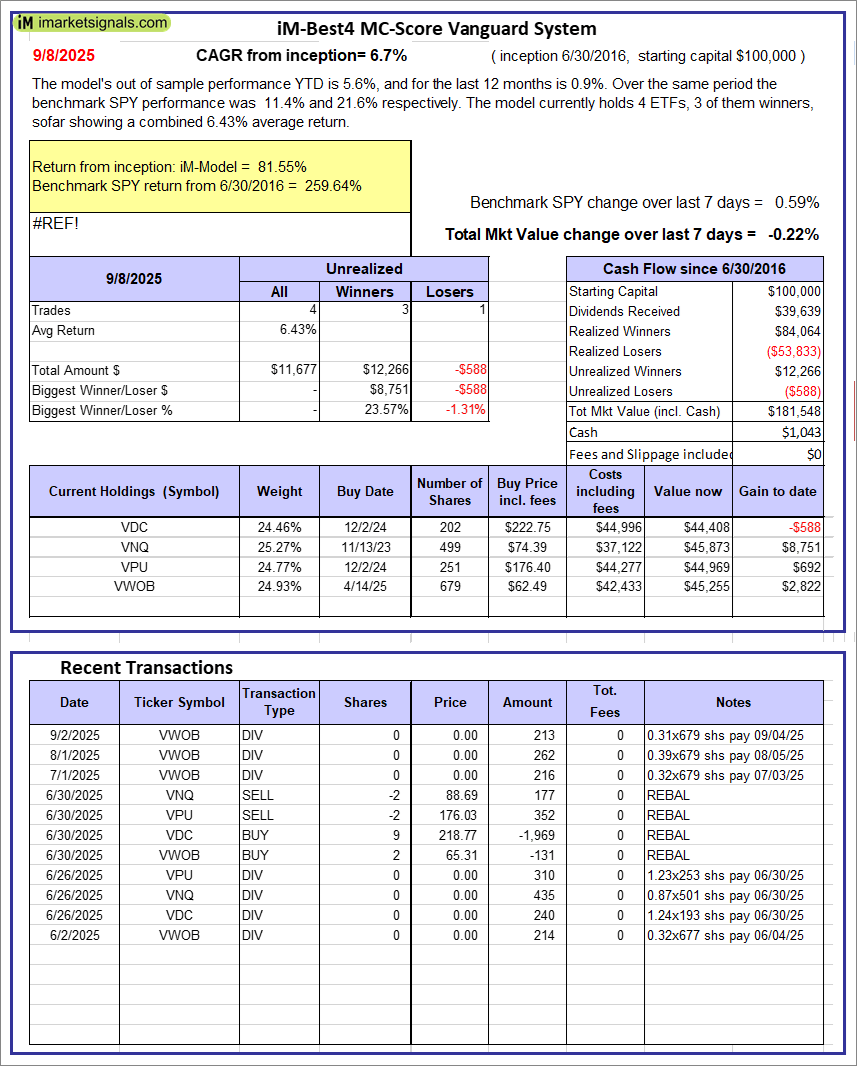 |
iM-Best4 MC-Score Vanguard System: The model’s out of sample performance YTD is 5.6%, and for the last 12 months is 0.9%. Over the same period the benchmark SPY performance was 11.4% and 21.6% respectively. Over the previous week the market value of the iM-Best4 MC-Score Vanguard System gained -0.22% at a time when SPY gained 0.59%. A starting capital of $100,000 at inception on 6/30/2016 would have grown to $181,548 which includes $1,043 cash and excludes $00 spent on fees and slippage. |
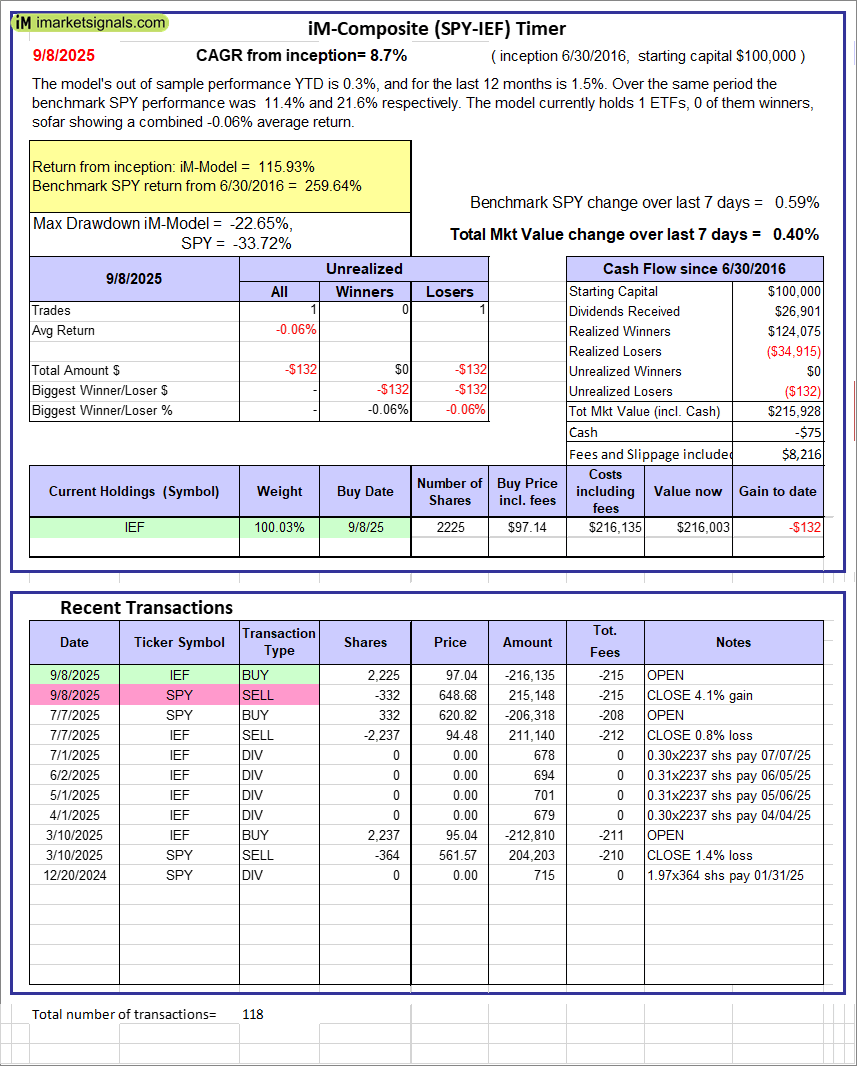 |
iM-Composite (SPY-IEF) Timer: The model’s out of sample performance YTD is 0.3%, and for the last 12 months is 1.5%. Over the same period the benchmark SPY performance was 11.4% and 21.6% respectively. Over the previous week the market value of the iM-Composite (SPY-IEF) Timer gained 0.40% at a time when SPY gained 0.59%. A starting capital of $100,000 at inception on 6/30/2016 would have grown to $215,928 which includes -$75 cash and excludes $8,216 spent on fees and slippage. |
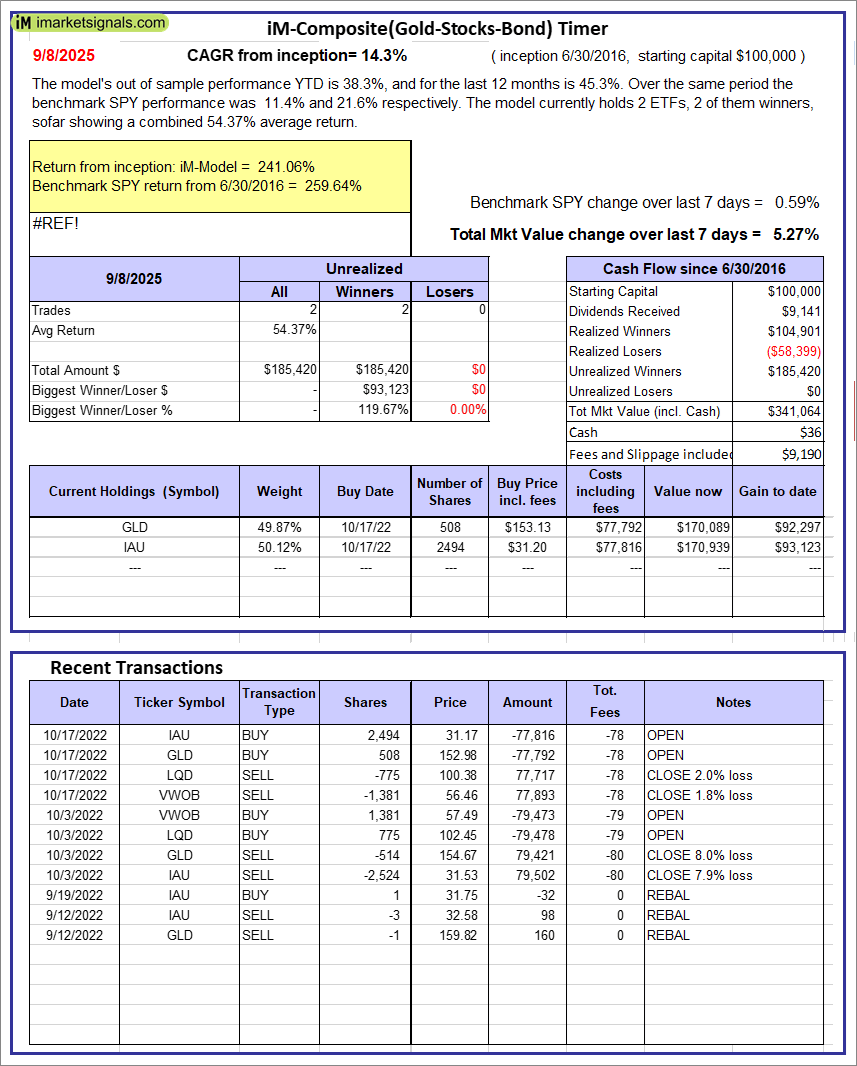 |
iM-Composite(Gold-Stocks-Bond) Timer: The model’s out of sample performance YTD is 38.3%, and for the last 12 months is 45.3%. Over the same period the benchmark SPY performance was 11.4% and 21.6% respectively. Over the previous week the market value of the iM-Composite(Gold-Stocks-Bond) Timer gained 5.27% at a time when SPY gained 0.59%. A starting capital of $100,000 at inception on 6/30/2016 would have grown to $341,064 which includes $36 cash and excludes $9,190 spent on fees and slippage. |
iM-Best Reports – 9/8/2025
Posted in pmp SPY-SH
Leave a Reply
You must be logged in to post a comment.