
  |
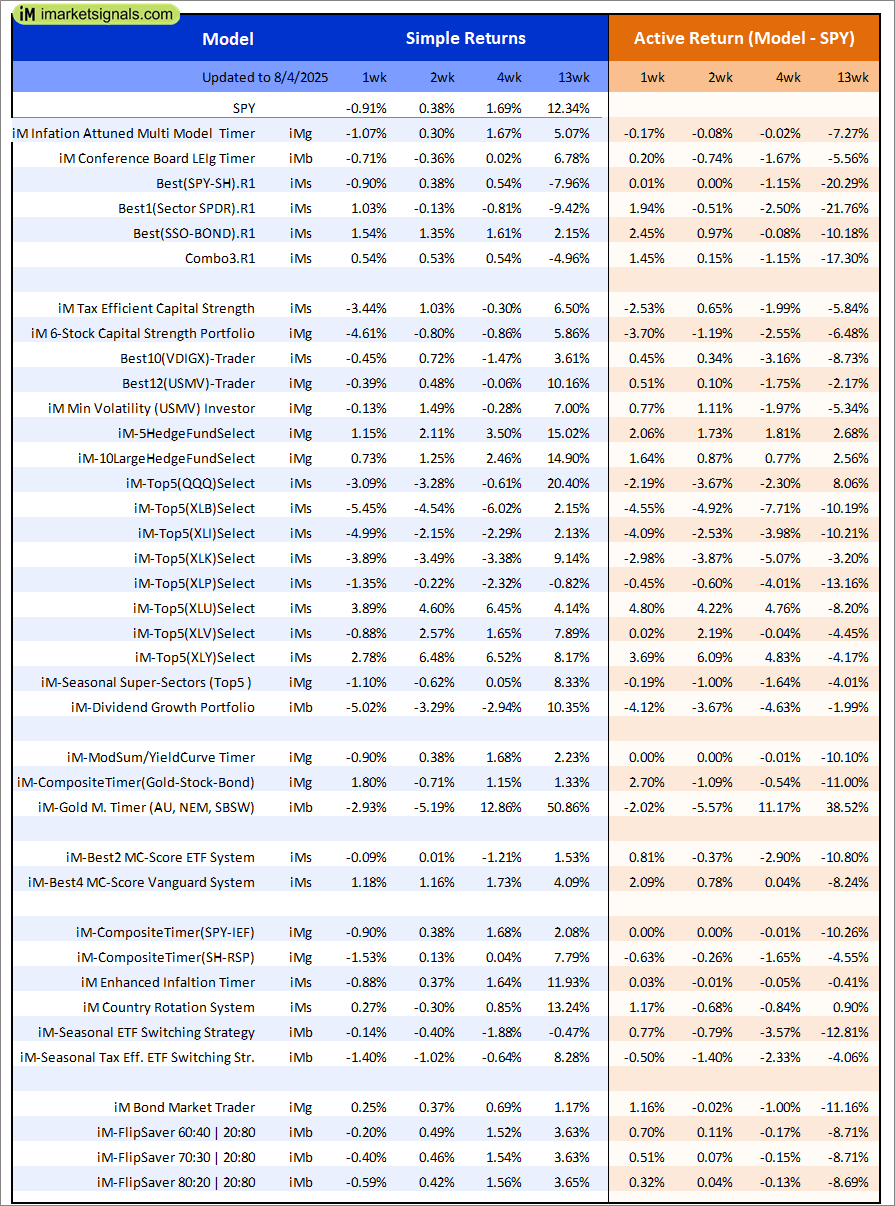
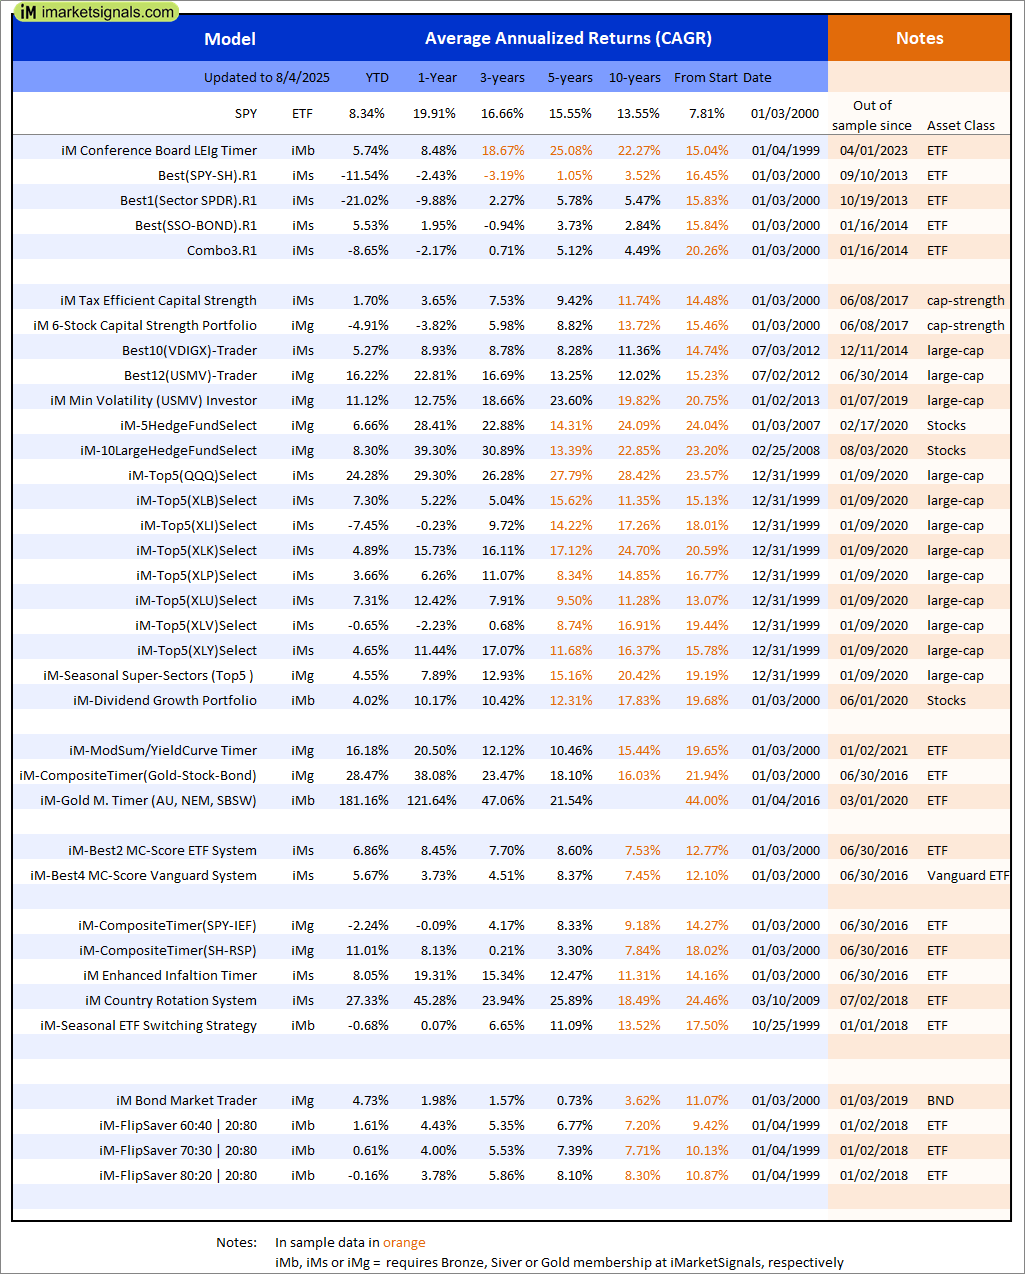
Out of sample performance summary of our models for the past 1, 2, 4 and 13 week periods. The active active return indicates how the models over- or underperformed the benchmark ETF SPY. Also the YTD, and the 1-, 3-, 5- and 10-year annualized returns are shown in the second table |
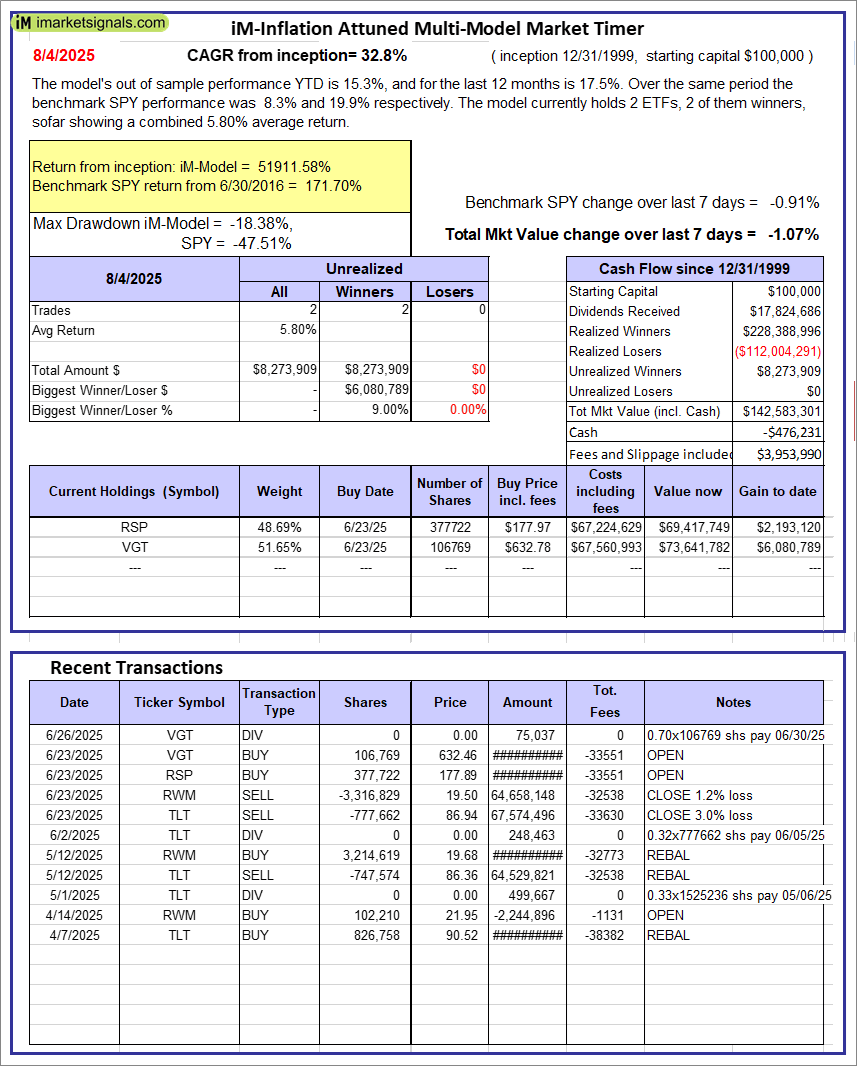 |
iM-Inflation Attuned Multi-Model Market Timer: The model’s out of sample performance YTD is 15.3%, and for the last 12 months is 17.5%. Over the same period the benchmark SPY performance was 8.3% and 19.9% respectively. Over the previous week the market value of the iM-Inflation Attuned Multi-Model Market Timer gained -1.07% at a time when SPY gained -0.91%. A starting capital of $100,000 at inception on 3/24/2017 would have grown to $142,583,301 which includes -$476,231 cash and excludes $3,953,990 spent on fees and slippage. |
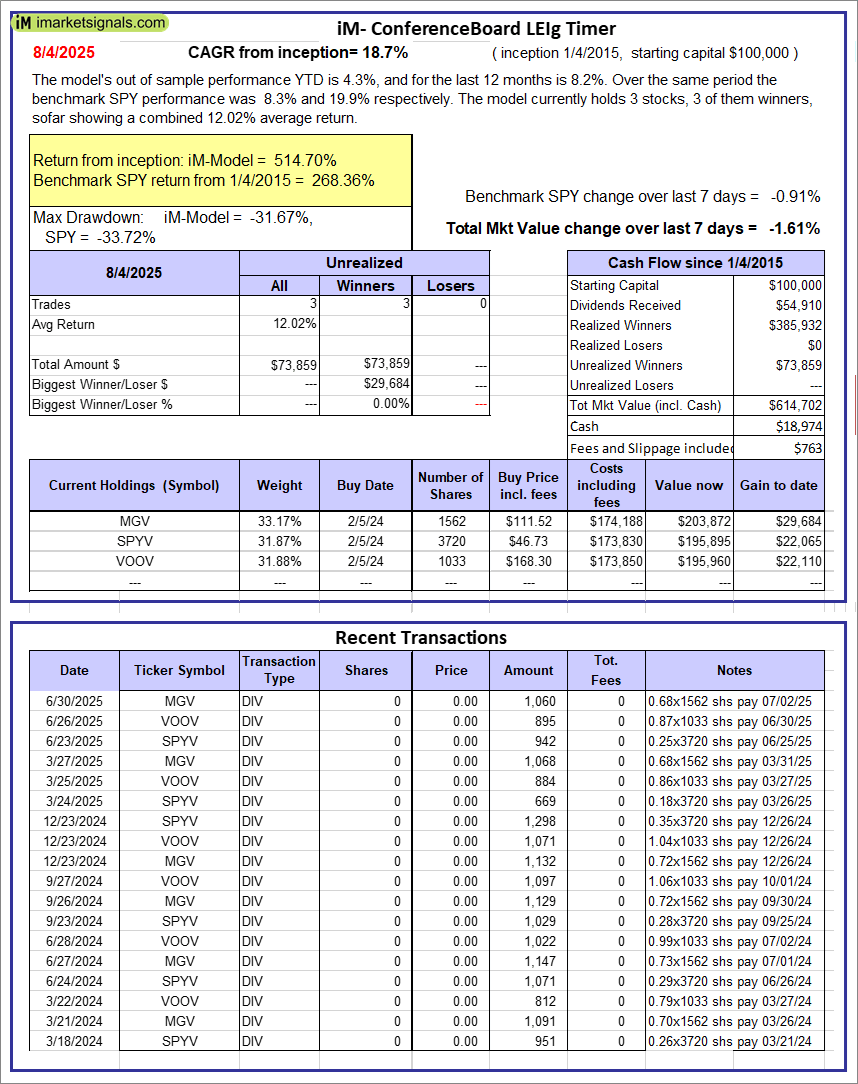 |
iM-Conference Board LEIg Timer: The model’s performance YTD is 14.3%, and for the last 12 months is 7.3%. Over the same period the benchmark SPY performance was 20.1% and 9.4% respectively. Over the previous week the market value of the iM-Conference Board LEIg Timer gained -1.61% at a time when SPY gained -0.91%. A starting capital of $100,000 at inception on 4/5/2017 would have grown to $614,702 which includes $18,974 cash and excludes $763 spent on fees and slippage. |
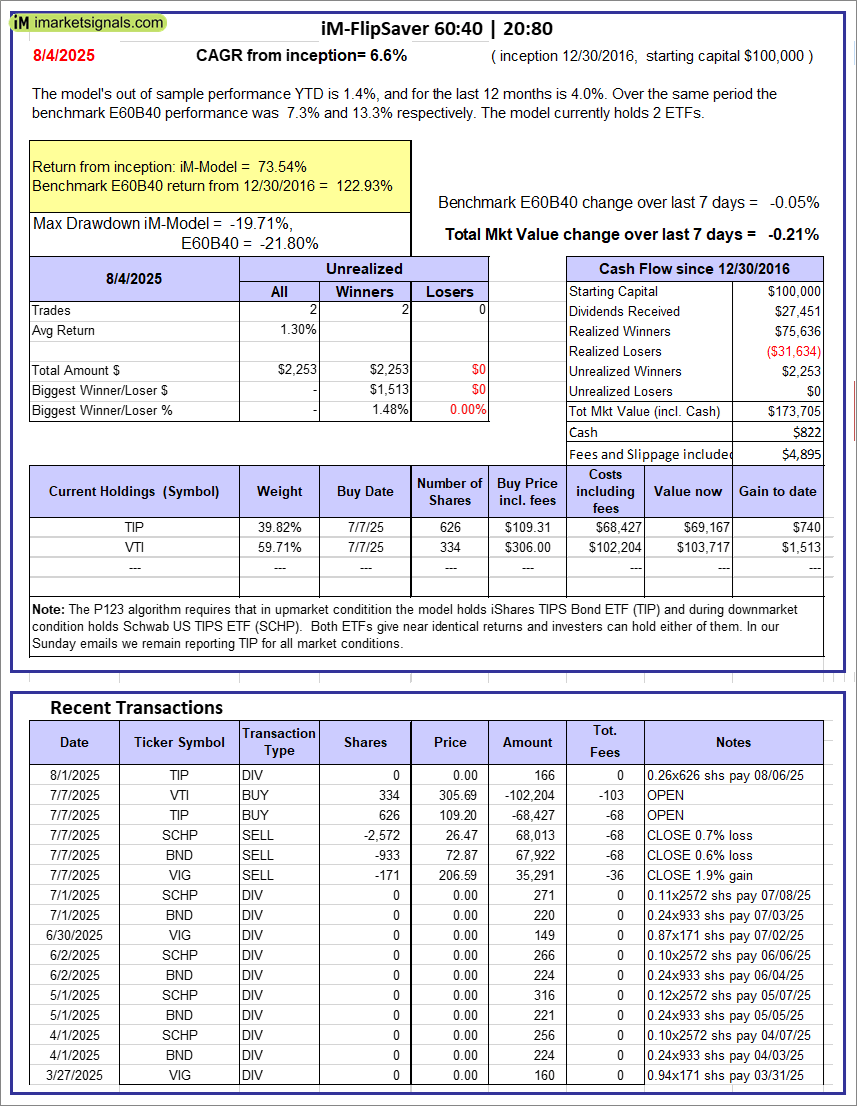 |
iM-FlipSaver 60:40 | 20:80 – 2017: The model’s out of sample performance YTD is 1.4%, and for the last 12 months is 4.0%. Over the same period the benchmark E60B40 performance was 7.3% and 13.3% respectively. Over the previous week the market value of iM-FlipSaver 80:20 | 20:80 gained -0.21% at a time when SPY gained -0.05%. A starting capital of $100,000 at inception on 7/16/2015 would have grown to $173,705 which includes $822 cash and excludes $4,895 spent on fees and slippage. |
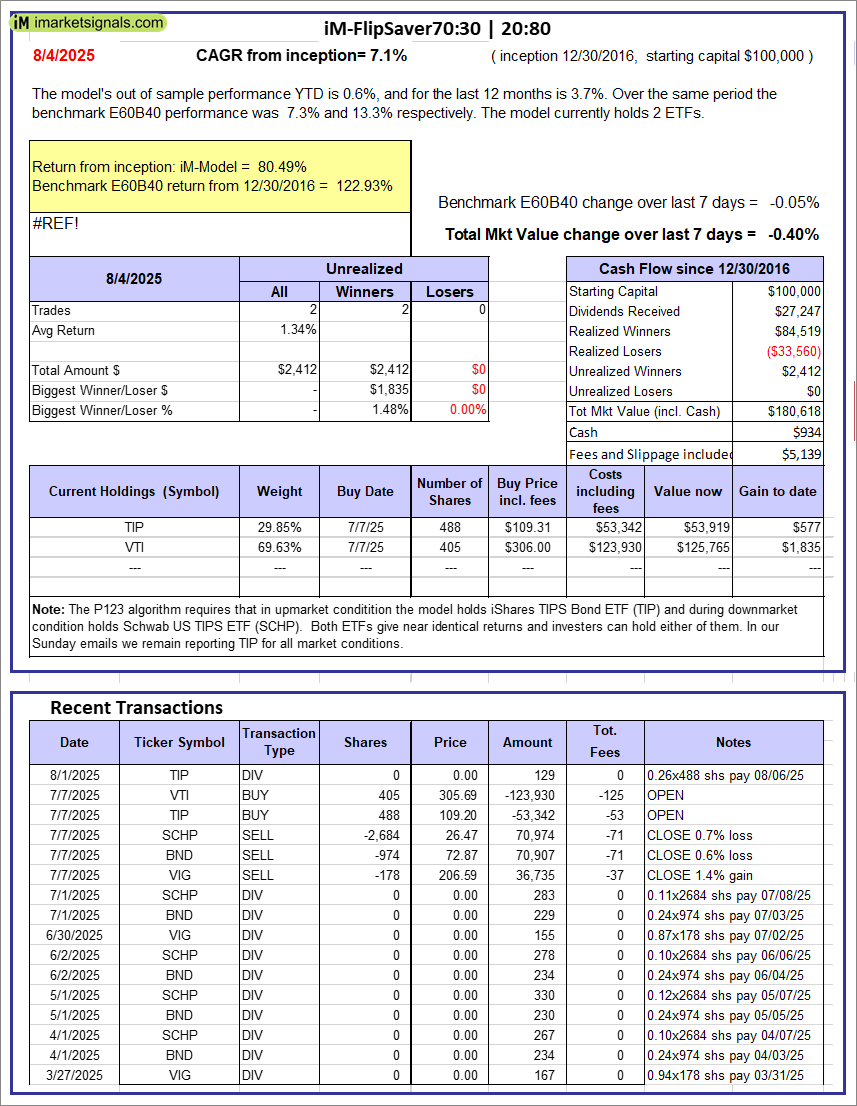 |
iM-FlipSaver 70:30 | 20:80 – 2017: The model’s out of sample performance YTD is 0.6%, and for the last 12 months is 3.7%. Over the same period the benchmark E60B40 performance was 7.3% and 13.3% respectively. Over the previous week the market value of iM-FlipSaver 70:30 | 20:80 gained -0.40% at a time when SPY gained -0.05%. A starting capital of $100,000 at inception on 7/15/2015 would have grown to $180,618 which includes $934 cash and excludes $5,139 spent on fees and slippage. |
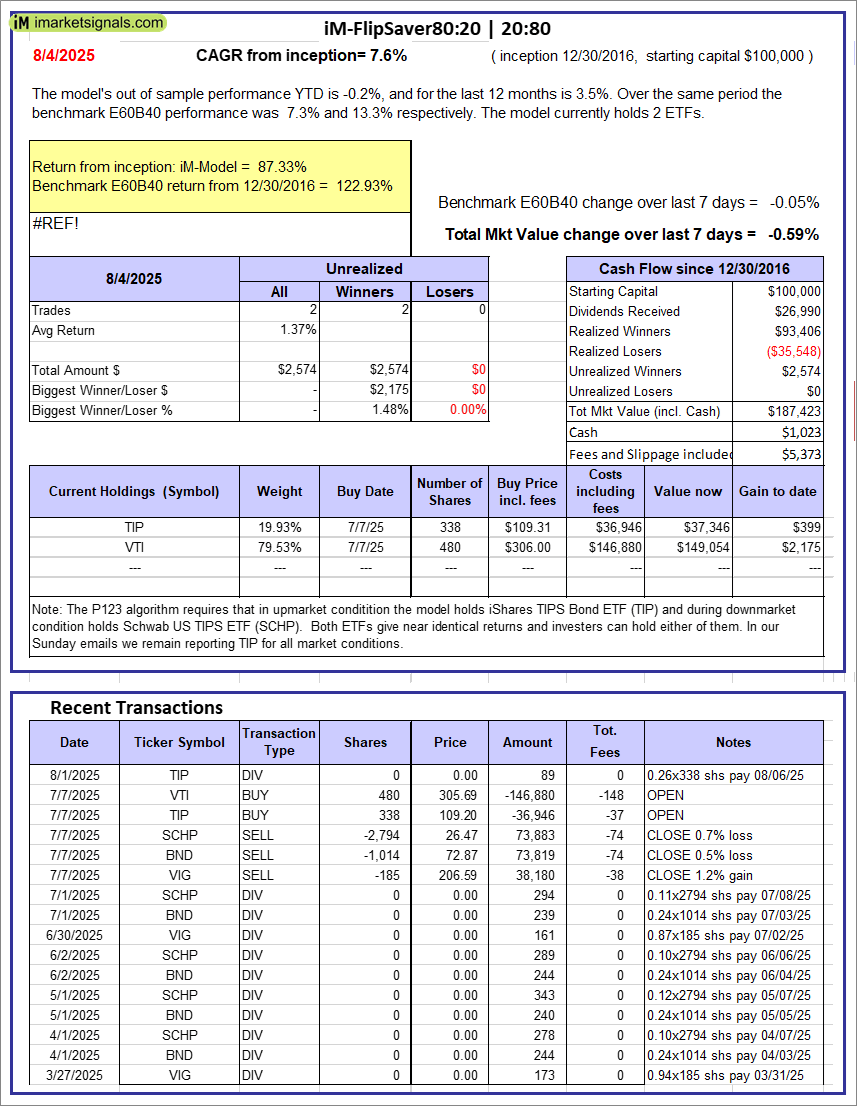 |
iM-FlipSaver 80:20 | 20:80 – 2017: The model’s out of sample performance YTD is -0.2%, and for the last 12 months is 3.5%. Over the same period the benchmark E60B40 performance was 7.3% and 13.3% respectively. Over the previous week the market value of iM-FlipSaver 80:20 | 20:80 gained -0.59% at a time when SPY gained -0.05%. A starting capital of $100,000 at inception on 1/2/2017 would have grown to $187,423 which includes $1,023 cash and excludes $5,373 spent on fees and slippage. |
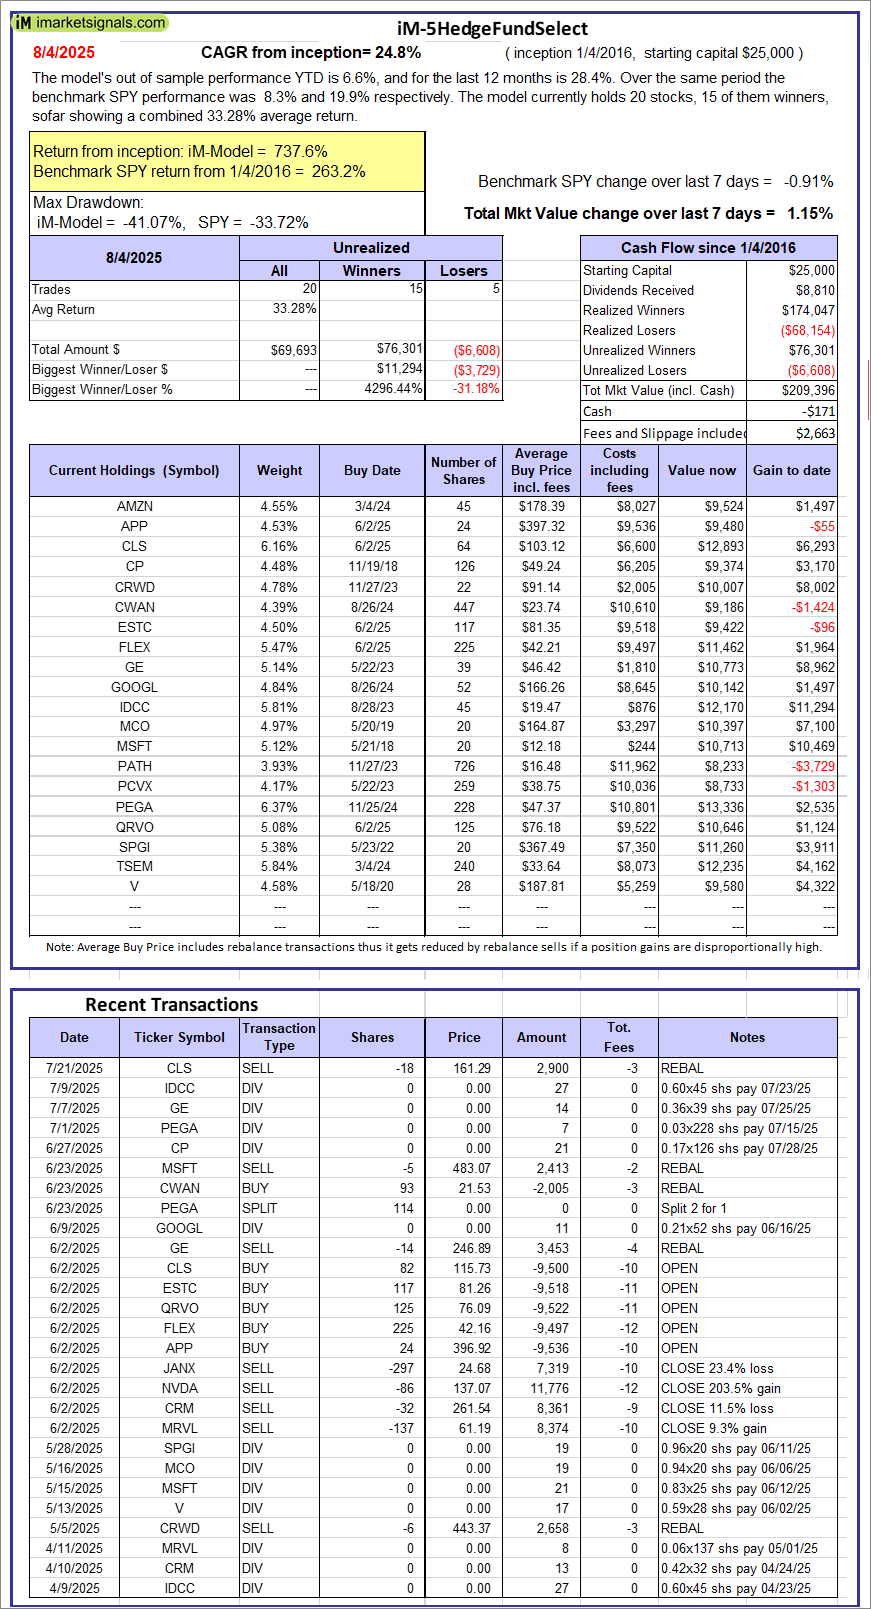 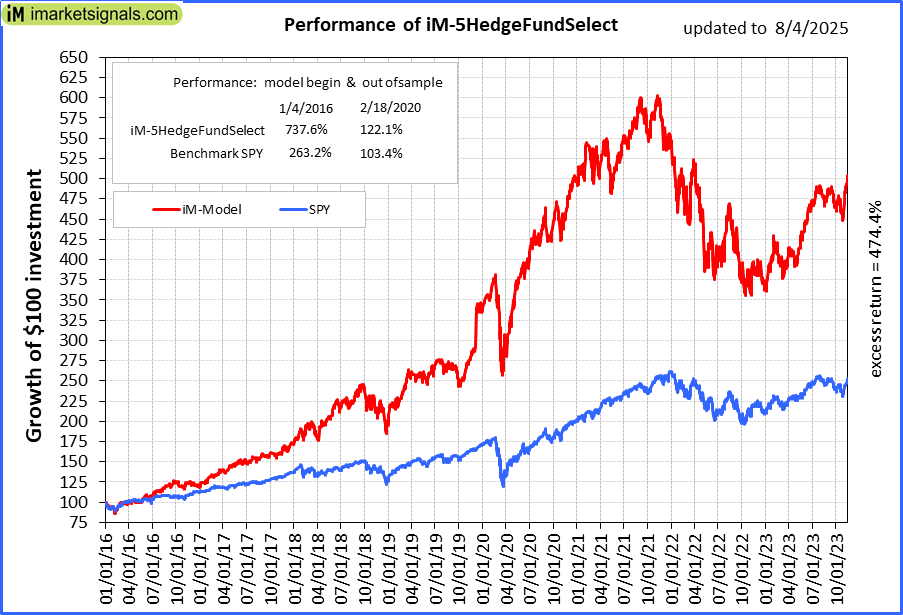 |
iM-5HedgeFundSelect: Since inception, on 1/5/2016, the model gained 737.58% while the benchmark SPY gained 263.20% over the same period. Over the previous week the market value of iM-5HedgeFundSelect gained 1.15% at a time when SPY gained -0.91%. A starting capital of $25,000 at inception on 1/5/2016 would have grown to $209,396 which includes -$171 cash and excludes $2,663 spent on fees and slippage. |
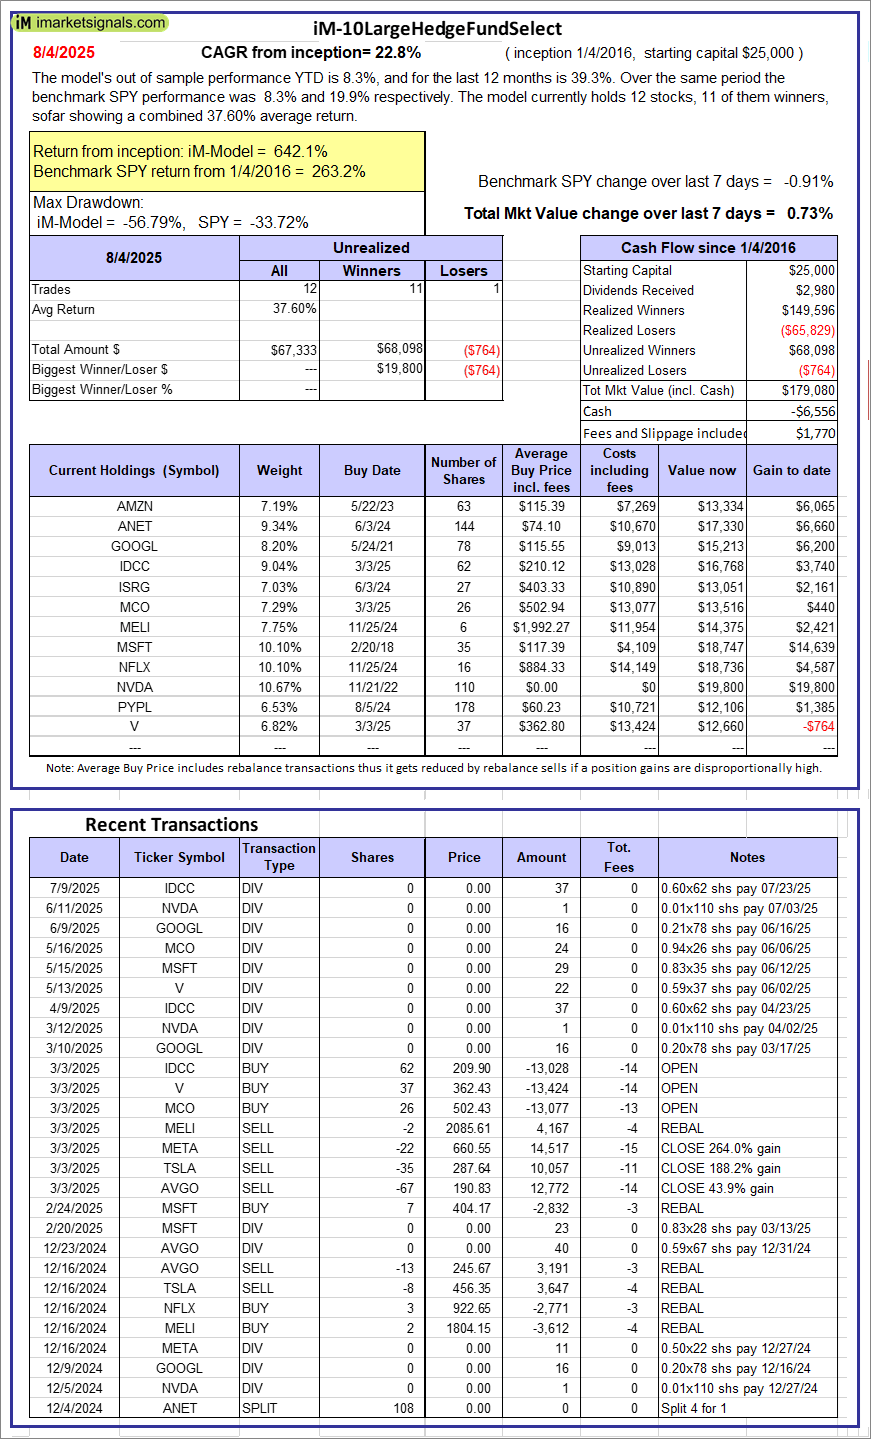 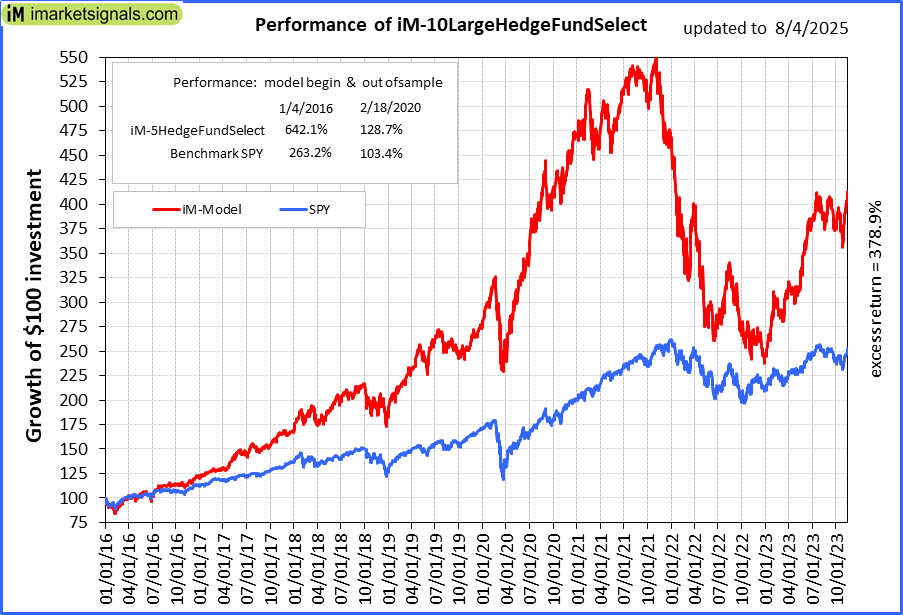 |
iM-10LargeHedgeFundSelect: Since inception, on 1/5/2016, the model gained 642.11% while the benchmark SPY gained 263.20% over the same period. Over the previous week the market value of iM-10LargeHedgeFundSelect gained 0.73% at a time when SPY gained -0.91%. A starting capital of $25,000 at inception on 1/5/2016 would have grown to $179,080 which includes -$6,556 cash and excludes $1,770 spent on fees and slippage. |
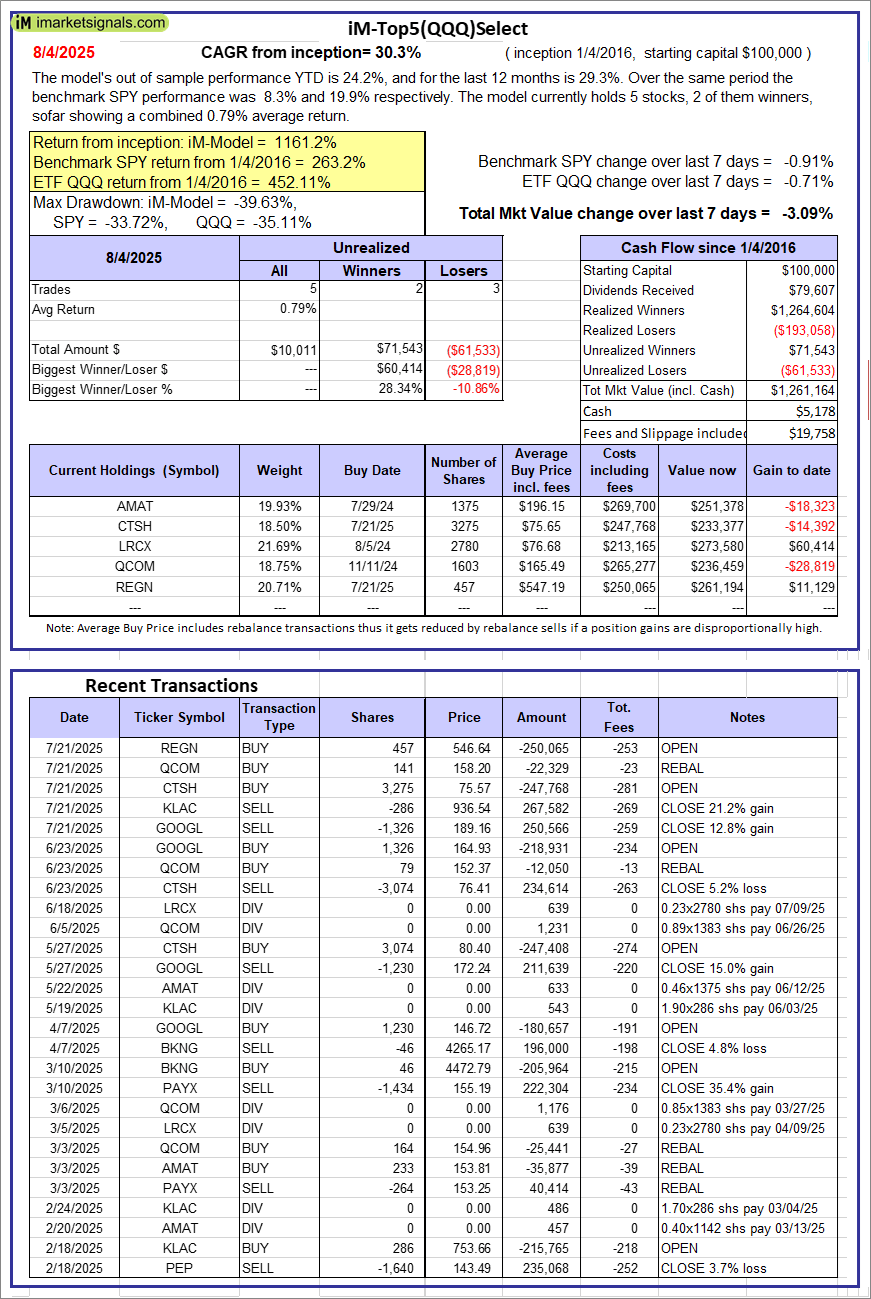 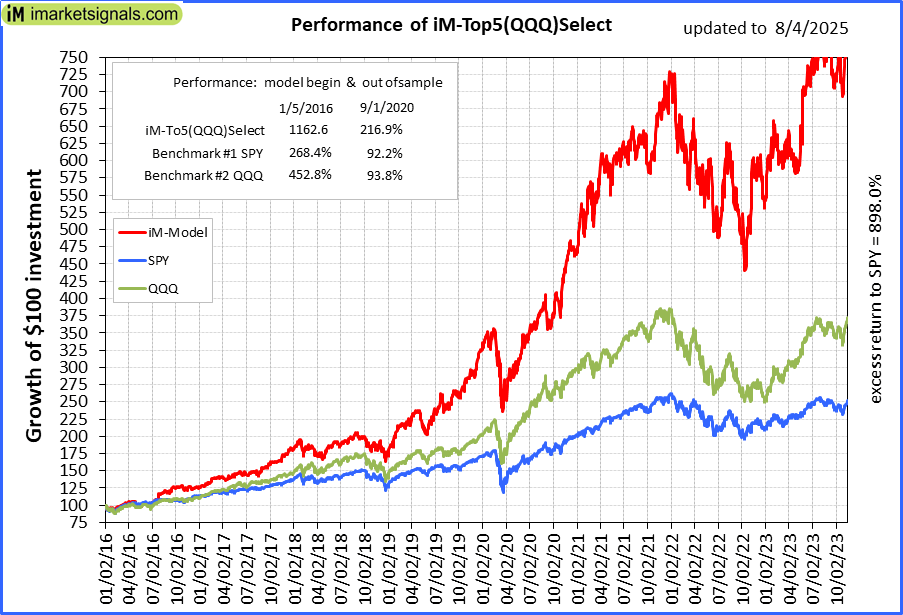 |
iM-Top5(QQQ)Select: Since inception, on 1/5/2016, the model gained 1161.16% while the benchmark SPY gained 263.20% over the same period. Over the previous week the market value of iM-Top5(QQQ)Select gained -3.09% at a time when SPY gained -0.91%. A starting capital of $100,000 at inception on 1/5/2016 would have grown to $1,261,164 which includes $5,178 cash and excludes $19,758 spent on fees and slippage. |
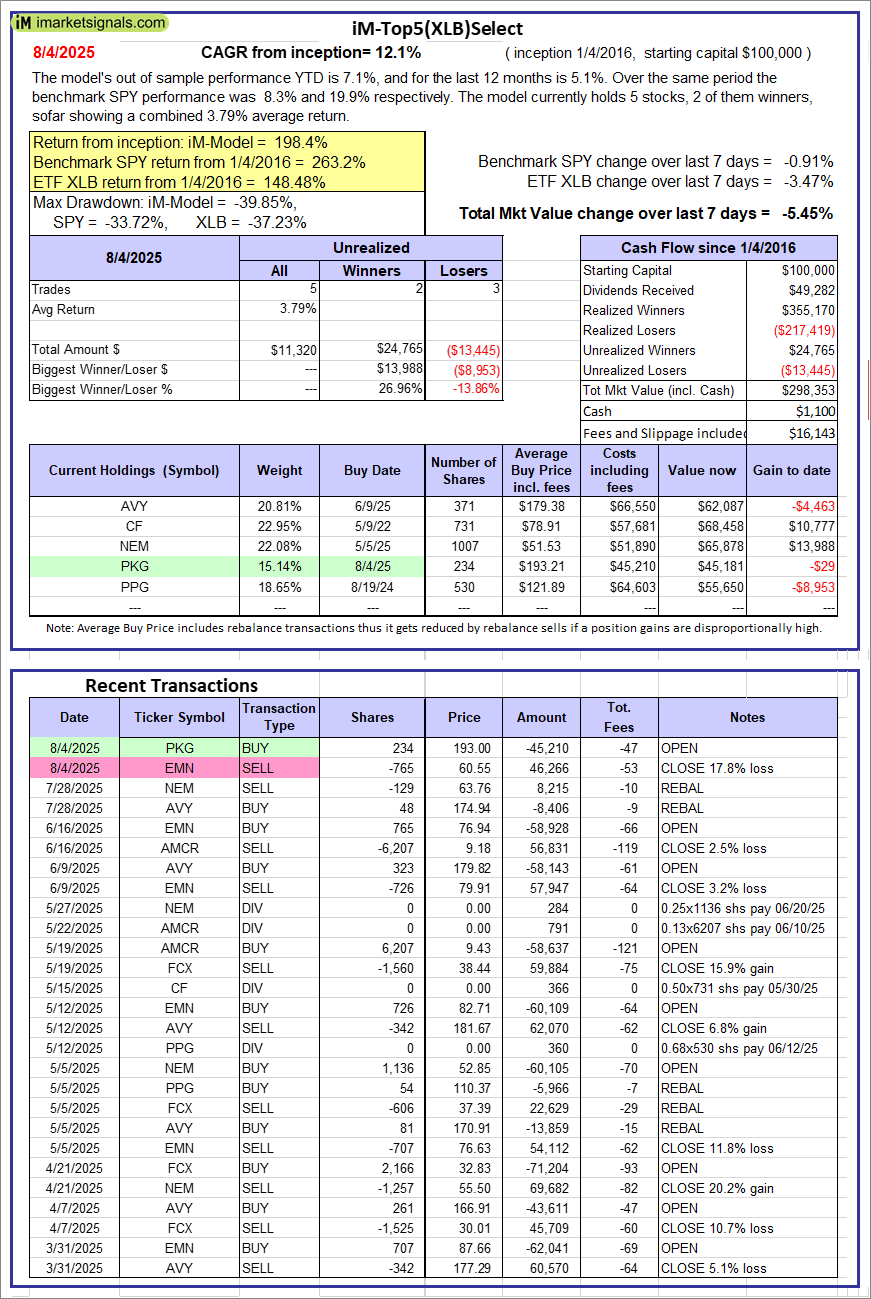 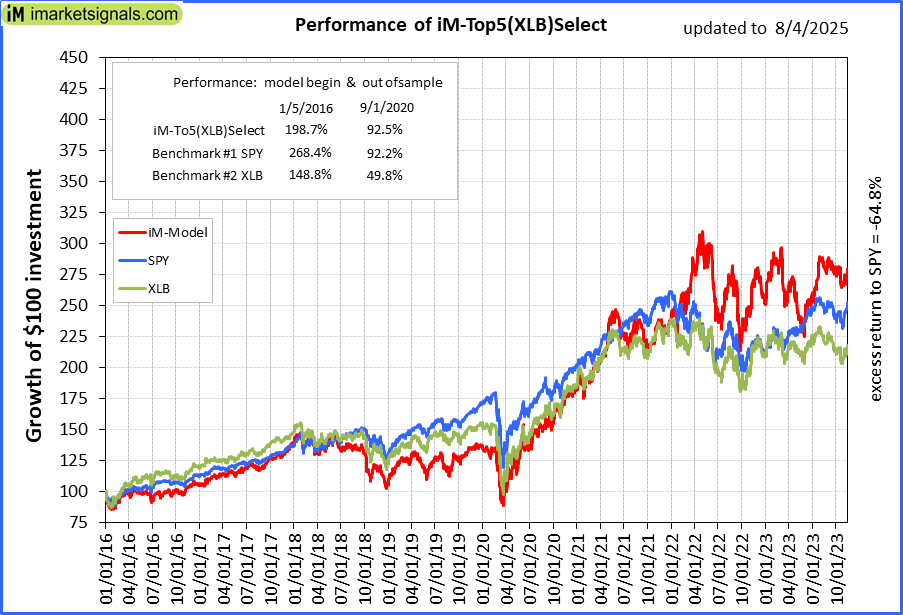 |
iM-Top5(XLB)Select: Since inception, on 1/5/2016, the model gained 198.35% while the benchmark SPY gained 263.20% over the same period. Over the previous week the market value of iM-Top5(XLB)Select gained -5.45% at a time when SPY gained -0.91%. A starting capital of $100,000 at inception on 1/5/2016 would have grown to $298,353 which includes $1,100 cash and excludes $16,143 spent on fees and slippage. |
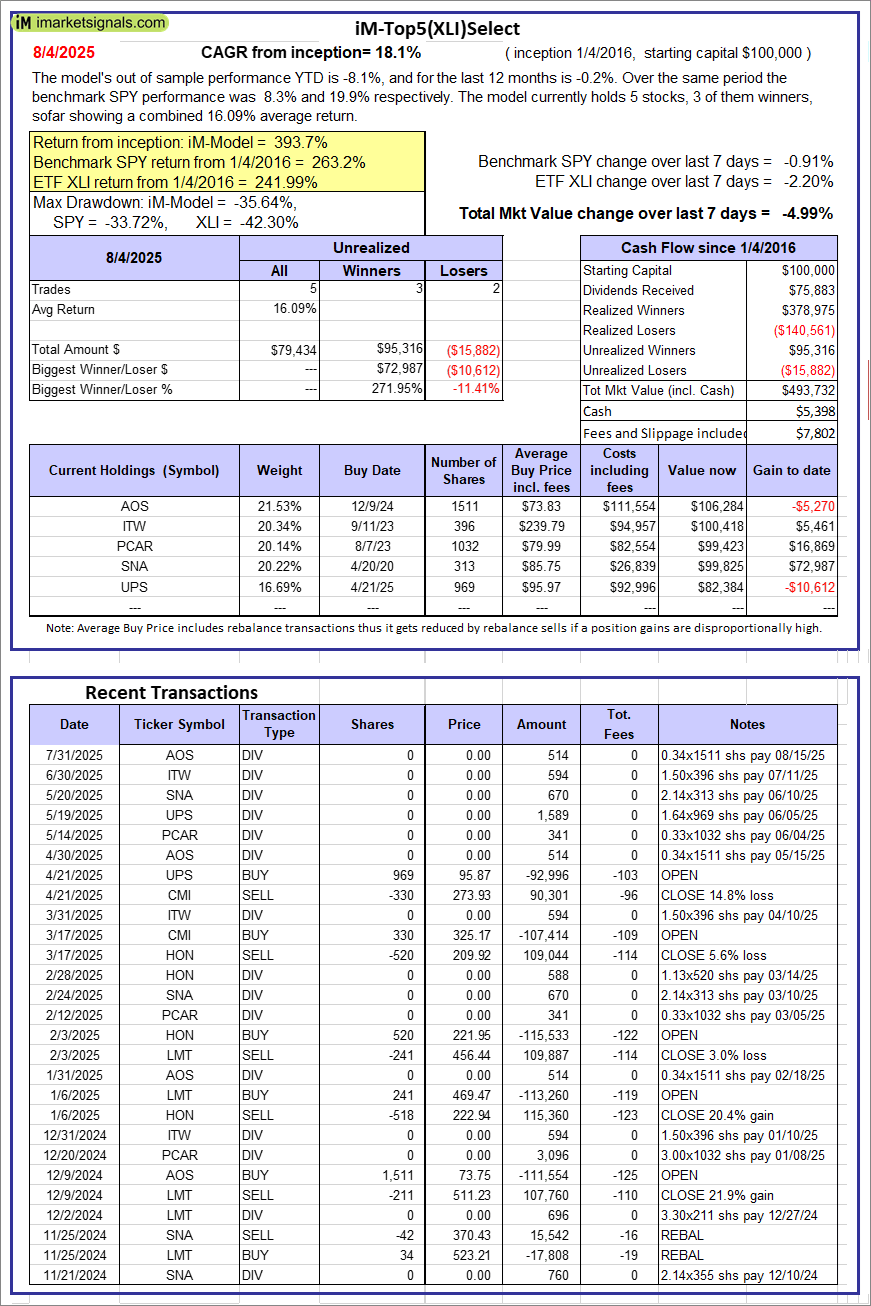 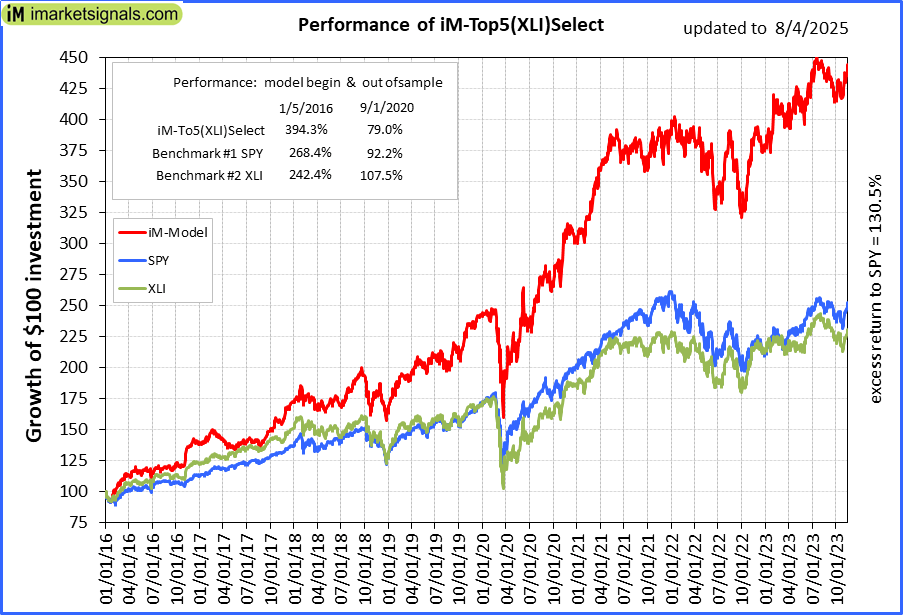 |
iM-Top5(XLI)Select: Since inception, on 1/5/2016, the model gained 393.73% while the benchmark SPY gained 263.20% over the same period. Over the previous week the market value of iM-Top5(XLI)Select gained -4.99% at a time when SPY gained -0.91%. A starting capital of $100,000 at inception on 1/5/2016 would have grown to $493,732 which includes $5,398 cash and excludes $7,802 spent on fees and slippage. |
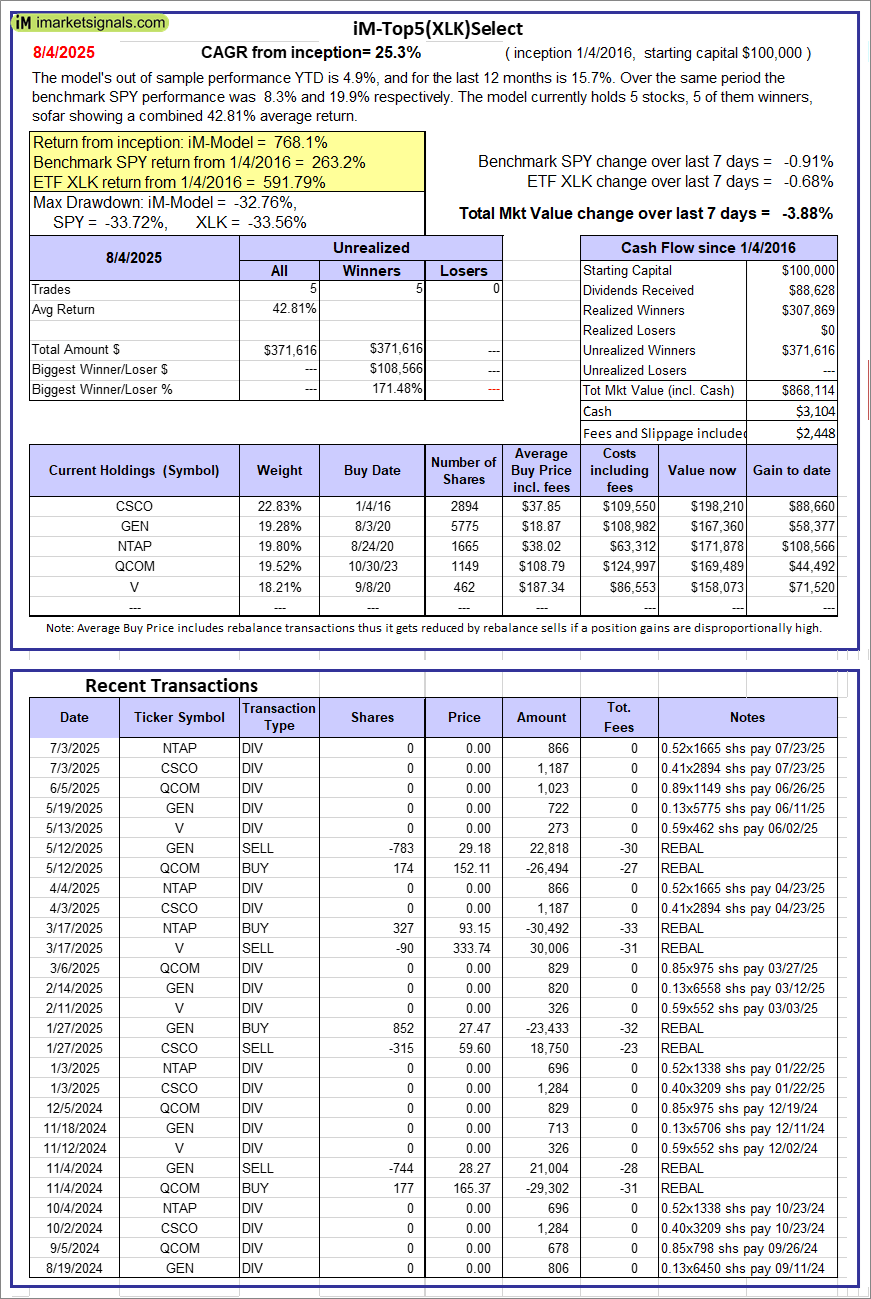 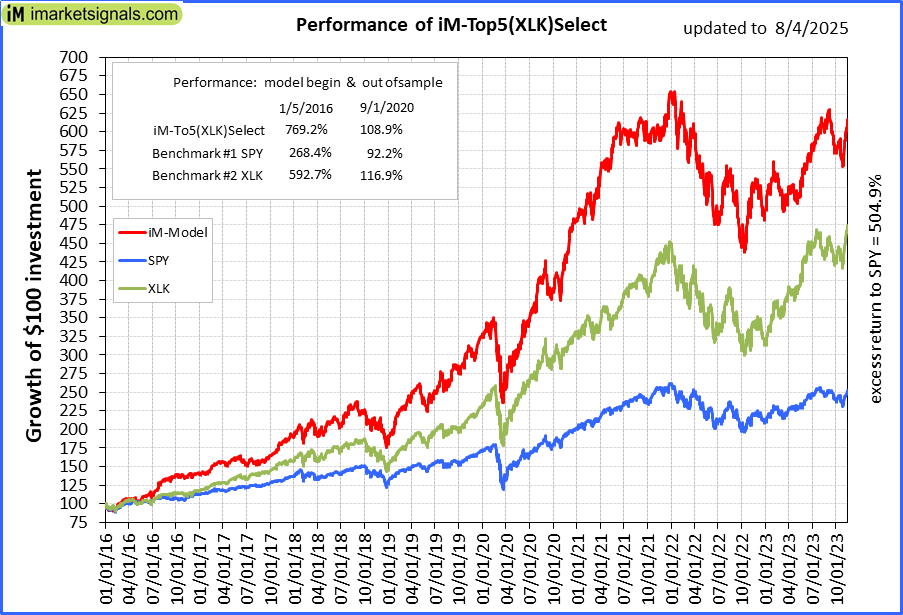 |
iM-Top5(XLK)Select: Since inception, on 1/5/2016, the model gained 768.11% while the benchmark SPY gained 263.20% over the same period. Over the previous week the market value of iM-Top5(XLK)Select gained -3.88% at a time when SPY gained -0.91%. A starting capital of $100,000 at inception on 1/5/2016 would have grown to $868,114 which includes $3,104 cash and excludes $2,448 spent on fees and slippage. |
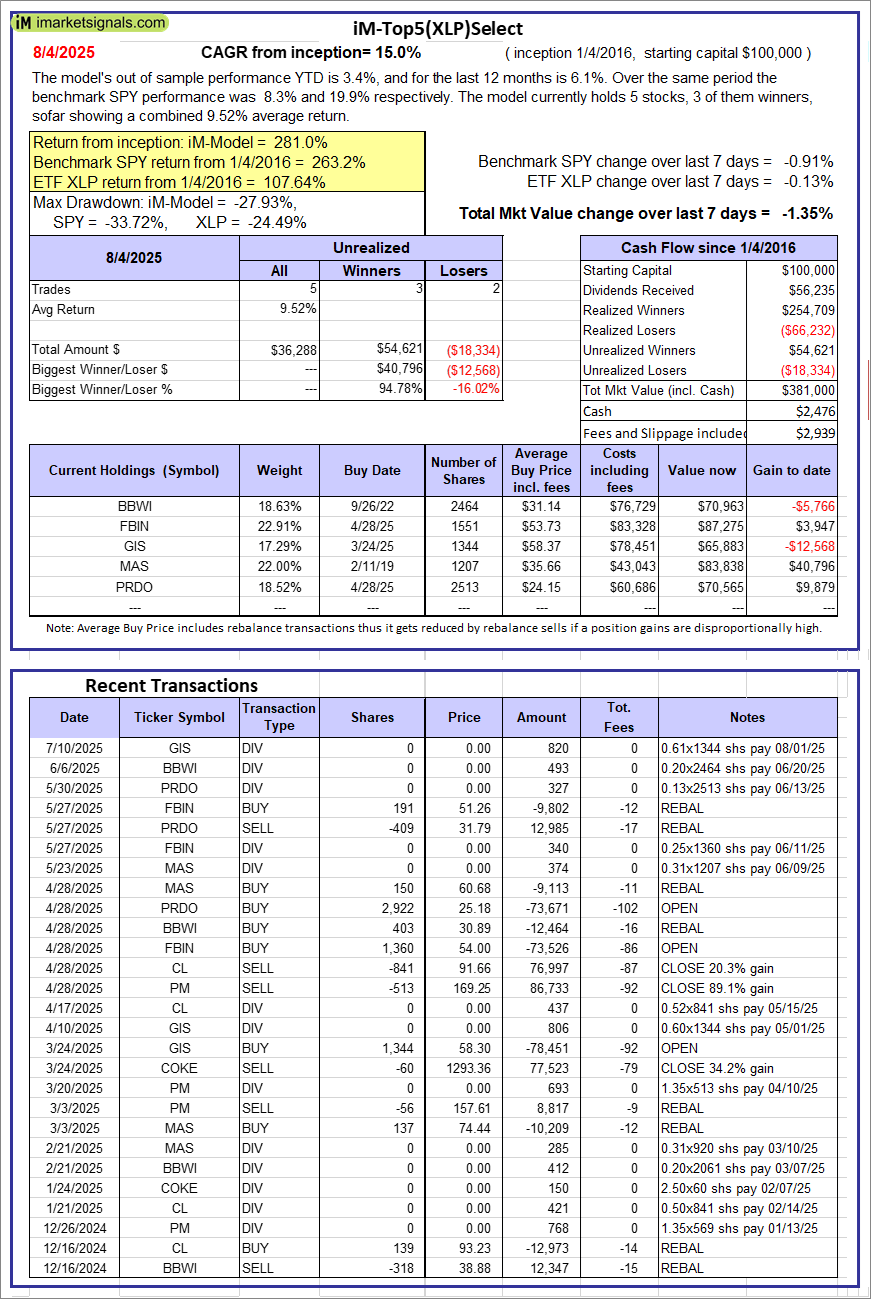 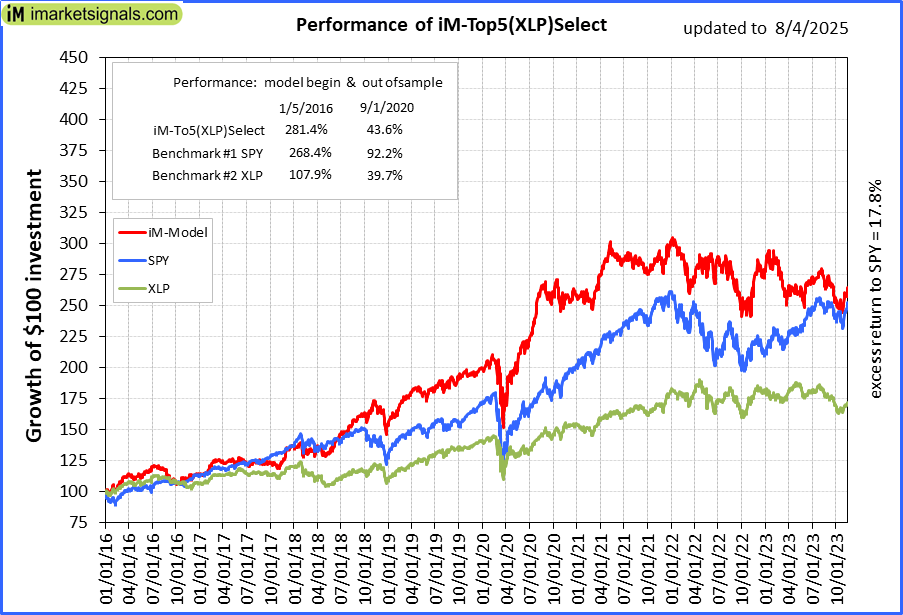 |
iM-Top5(XLP)Select: Since inception, on 1/5/2016, the model gained 281.00% while the benchmark SPY gained 263.20% over the same period. Over the previous week the market value of iM-Top5(XLP)Select gained -1.35% at a time when SPY gained -0.91%. A starting capital of $100,000 at inception on 1/5/2016 would have grown to $381,000 which includes $2,476 cash and excludes $2,939 spent on fees and slippage. |
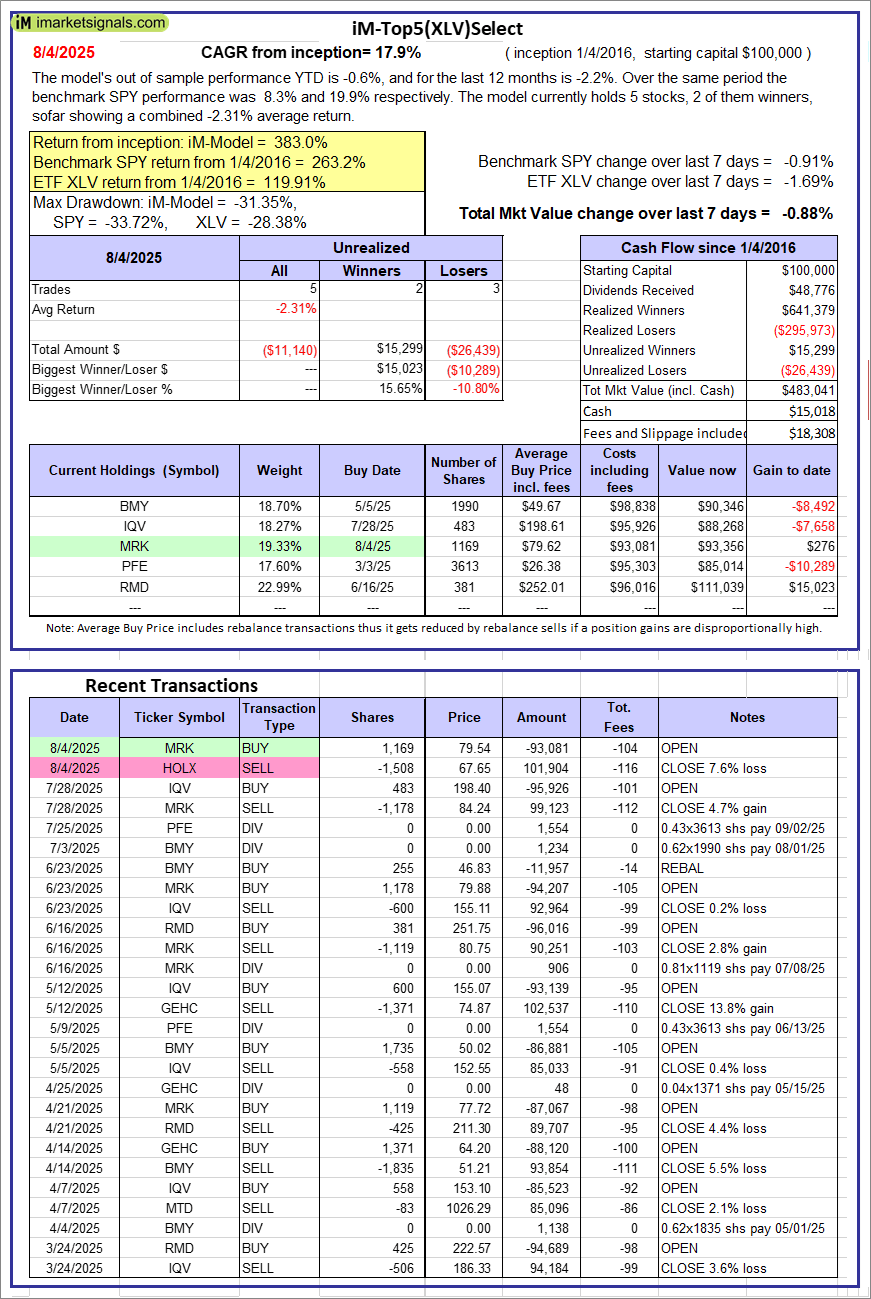 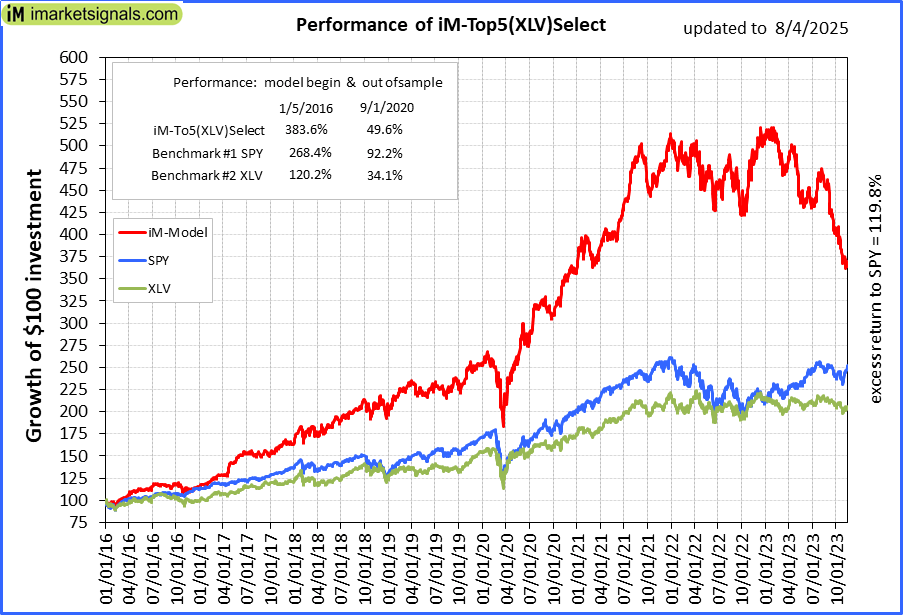 |
iM-Top5(XLV)Select: Since inception, on 1/5/2016, the model gained 383.04% while the benchmark SPY gained 263.20% over the same period. Over the previous week the market value of iM-Top5(XLV)Select gained -0.88% at a time when SPY gained -0.91%. A starting capital of $100,000 at inception on 1/5/2016 would have grown to $483,041 which includes $15,018 cash and excludes $18,308 spent on fees and slippage. |
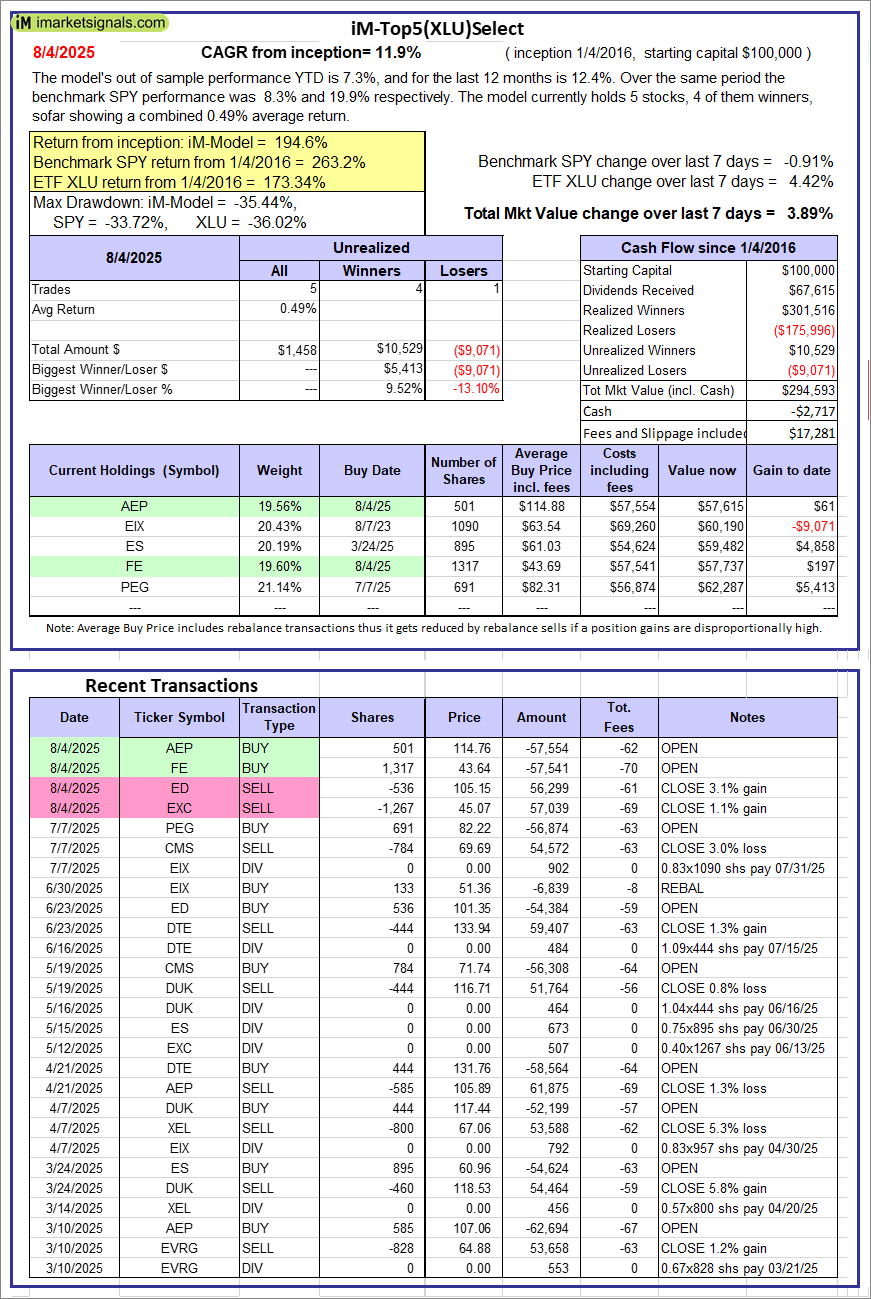 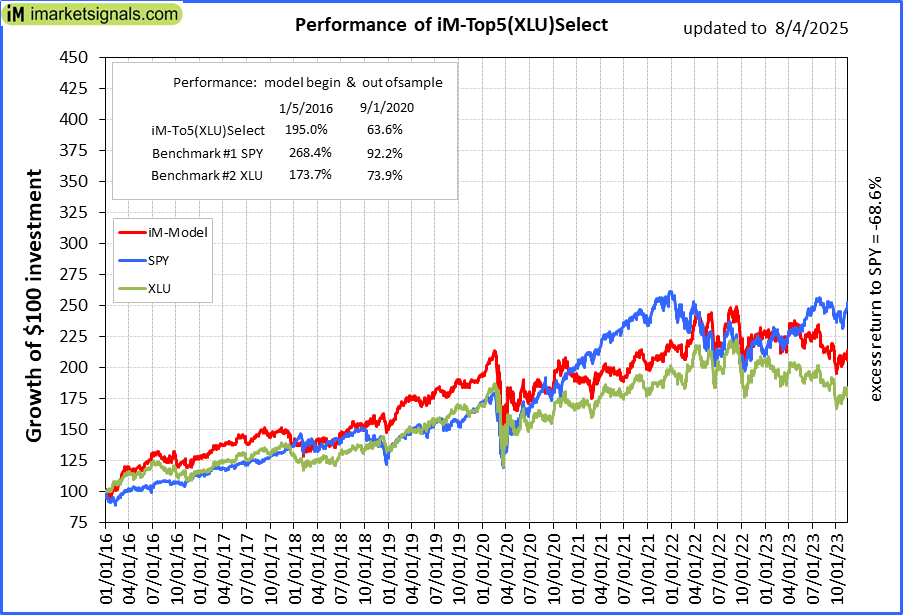 |
iM-Top5(XLU)Select: Since inception, on 1/5/2016, the model gained 194.59% while the benchmark SPY gained 263.20% over the same period. Over the previous week the market value of iM-Top5(XLU)Select gained 3.89% at a time when SPY gained -0.91%. A starting capital of $100,000 at inception on 1/5/2016 would have grown to $294,593 which includes -$2,717 cash and excludes $17,281 spent on fees and slippage. |
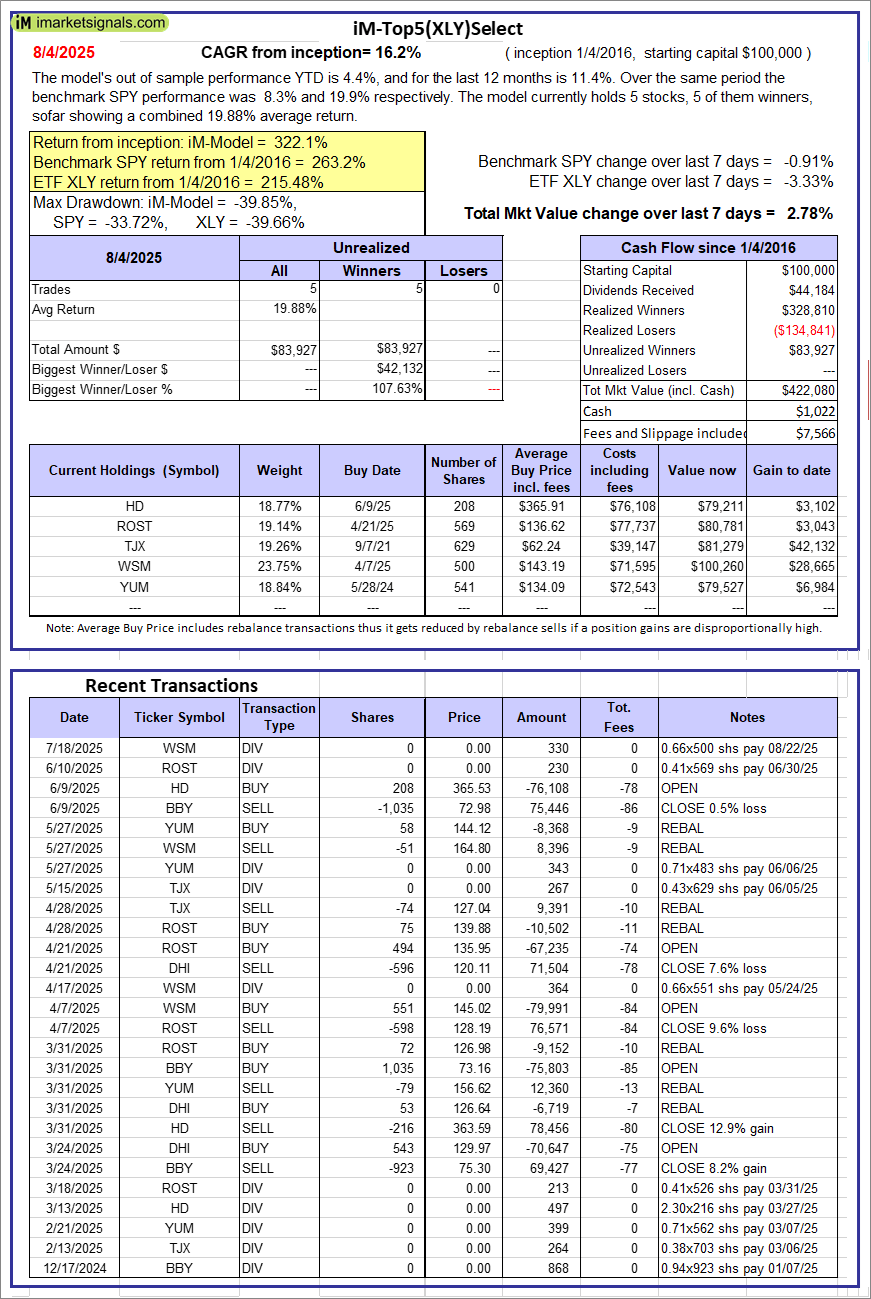 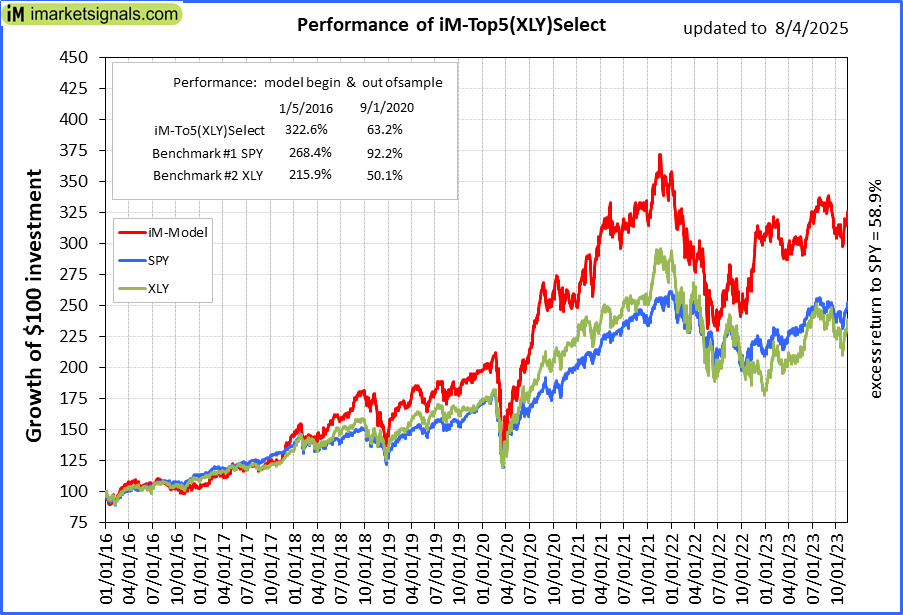 |
iM-Top5(XLY)Select: Since inception, on 1/5/2016, the model gained 322.08% while the benchmark SPY gained 263.20% over the same period. Over the previous week the market value of iM-Top5(XLY)Select gained 2.78% at a time when SPY gained -0.91%. A starting capital of $100,000 at inception on 1/5/2016 would have grown to $422,080 which includes $1,022 cash and excludes $7,566 spent on fees and slippage. |
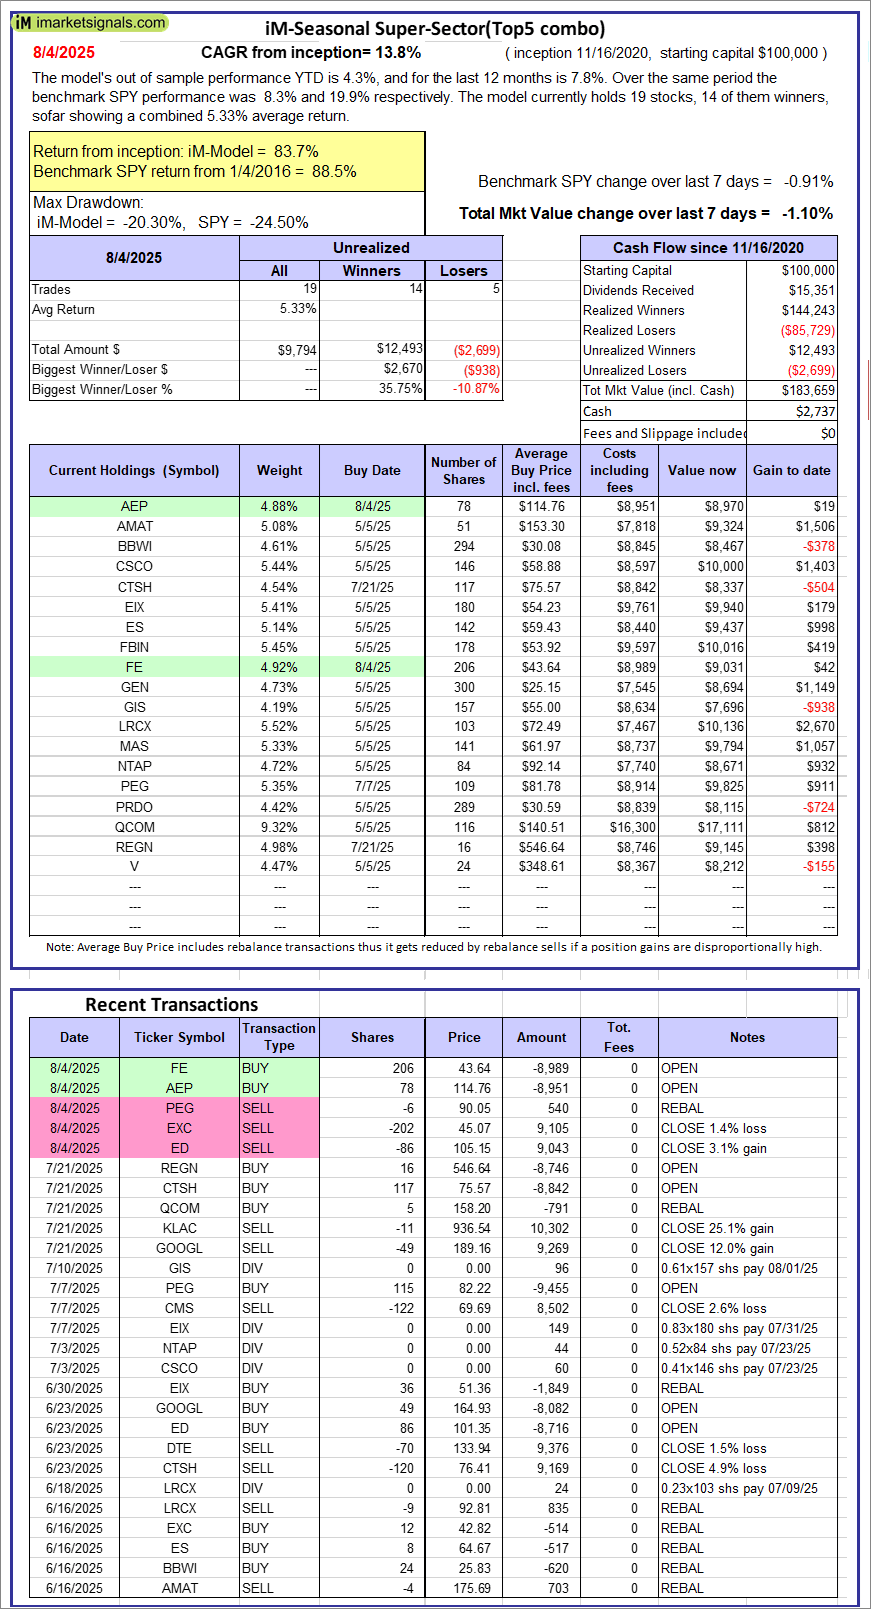 |
iM-Seasonal Super-Sectors (Top5 combo) : Since inception, on 11/17/2020, the model gained 83.66% while the benchmark SPY gained 88.54% over the same period. Over the previous week the market value of iM-Seasonal Super-Sectors (Top5 combo) gained -1.10% at a time when SPY gained -0.91%. A starting capital of $100,000 at inception on 11/17/2020 would have grown to $183,659 which includes $2,737 cash and excludes $00 spent on fees and slippage. |
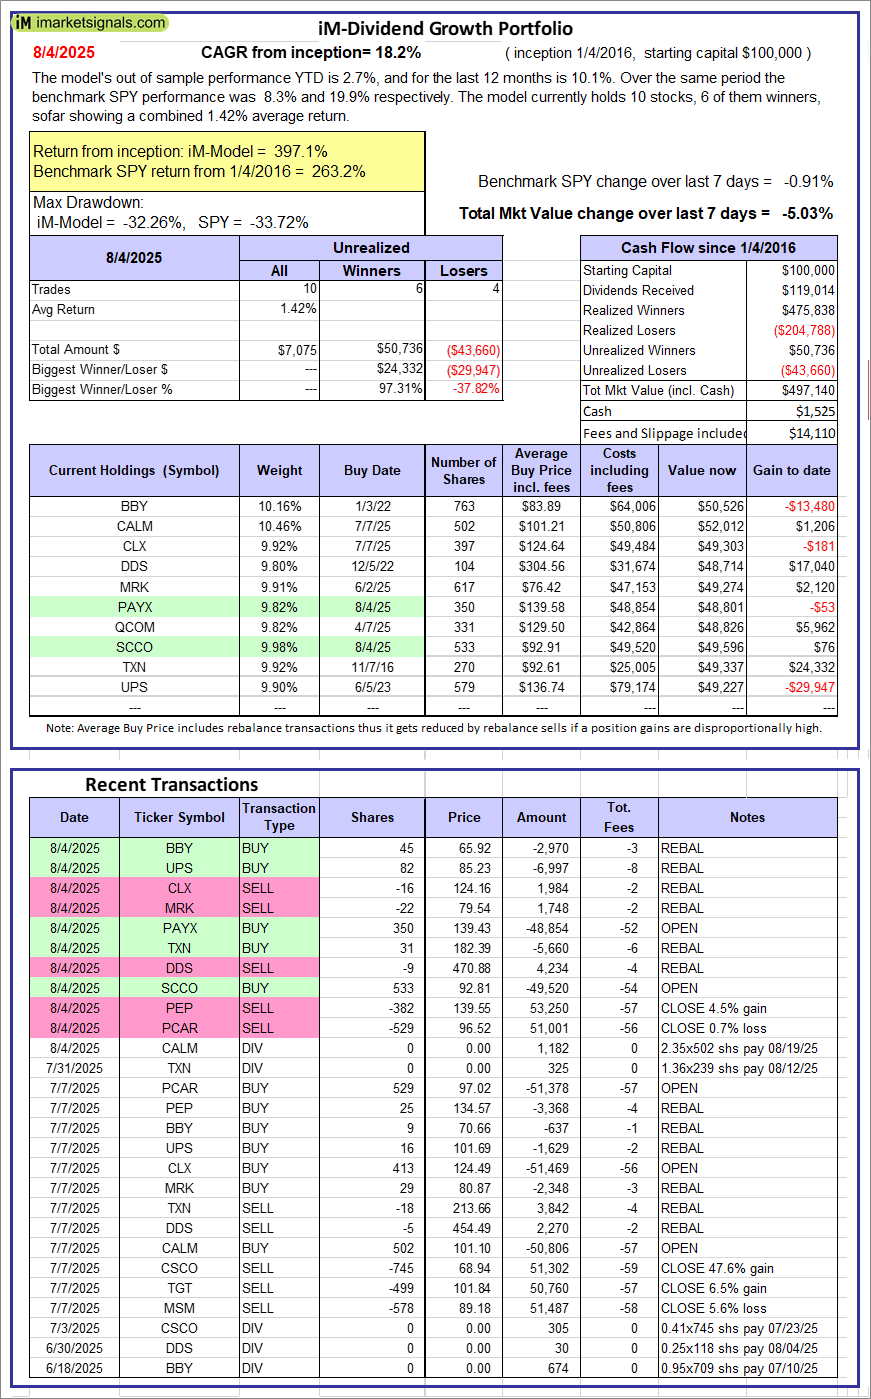 |
iM-Dividend Growth Portfolio: The model’s out of sample performance YTD is 2.7%, and for the last 12 months is 10.1%. Over the same period the benchmark SPY performance was 8.3% and 19.9% respectively. Over the previous week the market value of the iM-Dividend Growth Portfolio gained -5.03% at a time when SPY gained -0.91%. A starting capital of $100,000 at inception on 6/30/2016 would have grown to $497,140 which includes $1,525 cash and excludes $14,110 spent on fees and slippage. |
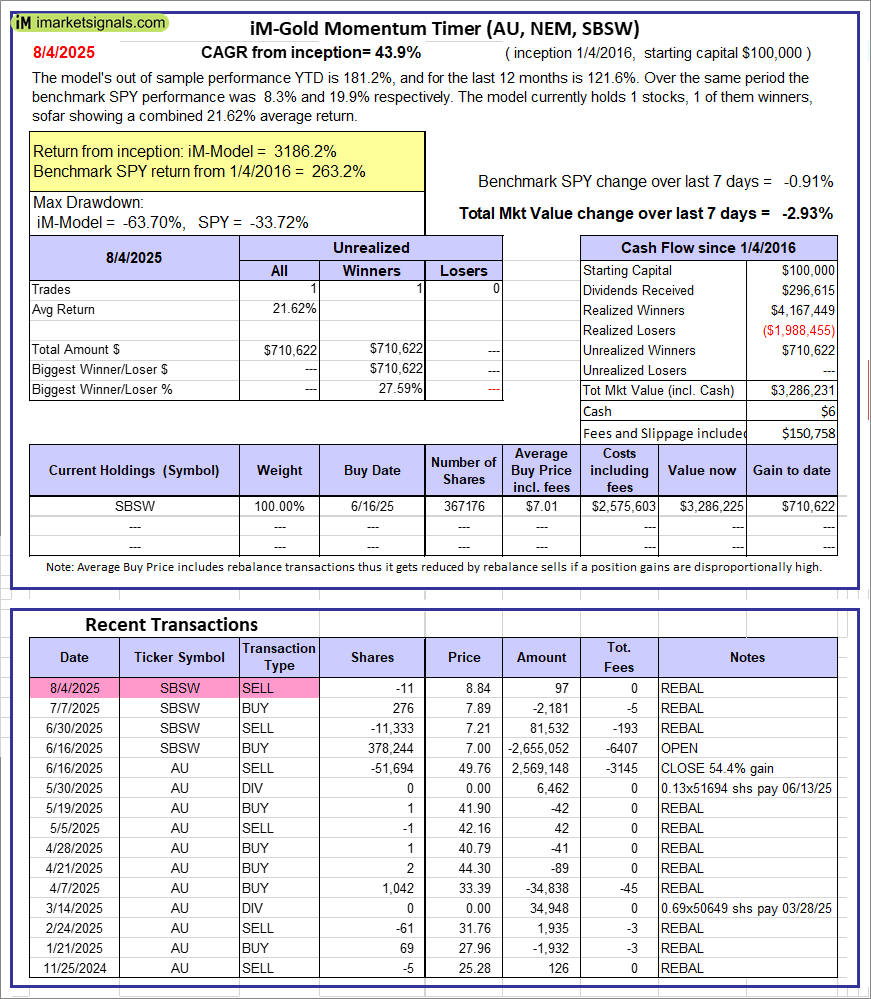 |
iM-Gold Momentum Timer (AU, NEM, SBSW): The model’s out of sample performance YTD is 181.2%, and for the last 12 months is 121.6%. Over the same period the benchmark SPY performance was 8.3% and 19.9% respectively. Over the previous week the market value of iM-Gold Momentum Timer (AU, NEM, SBSW) gained -2.93% at a time when SPY gained -0.91%. A starting capital of $100,000 at inception on 6/30/2016 would have grown to $06 which includes $150,758 cash and excludes Gain to date spent on fees and slippage. |
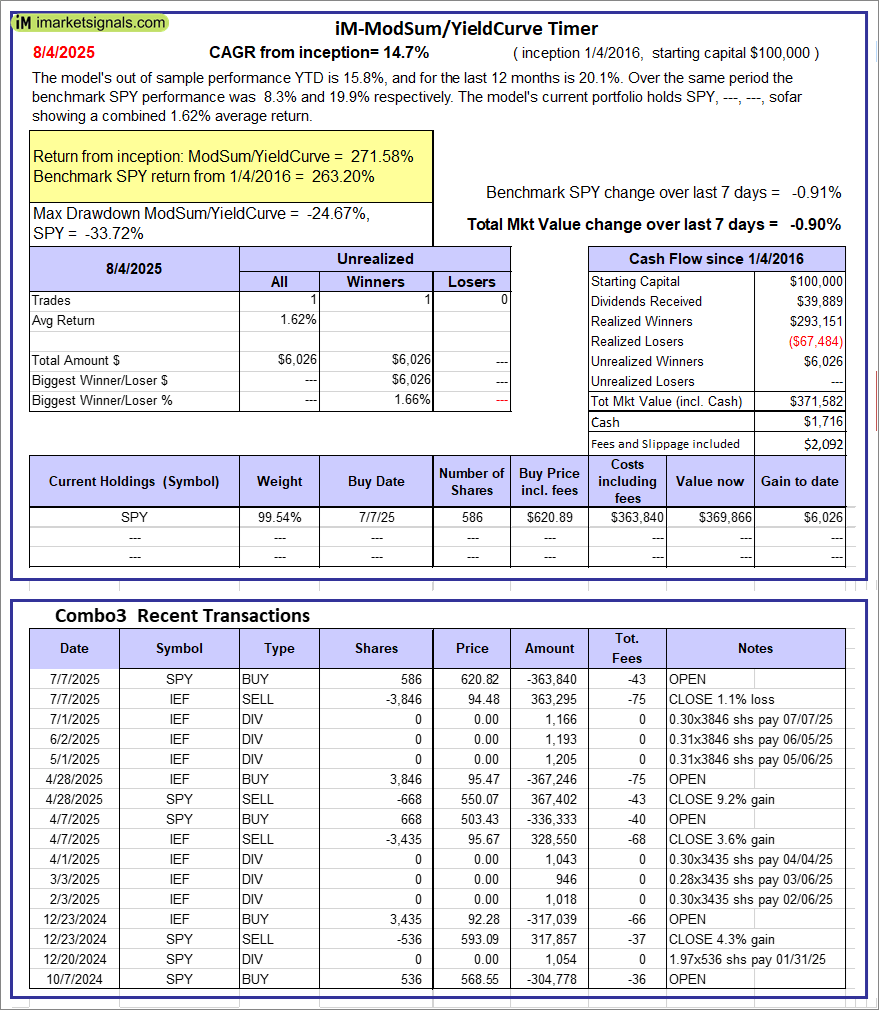 |
iM-ModSum/YieldCurve Timer: The model’s out of sample performance YTD is 15.8%, and for the last 12 months is 20.1%. Over the same period the benchmark SPY performance was 8.3% and 19.9% respectively. Over the previous week the market value of iM-PortSum/YieldCurve Timer gained -0.90% at a time when SPY gained -0.91%. A starting capital of $100,000 at inception on 1/1/2016 would have grown to $371,582 which includes $1,716 cash and excludes $2,092 spent on fees and slippage. |
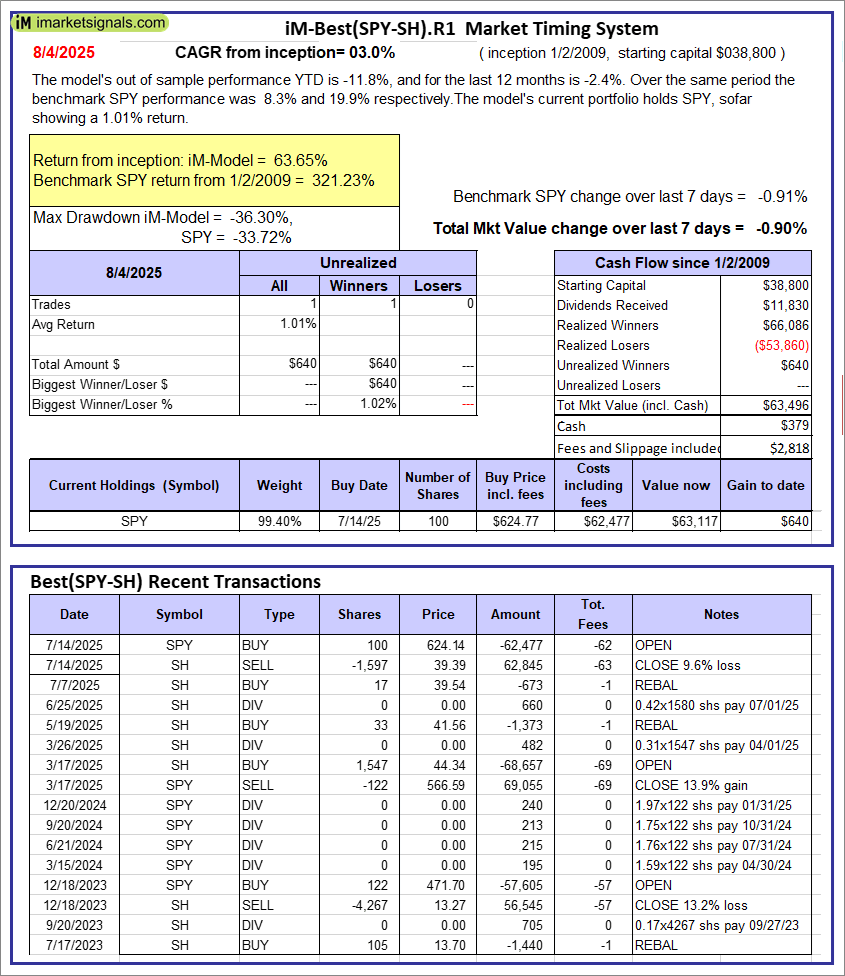 |
iM-Best(SPY-SH).R1: The model’s out of sample performance YTD is -11.8%, and for the last 12 months is -2.4%. Over the same period the benchmark SPY performance was 8.3% and 19.9% respectively. Over the previous week the market value of Best(SPY-SH) gained -0.90% at a time when SPY gained -0.91%. A starting capital of $100,000 at inception on 1/2/2009 would have grown to $63,496 which includes $379 cash and excludes $2,818 spent on fees and slippage. |
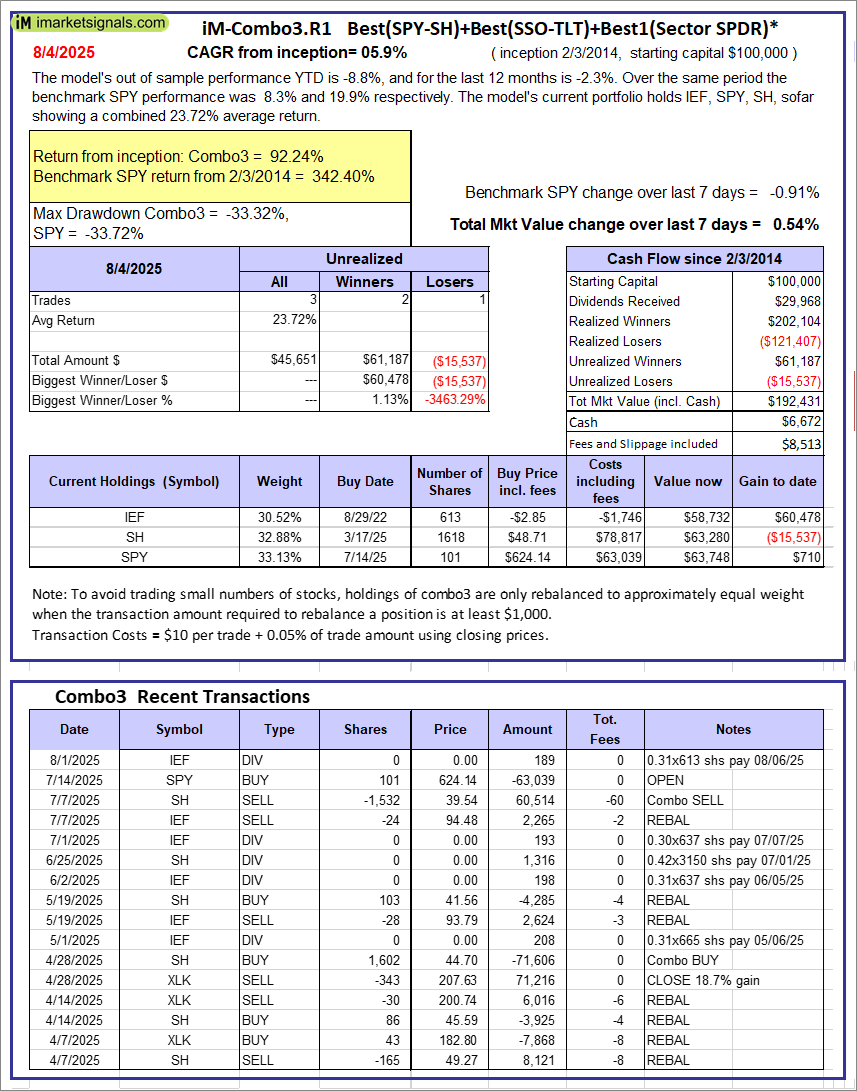 |
iM-Combo3.R1: The model’s out of sample performance YTD is -8.8%, and for the last 12 months is -2.3%. Over the same period the benchmark SPY performance was 8.3% and 19.9% respectively. Over the previous week the market value of iM-Combo3.R1 gained 0.54% at a time when SPY gained -0.91%. A starting capital of $100,000 at inception on 2/3/2014 would have grown to $192,431 which includes $6,672 cash and excludes $8,513 spent on fees and slippage. |
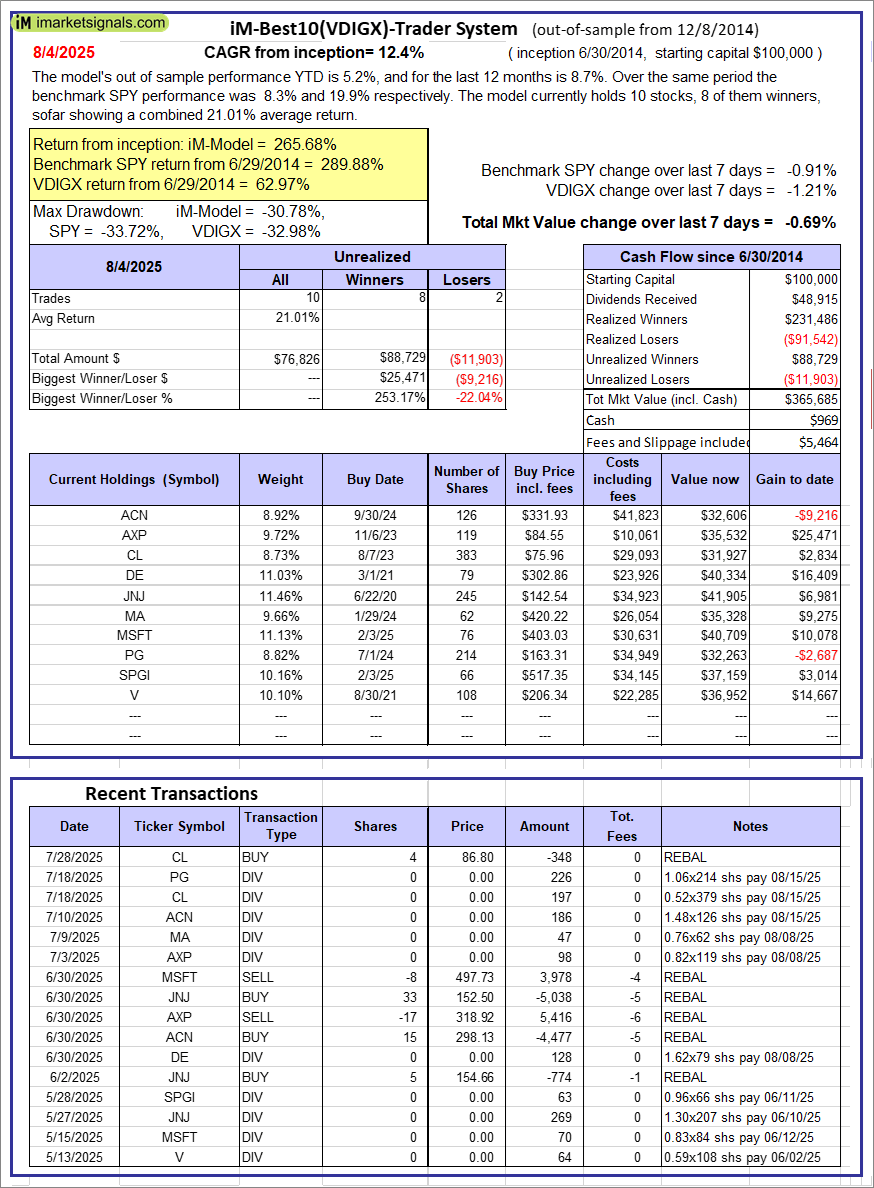 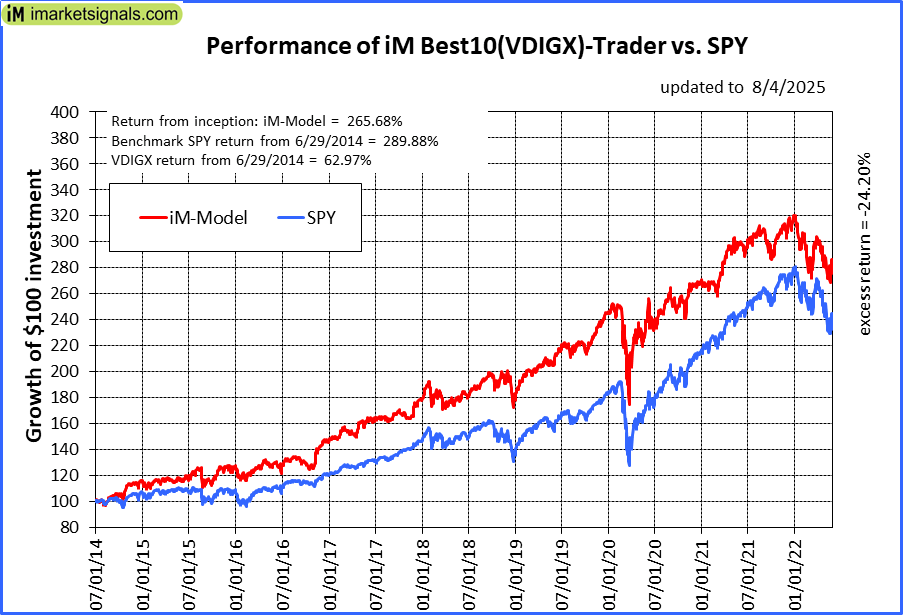 |
iM-Best10(VDIGX)-Trader: The model’s out of sample performance YTD is 5.2%, and for the last 12 months is 8.7%. Over the same period the benchmark SPY performance was 8.3% and 19.9% respectively. Since inception, on 7/1/2014, the model gained 265.68% while the benchmark SPY gained 289.88% and VDIGX gained 62.97% over the same period. Over the previous week the market value of iM-Best10(VDIGX) gained -0.69% at a time when SPY gained -0.91%. A starting capital of $100,000 at inception on 7/1/2014 would have grown to $365,685 which includes $969 cash and excludes $5,464 spent on fees and slippage. |
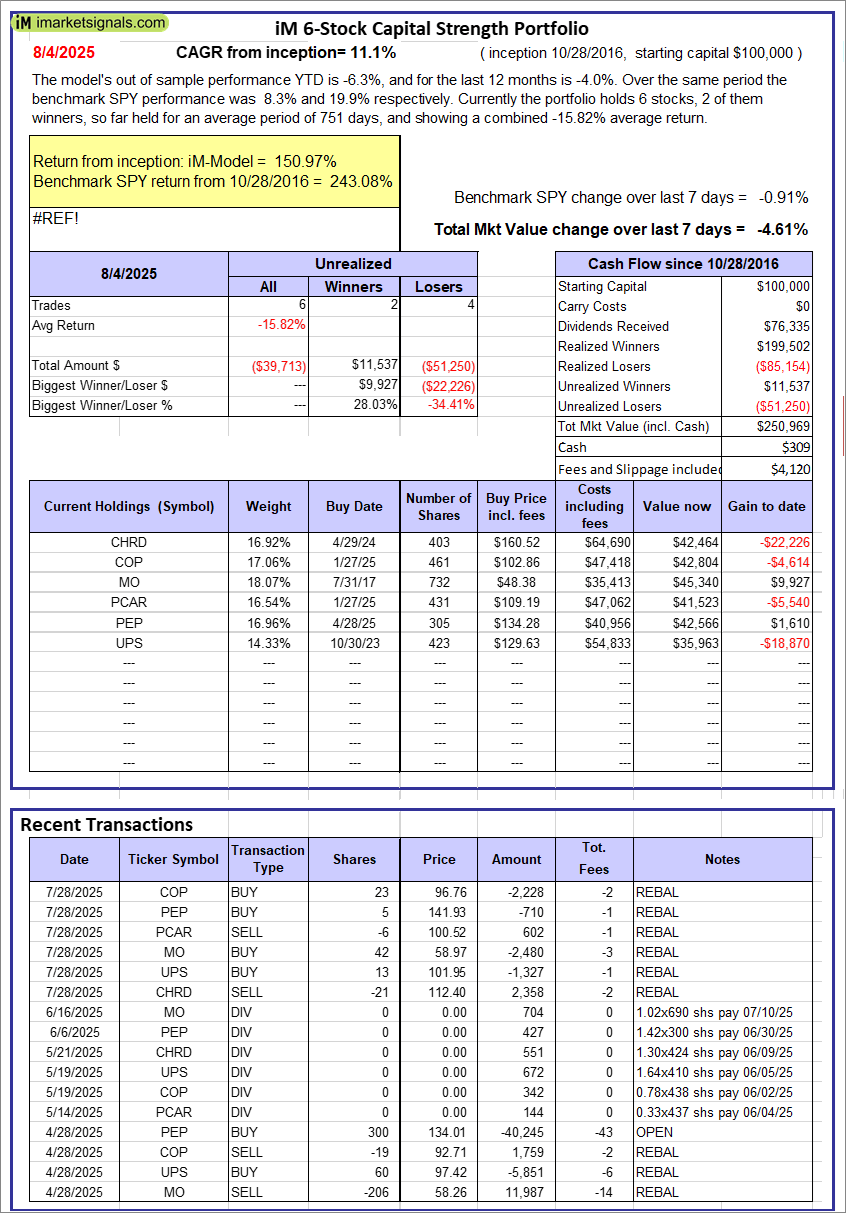 |
iM 6-Stock Capital Strength Portfolio: The model’s out of sample performance YTD is -6.3%, and for the last 12 months is -4.0%. Over the same period the benchmark SPY performance was 8.3% and 19.9% respectively. Over the previous week the market value of the iM 6-Stock Capital Strength Portfolio gained -4.61% at a time when SPY gained -0.91%. A starting capital of $100,000 at inception on 10/28/2016 would have grown to $250,969 which includes $309 cash and excludes $4,120 spent on fees and slippage. |
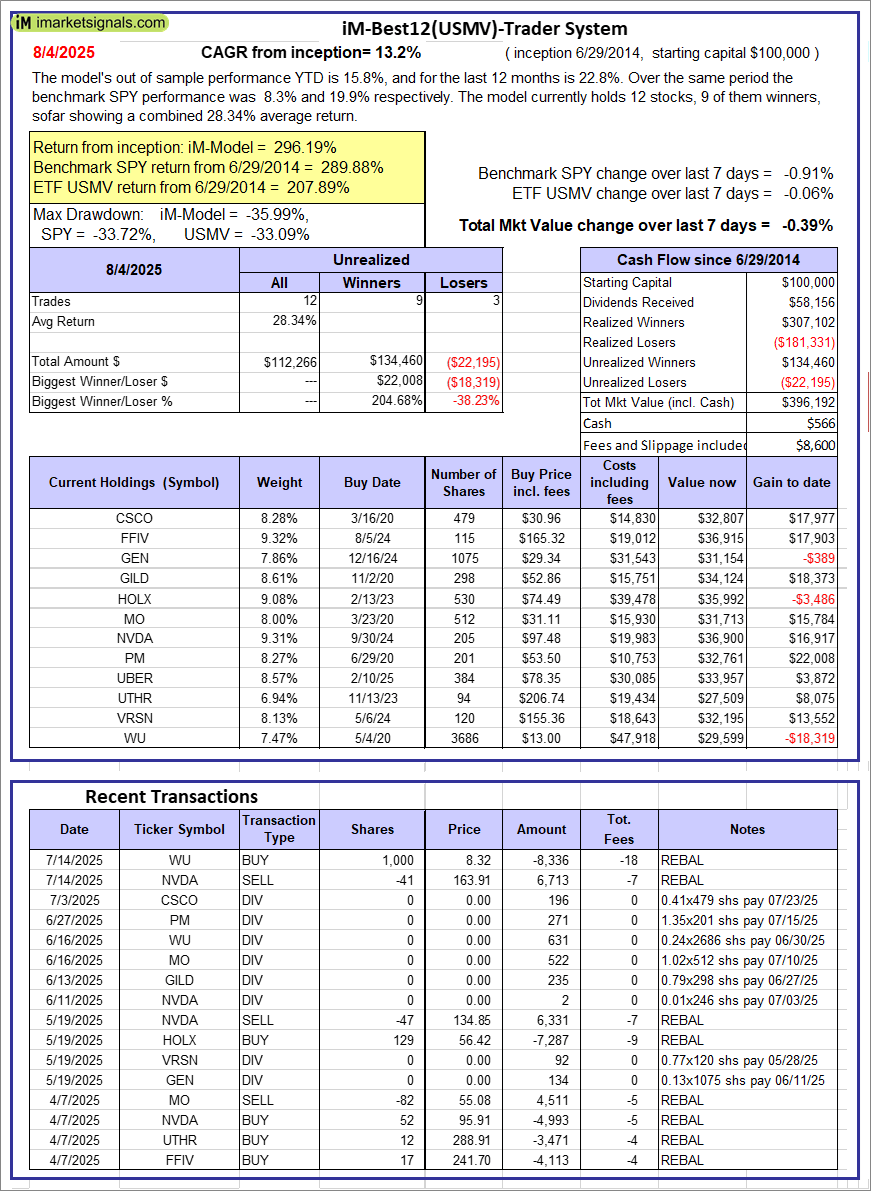 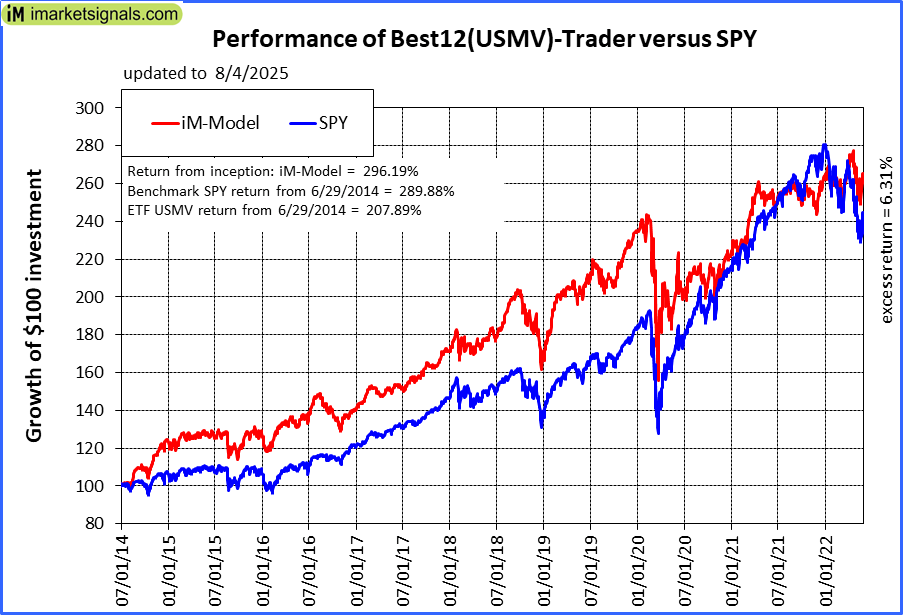 |
iM-Best12(USMV)-Trader: The model’s out of sample performance YTD is 15.8%, and for the last 12 months is 22.8%. Over the same period the benchmark SPY performance was 8.3% and 19.9% respectively. Since inception, on 6/30/2014, the model gained 296.19% while the benchmark SPY gained 289.88% and the ETF USMV gained 207.89% over the same period. Over the previous week the market value of iM-Best12(USMV)-Trader gained -0.39% at a time when SPY gained -0.91%. A starting capital of $100,000 at inception on 6/30/2014 would have grown to $396,192 which includes $566 cash and excludes $8,600 spent on fees and slippage. |
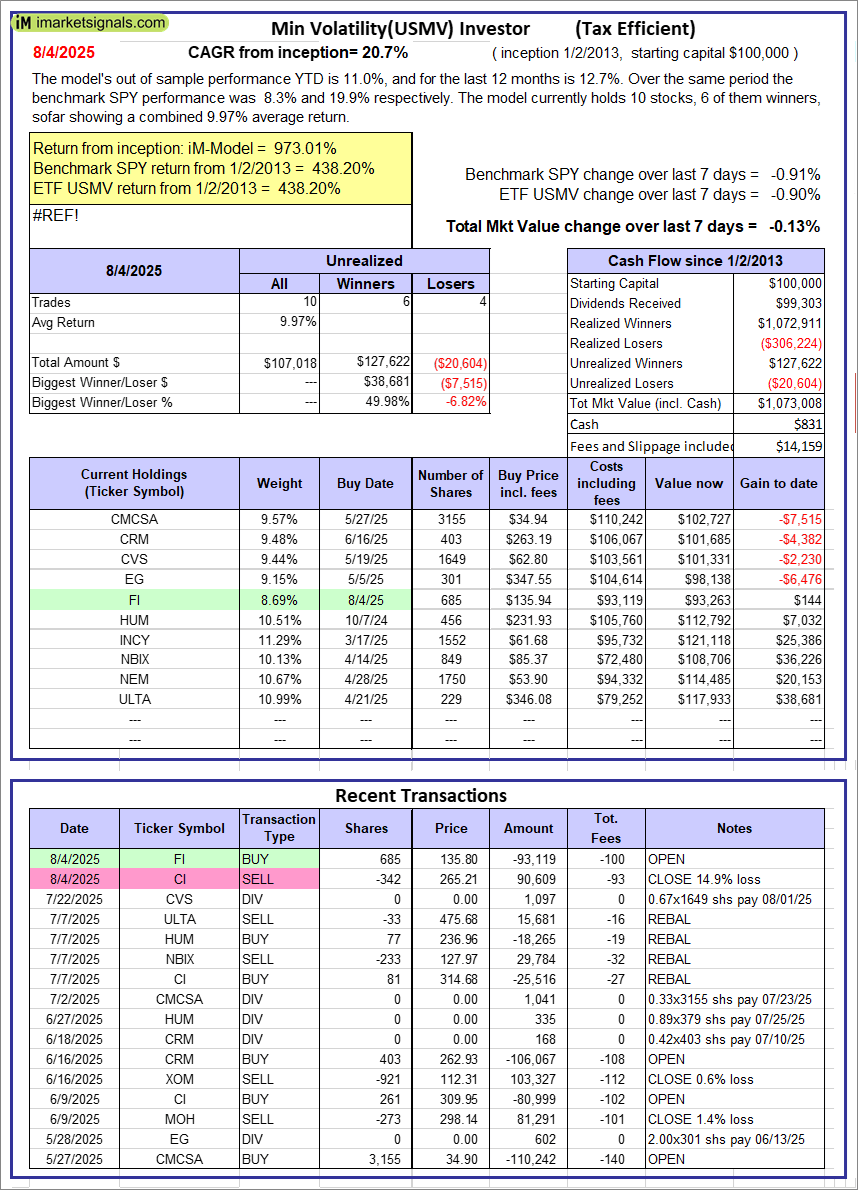 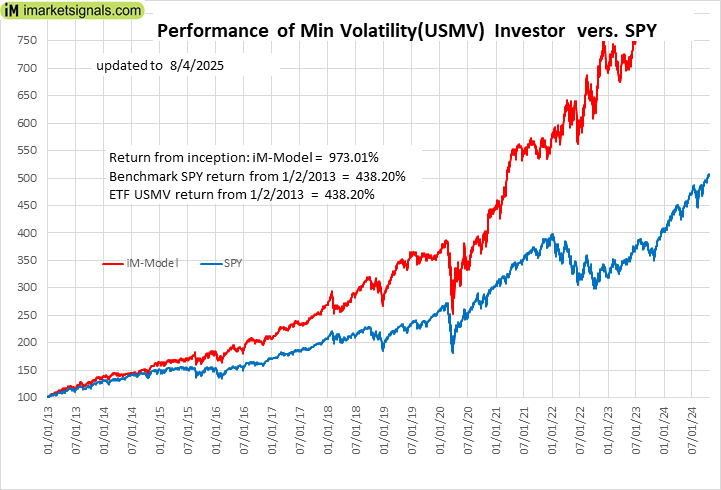 |
iM-Min Volatility(USMV) Investor (Tax Efficient): The model’s out of sample performance YTD is 11.0%, and for the last 12 months is 12.7%. Over the same period the benchmark SPY performance was 8.3% and 19.9% respectively. Since inception, on 1/3/2013, the model gained 973.01% while the benchmark SPY gained 438.20% and the ETF USMV gained 438.20% over the same period. Over the previous week the market value of iM-Best12(USMV)Q1 gained -0.13% at a time when SPY gained -0.91%. A starting capital of $100,000 at inception on 1/3/2013 would have grown to $1,073,008 which includes $831 cash and excludes $14,159 spent on fees and slippage. |
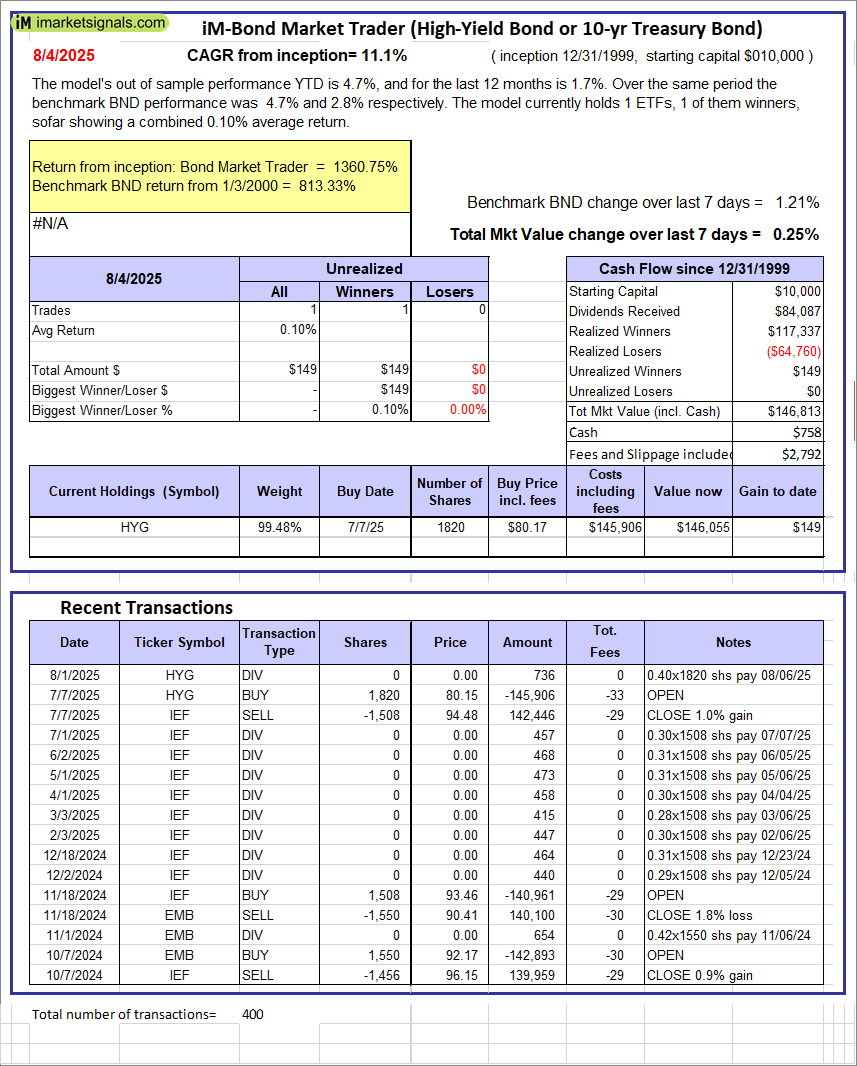 |
iM-Bond Market Trader (High-Yield Bond or 10-yr Treasury Bond): The model’s out of sample performance YTD is 4.7%, and for the last 12 months is 1.7%. Over the same period the benchmark BND performance was 4.7% and 2.8% respectively. Over the previous week the market value of the iM-Bond Market Trader (High-Yield Bond or 10-yr Treasury Bond) gained 0.25% at a time when BND gained 1.21%. A starting capital of $10,000 at inception on 1/3/2000 would have grown to $146,813 which includes $758 cash and excludes $2,792 spent on fees and slippage. |
|
|
iM-ModSum/YieldCurve Timer: The model’s out of sample performance YTD is 15.8%, and for the last 12 months is 20.1%. Over the same period the benchmark SPY performance was 8.3% and 19.9% respectively. Over the previous week the market value of iM-PortSum/YieldCurve Timer gained -0.90% at a time when SPY gained -0.91%. A starting capital of $100,000 at inception on 1/1/2016 would have grown to $371,582 which includes $1,716 cash and excludes $2,092 spent on fees and slippage. |
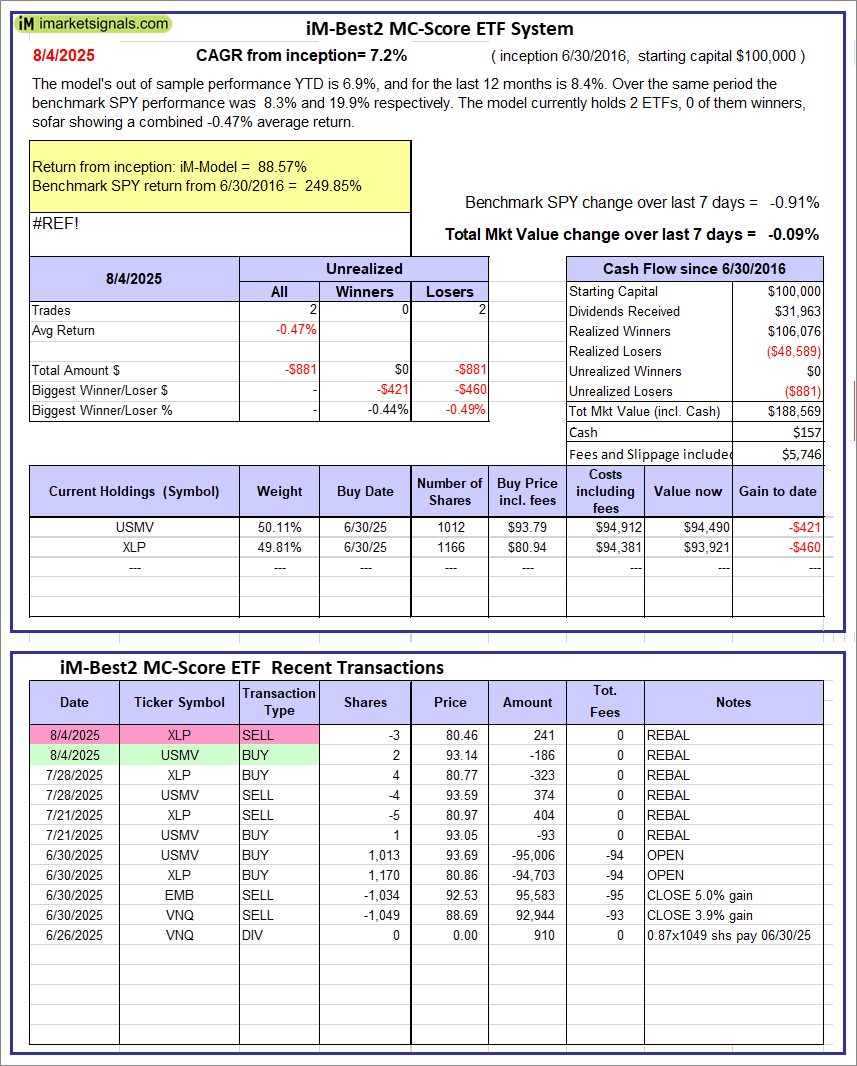 |
iM-Best2 MC-Score ETF System: The model’s out of sample performance YTD is 6.9%, and for the last 12 months is 8.4%. Over the same period the benchmark SPY performance was 8.3% and 19.9% respectively. Over the previous week the market value of the iM-Best2 MC-Score ETF System gained -0.09% at a time when SPY gained -0.91%. A starting capital of $100,000 at inception on 6/30/2016 would have grown to $188,569 which includes $157 cash and excludes $5,746 spent on fees and slippage. |
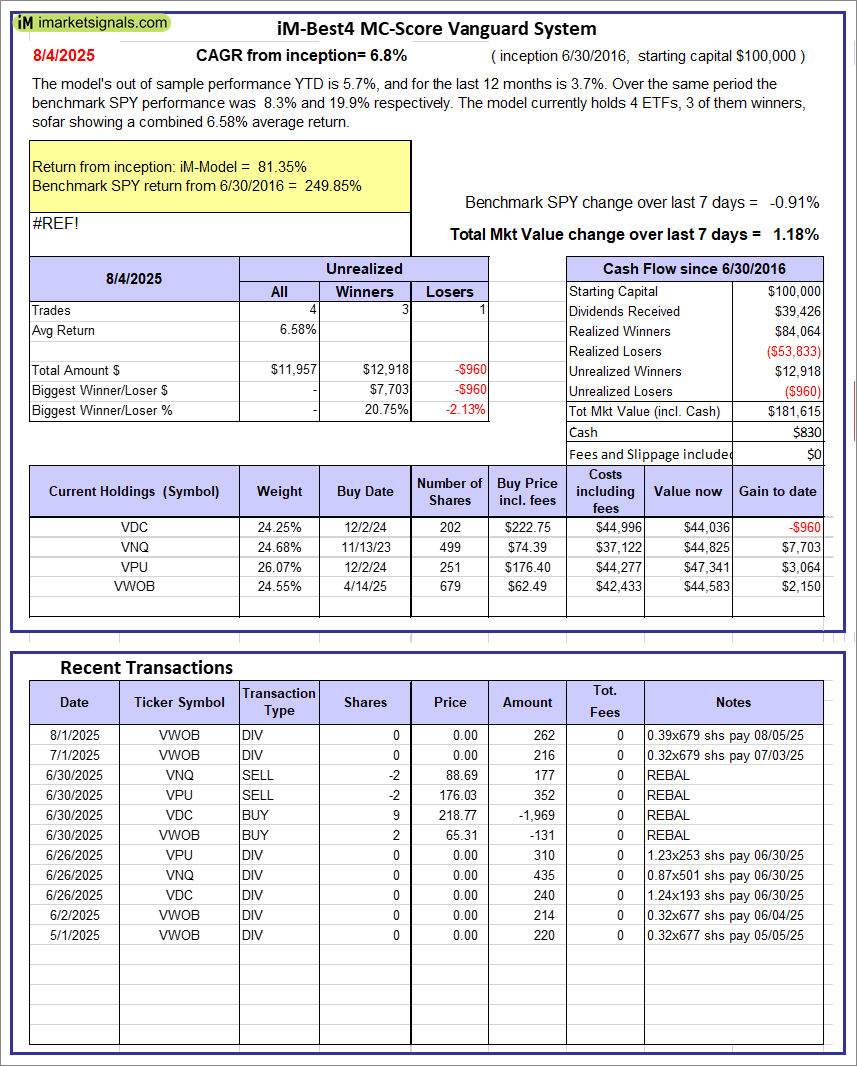 |
iM-Best4 MC-Score Vanguard System: The model’s out of sample performance YTD is 5.7%, and for the last 12 months is 3.7%. Over the same period the benchmark SPY performance was 8.3% and 19.9% respectively. Over the previous week the market value of the iM-Best4 MC-Score Vanguard System gained 1.18% at a time when SPY gained -0.91%. A starting capital of $100,000 at inception on 6/30/2016 would have grown to $181,615 which includes $830 cash and excludes $00 spent on fees and slippage. |
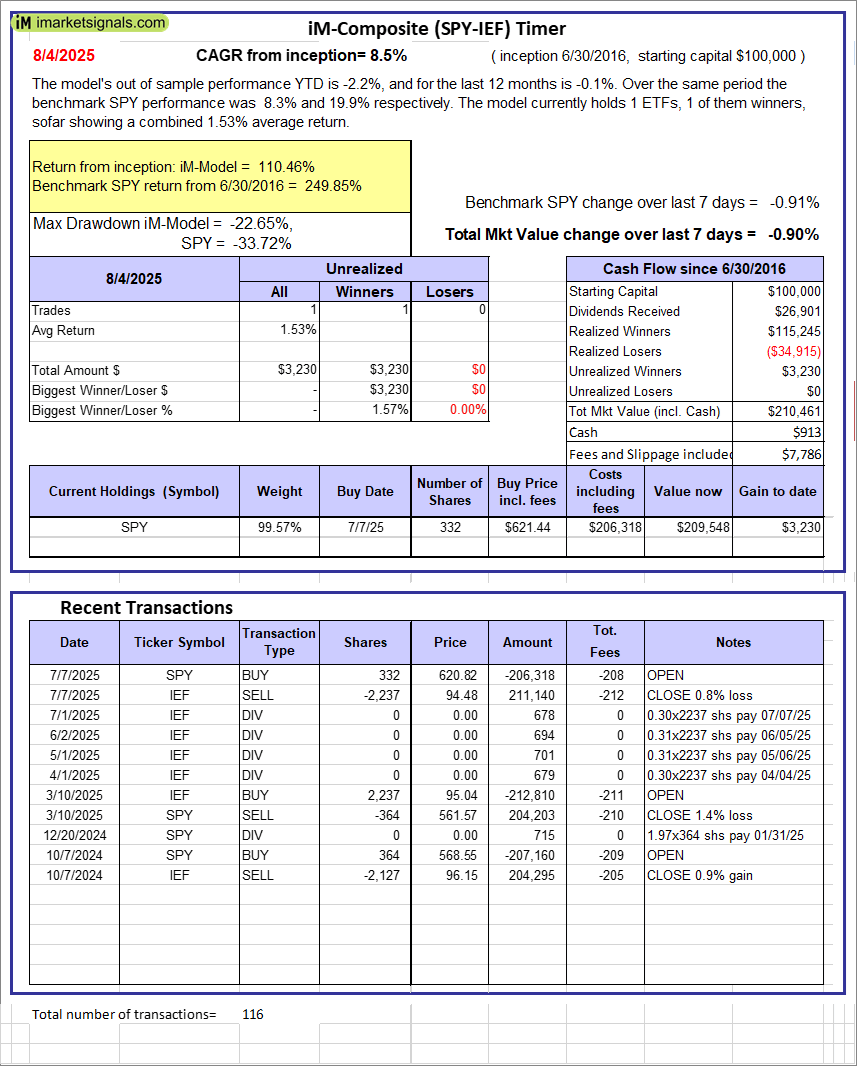 |
iM-Composite (SPY-IEF) Timer: The model’s out of sample performance YTD is -2.2%, and for the last 12 months is -0.1%. Over the same period the benchmark SPY performance was 8.3% and 19.9% respectively. Over the previous week the market value of the iM-Composite (SPY-IEF) Timer gained -0.90% at a time when SPY gained -0.91%. A starting capital of $100,000 at inception on 6/30/2016 would have grown to $210,461 which includes $913 cash and excludes $7,786 spent on fees and slippage. |
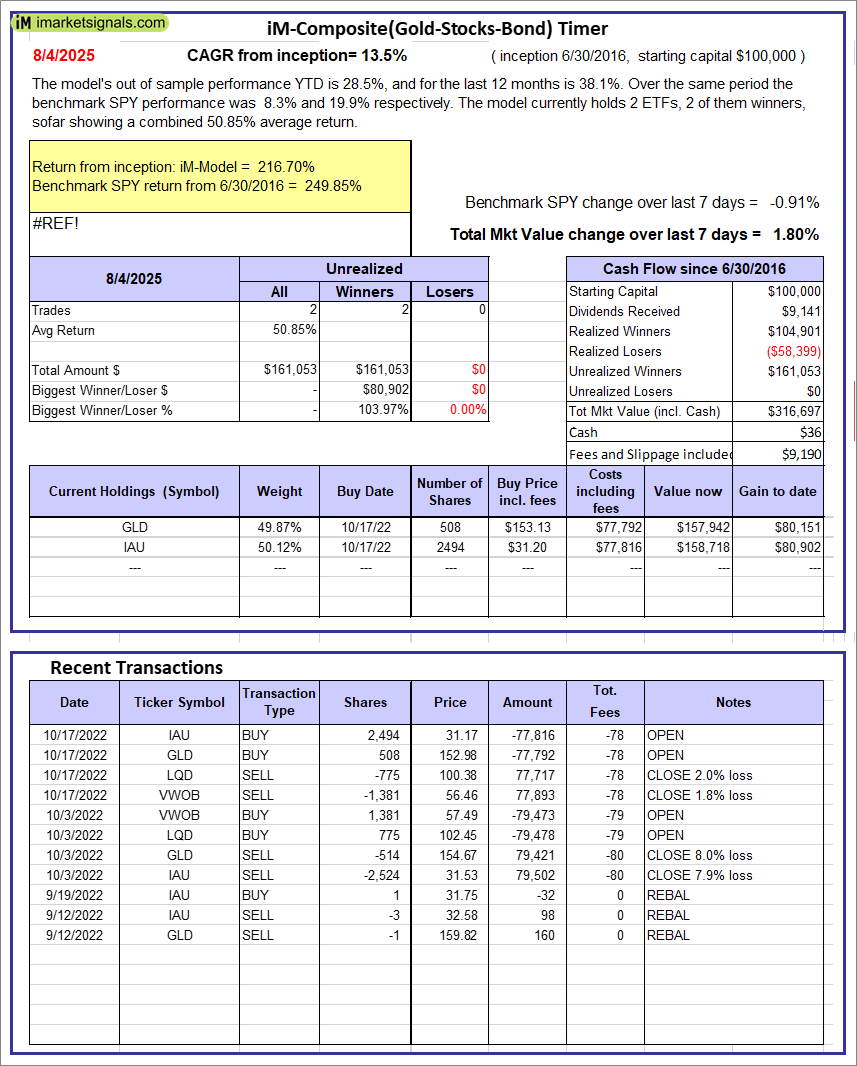 |
iM-Composite(Gold-Stocks-Bond) Timer: The model’s out of sample performance YTD is 28.5%, and for the last 12 months is 38.1%. Over the same period the benchmark SPY performance was 8.3% and 19.9% respectively. Over the previous week the market value of the iM-Composite(Gold-Stocks-Bond) Timer gained 1.80% at a time when SPY gained -0.91%. A starting capital of $100,000 at inception on 6/30/2016 would have grown to $316,697 which includes $36 cash and excludes $9,190 spent on fees and slippage. |
iM-Best Reports – 8/4/2025
Posted in pmp SPY-SH
Leave a Reply
You must be logged in to post a comment.