
  |
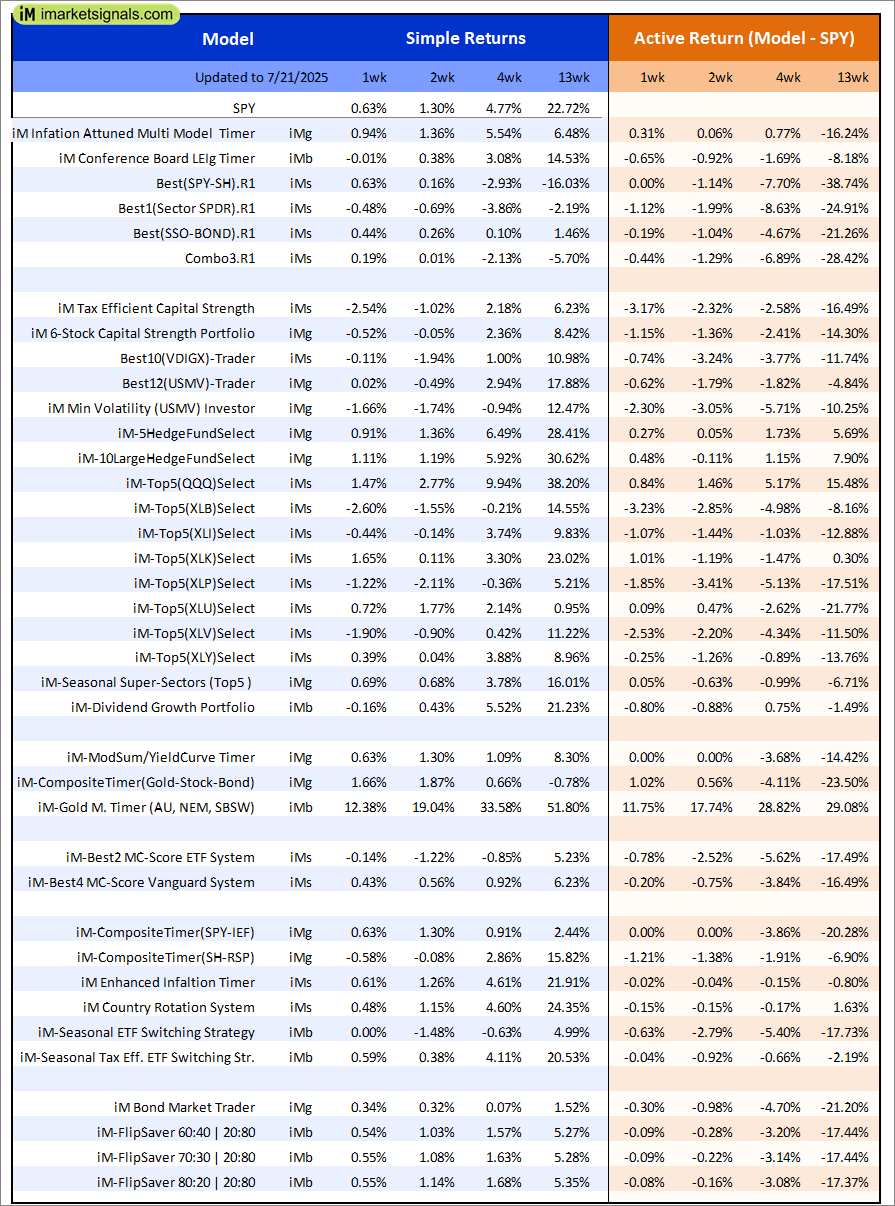
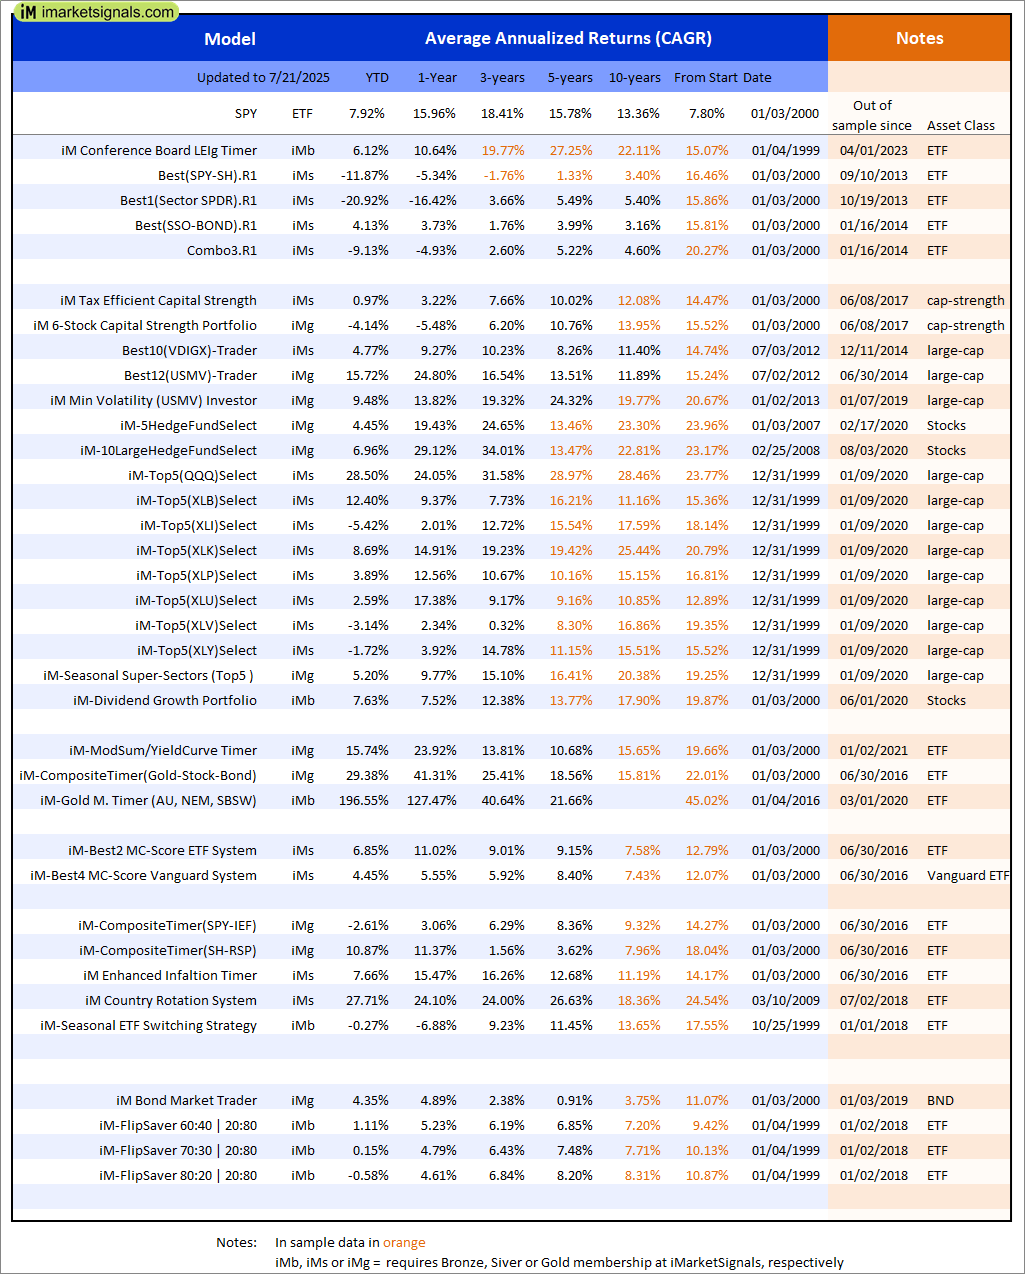
Out of sample performance summary of our models for the past 1, 2, 4 and 13 week periods. The active active return indicates how the models over- or underperformed the benchmark ETF SPY. Also the YTD, and the 1-, 3-, 5- and 10-year annualized returns are shown in the second table |
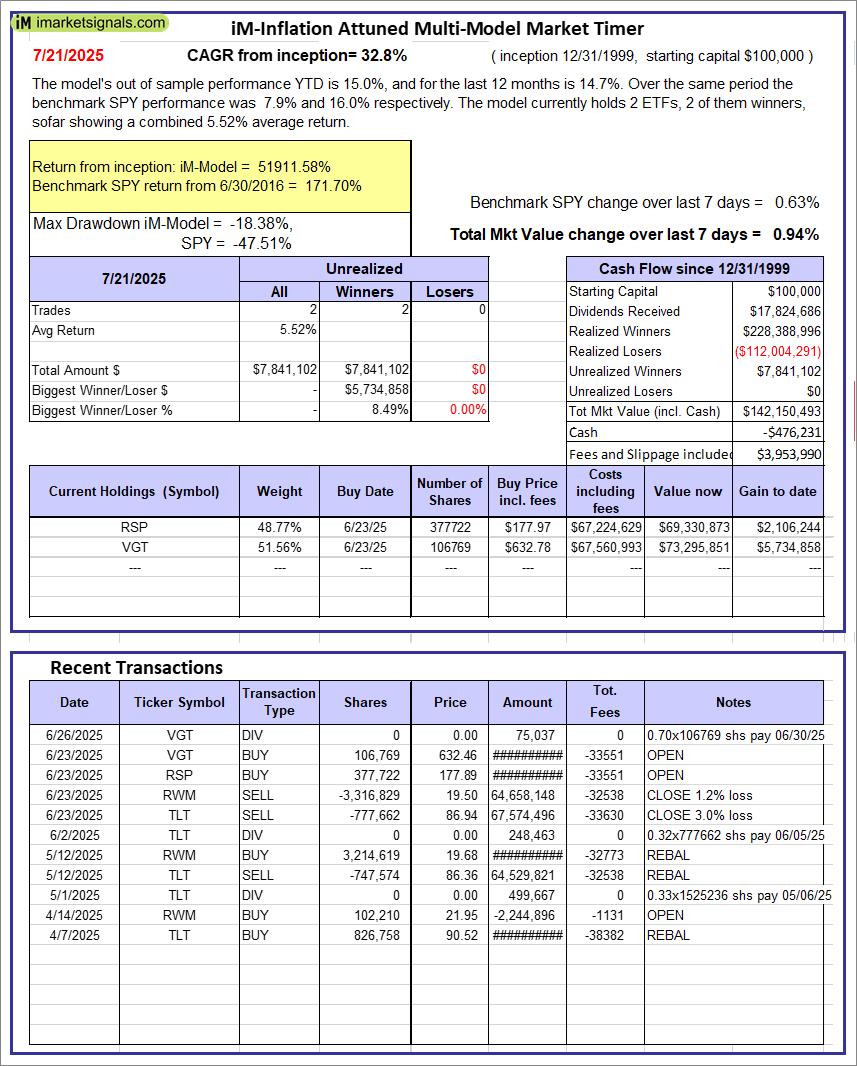 |
iM-Inflation Attuned Multi-Model Market Timer: The model’s out of sample performance YTD is 15.0%, and for the last 12 months is 14.7%. Over the same period the benchmark SPY performance was 7.9% and 16.0% respectively. Over the previous week the market value of the iM-Inflation Attuned Multi-Model Market Timer gained 0.94% at a time when SPY gained 0.63%. A starting capital of $100,000 at inception on 3/24/2017 would have grown to $142,150,493 which includes -$476,231 cash and excludes $3,953,990 spent on fees and slippage. |
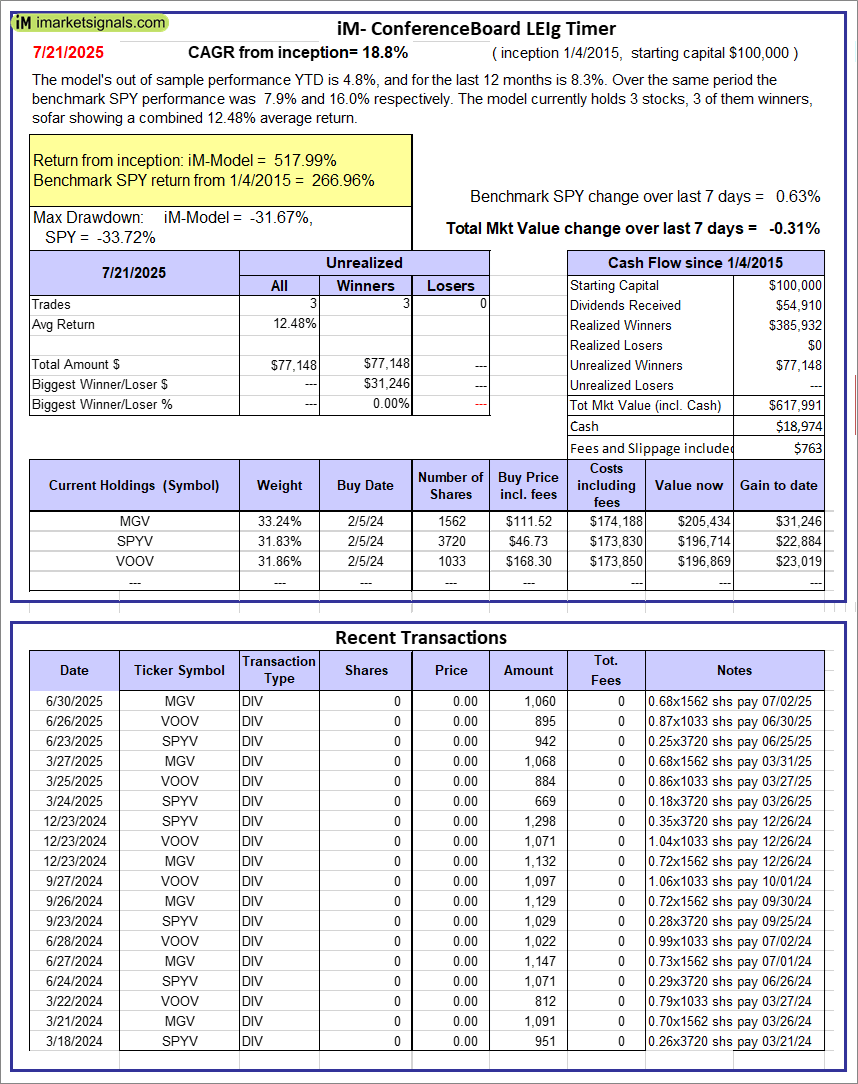 |
iM-Conference Board LEIg Timer: The model’s performance YTD is 14.3%, and for the last 12 months is 7.3%. Over the same period the benchmark SPY performance was 20.1% and 9.4% respectively. Over the previous week the market value of the iM-Conference Board LEIg Timer gained -0.31% at a time when SPY gained 0.63%. A starting capital of $100,000 at inception on 4/5/2017 would have grown to $617,991 which includes $18,974 cash and excludes $763 spent on fees and slippage. |
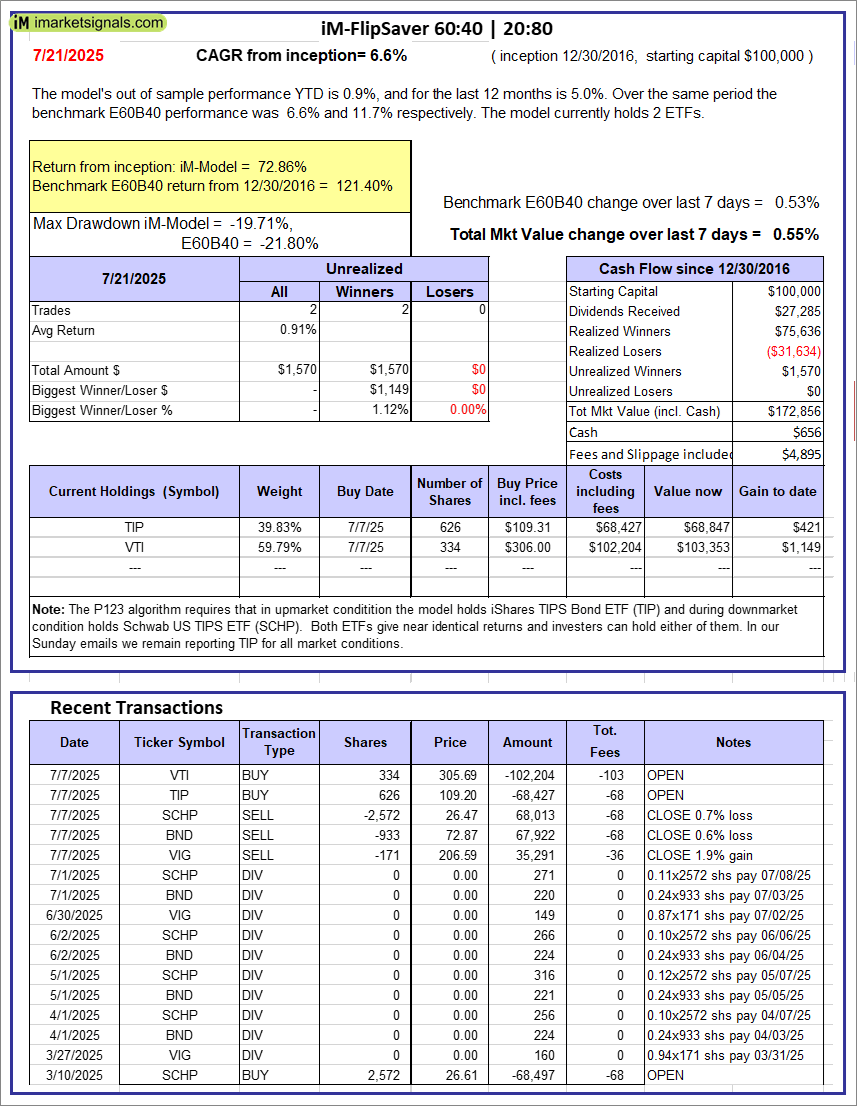 |
iM-FlipSaver 60:40 | 20:80 – 2017: The model’s out of sample performance YTD is 0.9%, and for the last 12 months is 5.0%. Over the same period the benchmark E60B40 performance was 6.6% and 11.7% respectively. Over the previous week the market value of iM-FlipSaver 80:20 | 20:80 gained 0.55% at a time when SPY gained 0.53%. A starting capital of $100,000 at inception on 7/16/2015 would have grown to $172,856 which includes $656 cash and excludes $4,895 spent on fees and slippage. |
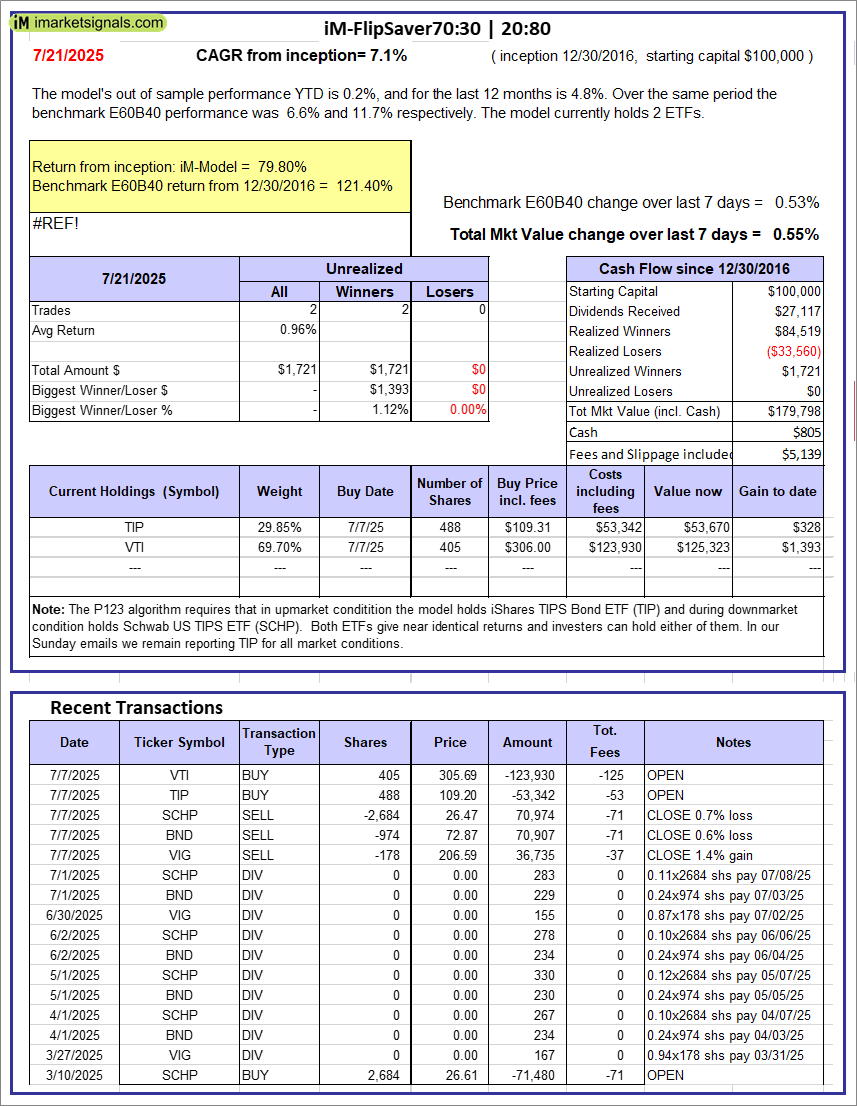 |
iM-FlipSaver 70:30 | 20:80 – 2017: The model’s out of sample performance YTD is 0.2%, and for the last 12 months is 4.8%. Over the same period the benchmark E60B40 performance was 6.6% and 11.7% respectively. Over the previous week the market value of iM-FlipSaver 70:30 | 20:80 gained 0.55% at a time when SPY gained 0.53%. A starting capital of $100,000 at inception on 7/15/2015 would have grown to $179,798 which includes $805 cash and excludes $5,139 spent on fees and slippage. |
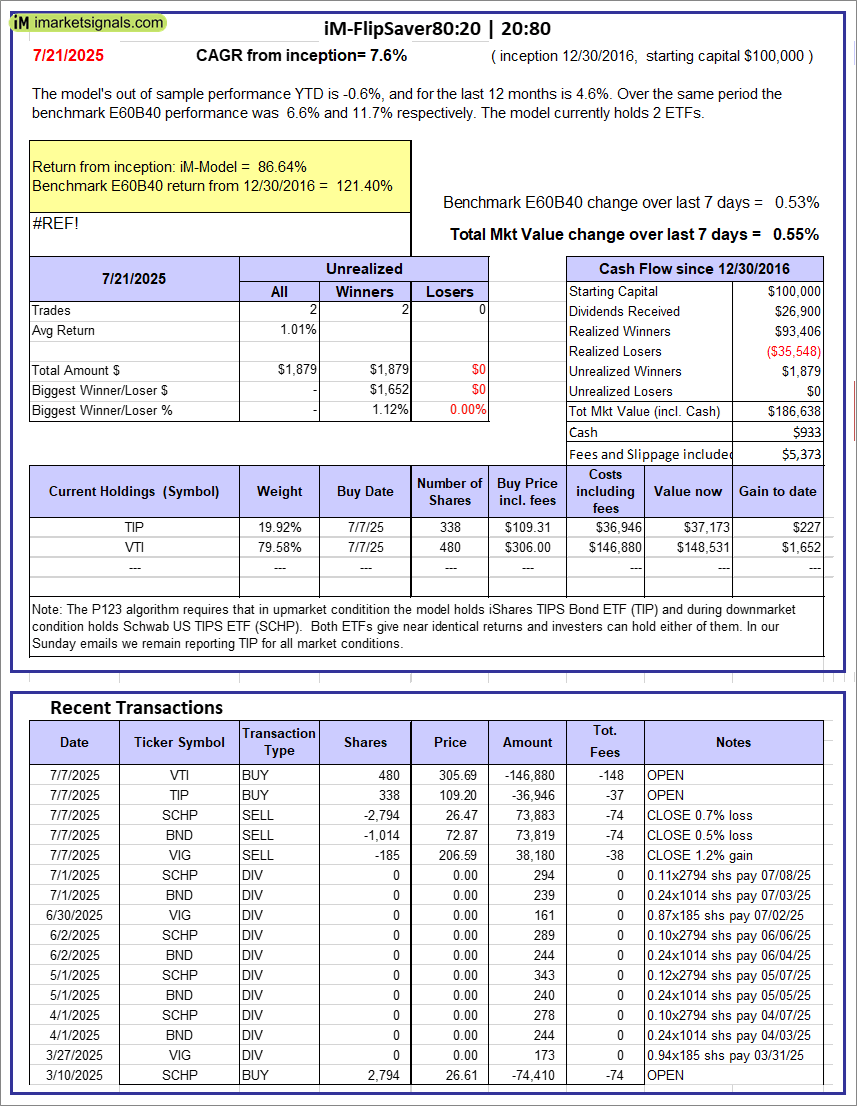 |
iM-FlipSaver 80:20 | 20:80 – 2017: The model’s out of sample performance YTD is -0.6%, and for the last 12 months is 4.6%. Over the same period the benchmark E60B40 performance was 6.6% and 11.7% respectively. Over the previous week the market value of iM-FlipSaver 80:20 | 20:80 gained 0.55% at a time when SPY gained 0.53%. A starting capital of $100,000 at inception on 1/2/2017 would have grown to $186,638 which includes $933 cash and excludes $5,373 spent on fees and slippage. |
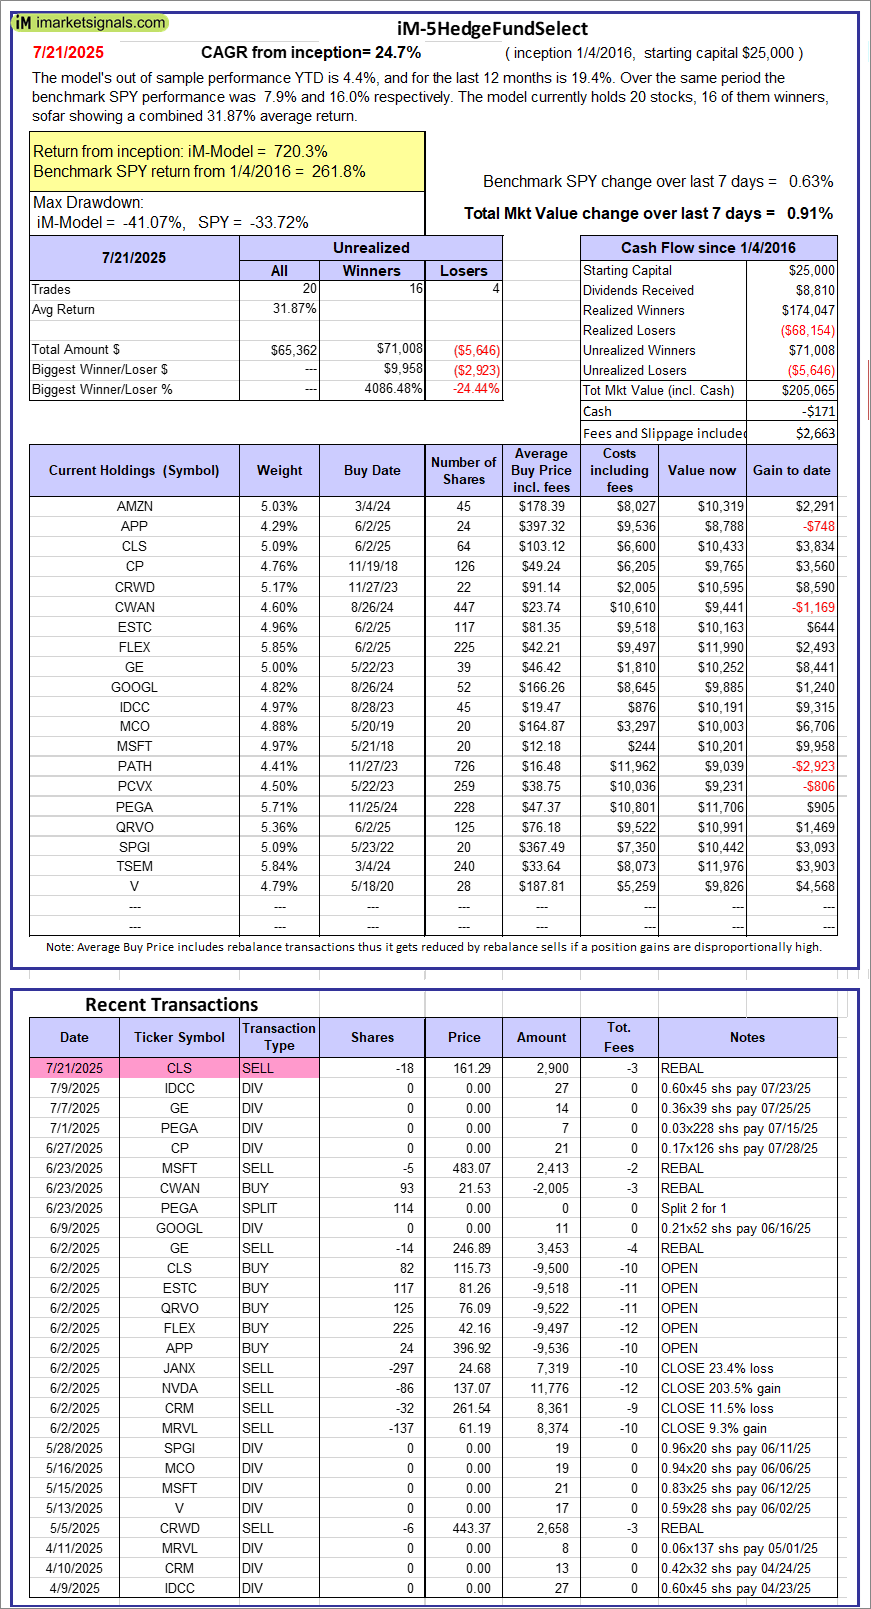 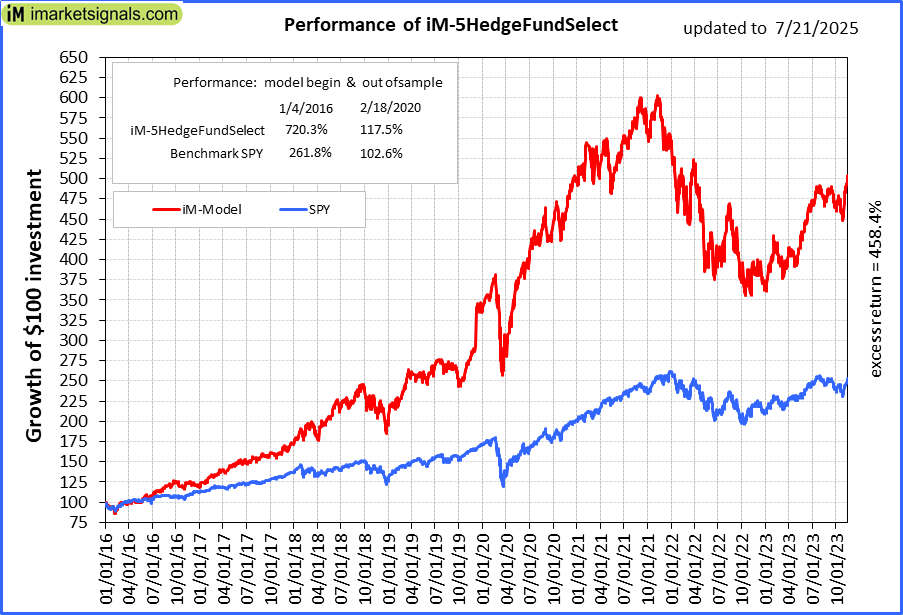 |
iM-5HedgeFundSelect: Since inception, on 1/5/2016, the model gained 720.26% while the benchmark SPY gained 261.82% over the same period. Over the previous week the market value of iM-5HedgeFundSelect gained 0.91% at a time when SPY gained 0.63%. A starting capital of $25,000 at inception on 1/5/2016 would have grown to $205,065 which includes -$171 cash and excludes $2,663 spent on fees and slippage. |
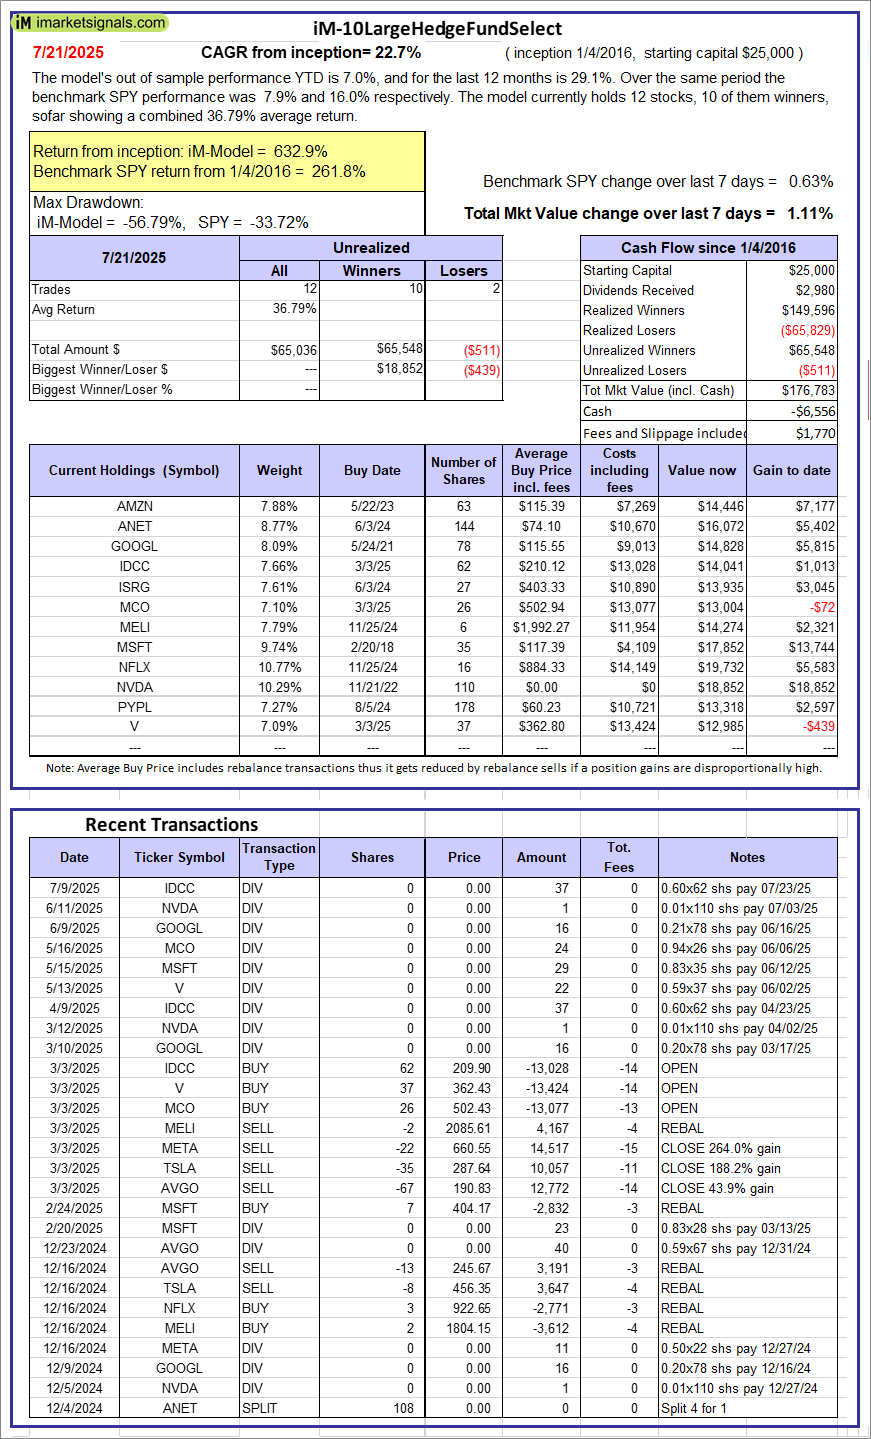 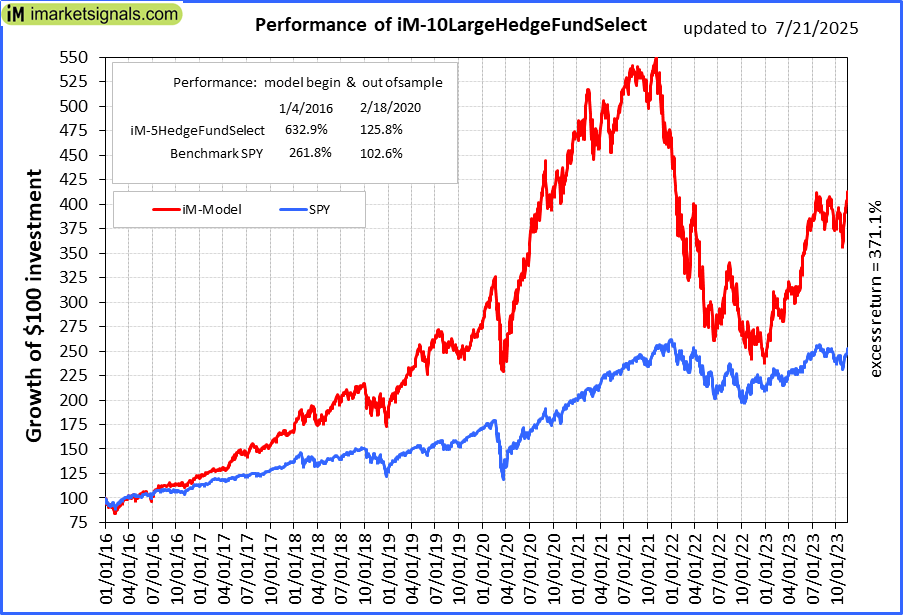 |
iM-10LargeHedgeFundSelect: Since inception, on 1/5/2016, the model gained 632.93% while the benchmark SPY gained 261.82% over the same period. Over the previous week the market value of iM-10LargeHedgeFundSelect gained 1.11% at a time when SPY gained 0.63%. A starting capital of $25,000 at inception on 1/5/2016 would have grown to $176,783 which includes -$6,556 cash and excludes $1,770 spent on fees and slippage. |
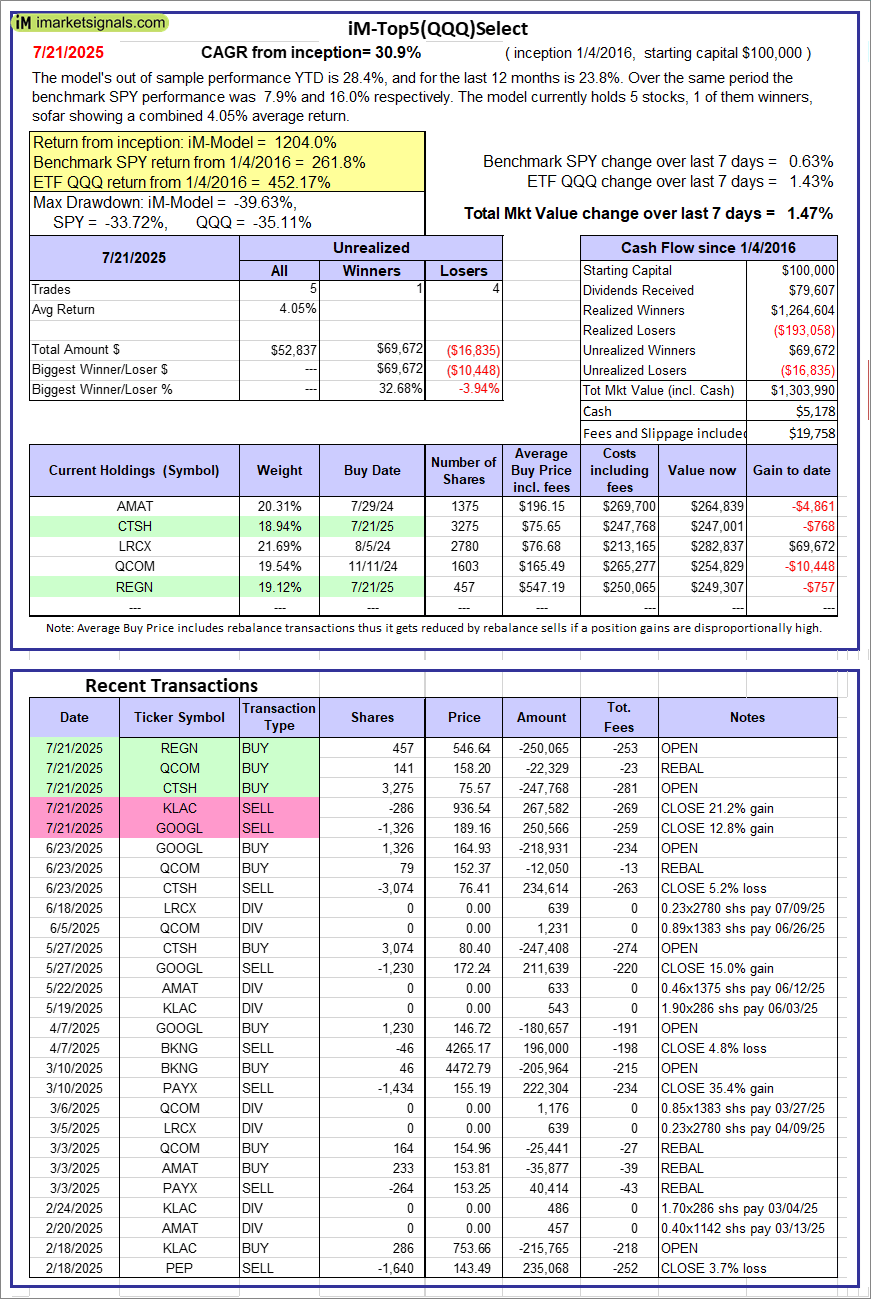 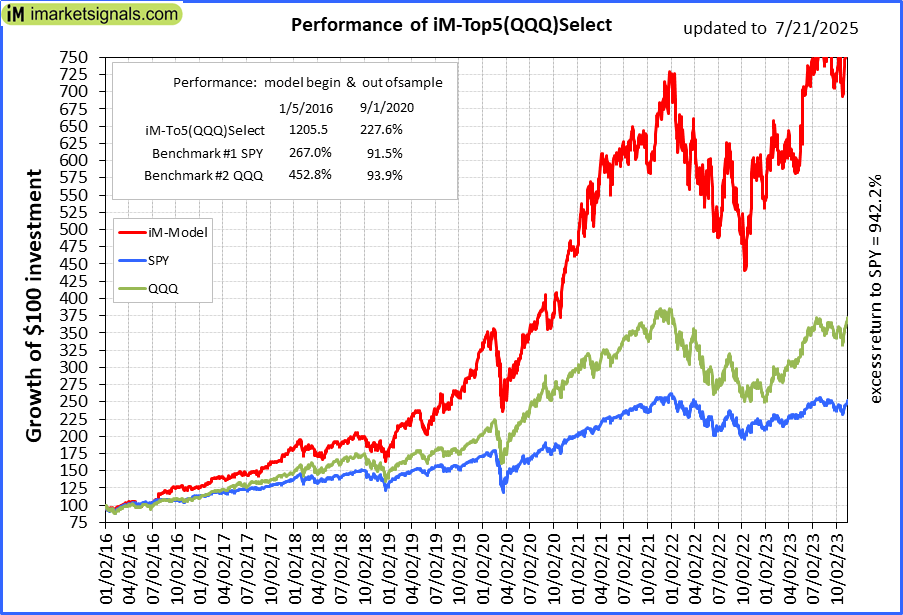 |
iM-Top5(QQQ)Select: Since inception, on 1/5/2016, the model gained 1203.99% while the benchmark SPY gained 261.82% over the same period. Over the previous week the market value of iM-Top5(QQQ)Select gained 1.47% at a time when SPY gained 0.63%. A starting capital of $100,000 at inception on 1/5/2016 would have grown to $1,303,990 which includes $5,178 cash and excludes $19,758 spent on fees and slippage. |
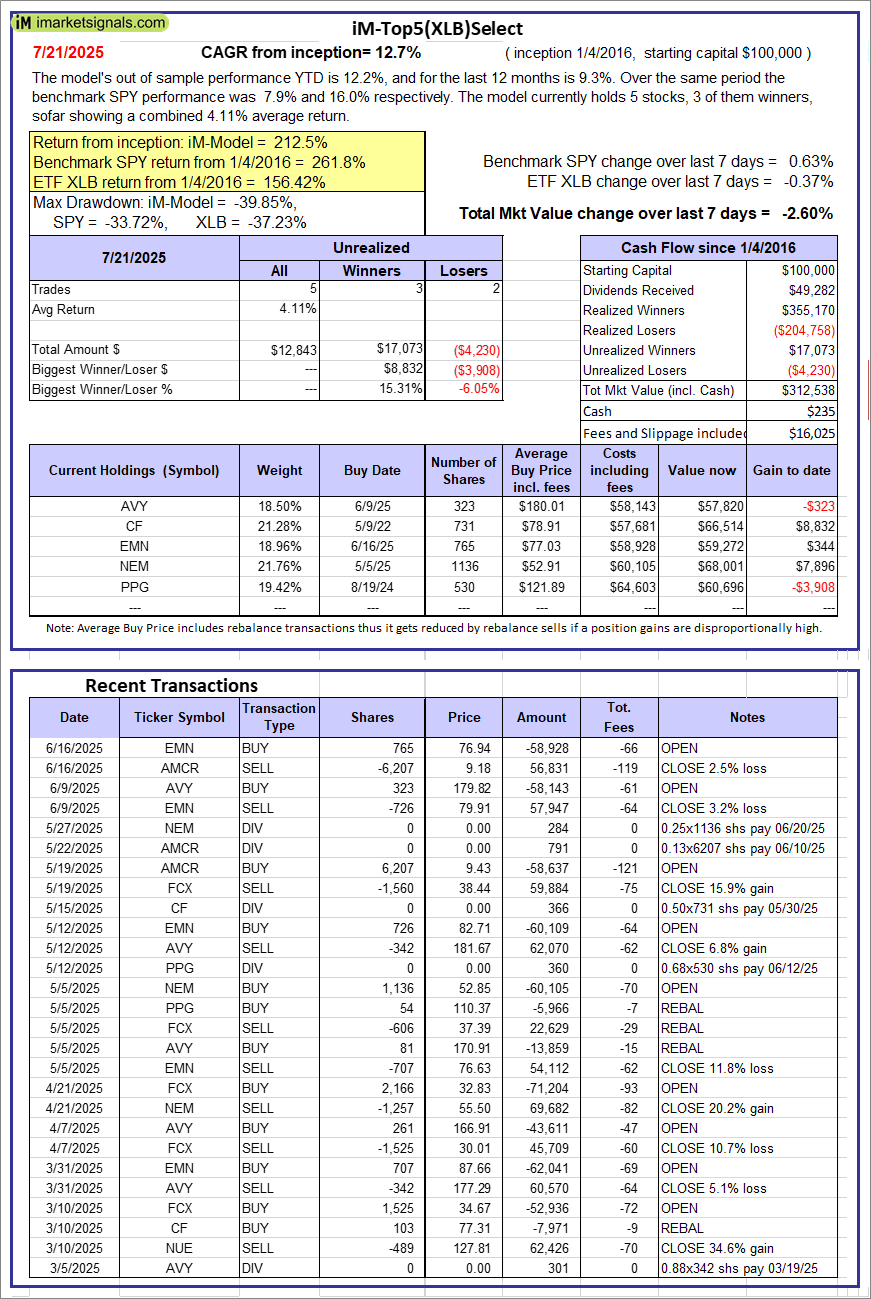 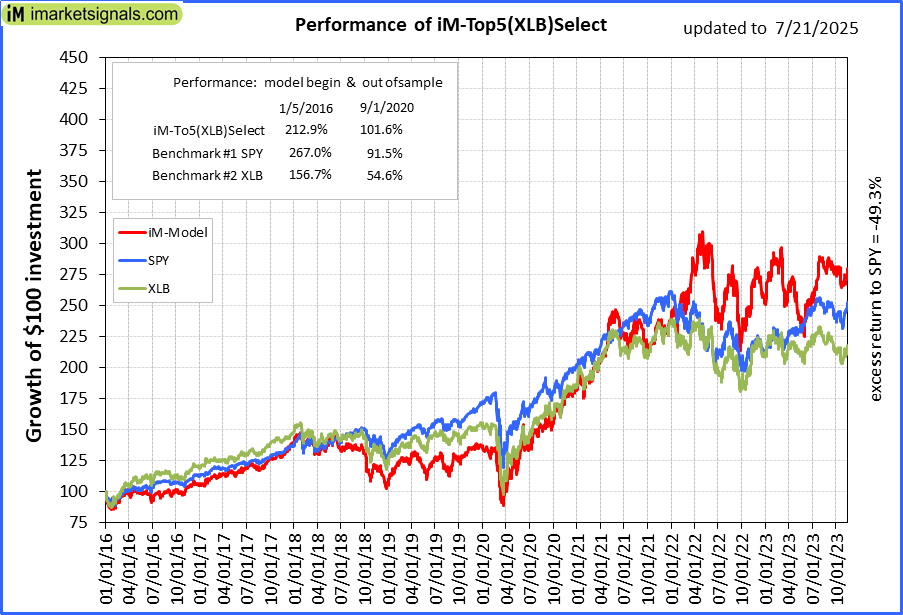 |
iM-Top5(XLB)Select: Since inception, on 1/5/2016, the model gained 212.54% while the benchmark SPY gained 261.82% over the same period. Over the previous week the market value of iM-Top5(XLB)Select gained -2.60% at a time when SPY gained 0.63%. A starting capital of $100,000 at inception on 1/5/2016 would have grown to $312,538 which includes $235 cash and excludes $16,025 spent on fees and slippage. |
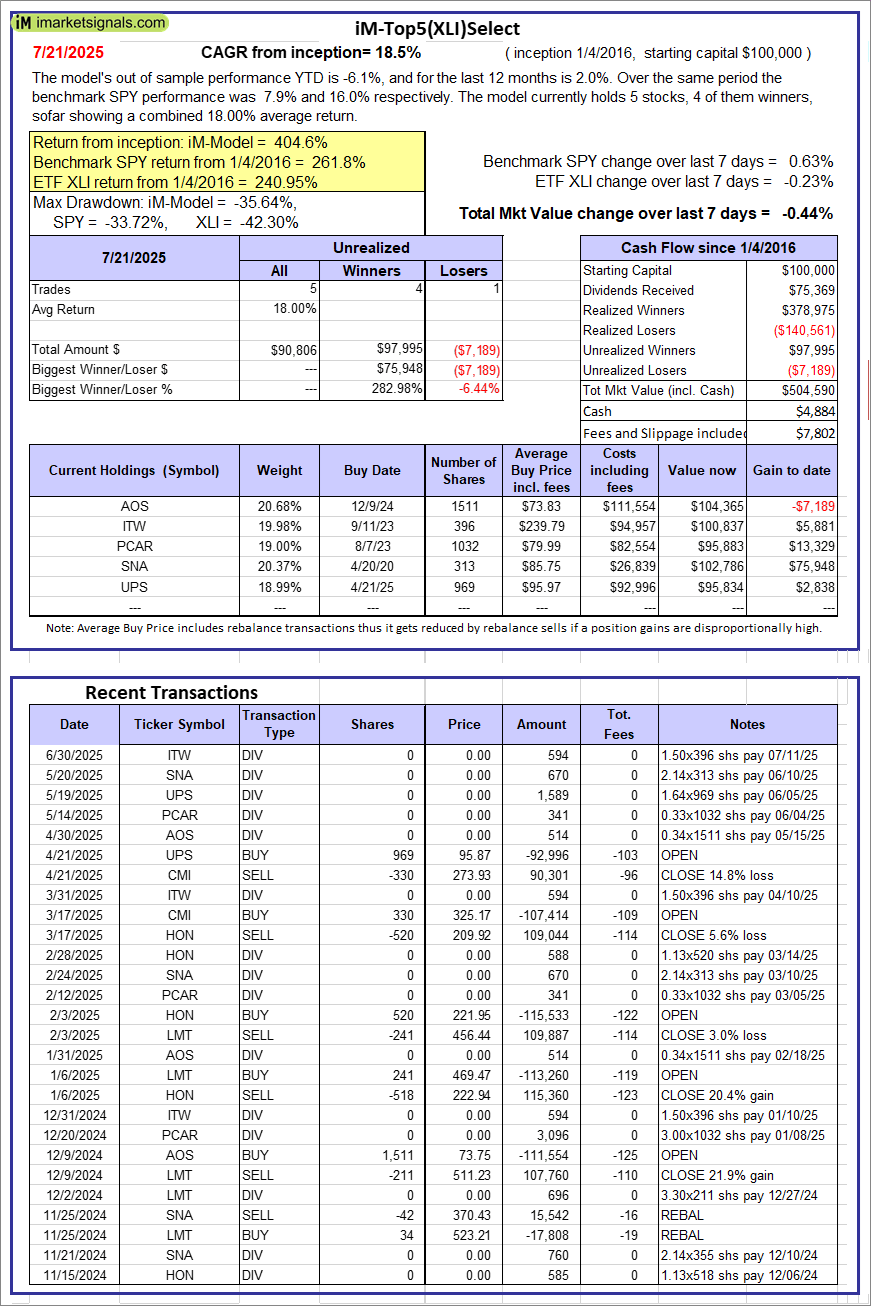 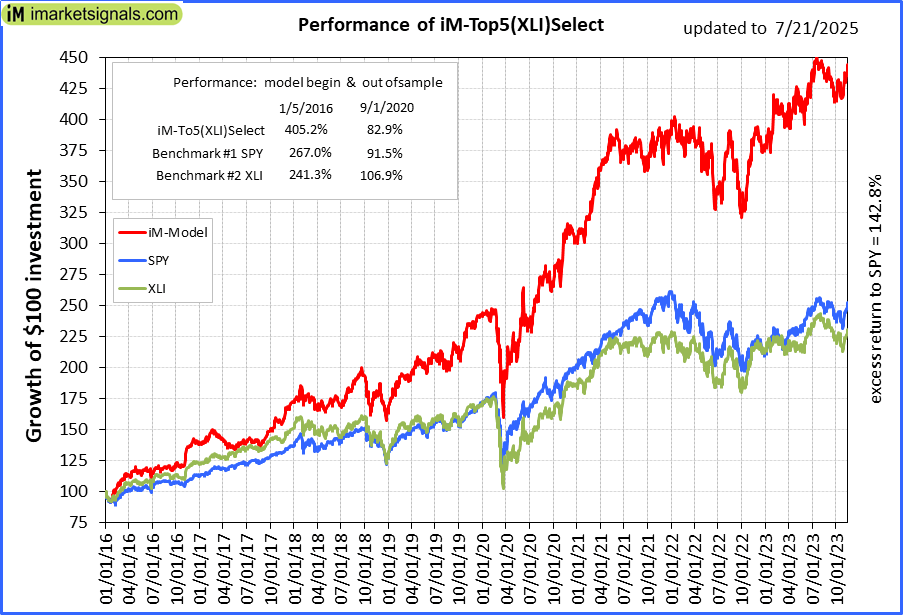 |
iM-Top5(XLI)Select: Since inception, on 1/5/2016, the model gained 404.59% while the benchmark SPY gained 261.82% over the same period. Over the previous week the market value of iM-Top5(XLI)Select gained -0.44% at a time when SPY gained 0.63%. A starting capital of $100,000 at inception on 1/5/2016 would have grown to $504,590 which includes $4,884 cash and excludes $7,802 spent on fees and slippage. |
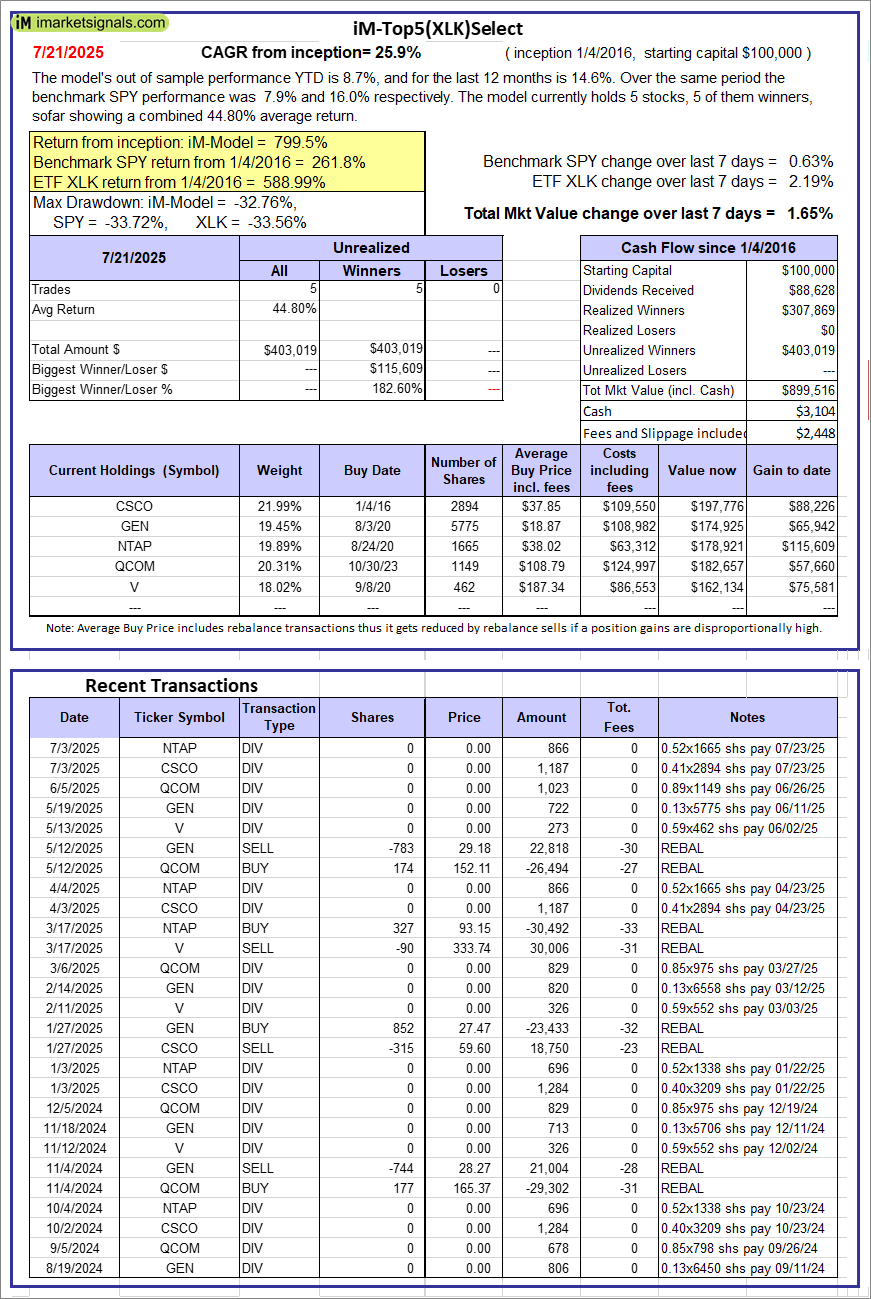 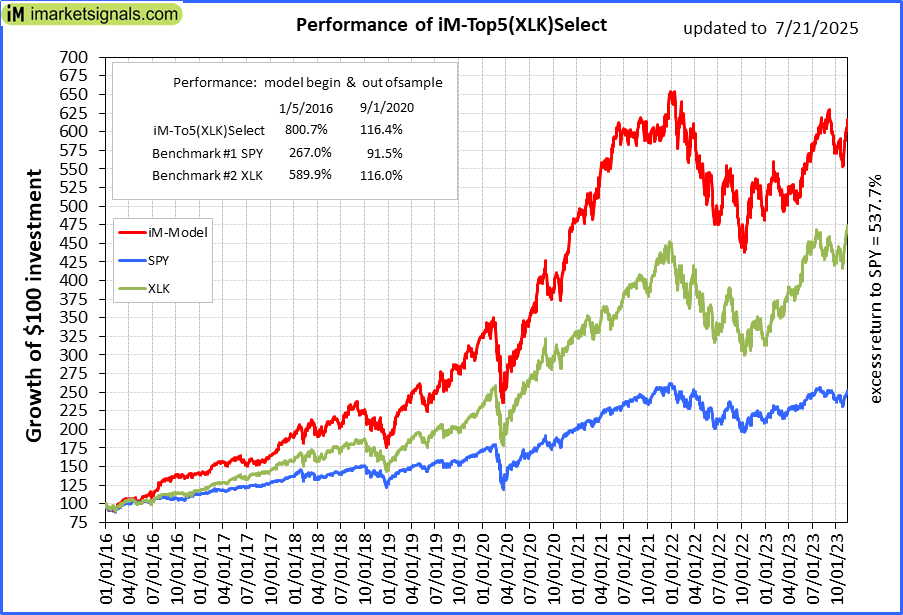 |
iM-Top5(XLK)Select: Since inception, on 1/5/2016, the model gained 799.52% while the benchmark SPY gained 261.82% over the same period. Over the previous week the market value of iM-Top5(XLK)Select gained 1.65% at a time when SPY gained 0.63%. A starting capital of $100,000 at inception on 1/5/2016 would have grown to $899,516 which includes $3,104 cash and excludes $2,448 spent on fees and slippage. |
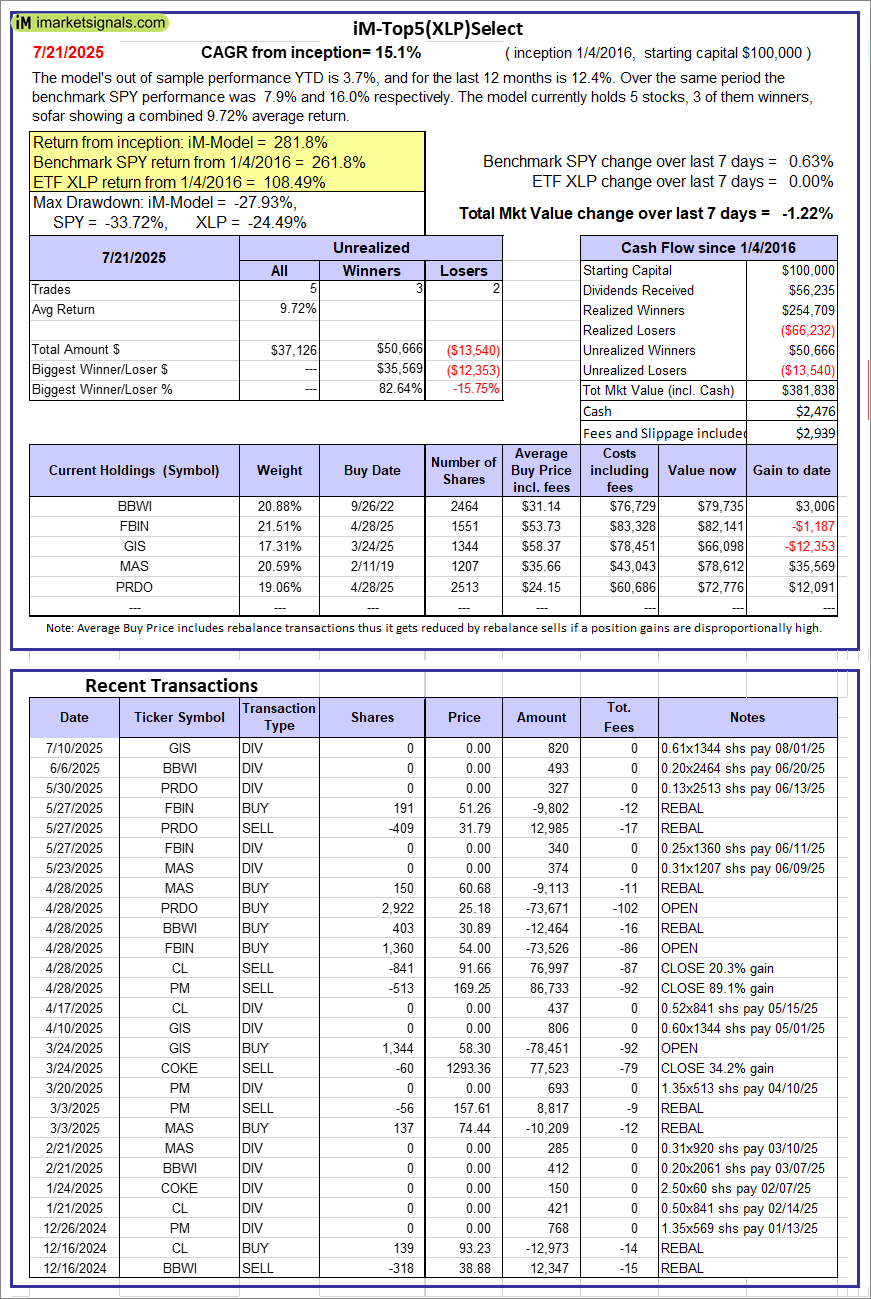 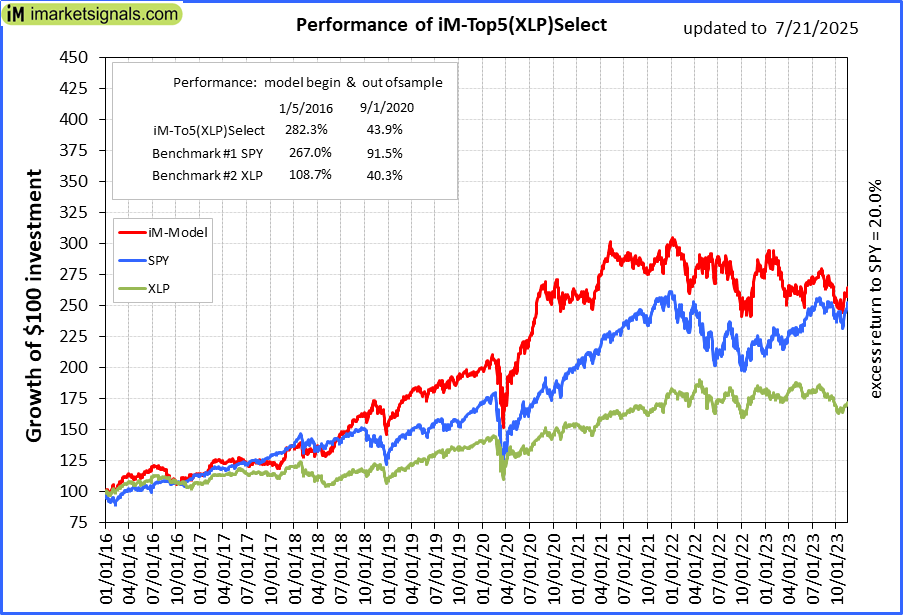 |
iM-Top5(XLP)Select: Since inception, on 1/5/2016, the model gained 281.84% while the benchmark SPY gained 261.82% over the same period. Over the previous week the market value of iM-Top5(XLP)Select gained -1.22% at a time when SPY gained 0.63%. A starting capital of $100,000 at inception on 1/5/2016 would have grown to $381,838 which includes $2,476 cash and excludes $2,939 spent on fees and slippage. |
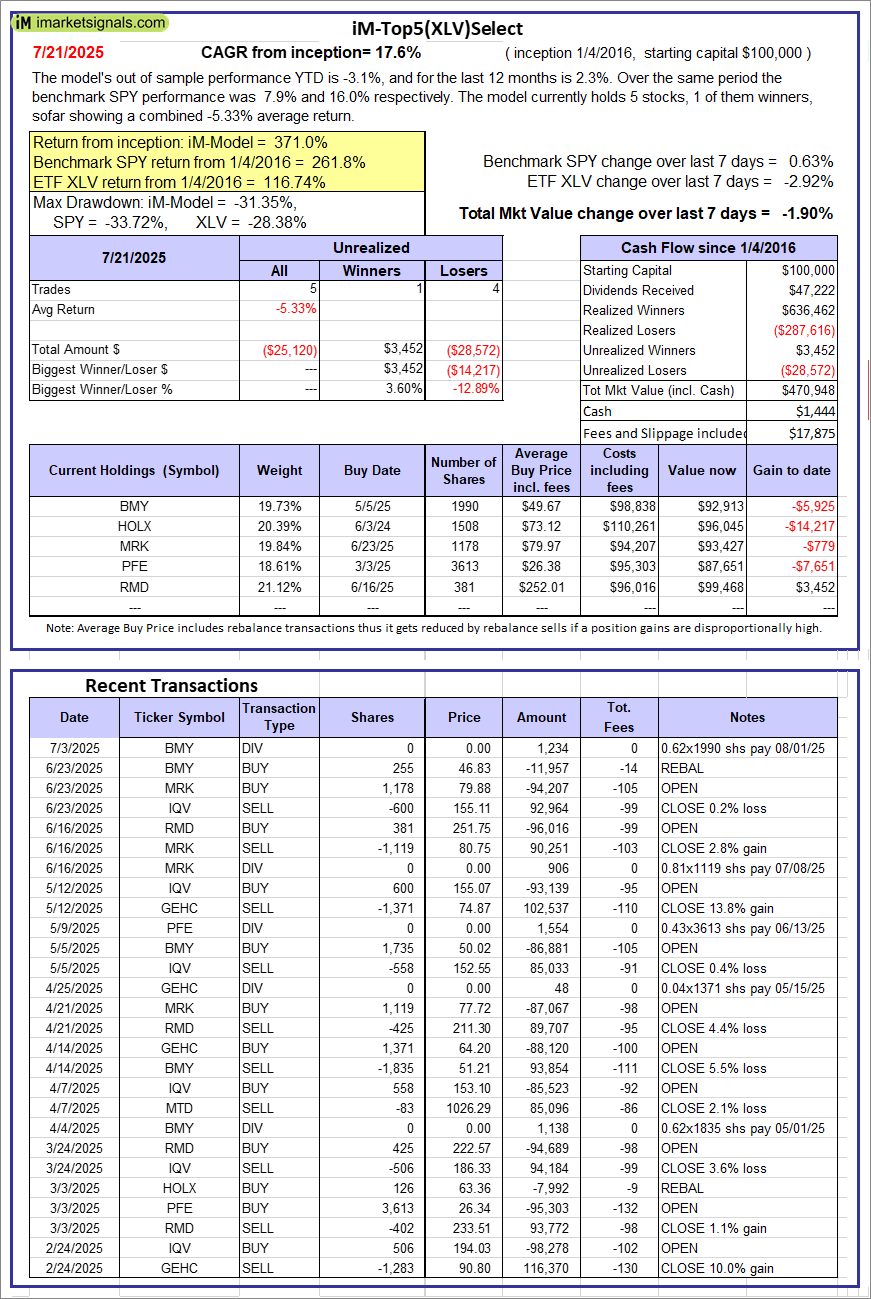  |
iM-Top5(XLV)Select: Since inception, on 1/5/2016, the model gained 370.95% while the benchmark SPY gained 261.82% over the same period. Over the previous week the market value of iM-Top5(XLV)Select gained -1.90% at a time when SPY gained 0.63%. A starting capital of $100,000 at inception on 1/5/2016 would have grown to $470,948 which includes $1,444 cash and excludes $17,875 spent on fees and slippage. |
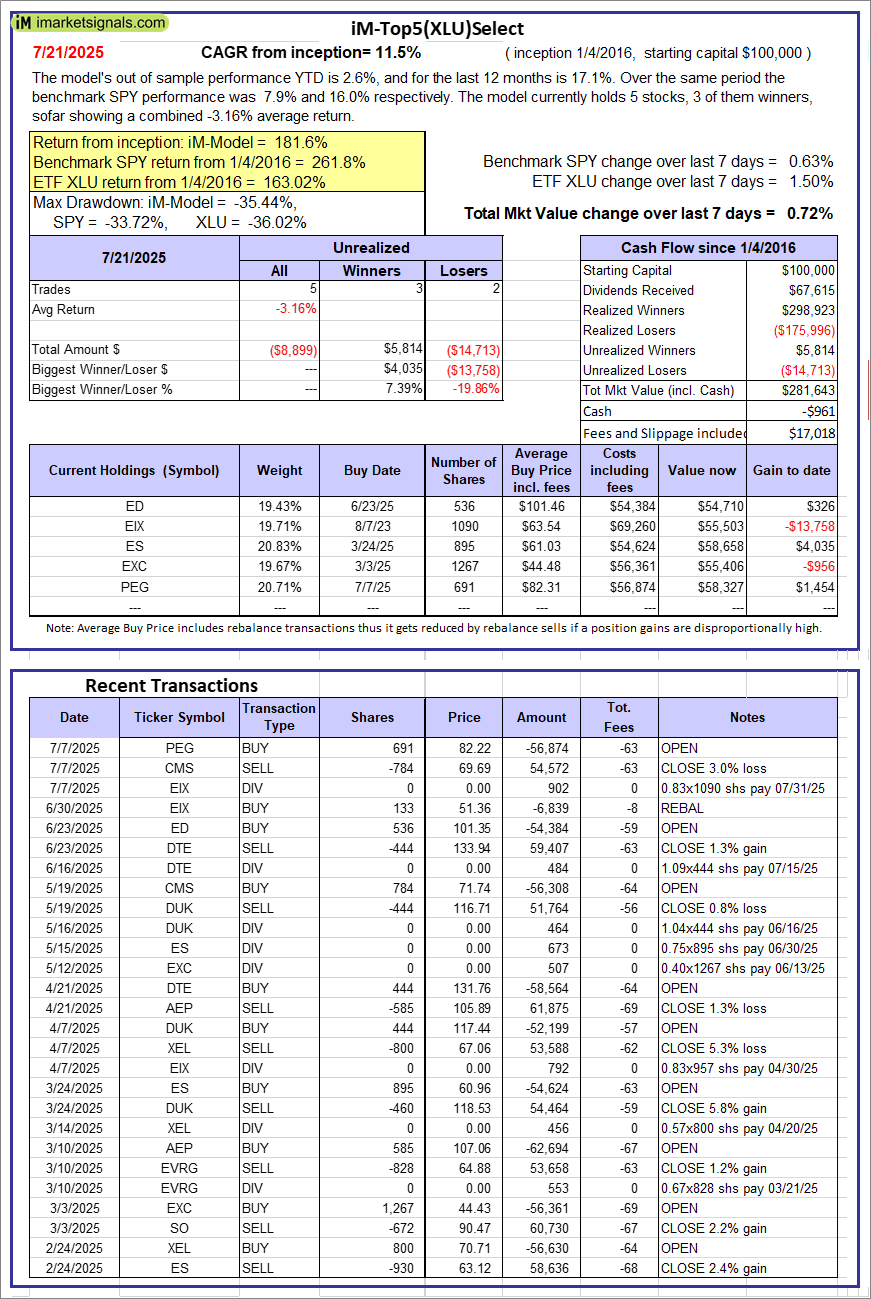 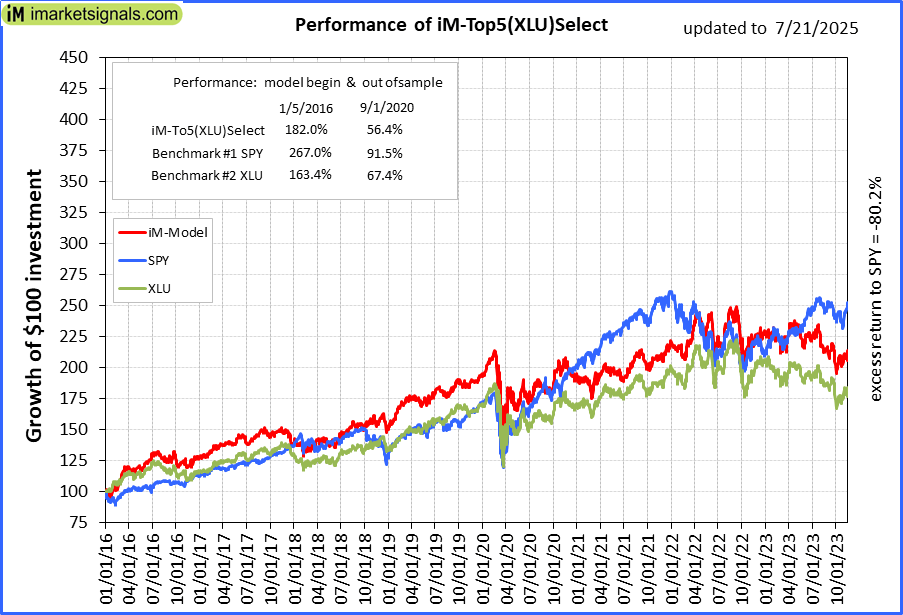 |
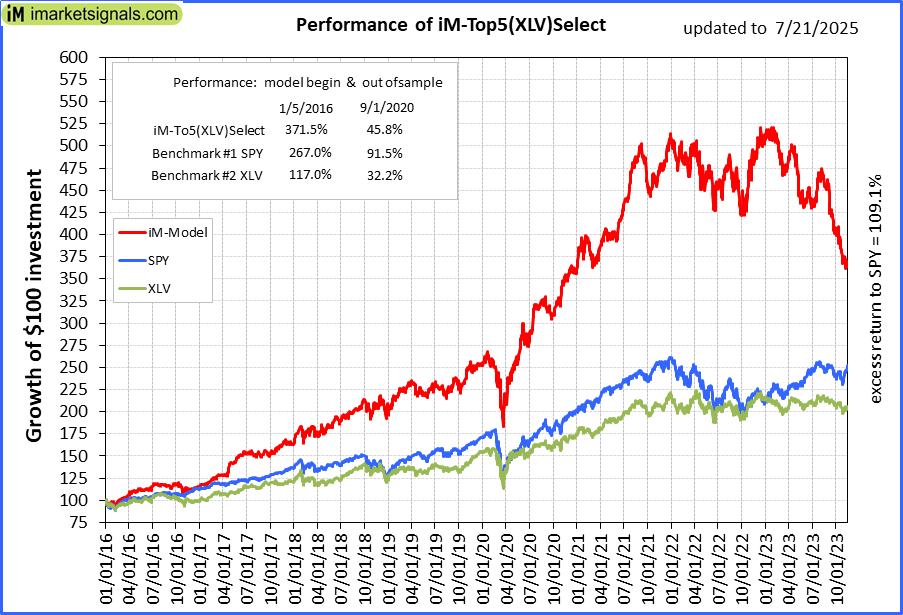
iM-Top5(XLU)Select: Since inception, on 1/5/2016, the model gained 181.64% while the benchmark SPY gained 261.82% over the same period. Over the previous week the market value of iM-Top5(XLU)Select gained 0.72% at a time when SPY gained 0.63%. A starting capital of $100,000 at inception on 1/5/2016 would have grown to $281,643 which includes -$961 cash and excludes $17,018 spent on fees and slippage. |
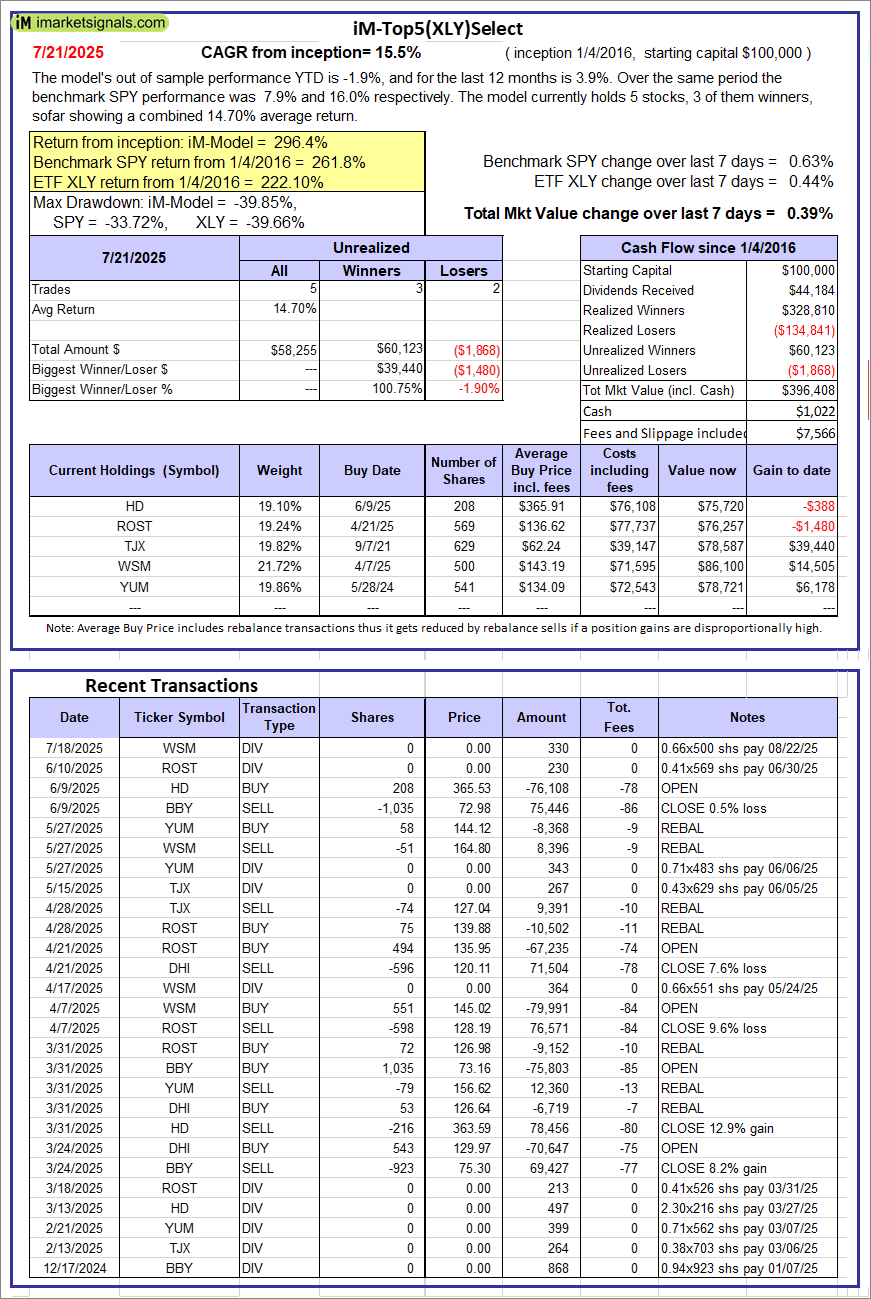 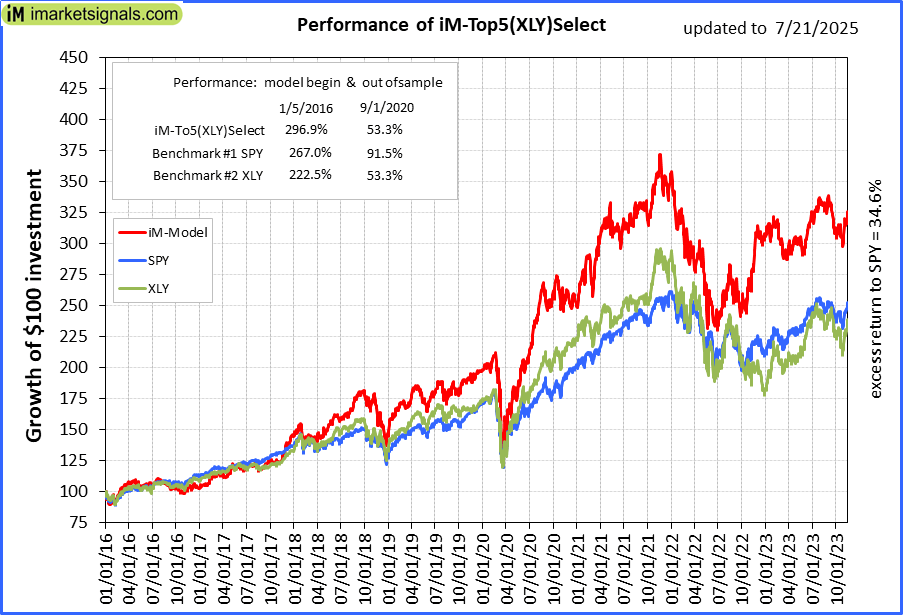 |
iM-Top5(XLY)Select: Since inception, on 1/5/2016, the model gained 296.41% while the benchmark SPY gained 261.82% over the same period. Over the previous week the market value of iM-Top5(XLY)Select gained 0.39% at a time when SPY gained 0.63%. A starting capital of $100,000 at inception on 1/5/2016 would have grown to $396,408 which includes $1,022 cash and excludes $7,566 spent on fees and slippage. |
 |
iM-Seasonal Super-Sectors (Top5 combo) : Since inception, on 11/17/2020, the model gained 84.80% while the benchmark SPY gained 87.82% over the same period. Over the previous week the market value of iM-Seasonal Super-Sectors (Top5 combo) gained 0.69% at a time when SPY gained 0.63%. A starting capital of $100,000 at inception on 11/17/2020 would have grown to $184,804 which includes $1,989 cash and excludes $00 spent on fees and slippage. |
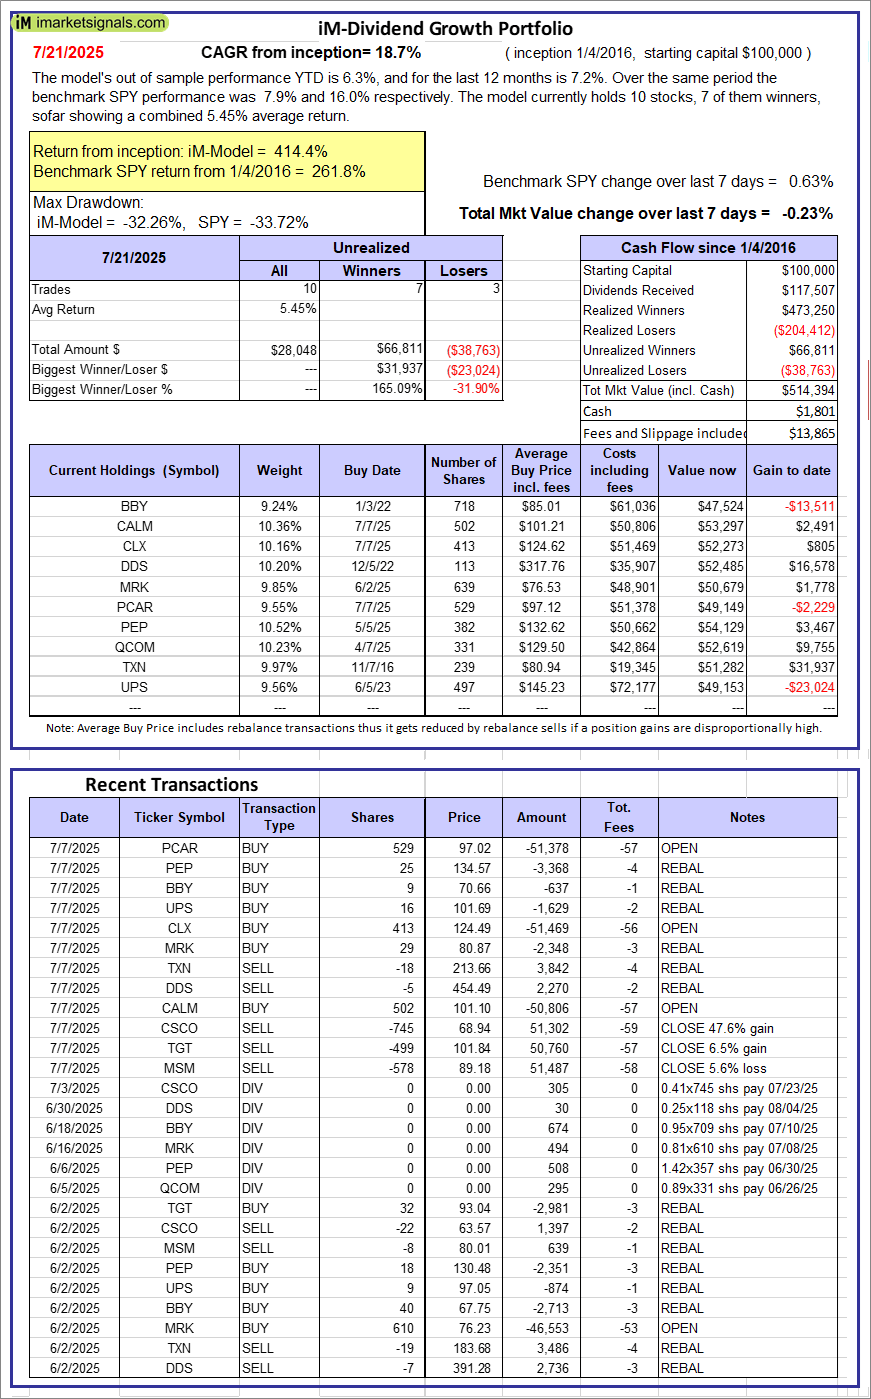 |
iM-Dividend Growth Portfolio: The model’s out of sample performance YTD is 6.3%, and for the last 12 months is 7.2%. Over the same period the benchmark SPY performance was 7.9% and 16.0% respectively. Over the previous week the market value of the iM-Dividend Growth Portfolio gained -0.23% at a time when SPY gained 0.63%. A starting capital of $100,000 at inception on 6/30/2016 would have grown to $514,394 which includes $1,801 cash and excludes $13,865 spent on fees and slippage. |
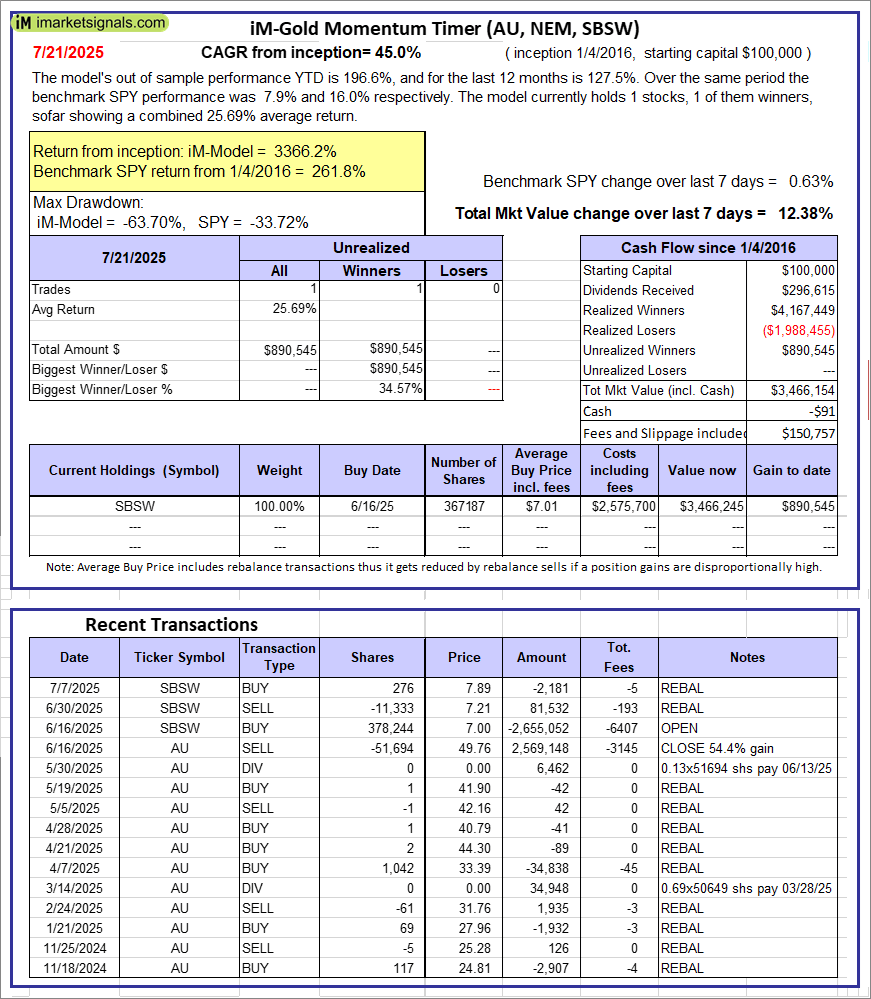 |
iM-Gold Momentum Timer (AU, NEM, SBSW): The model’s out of sample performance YTD is 196.6%, and for the last 12 months is 127.5%. Over the same period the benchmark SPY performance was 7.9% and 16.0% respectively. Over the previous week the market value of iM-Gold Momentum Timer (AU, NEM, SBSW) gained 12.38% at a time when SPY gained 0.63%. A starting capital of $100,000 at inception on 6/30/2016 would have grown to -$91 which includes $150,757 cash and excludes Gain to date spent on fees and slippage. |
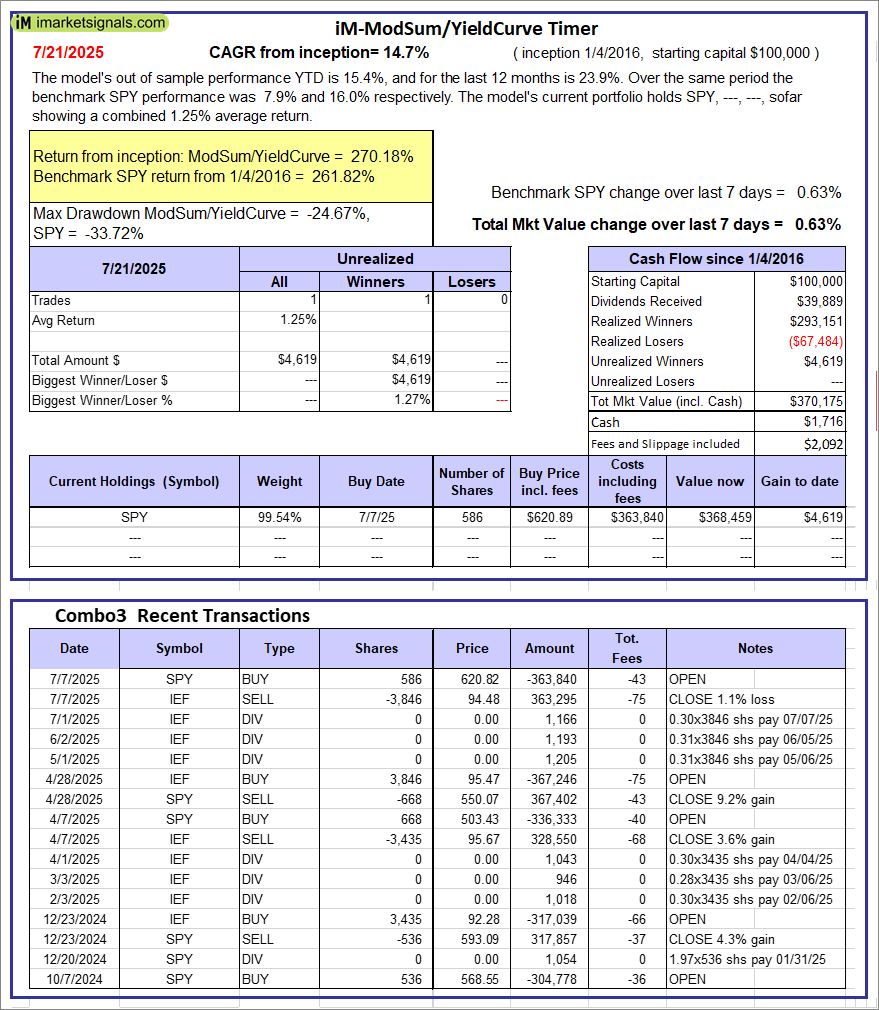 |
iM-ModSum/YieldCurve Timer: The model’s out of sample performance YTD is 15.4%, and for the last 12 months is 23.9%. Over the same period the benchmark SPY performance was 7.9% and 16.0% respectively. Over the previous week the market value of iM-PortSum/YieldCurve Timer gained 0.63% at a time when SPY gained 0.63%. A starting capital of $100,000 at inception on 1/1/2016 would have grown to $370,175 which includes $1,716 cash and excludes $2,092 spent on fees and slippage. |
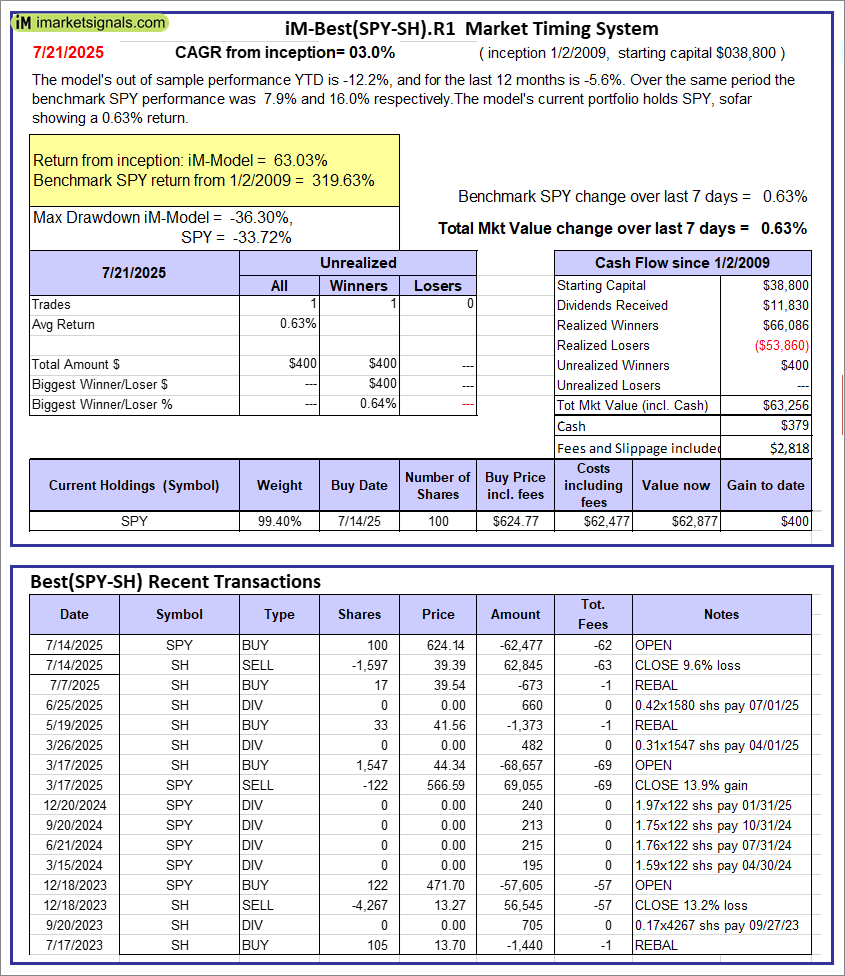 |
iM-Best(SPY-SH).R1: The model’s out of sample performance YTD is -12.2%, and for the last 12 months is -5.6%. Over the same period the benchmark SPY performance was 7.9% and 16.0% respectively. Over the previous week the market value of Best(SPY-SH) gained 0.63% at a time when SPY gained 0.63%. A starting capital of $100,000 at inception on 1/2/2009 would have grown to $63,256 which includes $379 cash and excludes $2,818 spent on fees and slippage. |
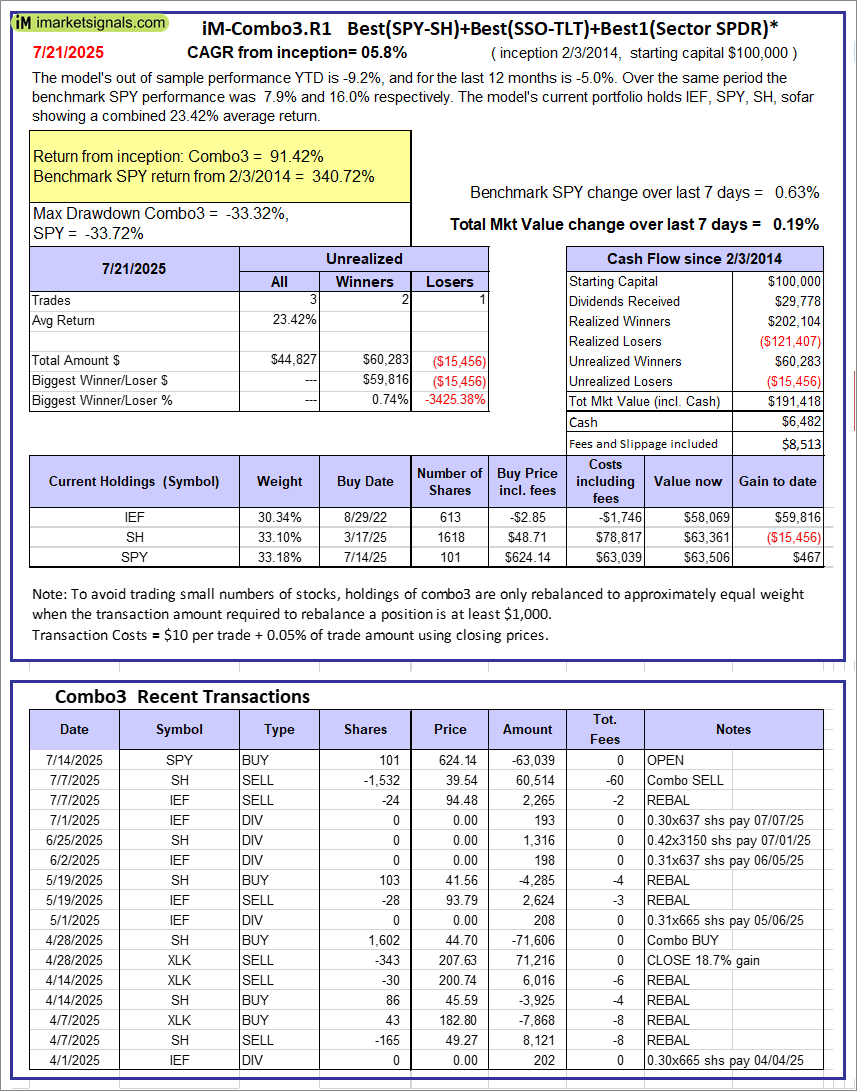 |
iM-Combo3.R1: The model’s out of sample performance YTD is -9.2%, and for the last 12 months is -5.0%. Over the same period the benchmark SPY performance was 7.9% and 16.0% respectively. Over the previous week the market value of iM-Combo3.R1 gained 0.19% at a time when SPY gained 0.63%. A starting capital of $100,000 at inception on 2/3/2014 would have grown to $191,418 which includes $6,482 cash and excludes $8,513 spent on fees and slippage. |
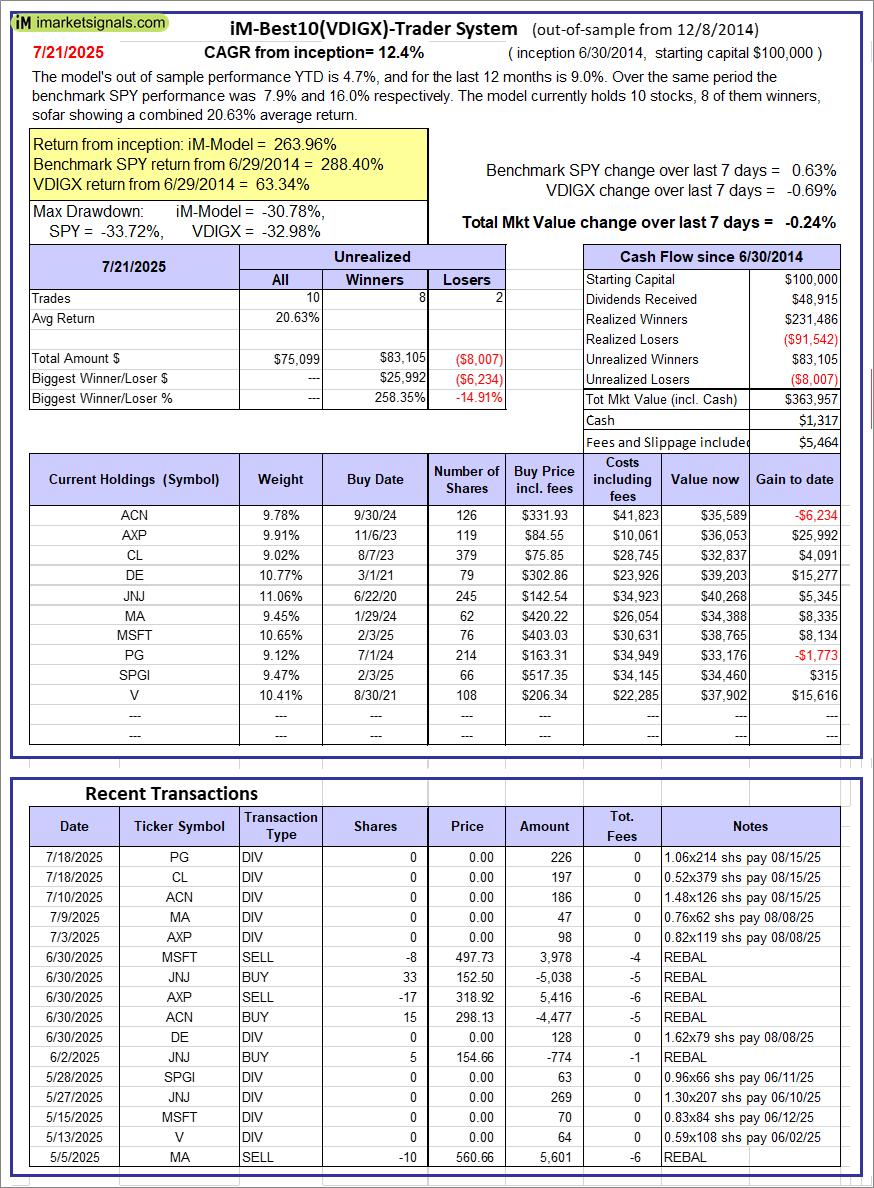 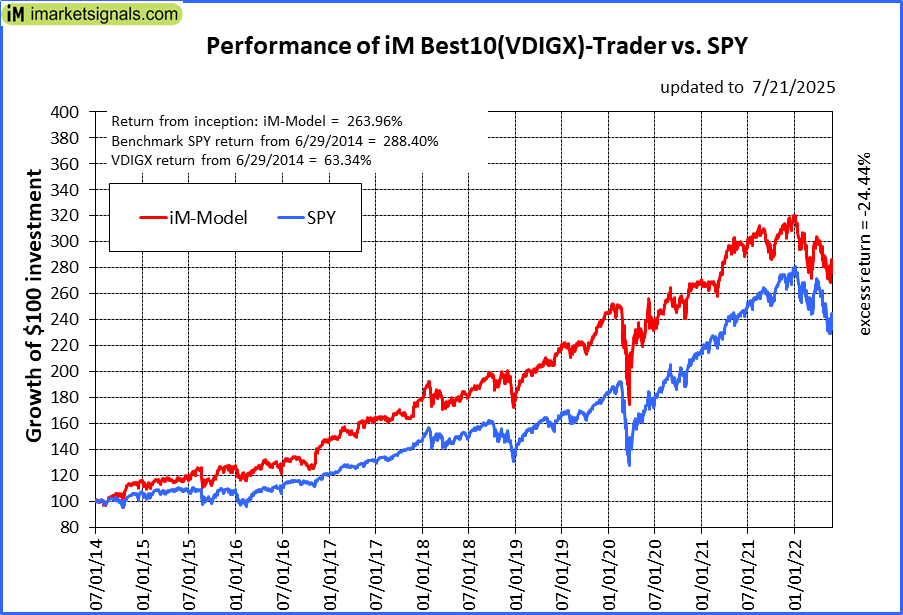 |
iM-Best10(VDIGX)-Trader: The model’s out of sample performance YTD is 4.7%, and for the last 12 months is 9.0%. Over the same period the benchmark SPY performance was 7.9% and 16.0% respectively. Since inception, on 7/1/2014, the model gained 263.96% while the benchmark SPY gained 288.40% and VDIGX gained 63.34% over the same period. Over the previous week the market value of iM-Best10(VDIGX) gained -0.24% at a time when SPY gained 0.63%. A starting capital of $100,000 at inception on 7/1/2014 would have grown to $363,957 which includes $1,317 cash and excludes $5,464 spent on fees and slippage. |
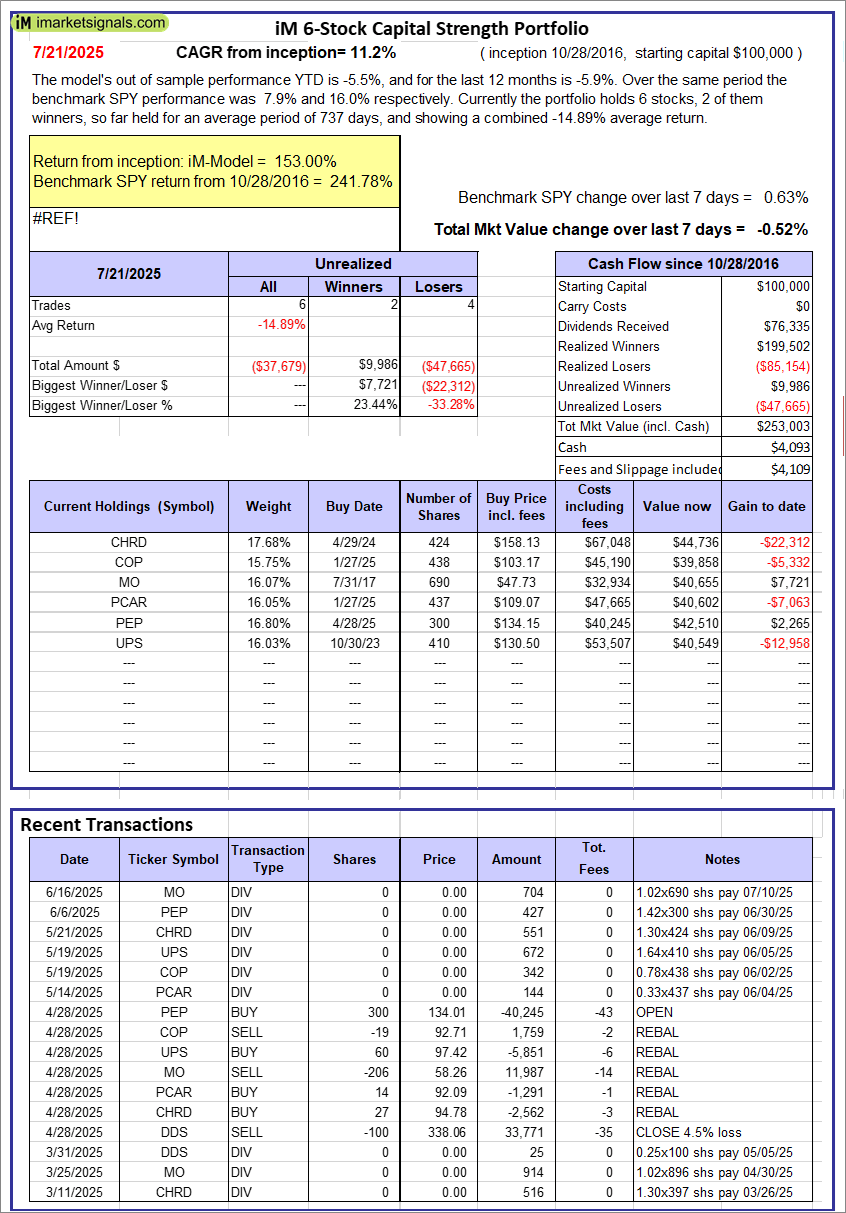 |
iM 6-Stock Capital Strength Portfolio: The model’s out of sample performance YTD is -5.5%, and for the last 12 months is -5.9%. Over the same period the benchmark SPY performance was 7.9% and 16.0% respectively. Over the previous week the market value of the iM 6-Stock Capital Strength Portfolio gained -0.52% at a time when SPY gained 0.63%. A starting capital of $100,000 at inception on 10/28/2016 would have grown to $253,003 which includes $4,093 cash and excludes $4,109 spent on fees and slippage. |
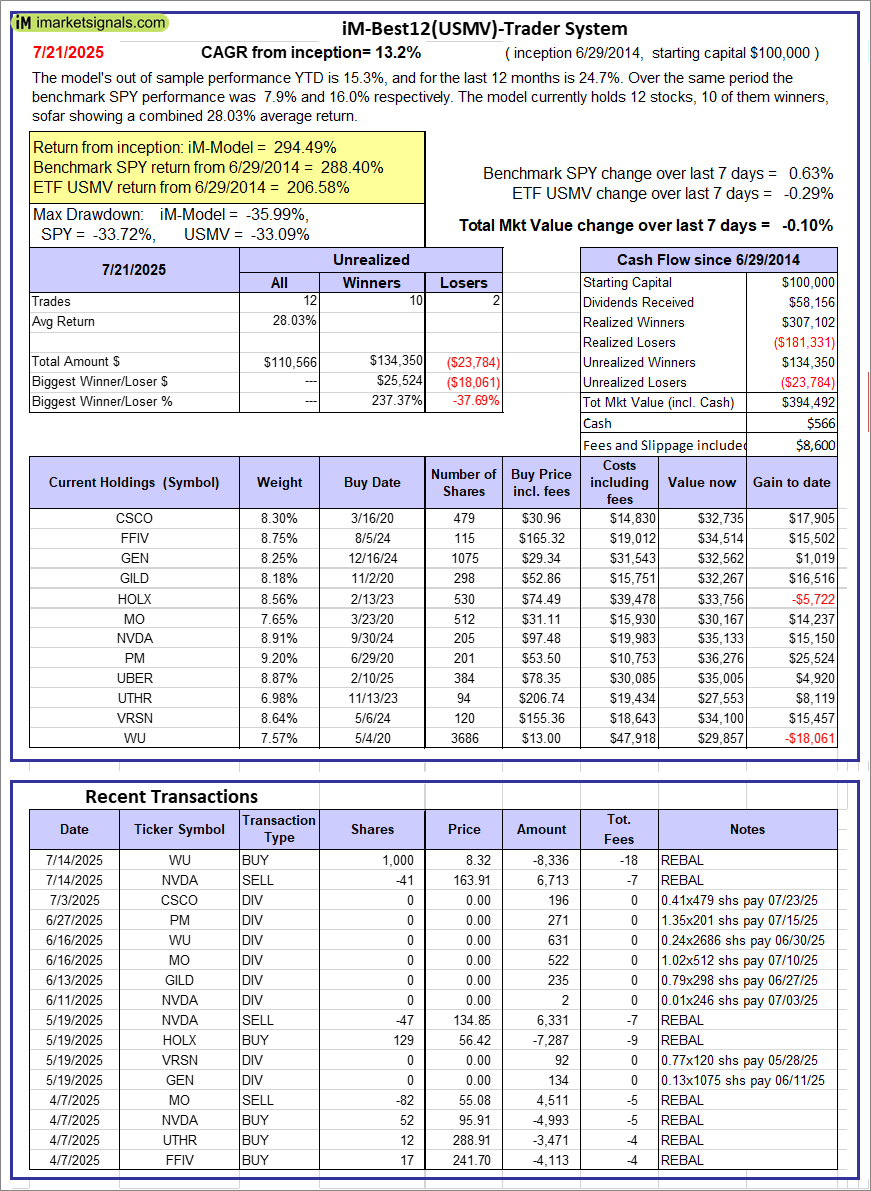 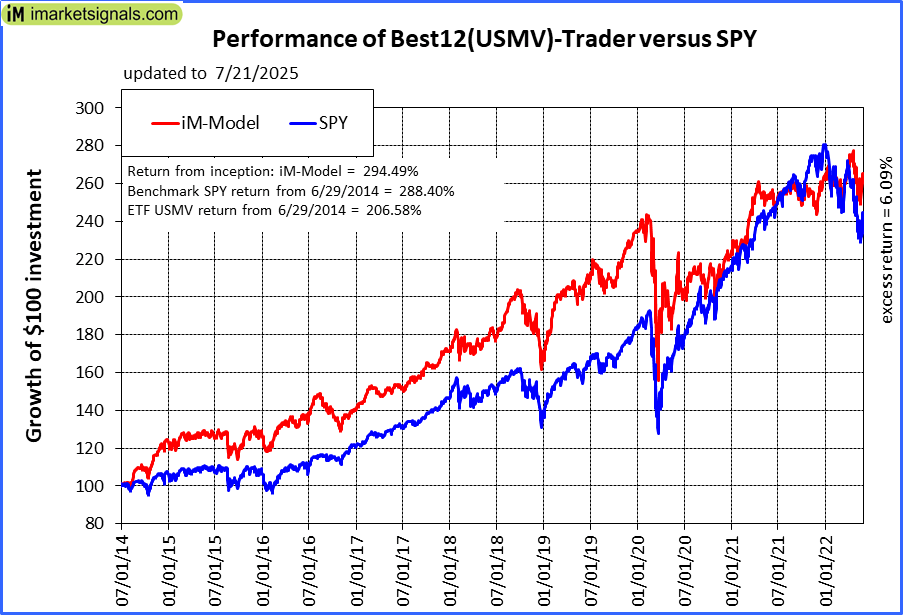 |
iM-Best12(USMV)-Trader: The model’s out of sample performance YTD is 15.3%, and for the last 12 months is 24.7%. Over the same period the benchmark SPY performance was 7.9% and 16.0% respectively. Since inception, on 6/30/2014, the model gained 294.49% while the benchmark SPY gained 288.40% and the ETF USMV gained 206.58% over the same period. Over the previous week the market value of iM-Best12(USMV)-Trader gained -0.10% at a time when SPY gained 0.63%. A starting capital of $100,000 at inception on 6/30/2014 would have grown to $394,492 which includes $566 cash and excludes $8,600 spent on fees and slippage. |
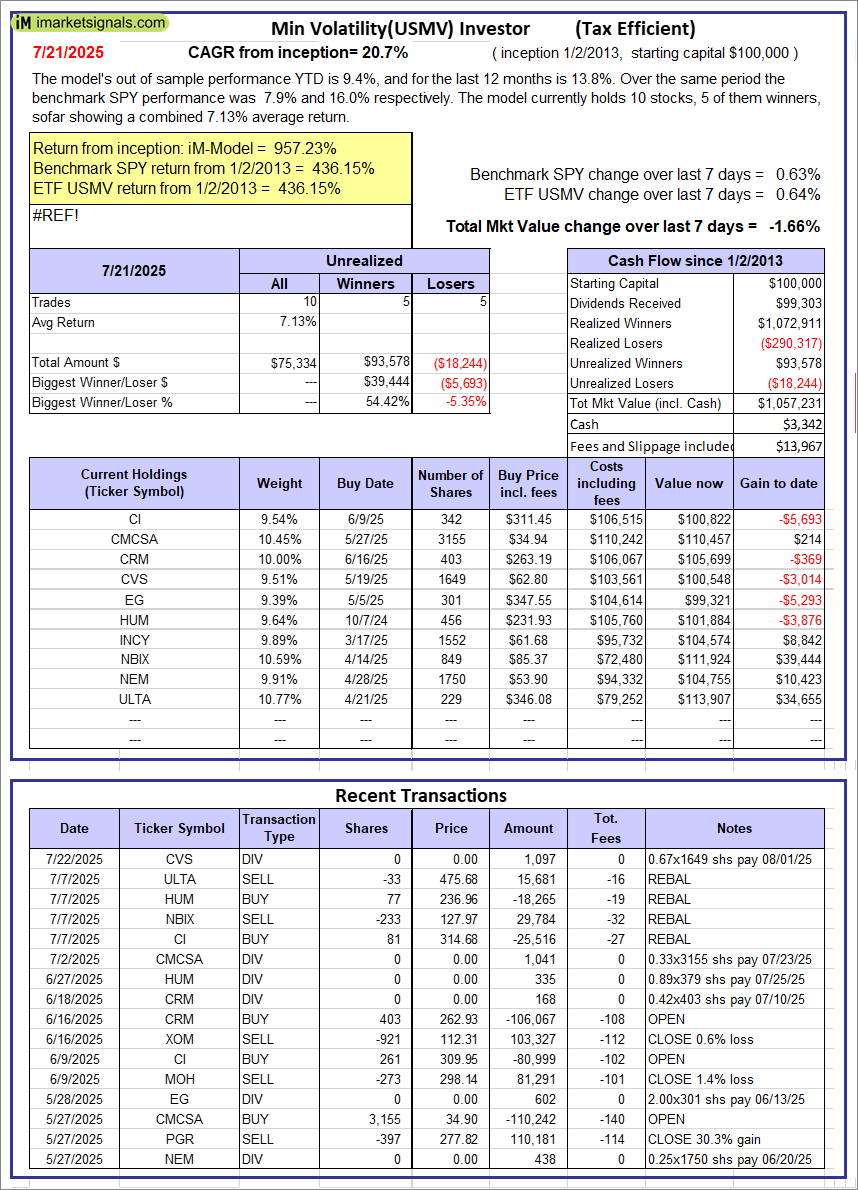 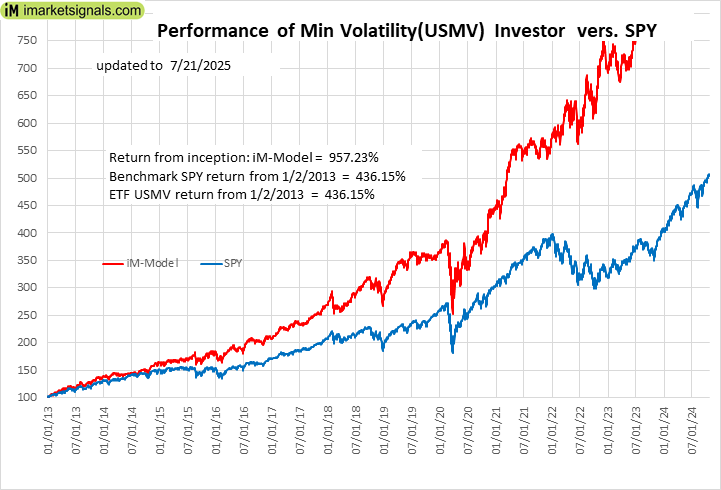 |
iM-Min Volatility(USMV) Investor (Tax Efficient): The model’s out of sample performance YTD is 9.4%, and for the last 12 months is 13.8%. Over the same period the benchmark SPY performance was 7.9% and 16.0% respectively. Since inception, on 1/3/2013, the model gained 957.23% while the benchmark SPY gained 436.15% and the ETF USMV gained 436.15% over the same period. Over the previous week the market value of iM-Best12(USMV)Q1 gained -1.66% at a time when SPY gained 0.63%. A starting capital of $100,000 at inception on 1/3/2013 would have grown to $1,057,231 which includes $3,342 cash and excludes $13,967 spent on fees and slippage. |
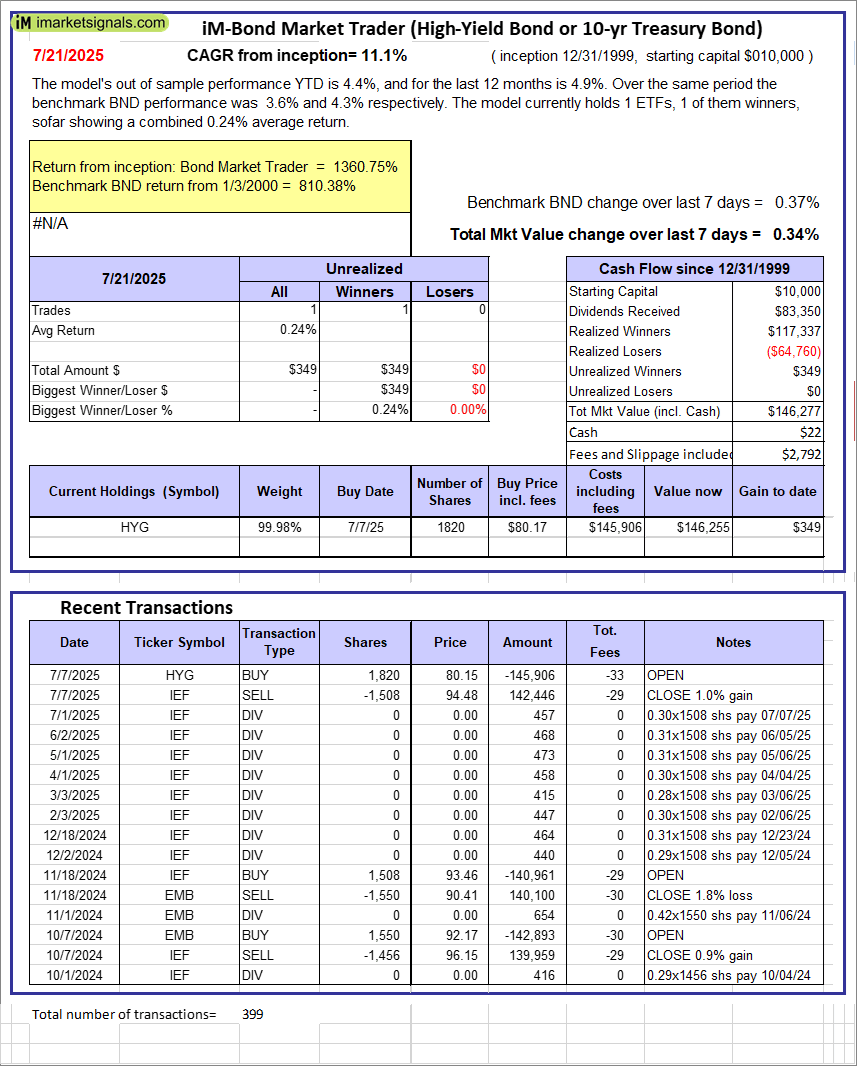 |
iM-Bond Market Trader (High-Yield Bond or 10-yr Treasury Bond): The model’s out of sample performance YTD is 4.4%, and for the last 12 months is 4.9%. Over the same period the benchmark BND performance was 3.6% and 4.3% respectively. Over the previous week the market value of the iM-Bond Market Trader (High-Yield Bond or 10-yr Treasury Bond) gained 0.34% at a time when BND gained 0.37%. A starting capital of $10,000 at inception on 1/3/2000 would have grown to $146,277 which includes $22 cash and excludes $2,792 spent on fees and slippage. |
|
|
iM-ModSum/YieldCurve Timer: The model’s out of sample performance YTD is 15.4%, and for the last 12 months is 23.9%. Over the same period the benchmark SPY performance was 7.9% and 16.0% respectively. Over the previous week the market value of iM-PortSum/YieldCurve Timer gained 0.63% at a time when SPY gained 0.63%. A starting capital of $100,000 at inception on 1/1/2016 would have grown to $370,175 which includes $1,716 cash and excludes $2,092 spent on fees and slippage. |
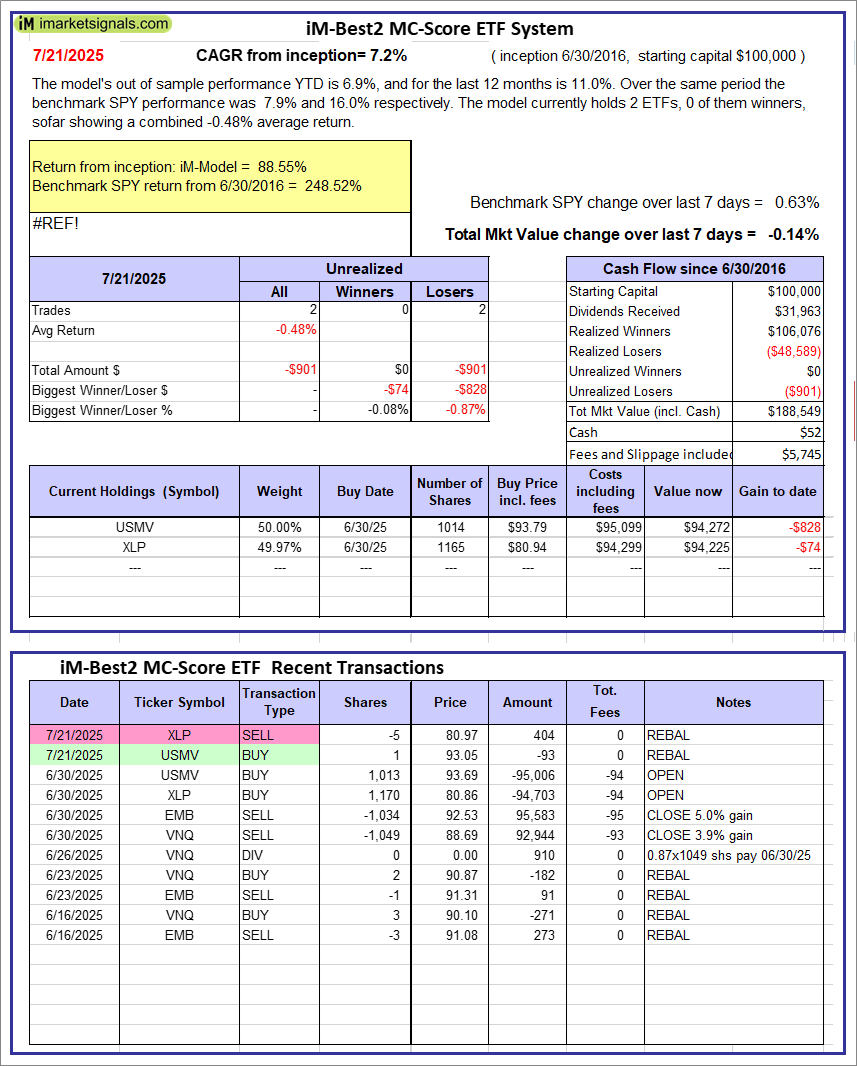 |
iM-Best2 MC-Score ETF System: The model’s out of sample performance YTD is 6.9%, and for the last 12 months is 11.0%. Over the same period the benchmark SPY performance was 7.9% and 16.0% respectively. Over the previous week the market value of the iM-Best2 MC-Score ETF System gained -0.14% at a time when SPY gained 0.63%. A starting capital of $100,000 at inception on 6/30/2016 would have grown to $188,549 which includes $52 cash and excludes $5,745 spent on fees and slippage. |
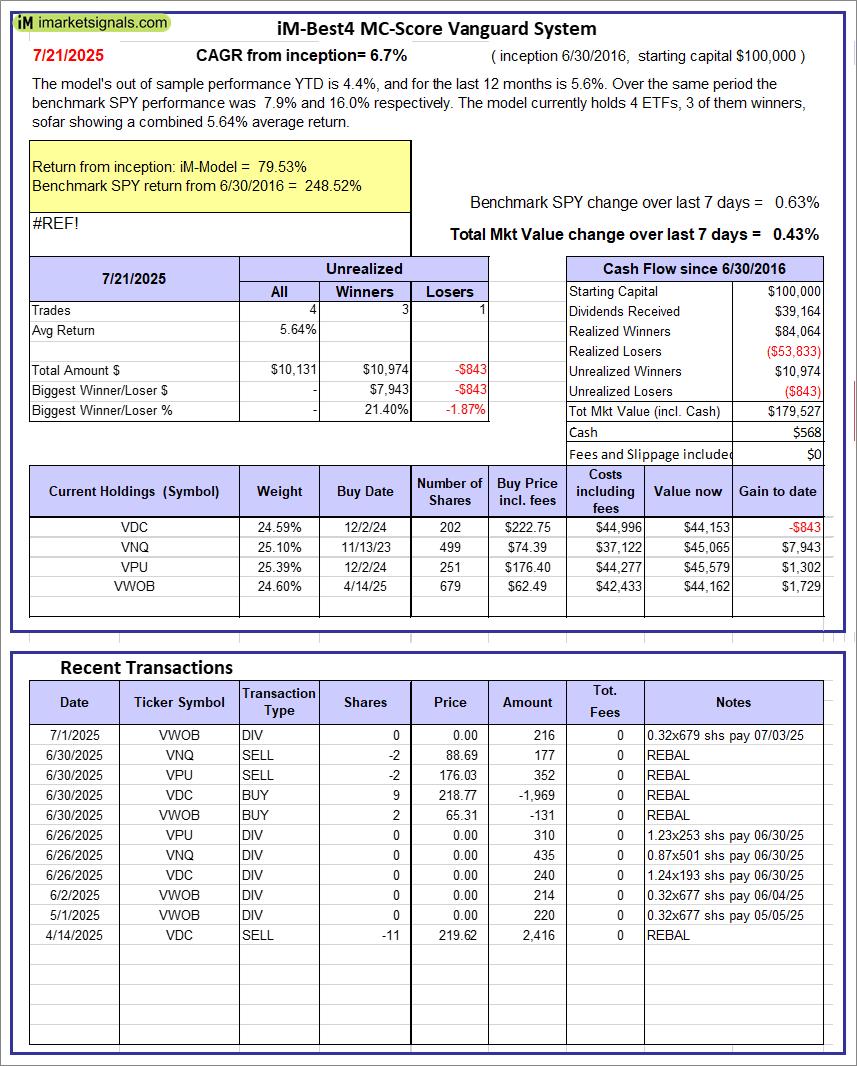 |
iM-Best4 MC-Score Vanguard System: The model’s out of sample performance YTD is 4.4%, and for the last 12 months is 5.6%. Over the same period the benchmark SPY performance was 7.9% and 16.0% respectively. Over the previous week the market value of the iM-Best4 MC-Score Vanguard System gained 0.43% at a time when SPY gained 0.63%. A starting capital of $100,000 at inception on 6/30/2016 would have grown to $179,527 which includes $568 cash and excludes $00 spent on fees and slippage. |
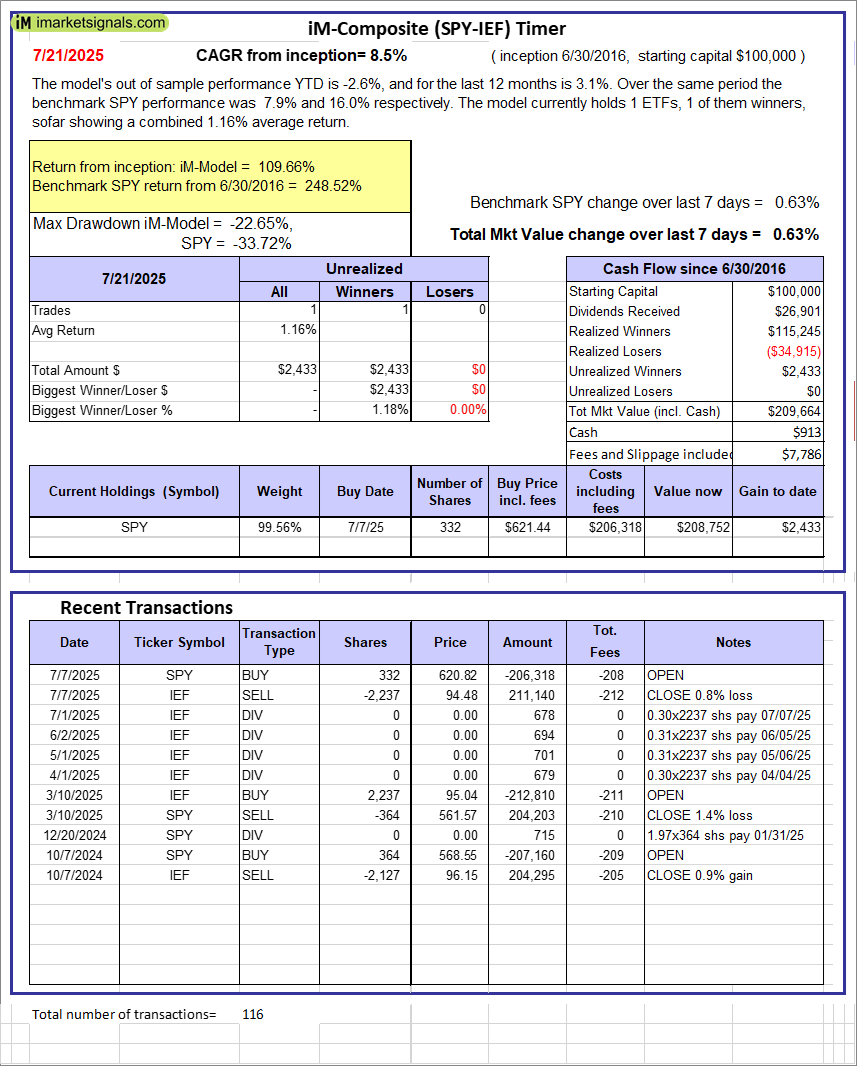 |
iM-Composite (SPY-IEF) Timer: The model’s out of sample performance YTD is -2.6%, and for the last 12 months is 3.1%. Over the same period the benchmark SPY performance was 7.9% and 16.0% respectively. Over the previous week the market value of the iM-Composite (SPY-IEF) Timer gained 0.63% at a time when SPY gained 0.63%. A starting capital of $100,000 at inception on 6/30/2016 would have grown to $209,664 which includes $913 cash and excludes $7,786 spent on fees and slippage. |
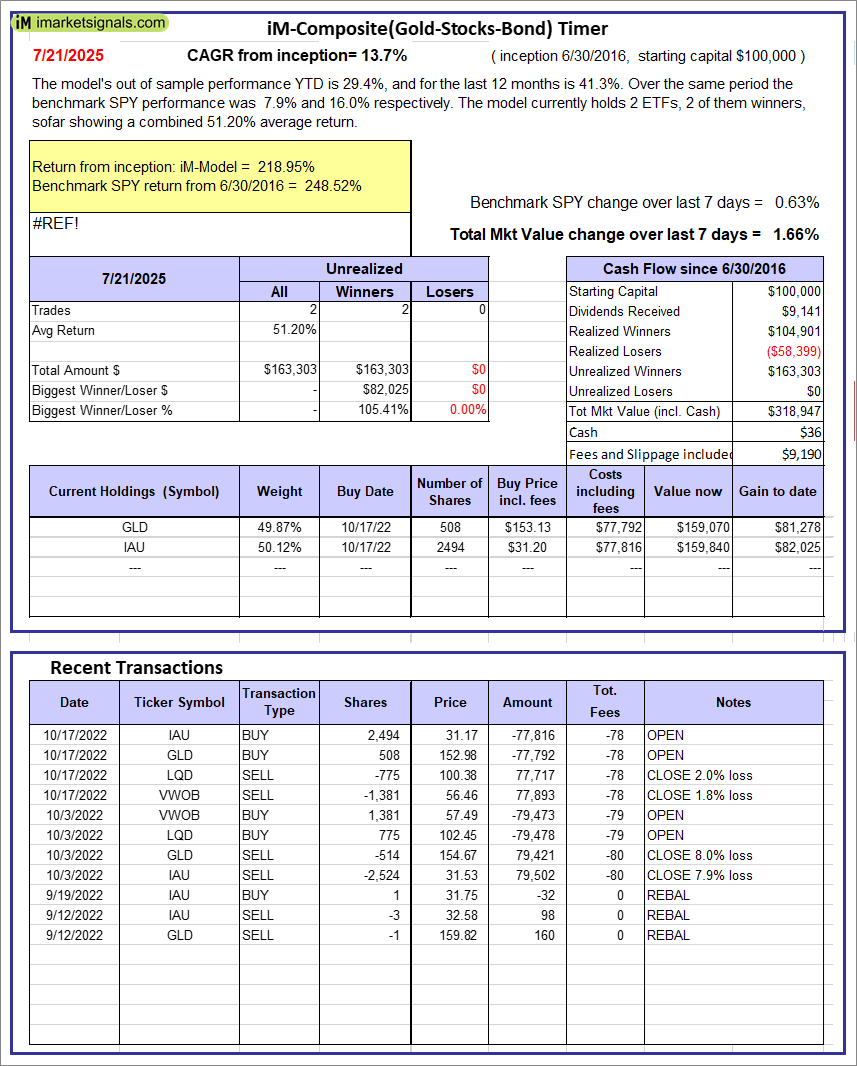 |
iM-Composite(Gold-Stocks-Bond) Timer: The model’s out of sample performance YTD is 29.4%, and for the last 12 months is 41.3%. Over the same period the benchmark SPY performance was 7.9% and 16.0% respectively. Over the previous week the market value of the iM-Composite(Gold-Stocks-Bond) Timer gained 1.66% at a time when SPY gained 0.63%. A starting capital of $100,000 at inception on 6/30/2016 would have grown to $318,947 which includes $36 cash and excludes $9,190 spent on fees and slippage. |
iM-Best Reports – 7/22/2025
Posted in pmp SPY-SH
Leave a Reply
You must be logged in to post a comment.