
  |
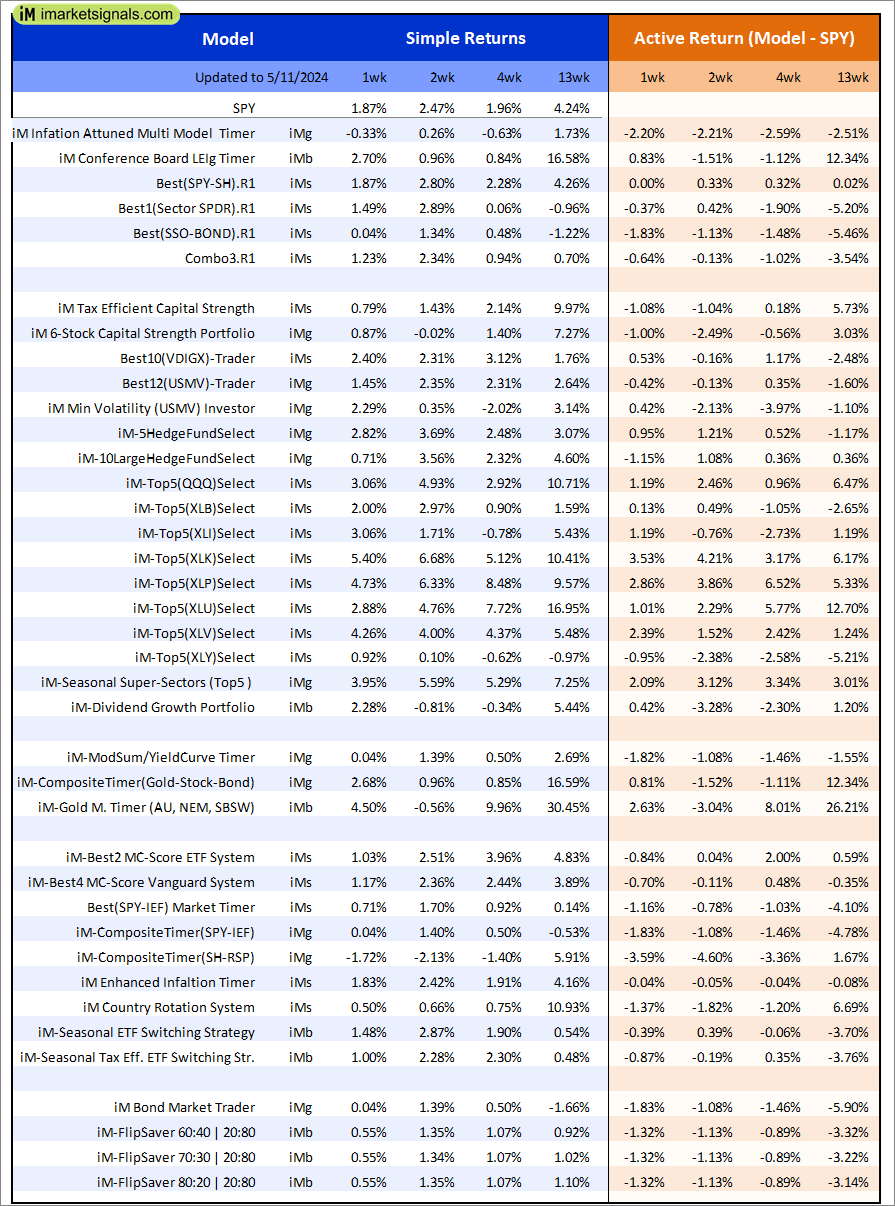
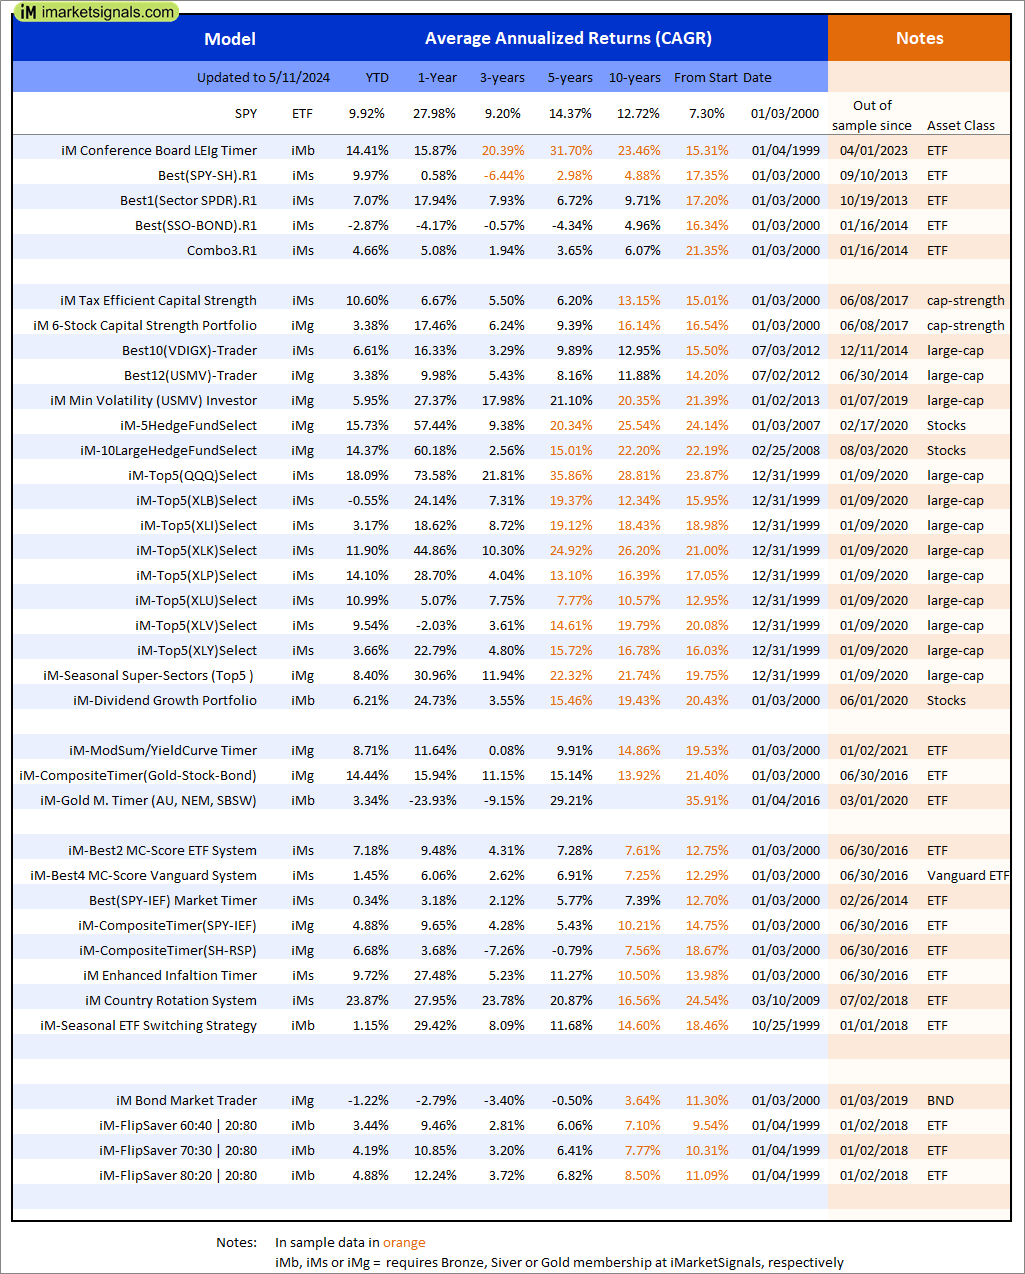
Out of sample performance summary of our models for the past 1, 2, 4 and 13 week periods. The active active return indicates how the models over- or underperformed the benchmark ETF SPY. Also the YTD, and the 1-, 3-, 5- and 10-year annualized returns are shown in the second table |
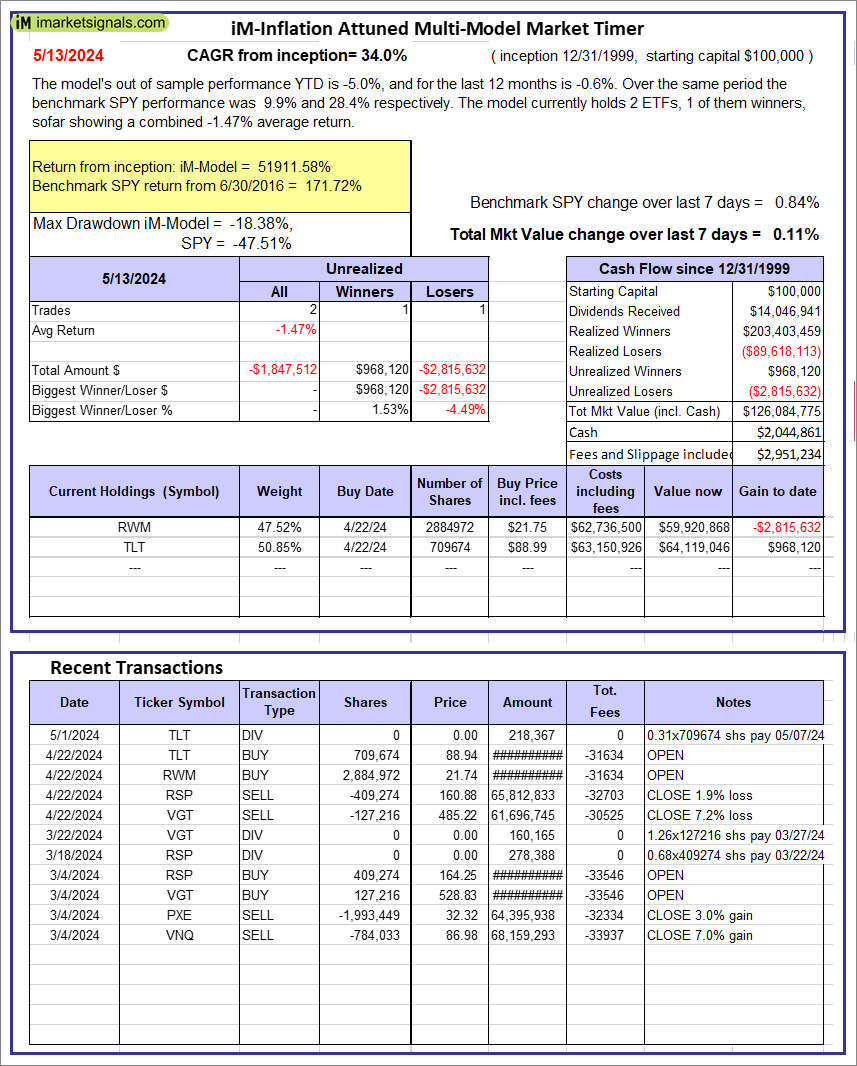 |
iM-Inflation Attuned Multi-Model Market Timer: The model’s out of sample performance YTD is -5.0%, and for the last 12 months is -0.6%. Over the same period the benchmark SPY performance was 9.9% and 28.4% respectively. Over the previous week the market value of the iM-Inflation Attuned Multi-Model Market Timer gained 0.11% at a time when SPY gained 0.84%. A starting capital of $100,000 at inception on 3/24/2017 would have grown to $126,084,775 which includes $2,044,861 cash and excludes $2,951,234 spent on fees and slippage. |
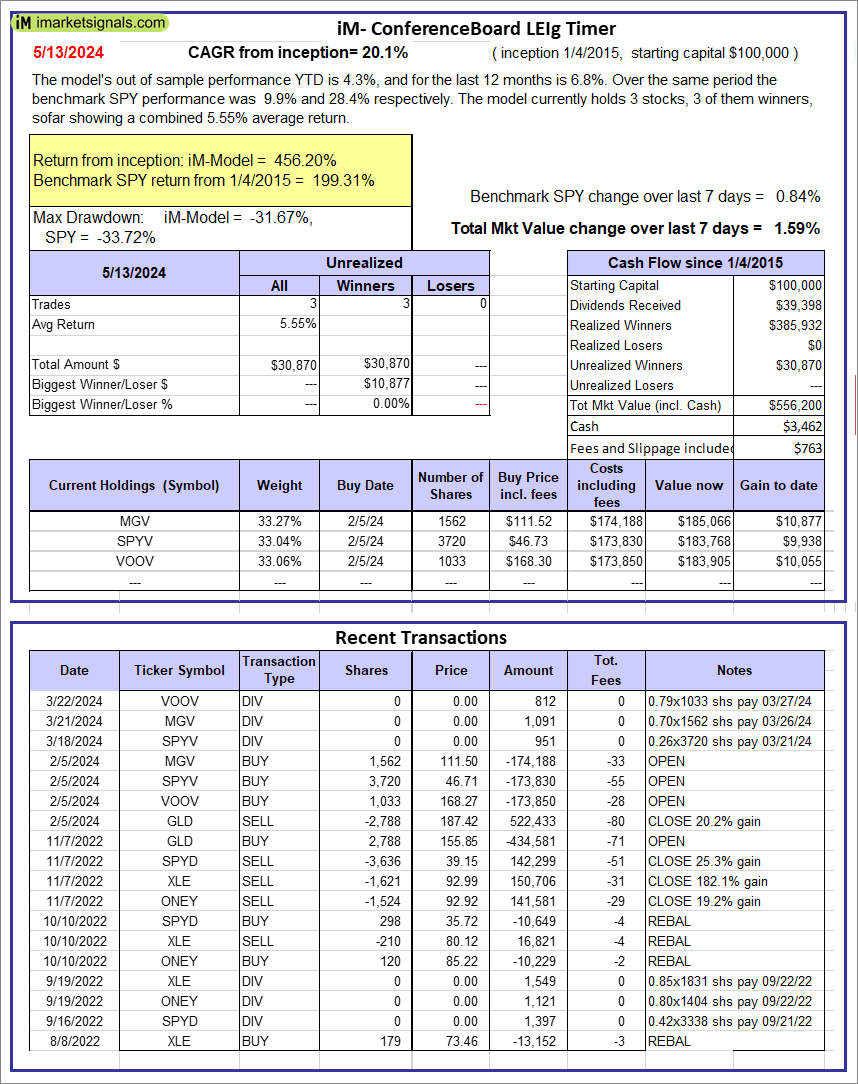 |
iM-Conference Board LEIg Timer: The model’s performance YTD is 14.3%, and for the last 12 months is 7.3%. Over the same period the benchmark SPY performance was 20.1% and 9.4% respectively. Over the previous week the market value of the iM-Conference Board LEIg Timer gained 1.59% at a time when SPY gained 0.84%. A starting capital of $100,000 at inception on 4/5/2017 would have grown to $556,200 which includes $3,462 cash and excludes $763 spent on fees and slippage. |
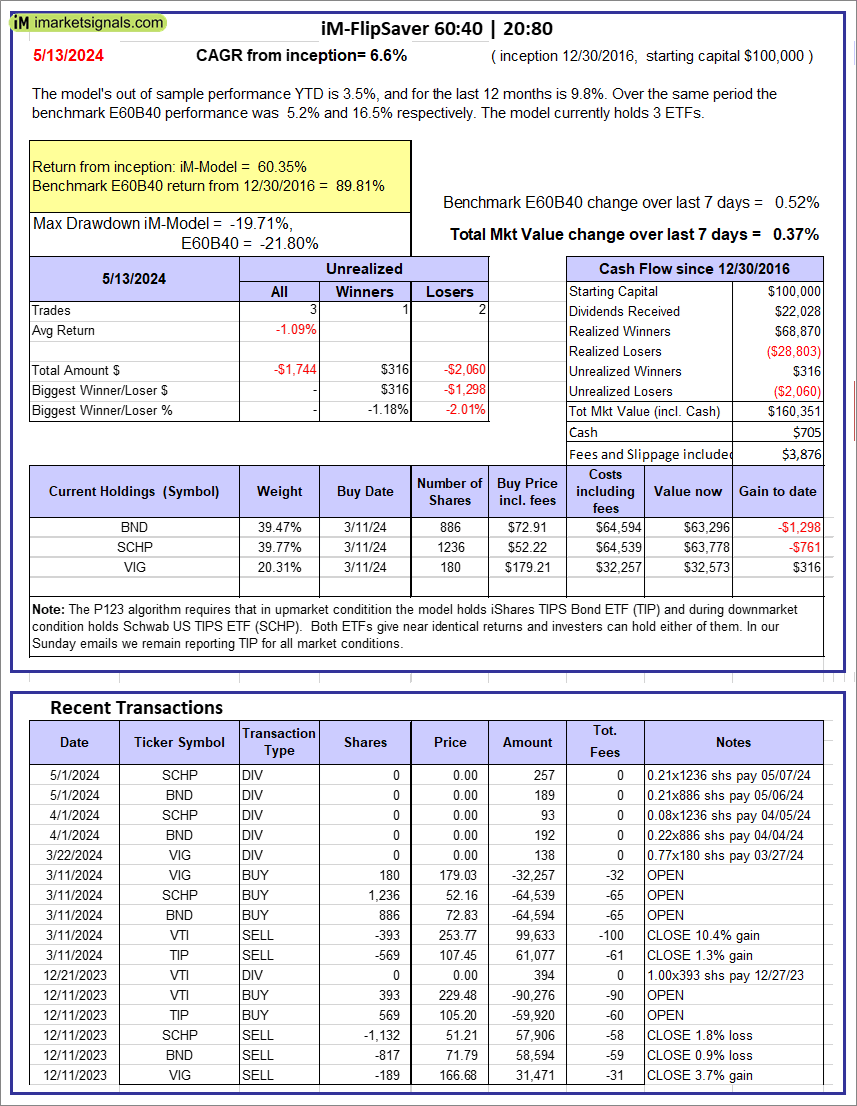 |
iM-FlipSaver 60:40 | 20:80 – 2017: The model’s out of sample performance YTD is 3.5%, and for the last 12 months is 9.8%. Over the same period the benchmark E60B40 performance was 5.2% and 16.5% respectively. Over the previous week the market value of iM-FlipSaver 80:20 | 20:80 gained 0.37% at a time when SPY gained 0.52%. A starting capital of $100,000 at inception on 7/16/2015 would have grown to $160,351 which includes $705 cash and excludes $3,876 spent on fees and slippage. |
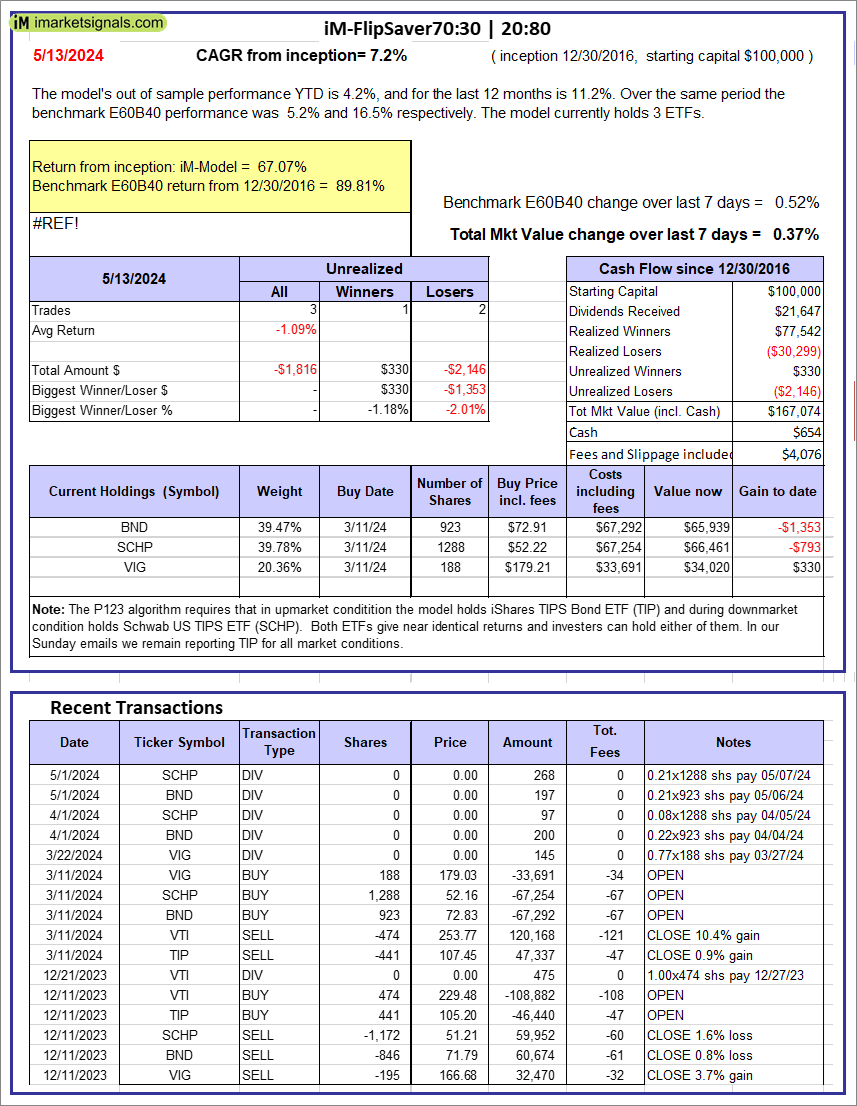 |
iM-FlipSaver 70:30 | 20:80 – 2017: The model’s out of sample performance YTD is 4.2%, and for the last 12 months is 11.2%. Over the same period the benchmark E60B40 performance was 5.2% and 16.5% respectively. Over the previous week the market value of iM-FlipSaver 70:30 | 20:80 gained 0.37% at a time when SPY gained 0.52%. A starting capital of $100,000 at inception on 7/15/2015 would have grown to $167,074 which includes $654 cash and excludes $4,076 spent on fees and slippage. |
 |
iM-FlipSaver 80:20 | 20:80 – 2017: The model’s out of sample performance YTD is 4.9%, and for the last 12 months is 12.6%. Over the same period the benchmark E60B40 performance was 5.2% and 16.5% respectively. Over the previous week the market value of iM-FlipSaver 80:20 | 20:80 gained 0.37% at a time when SPY gained 0.52%. A starting capital of $100,000 at inception on 1/2/2017 would have grown to $173,743 which includes $781 cash and excludes $4,268 spent on fees and slippage. |
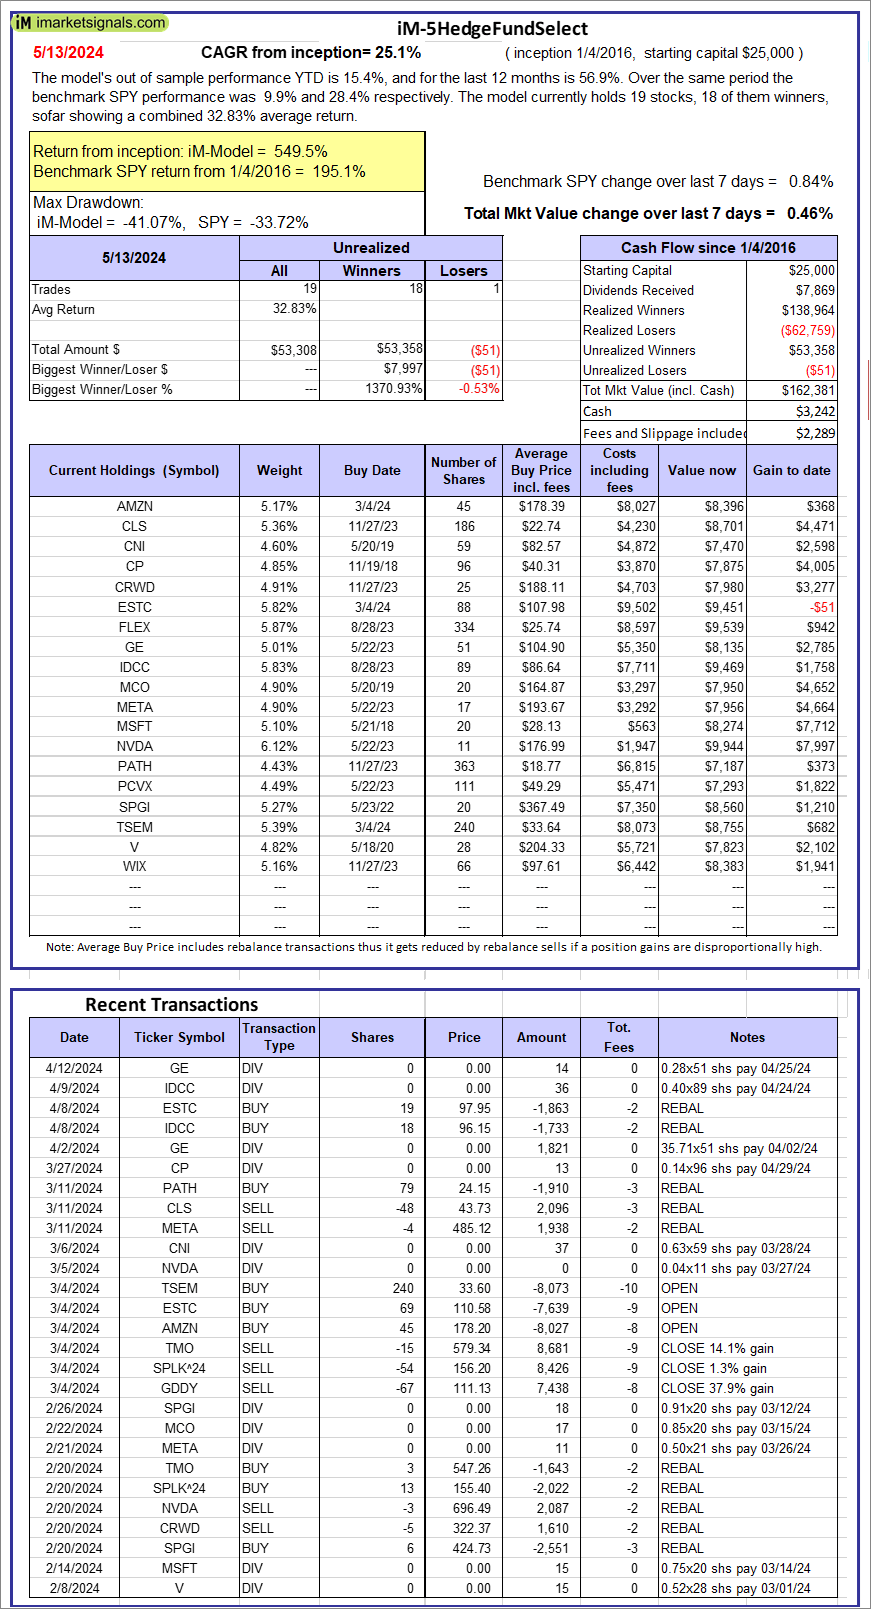 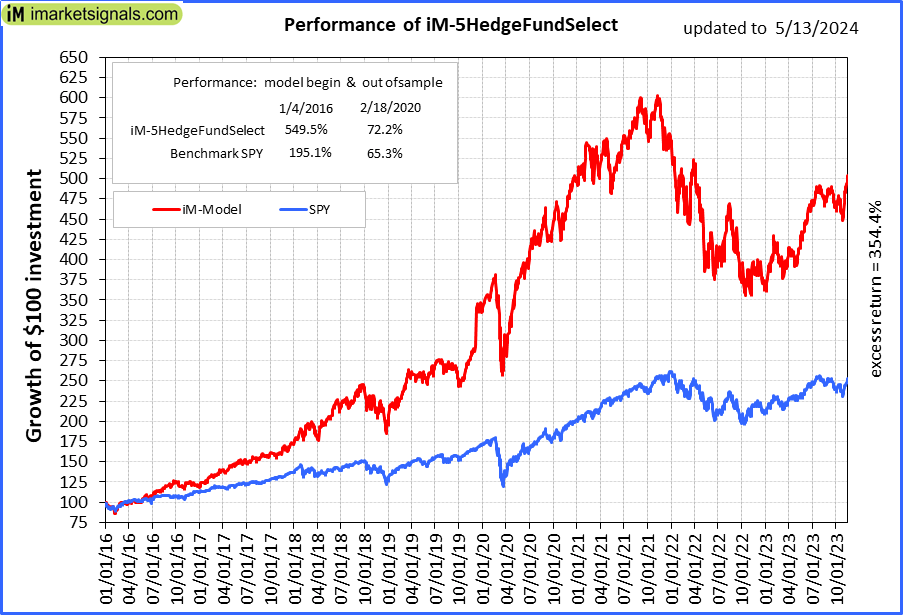 |
iM-5HedgeFundSelect: Since inception, on 1/5/2016, the model gained 549.53% while the benchmark SPY gained 195.12% over the same period. Over the previous week the market value of iM-5HedgeFundSelect gained 0.46% at a time when SPY gained 0.84%. A starting capital of $25,000 at inception on 1/5/2016 would have grown to $162,381 which includes $3,242 cash and excludes $2,289 spent on fees and slippage. |
 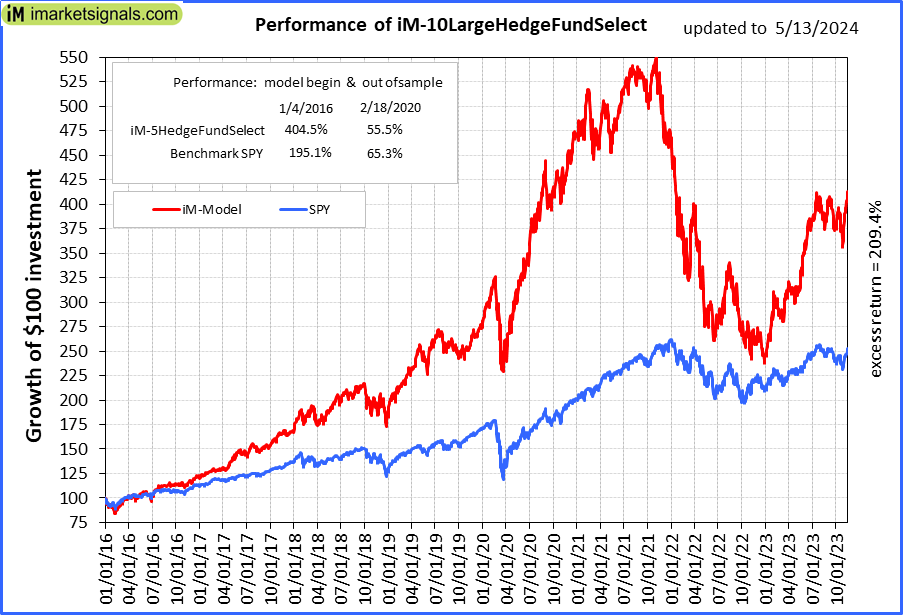 |
iM-10LargeHedgeFundSelect: Since inception, on 1/5/2016, the model gained 404.52% while the benchmark SPY gained 195.12% over the same period. Over the previous week the market value of iM-10LargeHedgeFundSelect gained -0.36% at a time when SPY gained 0.84%. A starting capital of $25,000 at inception on 1/5/2016 would have grown to $126,130 which includes $124 cash and excludes $1,464 spent on fees and slippage. |
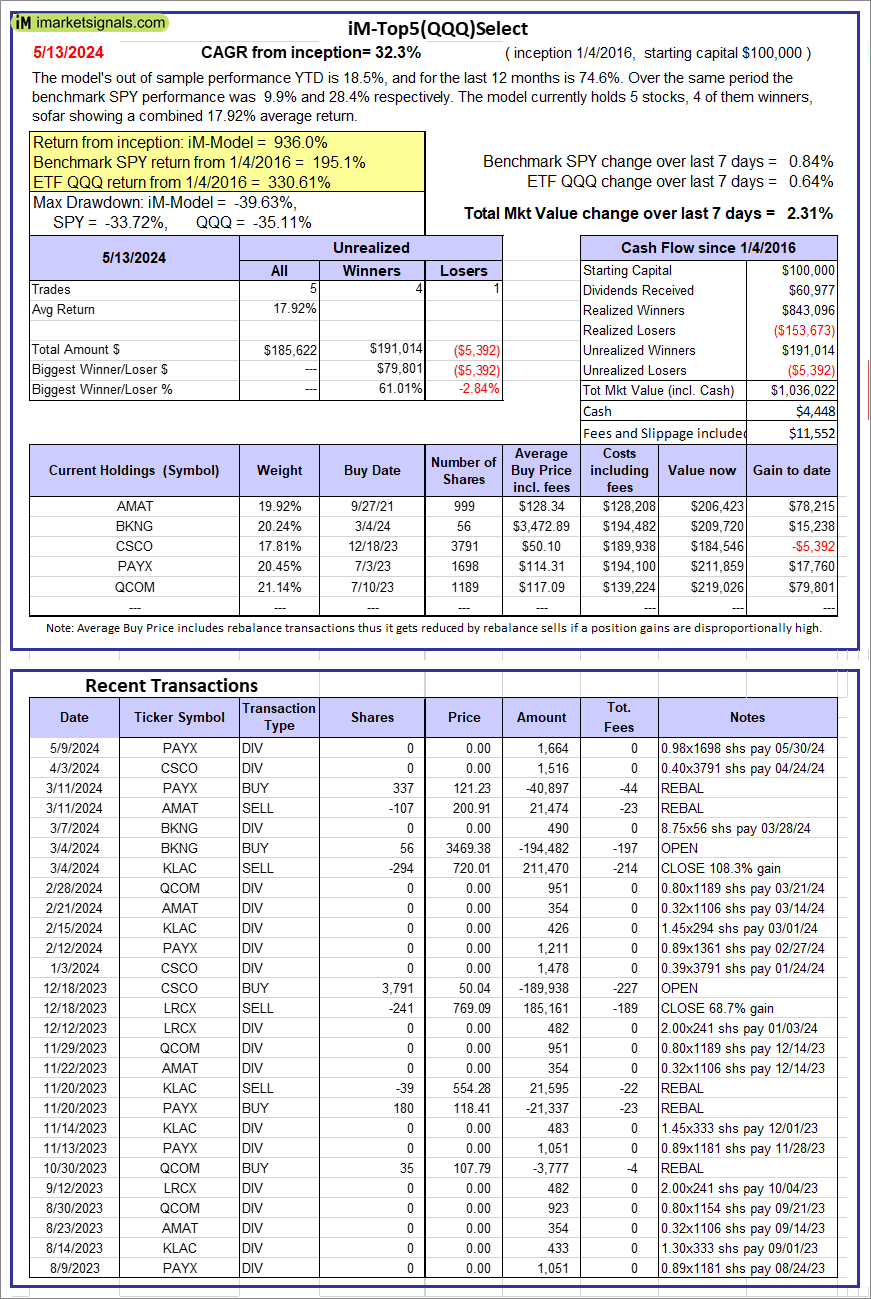 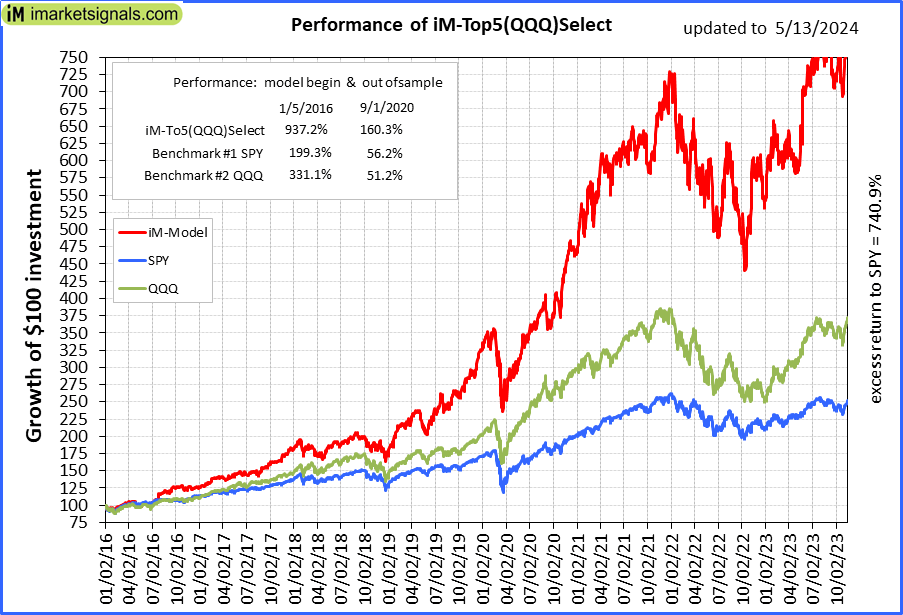 |
iM-Top5(QQQ)Select: Since inception, on 1/5/2016, the model gained 936.02% while the benchmark SPY gained 195.12% over the same period. Over the previous week the market value of iM-Top5(QQQ)Select gained 2.31% at a time when SPY gained 0.84%. A starting capital of $100,000 at inception on 1/5/2016 would have grown to $1,036,022 which includes $4,448 cash and excludes $11,552 spent on fees and slippage. |
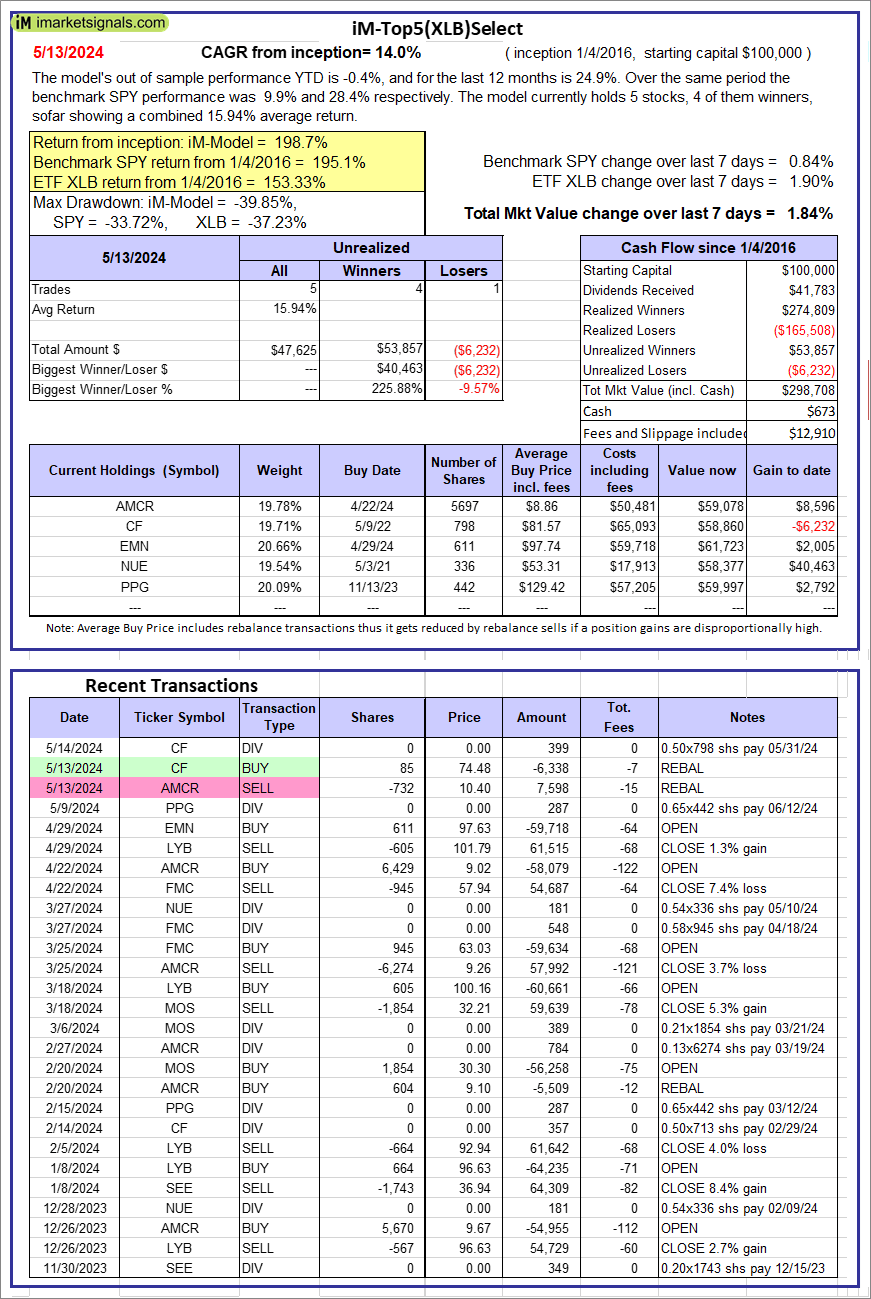 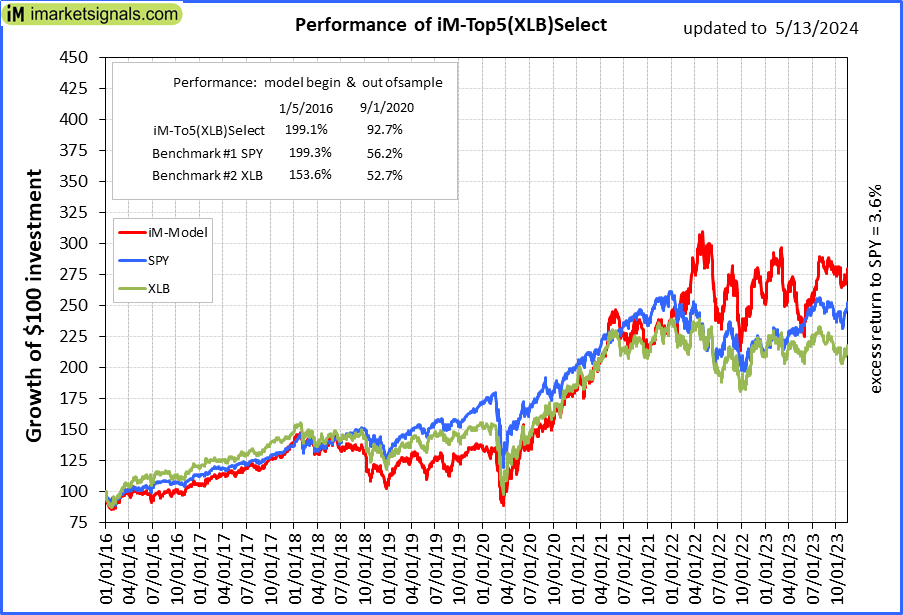 |
iM-Top5(XLB)Select: Since inception, on 1/5/2016, the model gained 198.71% while the benchmark SPY gained 195.12% over the same period. Over the previous week the market value of iM-Top5(XLB)Select gained 1.84% at a time when SPY gained 0.84%. A starting capital of $100,000 at inception on 1/5/2016 would have grown to $298,708 which includes $673 cash and excludes $12,910 spent on fees and slippage. |
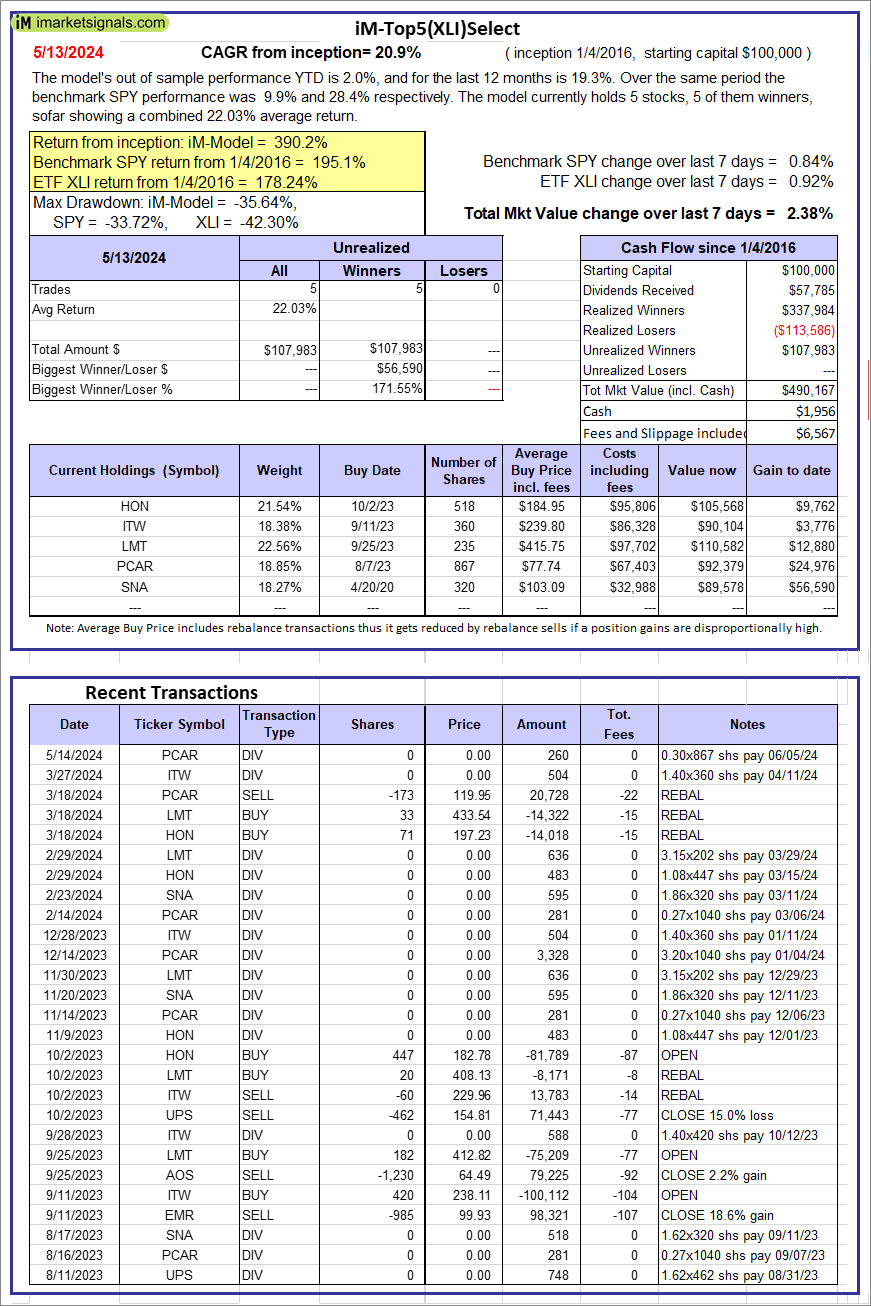 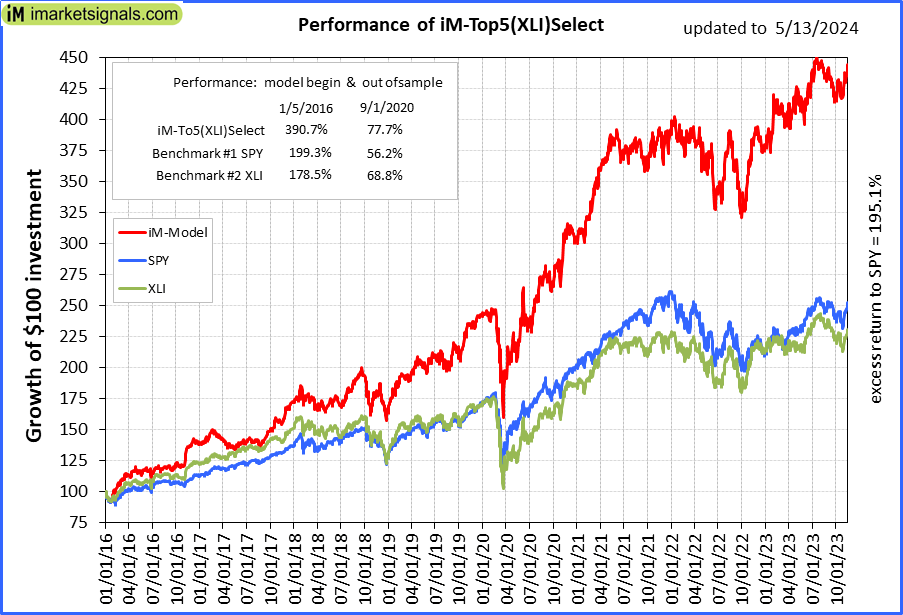 |
iM-Top5(XLI)Select: Since inception, on 1/5/2016, the model gained 390.17% while the benchmark SPY gained 195.12% over the same period. Over the previous week the market value of iM-Top5(XLI)Select gained 2.38% at a time when SPY gained 0.84%. A starting capital of $100,000 at inception on 1/5/2016 would have grown to $490,167 which includes $1,956 cash and excludes $6,567 spent on fees and slippage. |
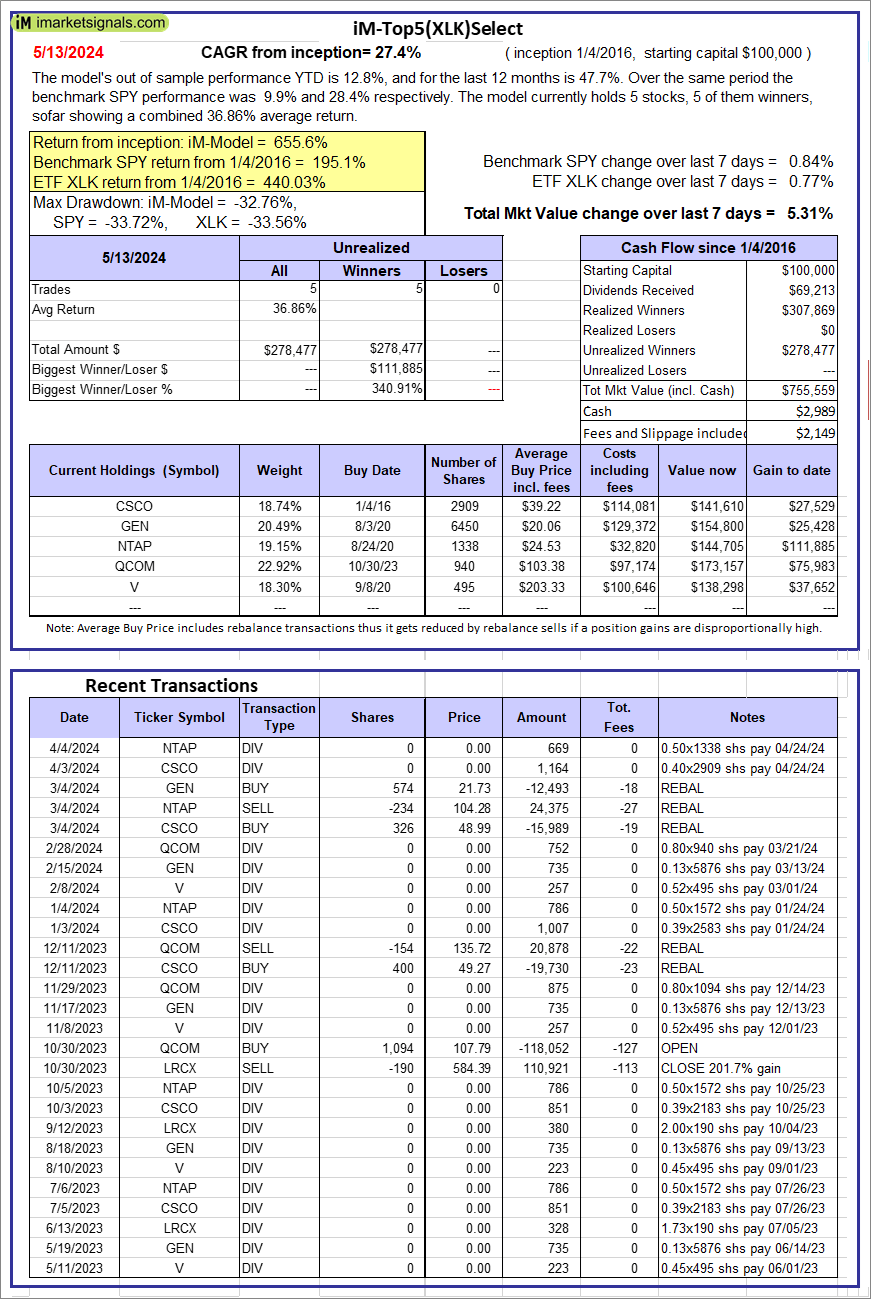 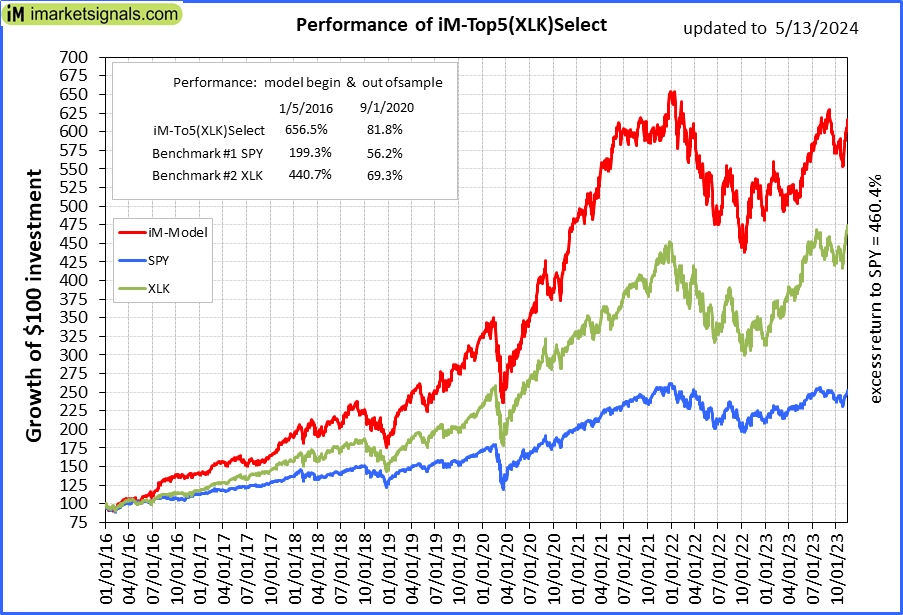 |
iM-Top5(XLK)Select: Since inception, on 1/5/2016, the model gained 655.56% while the benchmark SPY gained 195.12% over the same period. Over the previous week the market value of iM-Top5(XLK)Select gained 5.31% at a time when SPY gained 0.84%. A starting capital of $100,000 at inception on 1/5/2016 would have grown to $755,559 which includes $2,989 cash and excludes $2,149 spent on fees and slippage. |
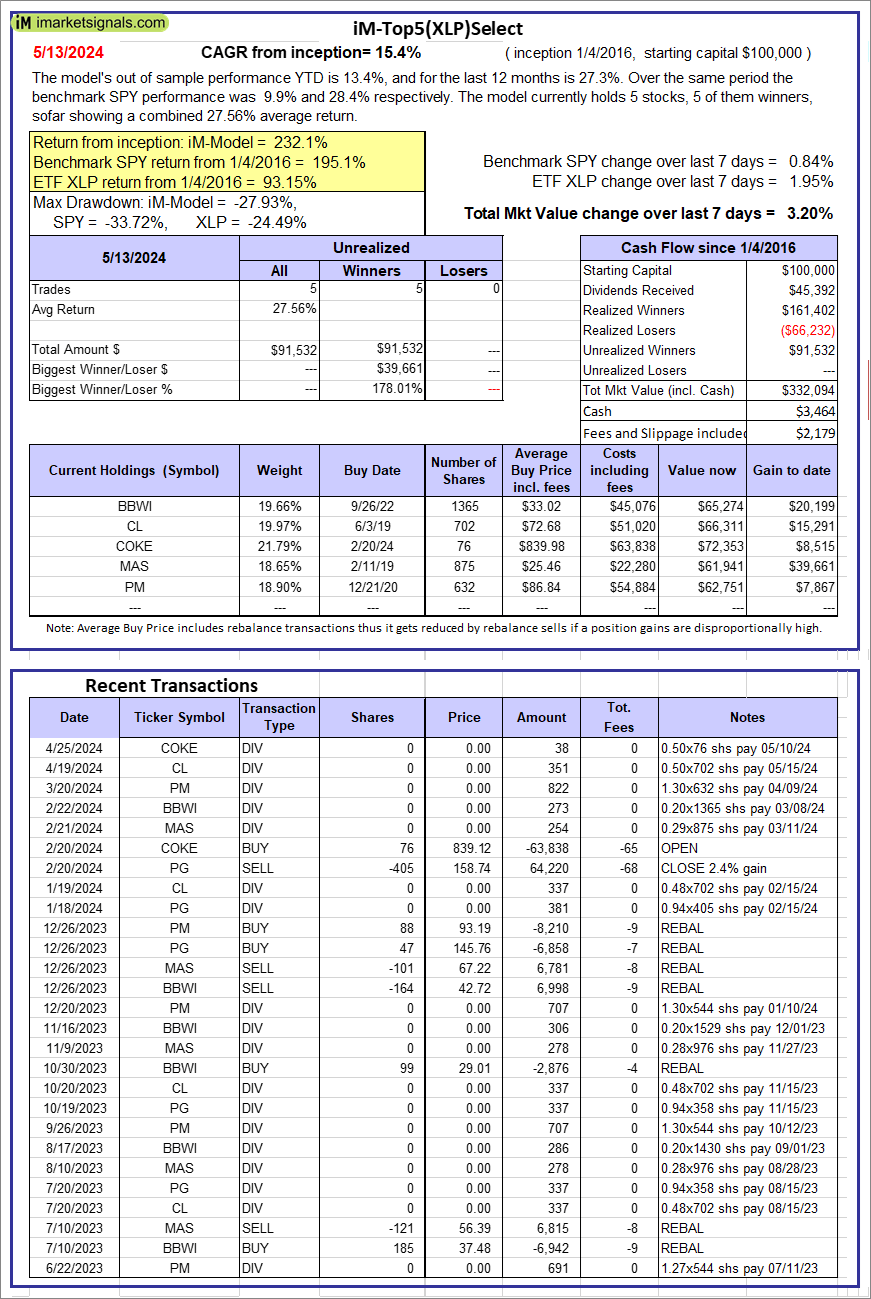 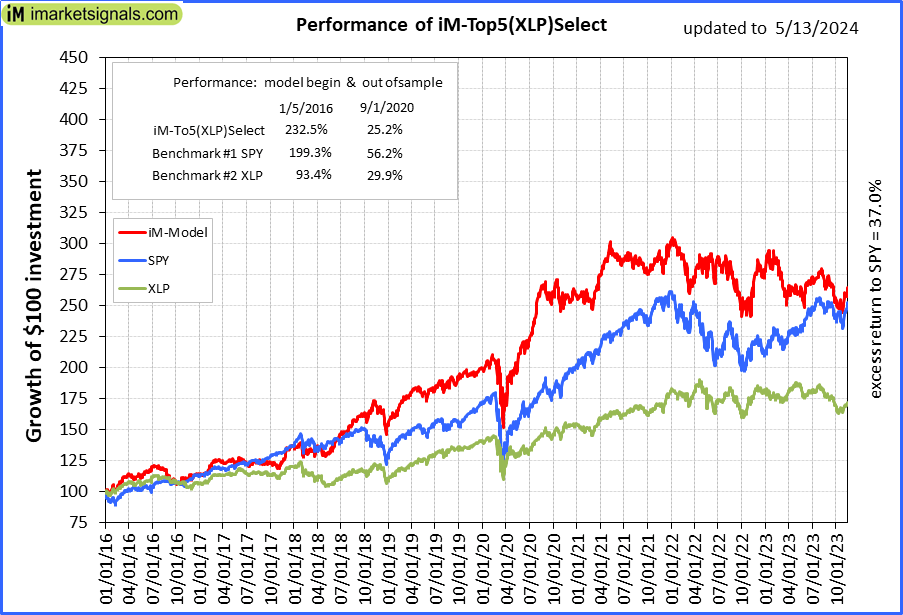 |
iM-Top5(XLP)Select: Since inception, on 1/5/2016, the model gained 232.09% while the benchmark SPY gained 195.12% over the same period. Over the previous week the market value of iM-Top5(XLP)Select gained 3.20% at a time when SPY gained 0.84%. A starting capital of $100,000 at inception on 1/5/2016 would have grown to $332,094 which includes $3,464 cash and excludes $2,179 spent on fees and slippage. |
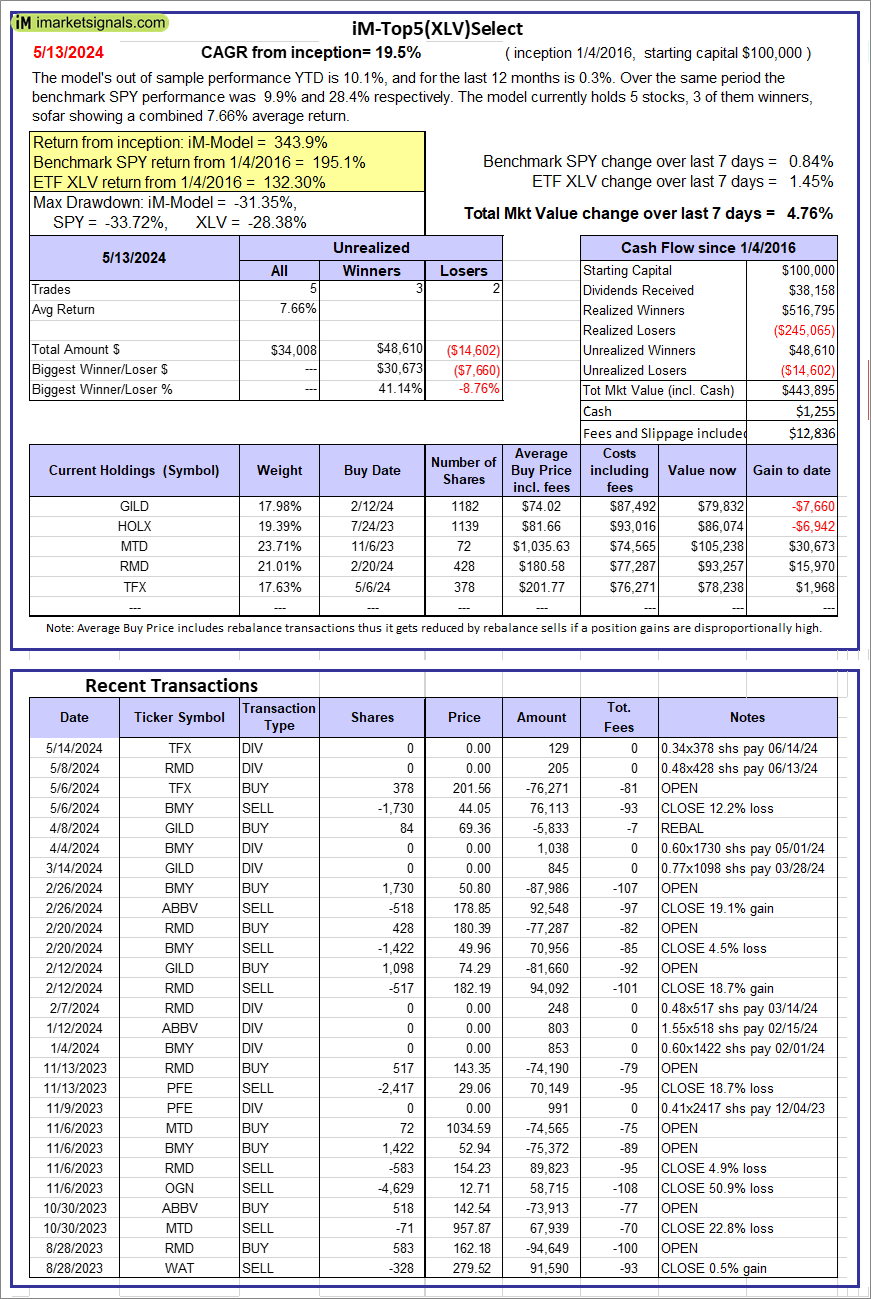 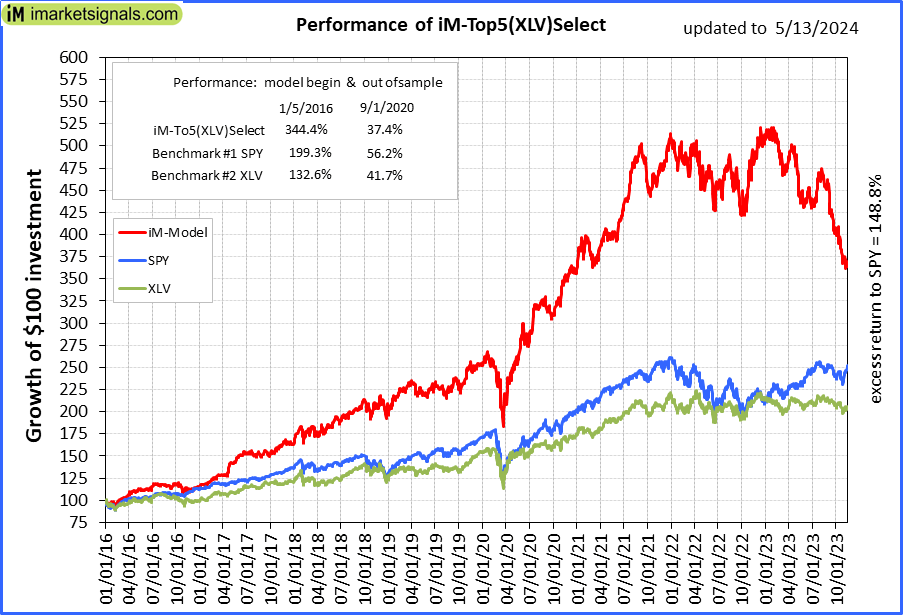 |
iM-Top5(XLV)Select: Since inception, on 1/5/2016, the model gained 343.90% while the benchmark SPY gained 195.12% over the same period. Over the previous week the market value of iM-Top5(XLV)Select gained 4.76% at a time when SPY gained 0.84%. A starting capital of $100,000 at inception on 1/5/2016 would have grown to $443,895 which includes $1,255 cash and excludes $12,836 spent on fees and slippage. |
 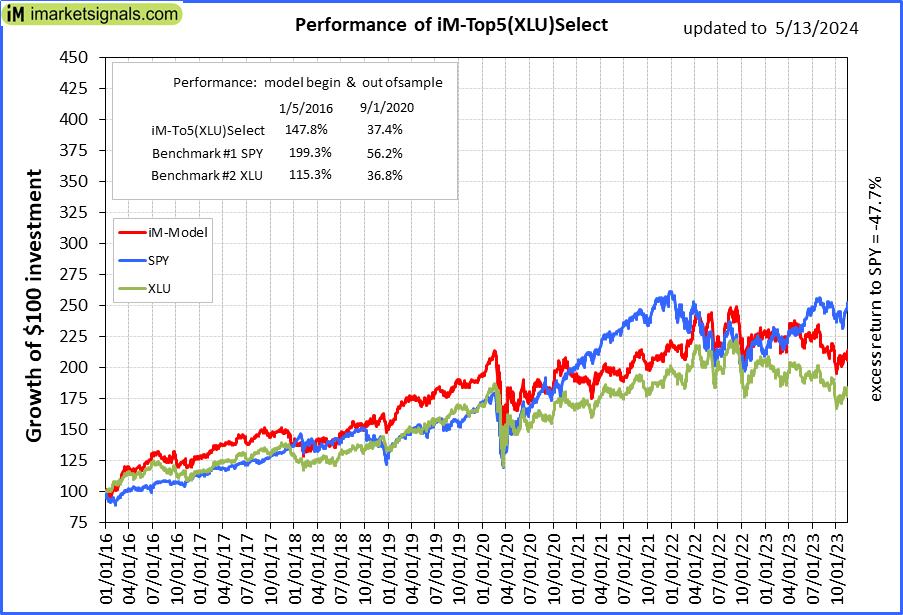 |
iM-Top5(XLU)Select: Since inception, on 1/5/2016, the model gained 147.47% while the benchmark SPY gained 195.12% over the same period. Over the previous week the market value of iM-Top5(XLU)Select gained 2.44% at a time when SPY gained 0.84%. A starting capital of $100,000 at inception on 1/5/2016 would have grown to $247,475 which includes $496 cash and excludes $13,671 spent on fees and slippage. |
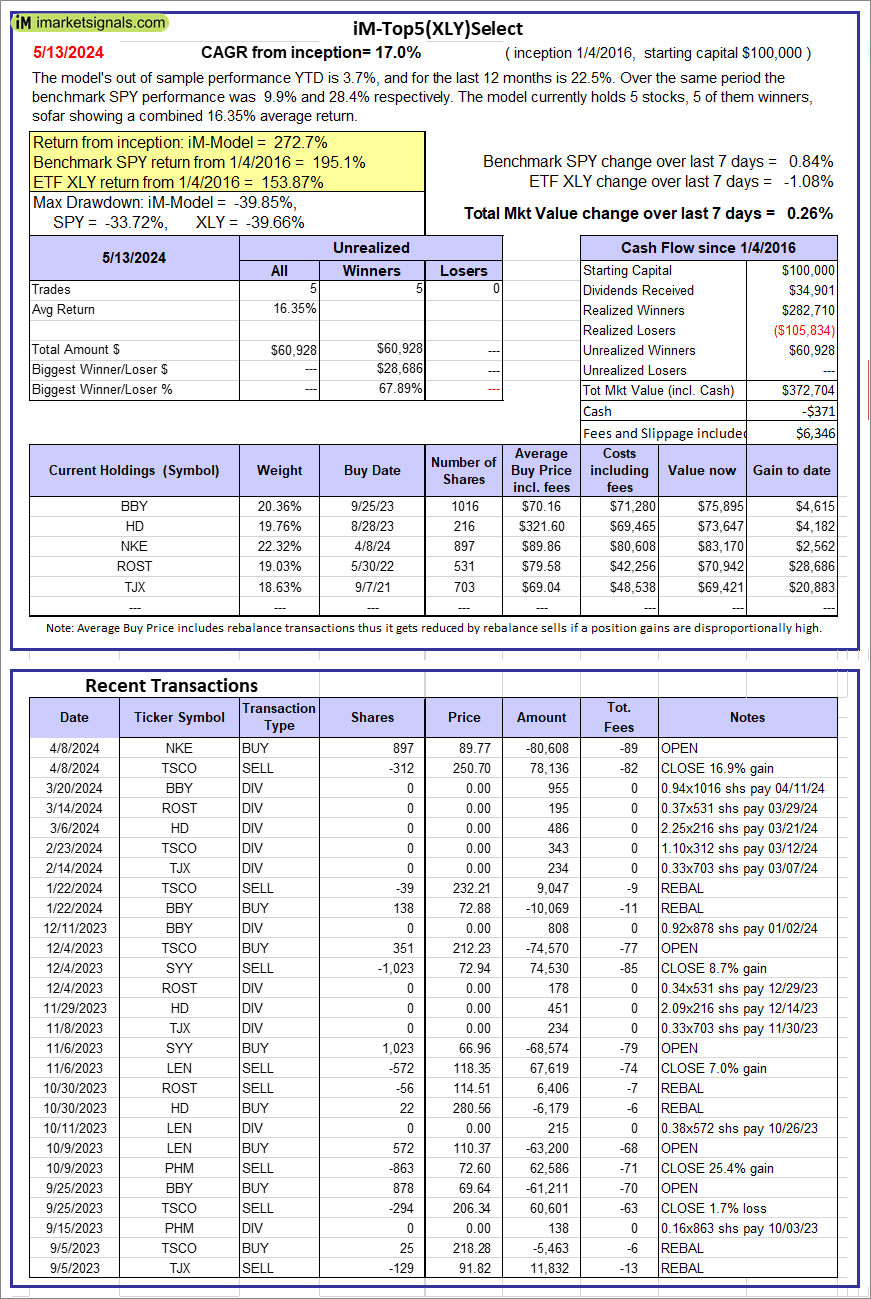 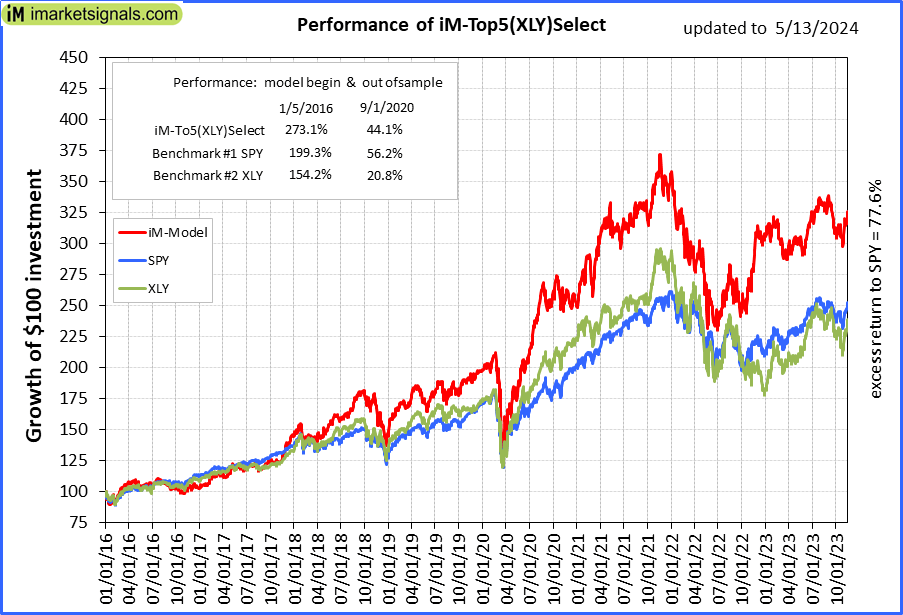 |
iM-Top5(XLY)Select: Since inception, on 1/5/2016, the model gained 272.70% while the benchmark SPY gained 195.12% over the same period. Over the previous week the market value of iM-Top5(XLY)Select gained 0.26% at a time when SPY gained 0.84%. A starting capital of $100,000 at inception on 1/5/2016 would have grown to $372,704 which includes -$371 cash and excludes $6,346 spent on fees and slippage. |
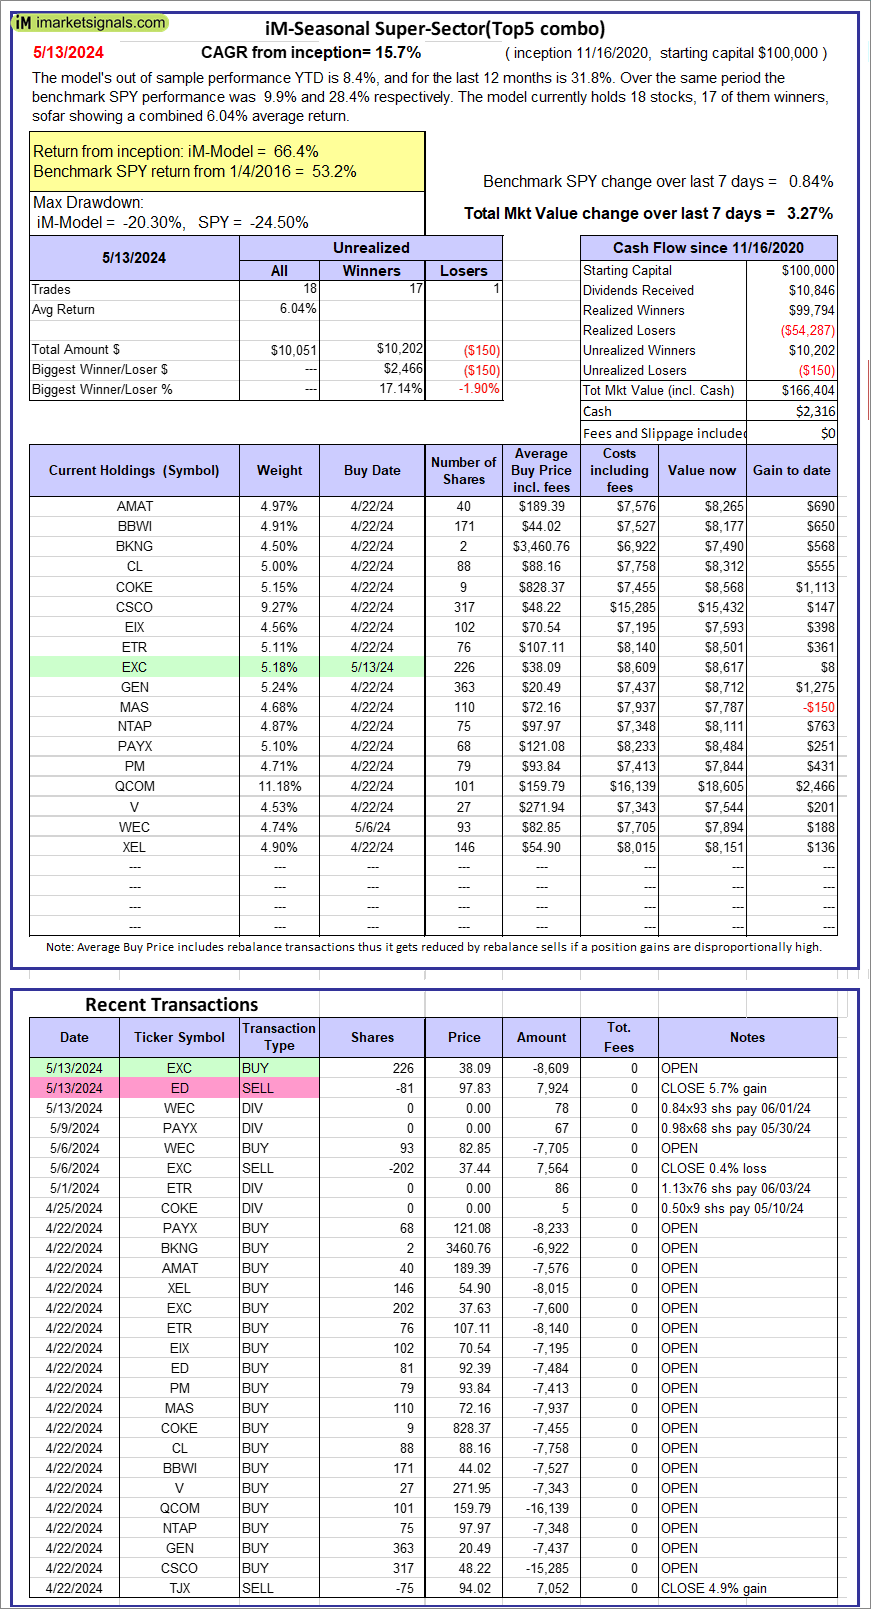 |
iM-Seasonal Super-Sectors (Top5 combo) : Since inception, on 11/17/2020, the model gained 66.40% while the benchmark SPY gained 53.20% over the same period. Over the previous week the market value of iM-Seasonal Super-Sectors (Top5 combo) gained 3.27% at a time when SPY gained 0.84%. A starting capital of $100,000 at inception on 11/17/2020 would have grown to $166,404 which includes $2,316 cash and excludes $00 spent on fees and slippage. |
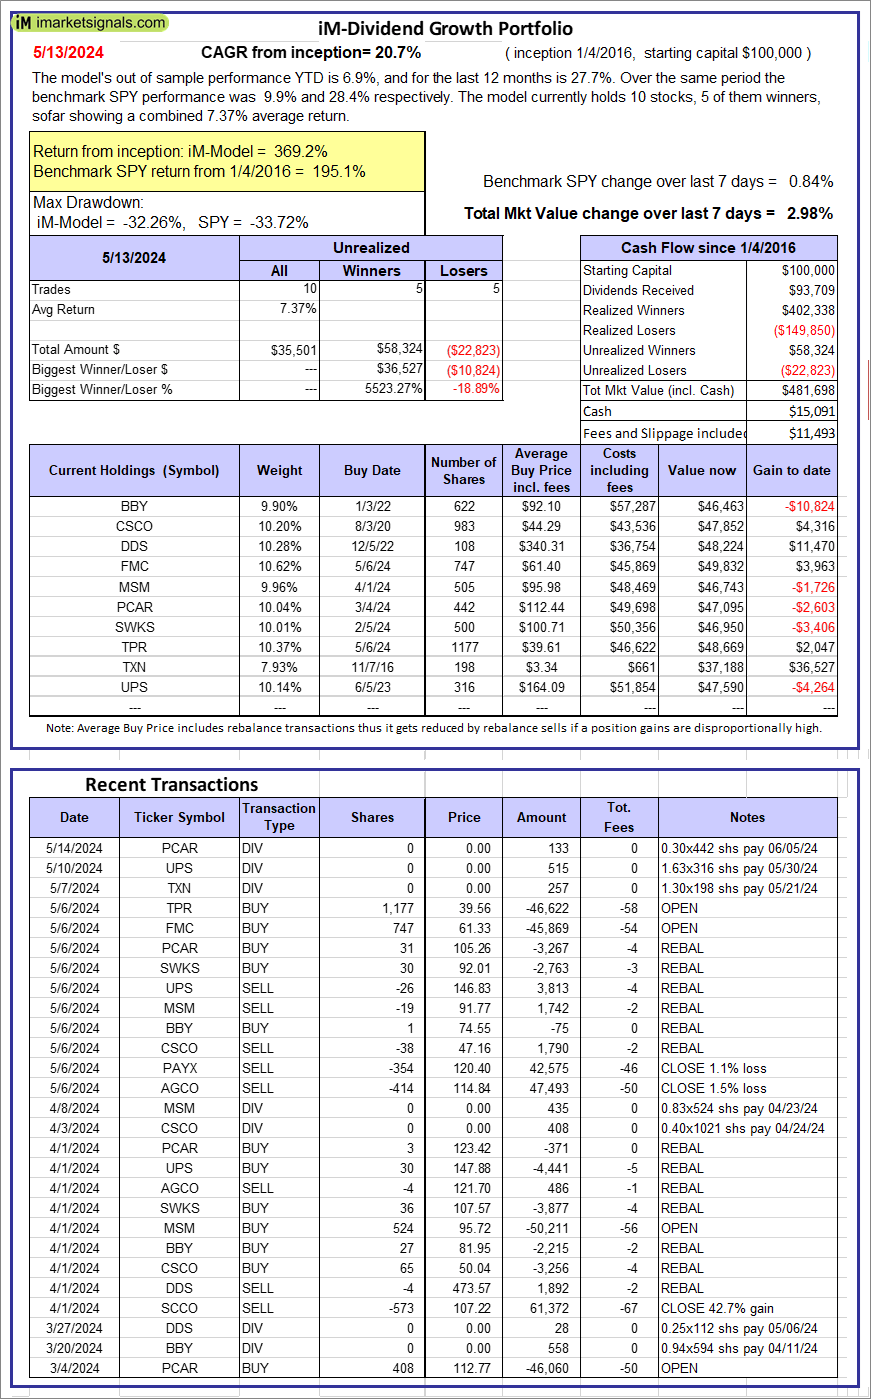 |
iM-Dividend Growth Portfolio: The model’s out of sample performance YTD is 6.9%, and for the last 12 months is 27.7%. Over the same period the benchmark SPY performance was 9.9% and 28.4% respectively. Over the previous week the market value of the iM-Dividend Growth Portfolio gained 2.98% at a time when SPY gained 0.84%. A starting capital of $100,000 at inception on 6/30/2016 would have grown to $481,698 which includes $15,091 cash and excludes $11,493 spent on fees and slippage. |
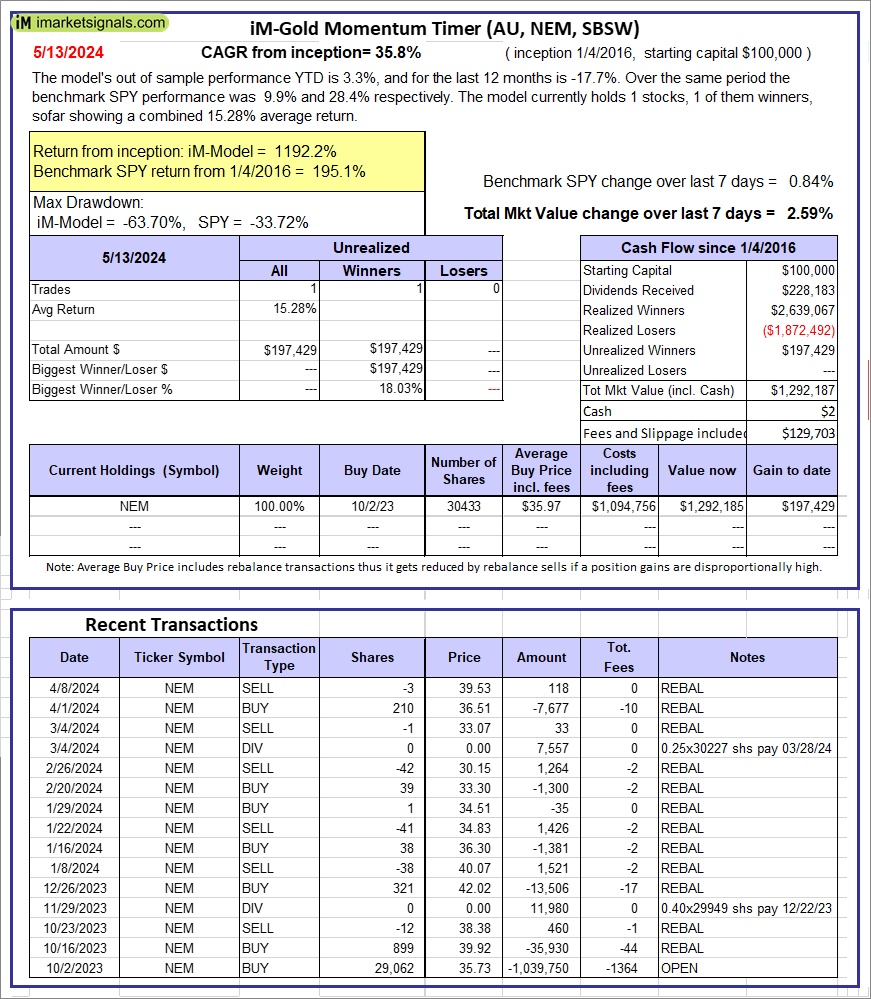 |
iM-Gold Momentum Timer (AU, NEM, SBSW): The model’s out of sample performance YTD is 3.3%, and for the last 12 months is -17.7%. Over the same period the benchmark SPY performance was 9.9% and 28.4% respectively. Over the previous week the market value of iM-Gold Momentum Timer (AU, NEM, SBSW) gained 2.59% at a time when SPY gained 0.84%. A starting capital of $100,000 at inception on 6/30/2016 would have grown to $02 which includes $129,703 cash and excludes Gain to date spent on fees and slippage. |
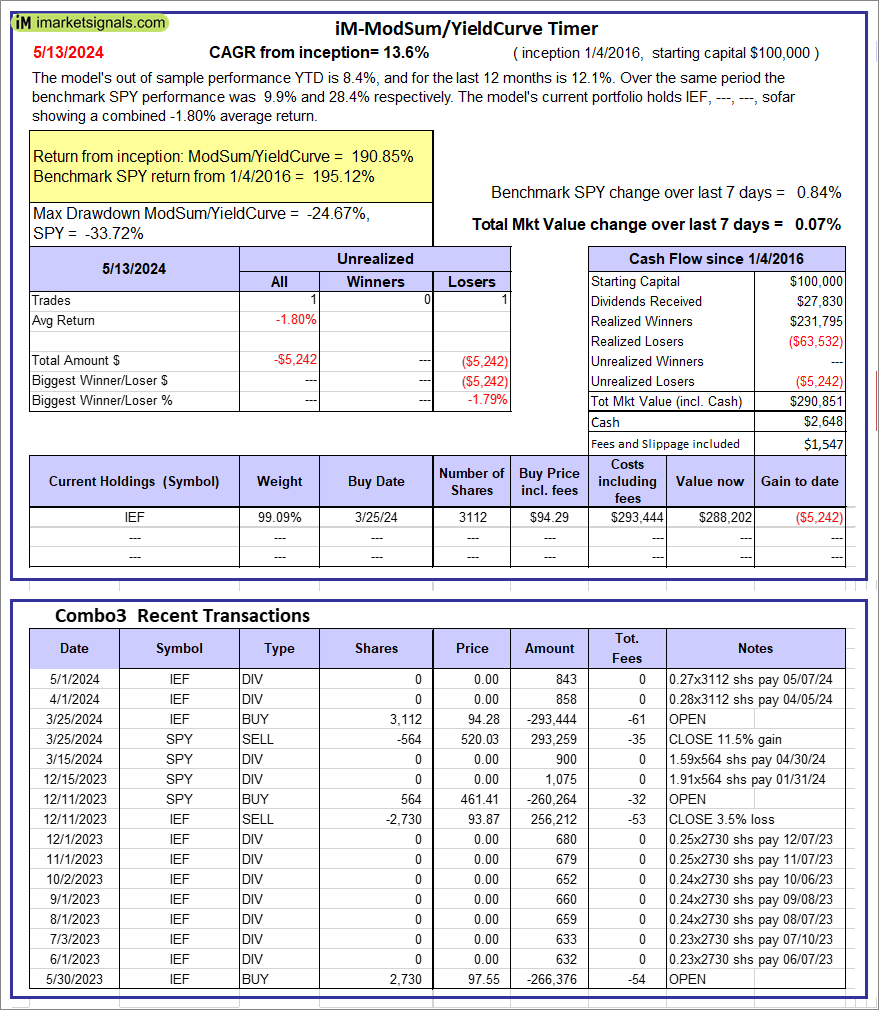 |
iM-ModSum/YieldCurve Timer: The model’s out of sample performance YTD is 8.4%, and for the last 12 months is 12.1%. Over the same period the benchmark SPY performance was 9.9% and 28.4% respectively. Over the previous week the market value of iM-PortSum/YieldCurve Timer gained 0.07% at a time when SPY gained 0.84%. A starting capital of $100,000 at inception on 1/1/2016 would have grown to $290,851 which includes $2,648 cash and excludes $1,547 spent on fees and slippage. |
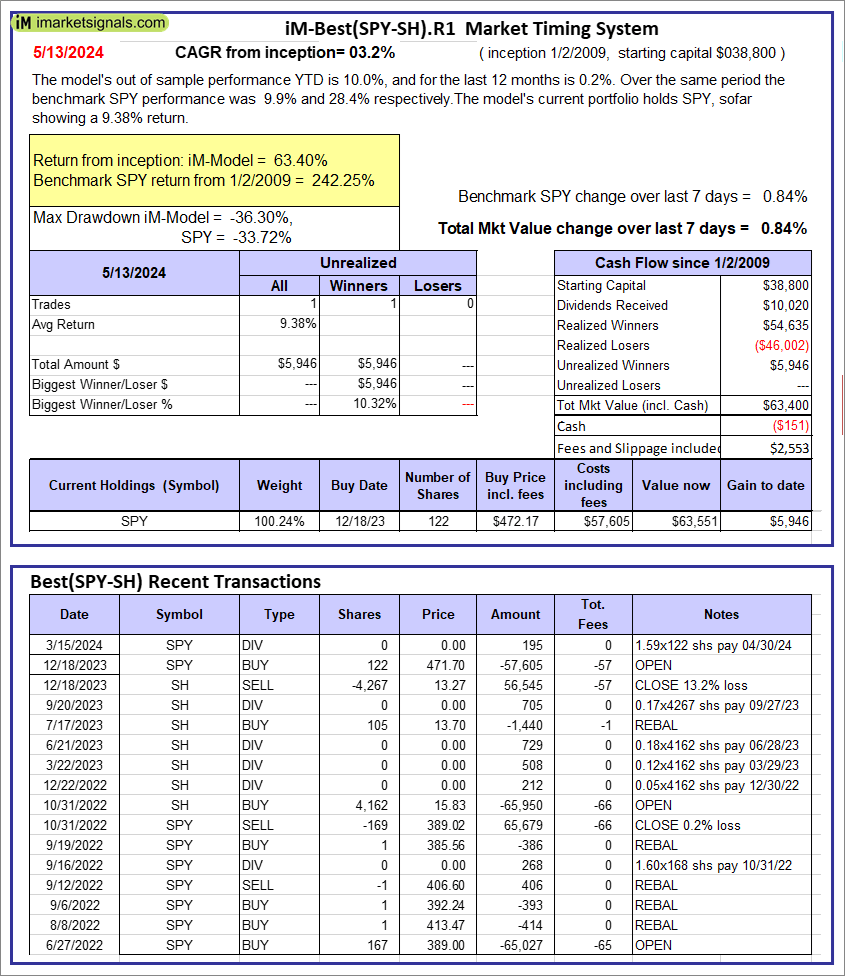 |
iM-Best(SPY-SH).R1: The model’s out of sample performance YTD is 10.0%, and for the last 12 months is 0.2%. Over the same period the benchmark SPY performance was 9.9% and 28.4% respectively. Over the previous week the market value of Best(SPY-SH) gained 0.84% at a time when SPY gained 0.84%. A starting capital of $100,000 at inception on 1/2/2009 would have grown to $63,400 which includes -$151 cash and excludes $2,553 spent on fees and slippage. |
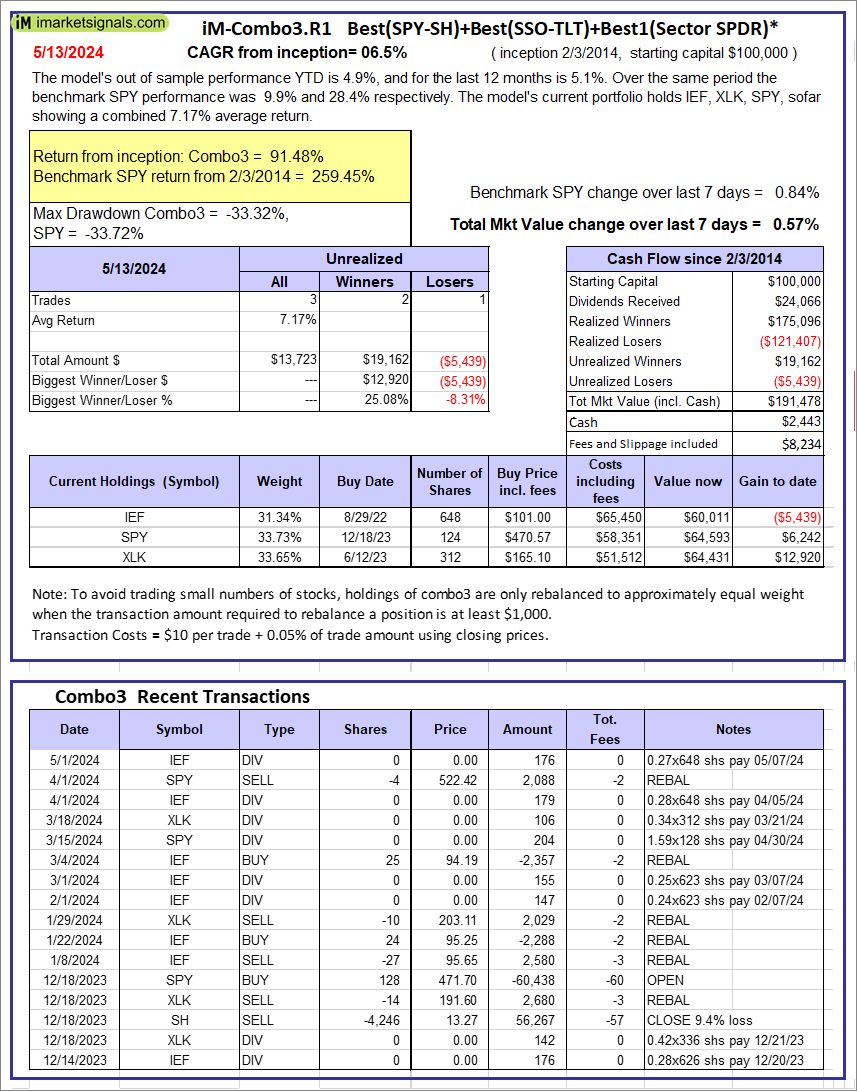 |
iM-Combo3.R1: The model’s out of sample performance YTD is 4.9%, and for the last 12 months is 5.1%. Over the same period the benchmark SPY performance was 9.9% and 28.4% respectively. Over the previous week the market value of iM-Combo3.R1 gained 0.57% at a time when SPY gained 0.84%. A starting capital of $100,000 at inception on 2/3/2014 would have grown to $191,478 which includes $2,443 cash and excludes $8,234 spent on fees and slippage. |
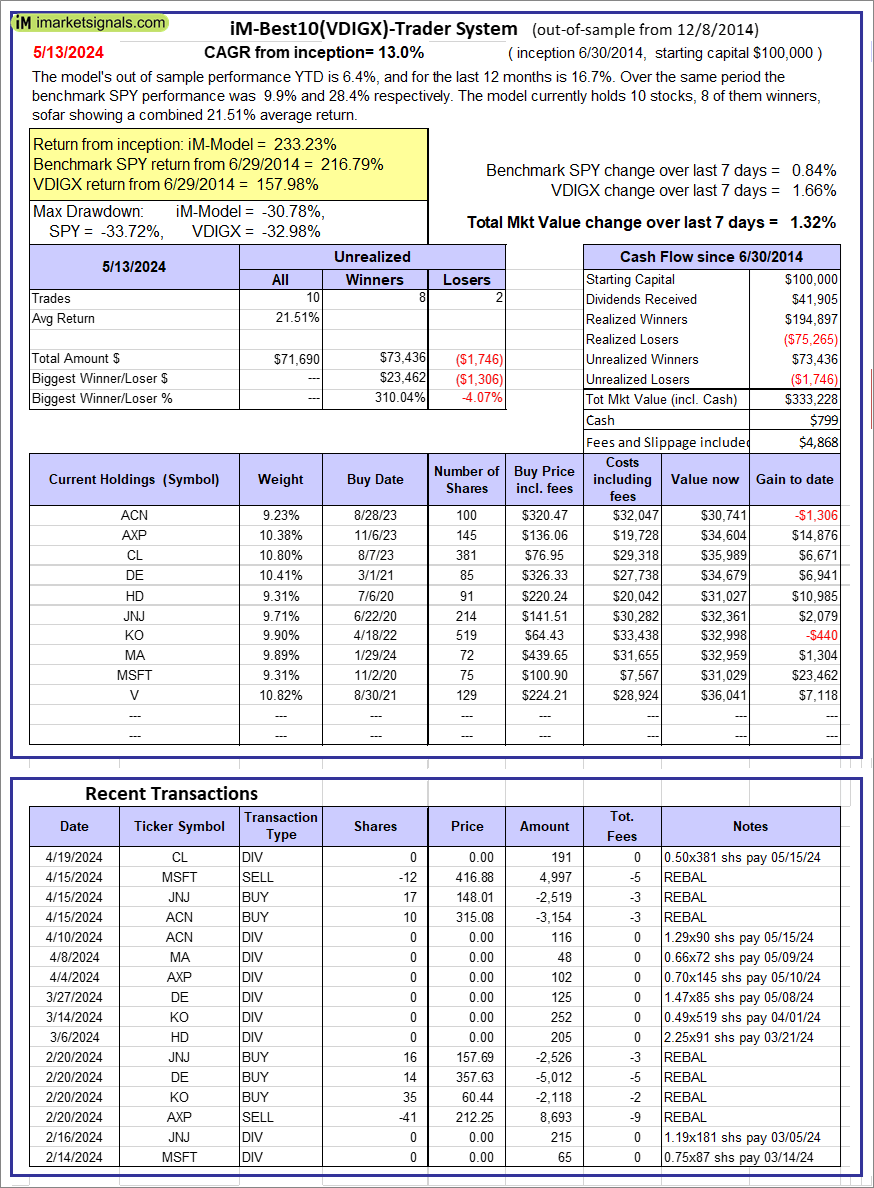 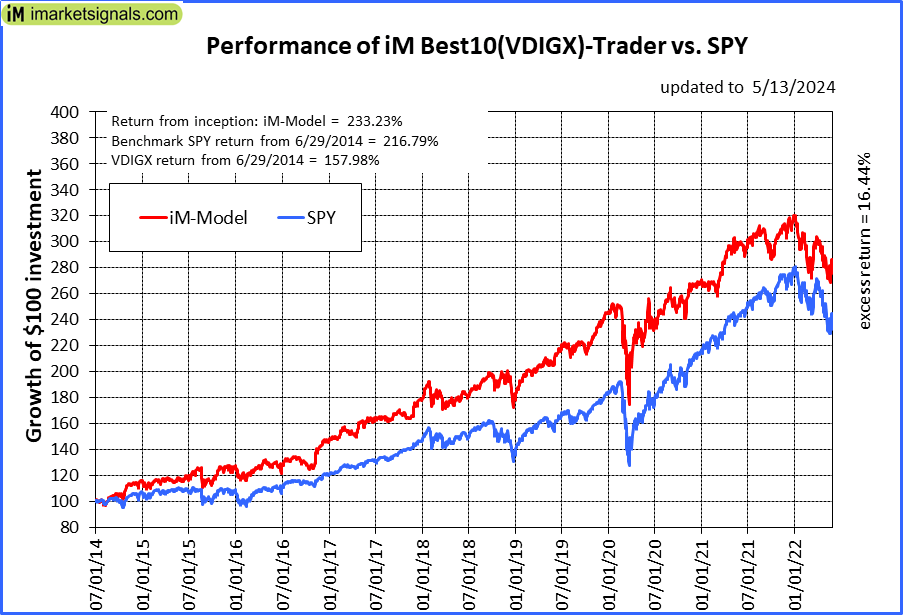 |
iM-Best10(VDIGX)-Trader: The model’s out of sample performance YTD is 6.4%, and for the last 12 months is 16.7%. Over the same period the benchmark SPY performance was 9.9% and 28.4% respectively. Since inception, on 7/1/2014, the model gained 233.23% while the benchmark SPY gained 216.79% and VDIGX gained 157.98% over the same period. Over the previous week the market value of iM-Best10(VDIGX) gained 1.32% at a time when SPY gained 0.84%. A starting capital of $100,000 at inception on 7/1/2014 would have grown to $333,228 which includes $799 cash and excludes $4,868 spent on fees and slippage. |
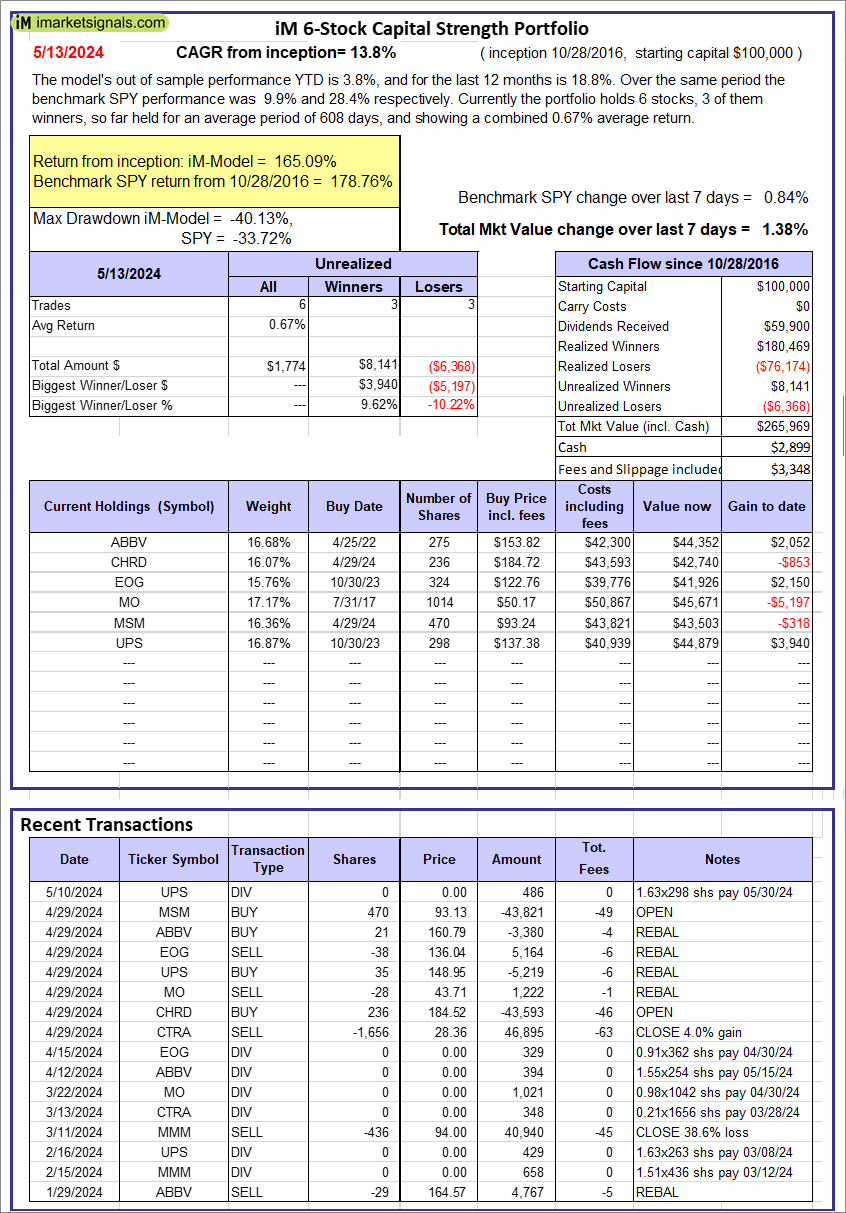 |
iM 6-Stock Capital Strength Portfolio: The model’s out of sample performance YTD is 3.8%, and for the last 12 months is 18.8%. Over the same period the benchmark SPY performance was 9.9% and 28.4% respectively. Over the previous week the market value of the iM 6-Stock Capital Strength Portfolio gained 1.38% at a time when SPY gained 0.84%. A starting capital of $100,000 at inception on 10/28/2016 would have grown to $265,969 which includes $2,899 cash and excludes $3,348 spent on fees and slippage. |
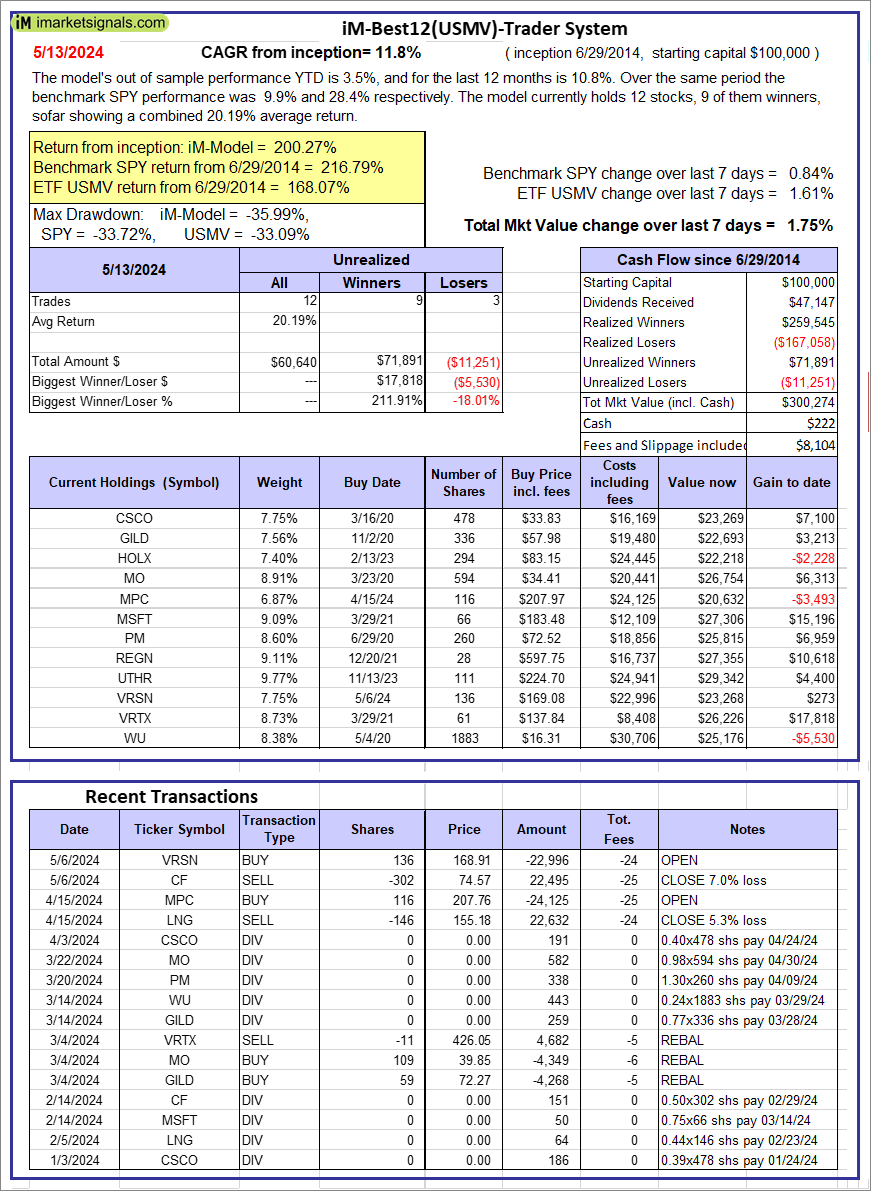 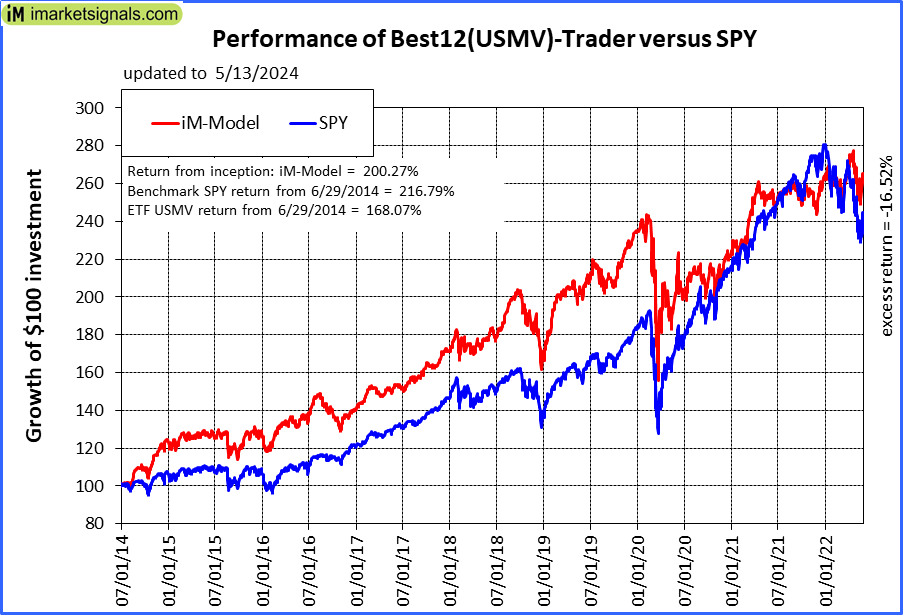 |
iM-Best12(USMV)-Trader: The model’s out of sample performance YTD is 3.5%, and for the last 12 months is 10.8%. Over the same period the benchmark SPY performance was 9.9% and 28.4% respectively. Since inception, on 6/30/2014, the model gained 200.27% while the benchmark SPY gained 216.79% and the ETF USMV gained 168.07% over the same period. Over the previous week the market value of iM-Best12(USMV)-Trader gained 1.75% at a time when SPY gained 0.84%. A starting capital of $100,000 at inception on 6/30/2014 would have grown to $300,274 which includes $222 cash and excludes $8,104 spent on fees and slippage. |
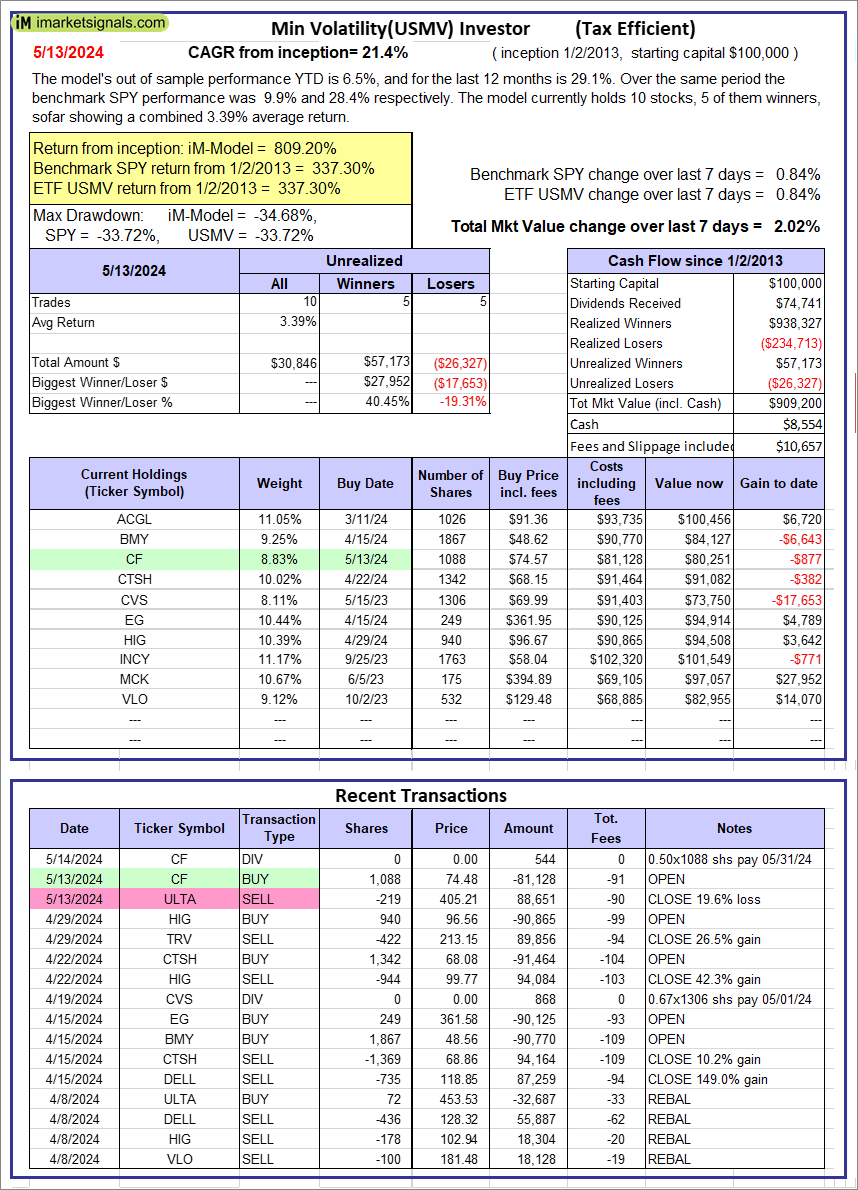 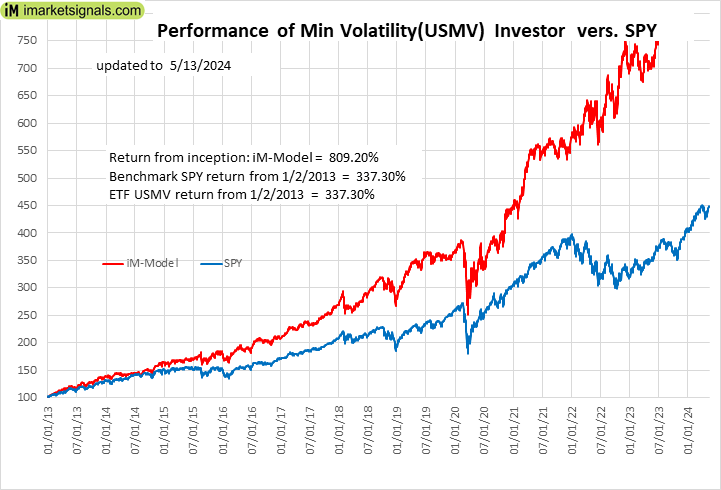 |
iM-Min Volatility(USMV) Investor (Tax Efficient): The model’s out of sample performance YTD is 6.5%, and for the last 12 months is 29.1%. Over the same period the benchmark SPY performance was 9.9% and 28.4% respectively. Since inception, on 1/3/2013, the model gained 809.20% while the benchmark SPY gained 337.30% and the ETF USMV gained 337.30% over the same period. Over the previous week the market value of iM-Best12(USMV)Q1 gained 2.02% at a time when SPY gained 0.84%. A starting capital of $100,000 at inception on 1/3/2013 would have grown to $909,200 which includes $8,554 cash and excludes $10,657 spent on fees and slippage. |
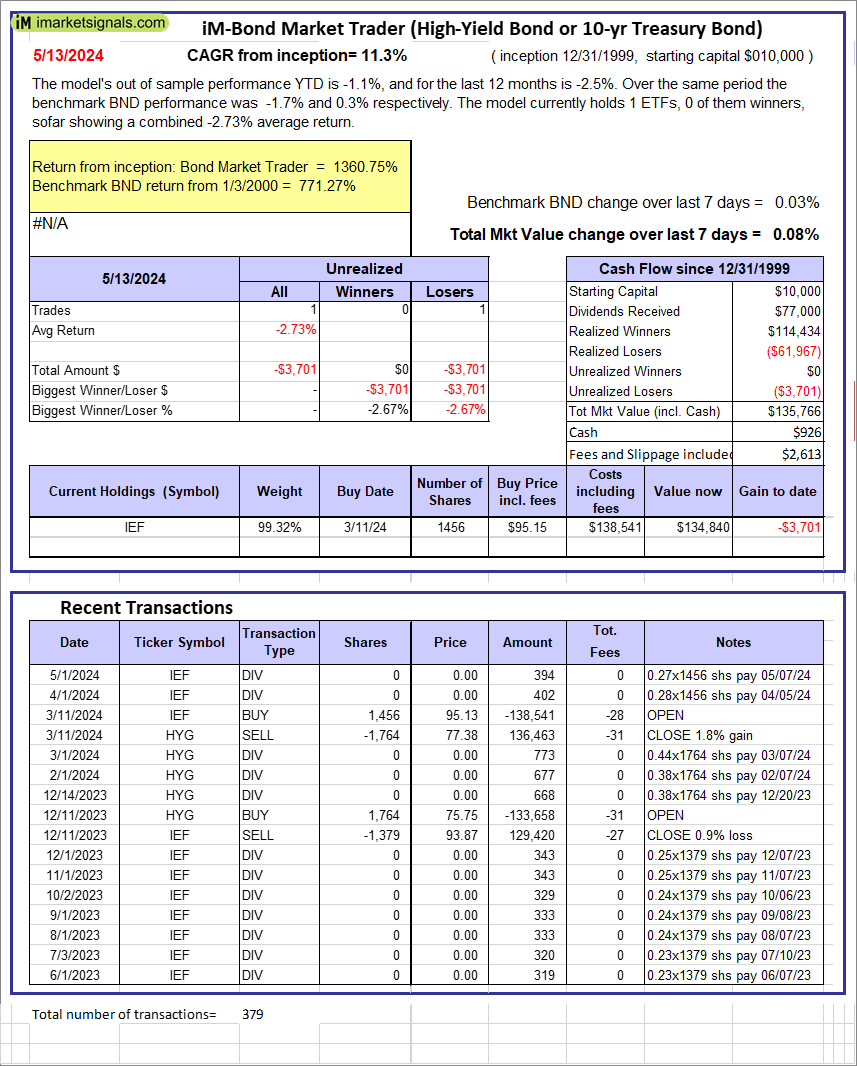 |
iM-Bond Market Trader (High-Yield Bond or 10-yr Treasury Bond): The model’s out of sample performance YTD is -1.1%, and for the last 12 months is -2.5%. Over the same period the benchmark BND performance was -1.7% and 0.3% respectively. Over the previous week the market value of the iM-Bond Market Trader (High-Yield Bond or 10-yr Treasury Bond) gained 0.08% at a time when BND gained 0.03%. A starting capital of $10,000 at inception on 1/3/2000 would have grown to $135,766 which includes $926 cash and excludes $2,613 spent on fees and slippage. |
|
|
iM-ModSum/YieldCurve Timer: The model’s out of sample performance YTD is 8.4%, and for the last 12 months is 12.1%. Over the same period the benchmark SPY performance was 9.9% and 28.4% respectively. Over the previous week the market value of iM-PortSum/YieldCurve Timer gained 0.07% at a time when SPY gained 0.84%. A starting capital of $100,000 at inception on 1/1/2016 would have grown to $290,851 which includes $2,648 cash and excludes $1,547 spent on fees and slippage. |
 |
iM-Best2 MC-Score ETF System: The model’s out of sample performance YTD is 7.4%, and for the last 12 months is 9.4%. Over the same period the benchmark SPY performance was 9.9% and 28.4% respectively. Over the previous week the market value of the iM-Best2 MC-Score ETF System gained 1.06% at a time when SPY gained 0.84%. A starting capital of $100,000 at inception on 6/30/2016 would have grown to $162,151 which includes $481 cash and excludes $4,614 spent on fees and slippage. |
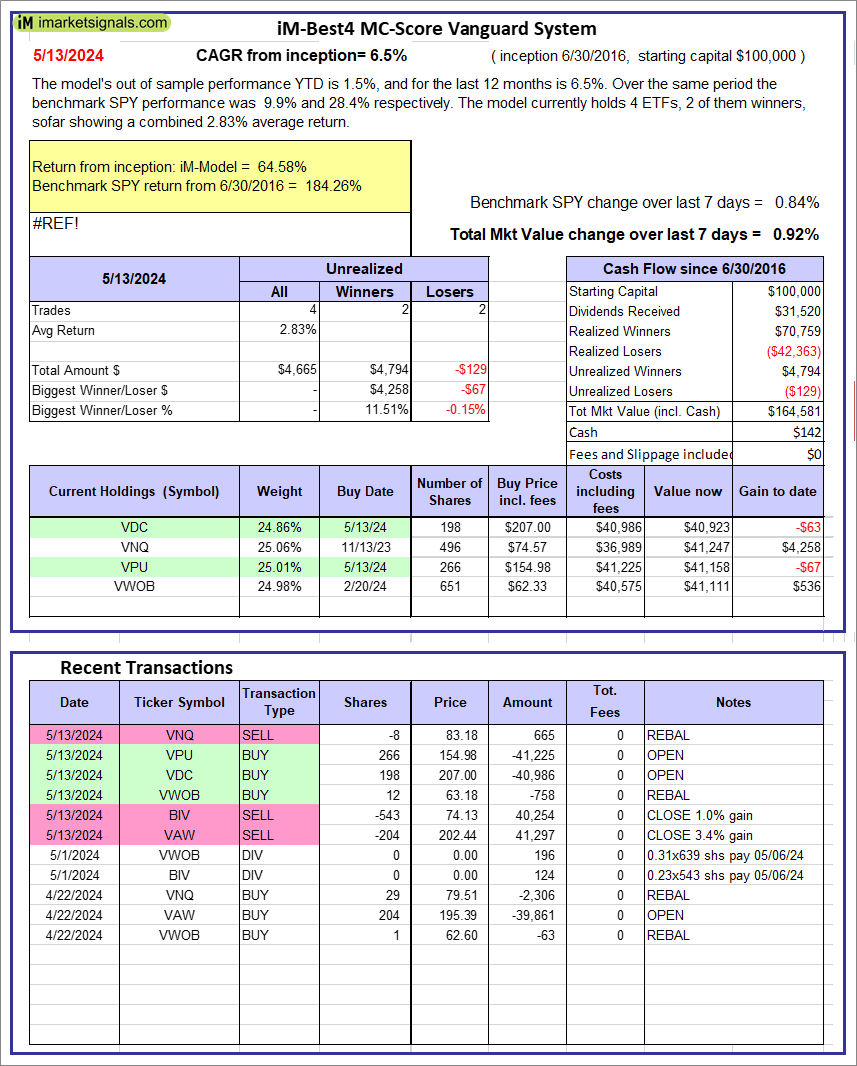 |
iM-Best4 MC-Score Vanguard System: The model’s out of sample performance YTD is 1.5%, and for the last 12 months is 6.5%. Over the same period the benchmark SPY performance was 9.9% and 28.4% respectively. Over the previous week the market value of the iM-Best4 MC-Score Vanguard System gained 0.92% at a time when SPY gained 0.84%. A starting capital of $100,000 at inception on 6/30/2016 would have grown to $164,581 which includes $142 cash and excludes $00 spent on fees and slippage. |
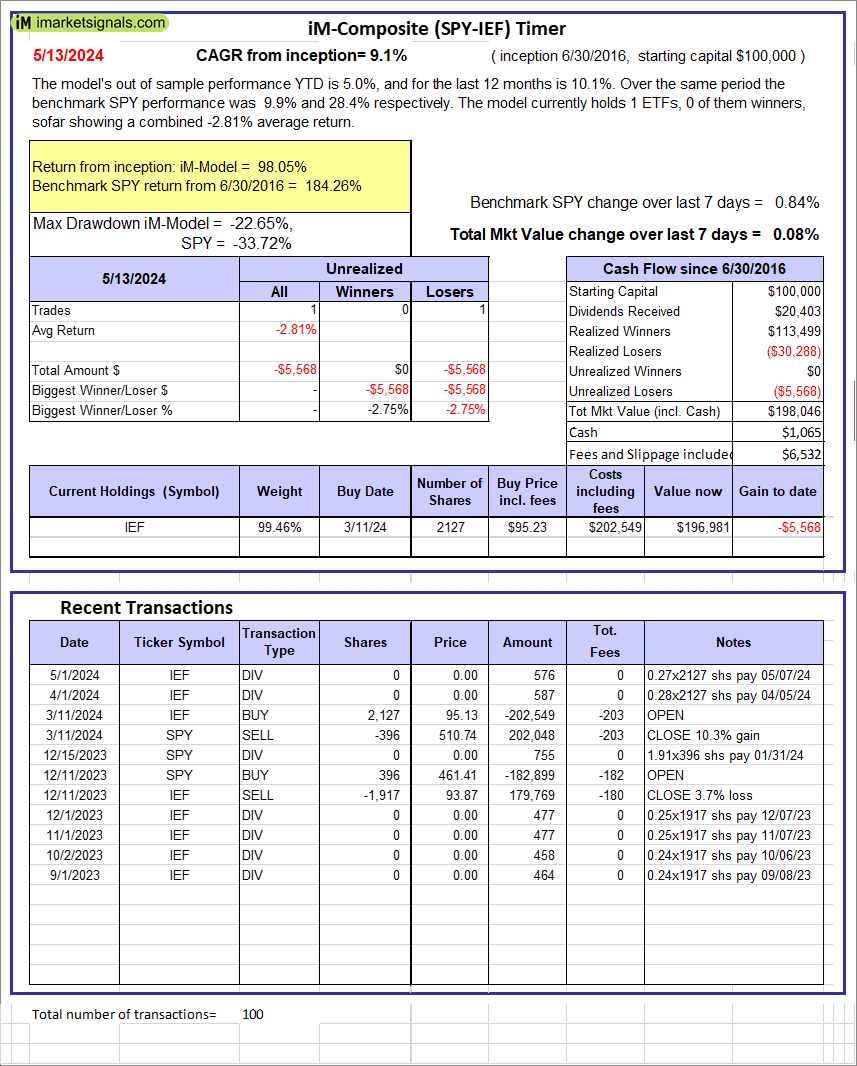 |
iM-Composite (SPY-IEF) Timer: The model’s out of sample performance YTD is 5.0%, and for the last 12 months is 10.1%. Over the same period the benchmark SPY performance was 9.9% and 28.4% respectively. Over the previous week the market value of the iM-Composite (SPY-IEF) Timer gained 0.08% at a time when SPY gained 0.84%. A starting capital of $100,000 at inception on 6/30/2016 would have grown to $198,046 which includes $1,065 cash and excludes $6,532 spent on fees and slippage. |
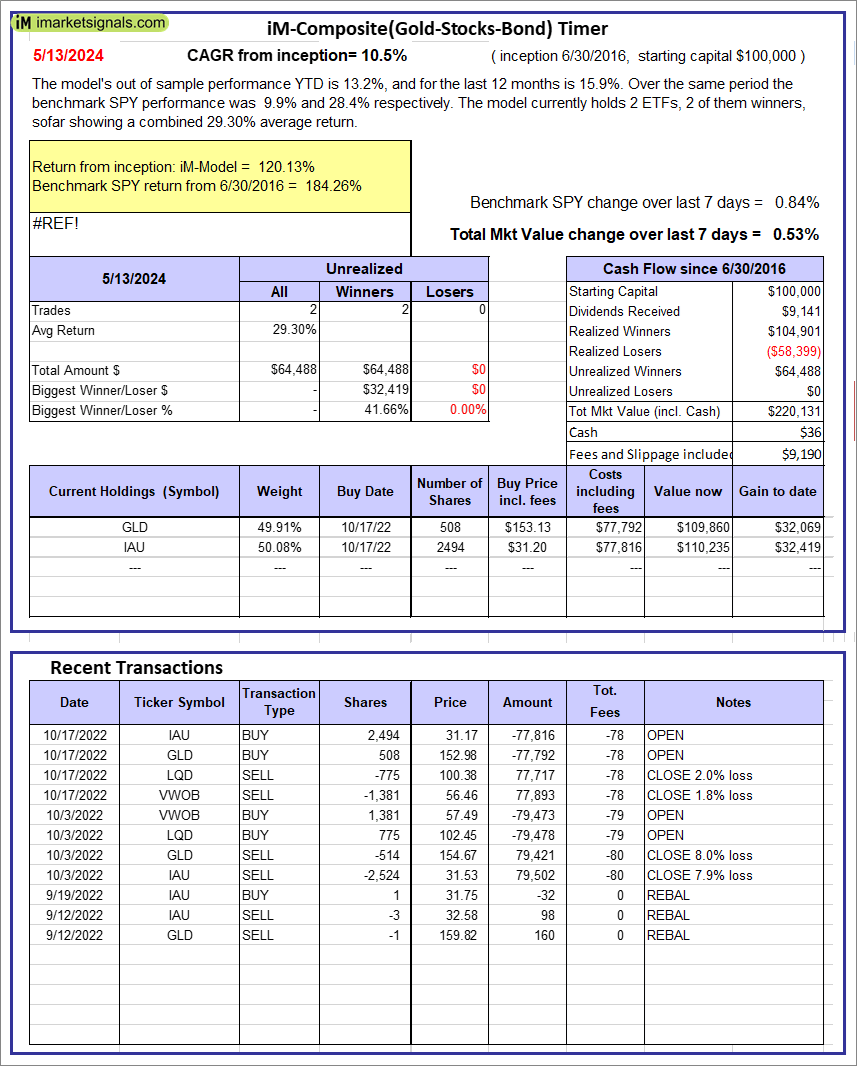 |
iM-Composite(Gold-Stocks-Bond) Timer: The model’s out of sample performance YTD is 13.2%, and for the last 12 months is 15.9%. Over the same period the benchmark SPY performance was 9.9% and 28.4% respectively. Over the previous week the market value of the iM-Composite(Gold-Stocks-Bond) Timer gained 0.53% at a time when SPY gained 0.84%. A starting capital of $100,000 at inception on 6/30/2016 would have grown to $220,131 which includes $36 cash and excludes $9,190 spent on fees and slippage. |
iM-Best Reports – 5/13/2024
Posted in pmp SPY-SH
Leave a Reply
You must be logged in to post a comment.